Abstract
Assessing musculoskeletal disorders (MSDs) in the workplace is vital for improving worker health and safety, reducing costs, and increasing productivity. Traditional hazard identification methods are often inefficient, particularly in detecting complex risks, which may compromise risk management. This study introduces a semi-automatic platform using two motion capture systems—an optical system (OptiTrack®) and a Bluetooth Low Energy (BLE)-based system with inertial measurement units (IMUs), developed at the Biomedical Engineering Laboratory, Universidad de Concepción, Chile. These systems, tested on 20 participants (10 women and 10 men, aged 30 ± 9 years without MSDs), facilitate risk assessments via the digitized NIOSH Index method. Analysis of ergonomically significant variables (H, V, A, D) and calculation of the RWL and LI showed both systems aligned with expected ergonomic standards, although significant differences were observed in vertical displacement (V), horizontal displacement (H), and trunk rotation (A), indicating areas for improvement, especially for the BLE system. The BLE Inertial MoCap system recorded mean heights of 33.87 cm (SD = 4.46) and vertical displacements of 13.17 cm (SD = 4.75), while OptiTrack® recorded mean heights of 30.12 cm (SD = 2.91) and vertical displacements of 15.67 cm (SD = 2.63). Despite the greater variability observed in BLE system measurements, both systems accurately captured vertical vertical absolute displacement (D), with means of 32.05 cm (SD = 7.36) for BLE and 31.80 cm (SD = 3.25) for OptiTrack®. Performance analysis showed high precision for both systems, with BLE and OptiTrack® achieving precision rates of 98.5%. Sensitivity, however, was lower for BLE (97.5%) compared to OptiTrack® (98.7%). The BLE system’s F1 score was 97.9%, while OptiTrack® scored 98.6%, indicating both systems can reliably assess ergonomic risk. These findings demonstrate the potential of using BLE-based IMUs for workplace ergonomics, though further improvements in measurement accuracy are needed. The user-friendly BLE-based system and semi-automatic platform significantly enhance risk assessment efficiency across various workplace environments.
1. Introduction
One of the most significant challenges for ergonomics is ensuring a safe and comfortable working environment that allows workers to perform tasks efficiently and without risk to their health [1,2,3,4]. Work-related musculoskeletal disorders (MSDs) primarily affect the back, neck, shoulders, and both upper and lower limbs, encompassing any damage or disorder of the joints or other tissues [5]. Studies have demonstrated a correlation between the occurrence of musculoskeletal disorders and occupational risk factors such as lifting movements, vibrations, and poor posture [6]. According to the European Agency for Safety and Health at Work, 43% to 46% of musculoskeletal disorders are back-related [4].
To assess the risk of developing musculoskeletal disorders at workstations, time and motion studies should be conducted to identify repetitive movements and tasks, and assess their impact on worker’s health and well-being [7]. Tools such as motion analysis and direct observation can be used to collect data and take measures to improve workstation ergonomics.
The National Institute for Occupational Safety and Health (NIOSH) Lifting Equation [8] is a widely acknowledged tool for evaluating the risk of low back pain from lifting activities using the NIOSH Lifting Index (LI) (Equation (1)) and Recommended Weight Limit (RWL):
where L is the mass of the load in kg.
Despite its widespread adoption, measurements from positions such as the midpoint of the ankles and the midpoint between the central knuckles using tools like measuring tape, goniometers, and video analysis could be challenging [3] and time-consuming in real environments, introducing a degree of uncertainty in the results [9].
Recent advancements in technology have prompted a shift towards more precise and efficient methods of ergonomic assessment. Specifically, the integration of wearable inertial sensors and machine learning algorithms has opened up new possibilities for real-time and objective risk classification [10]. Moreover, the inclusion of kinematic data such as trunk speed and acceleration has been shown to potentially enhance the predictive power of the NIOSH Lifting Equation for low back pain risk [11].
The present study aims to compare two advanced motion capture systems: an optical system and a custom Bluetooth Low Energy (BLE)-based inertial system, for their efficacy in manual material handling risk assessment using the NIOSH Lifting Index. While optical systems have been the gold standard due to their high precision, they are often costly and not easily adaptable to various work environments [12]. In contrast, inertial systems offer portability, ease of use, and the potential for real-time data collection [13], presenting a cost-effective alternative for ergonomic risk assessment [14,15,16].
By leveraging the inertial measurement capabilities and evaluating them against established optical systems, this study seeks to contribute to the field of occupational health and safety by enhancing traditional methodologies and providing a more objective and efficient risk assessment process. This could facilitate earlier identification of ergonomic risk factors and help in implementing preventive measures to mitigate the incidence of MSDs in the workplace [17].
2. Materials and Methods
2.1. Design and Setup
The proposed method involves developing and testing a semi-automatic platform capable of capturing and estimating factors according to the NIOSH method, using the Unity development environment (version 2020.3). 20 subjects (10 males and 10 females) aged 30 ± 9 years without musculoskeletal disorders from the city of Concepción, Chile were recruited. These subjects performed two activities related to lifting and lowering loads in a controlled laboratory environment. The activities were simultaneously recorded using both the OptiTrack® motion capture systems (NaturalPoint, Corvallis, OR, USA) and BLE-based inertial sensors developed at the Biomedical Engineering Laboratory of the Universidad de Concepción.
2.2. Computerized Risk Assessment Tool
Digitization of the NIOSH Method
Chilean labor regulations specify a set of methods for assessing risks related to manual handling of loads [18]. When tasks involve activities of lifting and lowering loads, and a risk is identified in these activities using prior evaluation scales such as the Manual Handling Assessment Charts (MAC) and the Variable Manual Handling Assessment Chart (V-MAC) to evaluate the risk more thoroughly, the Lifting Index (LI) is used to assign the risk level. The NIOSH method considers seven factors (see Equation (2)):
where:
- Horizontal Distance Factor (FH) (Equation (3)):where H is the maximum horizontal distance measured from the hands to the midpoint of the line that joins the ankles. This term is measured at the start (when the load is picked up) and finish (when the load is last set down before releasing it) of the lift as horizontal distance in centimeters.
- Vertical Distance Factor (FV) (Equation (4)):where V is the vertical distance from the hands to the floor. This term is measured at the start (when the load is picked up) and finish (when the load is last set down before releasing it) of the lift in centimeters.
- Displacement Factor (FD) (Equation (5)):where D is the absolute value of the difference between the finish (when the load is last set down before releasing it) and start (when the load is picked up) heights of the lift in centimeters.
- Coupling Factor (FC): Classification of the quality of the hand-object interaction (e.g., sharp edge or handle-grip). The quality of the coupling is classified as good, regular, or poor (see Table 1).
 Table 1. Coupling factor values [18].
 - Asymmetry Factor (FA) (Equation (6)):where A is the angle of the object’s displacement relative to the front of the worker’s body (sagital plane) at the beginning of the lift. The angle is measured in degrees, at the start (when the load is picked up) and finish (when the load is last set down before releasing it) of the lift.
- Frequency Factor (FM): This represents the average number of lifts per minute, measured over at least a 15-min period. It is obtained using Table 2.
Table 2. Frequency factor values by activity duration and vertical distance extracted from [18].
- Load Constant (CC): This represents the maximum mass that can be safely lifted under ideal conditions and is determined based on the gender and age of the workers. If there are employees of both genders and various ages, the value that corresponds to the group with the lower lifting capacity is selected (see Table 3).
Table 3. Load constant values by gender and age [18].
Also, this method assigns a risk index to the activity based on the calculation of the LI, as shown in Table 4.
Table 4.
Risk classification on the basis of the LI (lifting index) extracted from [18].
To illustrate, consider a 35-year-old male factory worker ( kg) who regularly takes 9.5 kg () boxes twice per minute from the ground (, , and ) to a dating and sealing machine at 78 cm from the floor, without trunk rotation ( and ) over a 7-h shift (). The boxes lack handles (Poor Coupling and ), and the distance between the hands and the vertical line passing through the ankles is approximately 46 cm ( and ). Utilizing the formula presented in Equations (1) and (2), the calculation of the and , respectively. This indicates the worker is lifting loads beyond the recommended weight limit at the start, implying a risk of musculoskeletal injury (see Table 4).
The application of the NIOSH method can be affected by the assessor’s experience and the precision of instruments used to obtain the H, V, A, and D measurements. This variability may compromise the consistency of risk assessments. Furthermore, the traditional evaluation process, being time-consuming and reliant on manual calculations, is prone to errors. In response, a semi-automated software platform was developed to implement the NIOSH method, enabling the determination of , , and risk level. The platform workflow methodology supports the input of data from a custom Bluetooth Low Energy-Based Inertial Motion Capture System, and from Biovision Hierarchy (BVH) motion files, typically generated by MoCap systems (see Figure 1).
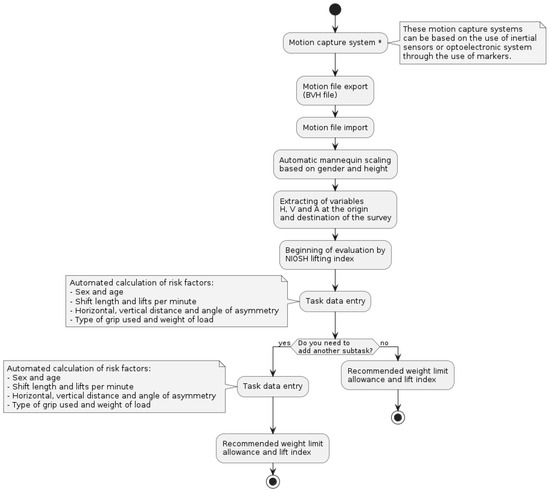
Figure 1.
Flowchart for risk assessment using the proposed platform [Own elaboration].
The interface is divided into two parts: real-time feature extraction section and the risk evaluation section.
Real-time feature extraction section: Unity® (Unity Technologies, San Francisco, CA, USA) version v2020.3 was used to develop the motion analysis platform. This platform features a computerized mannequin composed of 61 segments [19,20], which conforms to the anthropometric dimensions of the Chilean working population as outlined by Castellucci et al. [21]. The scaling of the mannequin’s segments is tailored based on the height and gender of the subject being evaluated, following the guidelines proposed by Pheasant and Haslegrave [22]. This virtual model is capable of simulating various postures from a BVH file or the data from the custom BLE-based Mocap system, which can be imported and manipulated according to user specifications. The variables H, V, A, and D are determined through the projection of predefined anatomical points within the platform [23]. Figure 2 illustrates the aforementioned motion analysis platform.
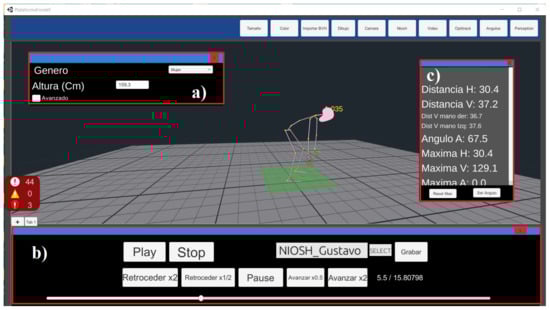
Figure 2.
The motion analysis platform utilizing BVH files, enabling (a) adjustment of body segment lengths according to gender and height, (b) BVH file importation for temporal analysis, and (c) extraction of H, V, and A values at any given moment.
Risk evaluation section: This section is divided into three parts (see Figure 3). The first one collects general information such as company name, date, tasks performed, and language preference, with options for analyzing either single or multitask activities. The second one is designated for entering lifting variables like load mass, lifting height, frequency, and reach, from either the task’s start or finish. Based on these inputs, the third and final part automatically computes each factor’s values (), the , and the , thereby facilitating rapid risk classification and enhancing the safety and health evaluation process in workplace settings.
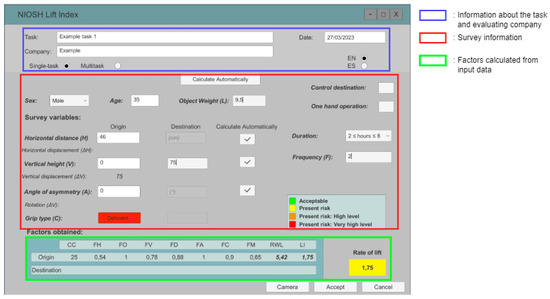
Figure 3.
Digitized NIOSH platform (data entered in example).
2.3. Motion Capture Systems
2.3.1. Optoelectronic Mocap System
Optoelectronic systems are recognized as the gold standard in human motion capture and serve as the benchmark for validating other motion capture technologies [24,25,26]. These systems record and track reflective markers in real-time, achieving frequencies up to 2000 Hz. Despite their precision, their use has predominantly been confined to laboratory settings. This limitation stems from spatial requirements, the necessity for precise camera positioning, and specific angle demands, which collectively hinder their application in real-world work environments. A major obstacle is marker occlusion, where a marker’s position cannot be reconstructed because it is hidden by the shelf, body, or load in too many camera views [27,28,29].
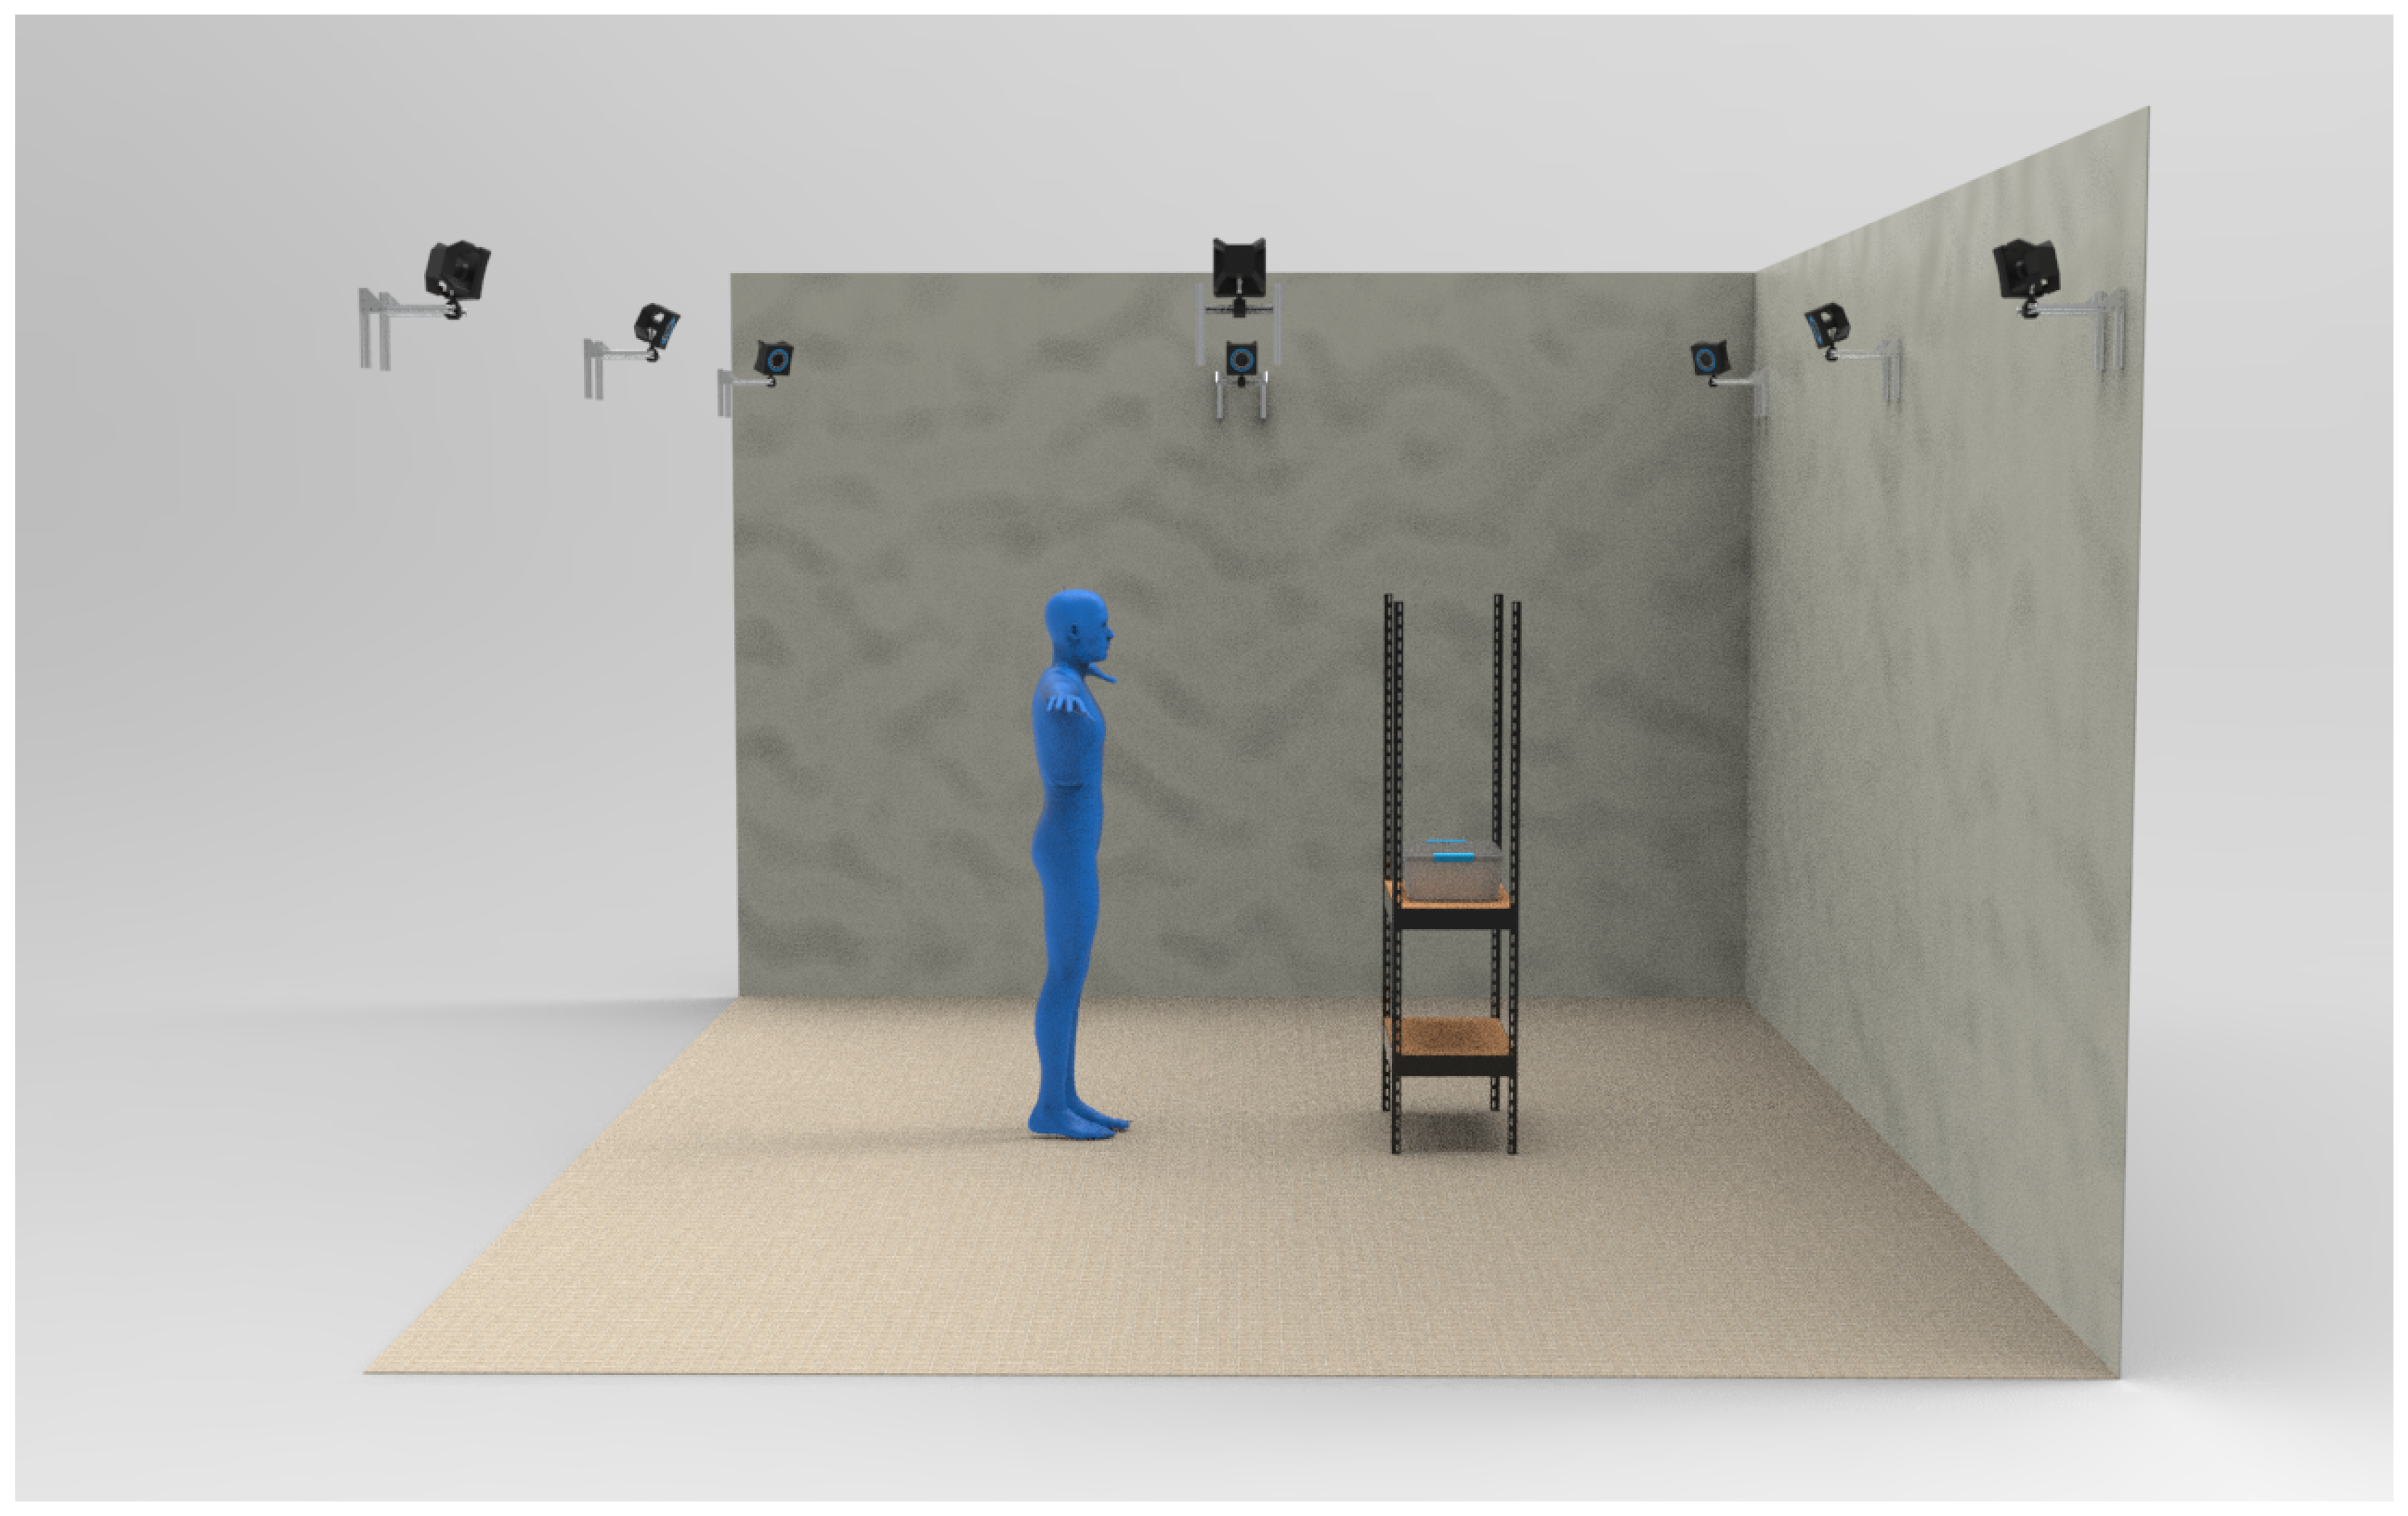
The OptiTrack® motion analysis laboratory used in this study was conformed of eight Prime x22 cameras (NaturalPoint, Corvallis, OR, USA) and passive markers of 14 mm diameter located on the body using the Plug-in Gait guidelines. The cameras boast a resolution of 2.2 MP and frame rate of 240 frames per second. The Mocap system is located at the Ergonomics Building, Faculty of Biological Sciences of the Universidad de Concepción. The optoelectronic MoCap system setup is shown in Figure 4.

Figure 4.
The motion analysis laboratory setup featuring an optoelectronic system alongside evaluation elements. The calibration volume dimensions were 5 m in length, 3 m in width, and 2 m in height.
2.3.2. BLE-Based Inertial Mocap System
IMU-based systems are frequently used in human motion studies [30]. IMUs comprises an accelerometer, a gyroscope, and a magnetometer. They can be worn directly on the body and do not suffer from occlusion, making them suitable for field studies in real working environments. They are also less expensive and more time-efficient to set up compared to optical motion capture systems, and hence, making them more versatile and quicker to deploy [31,32,33].
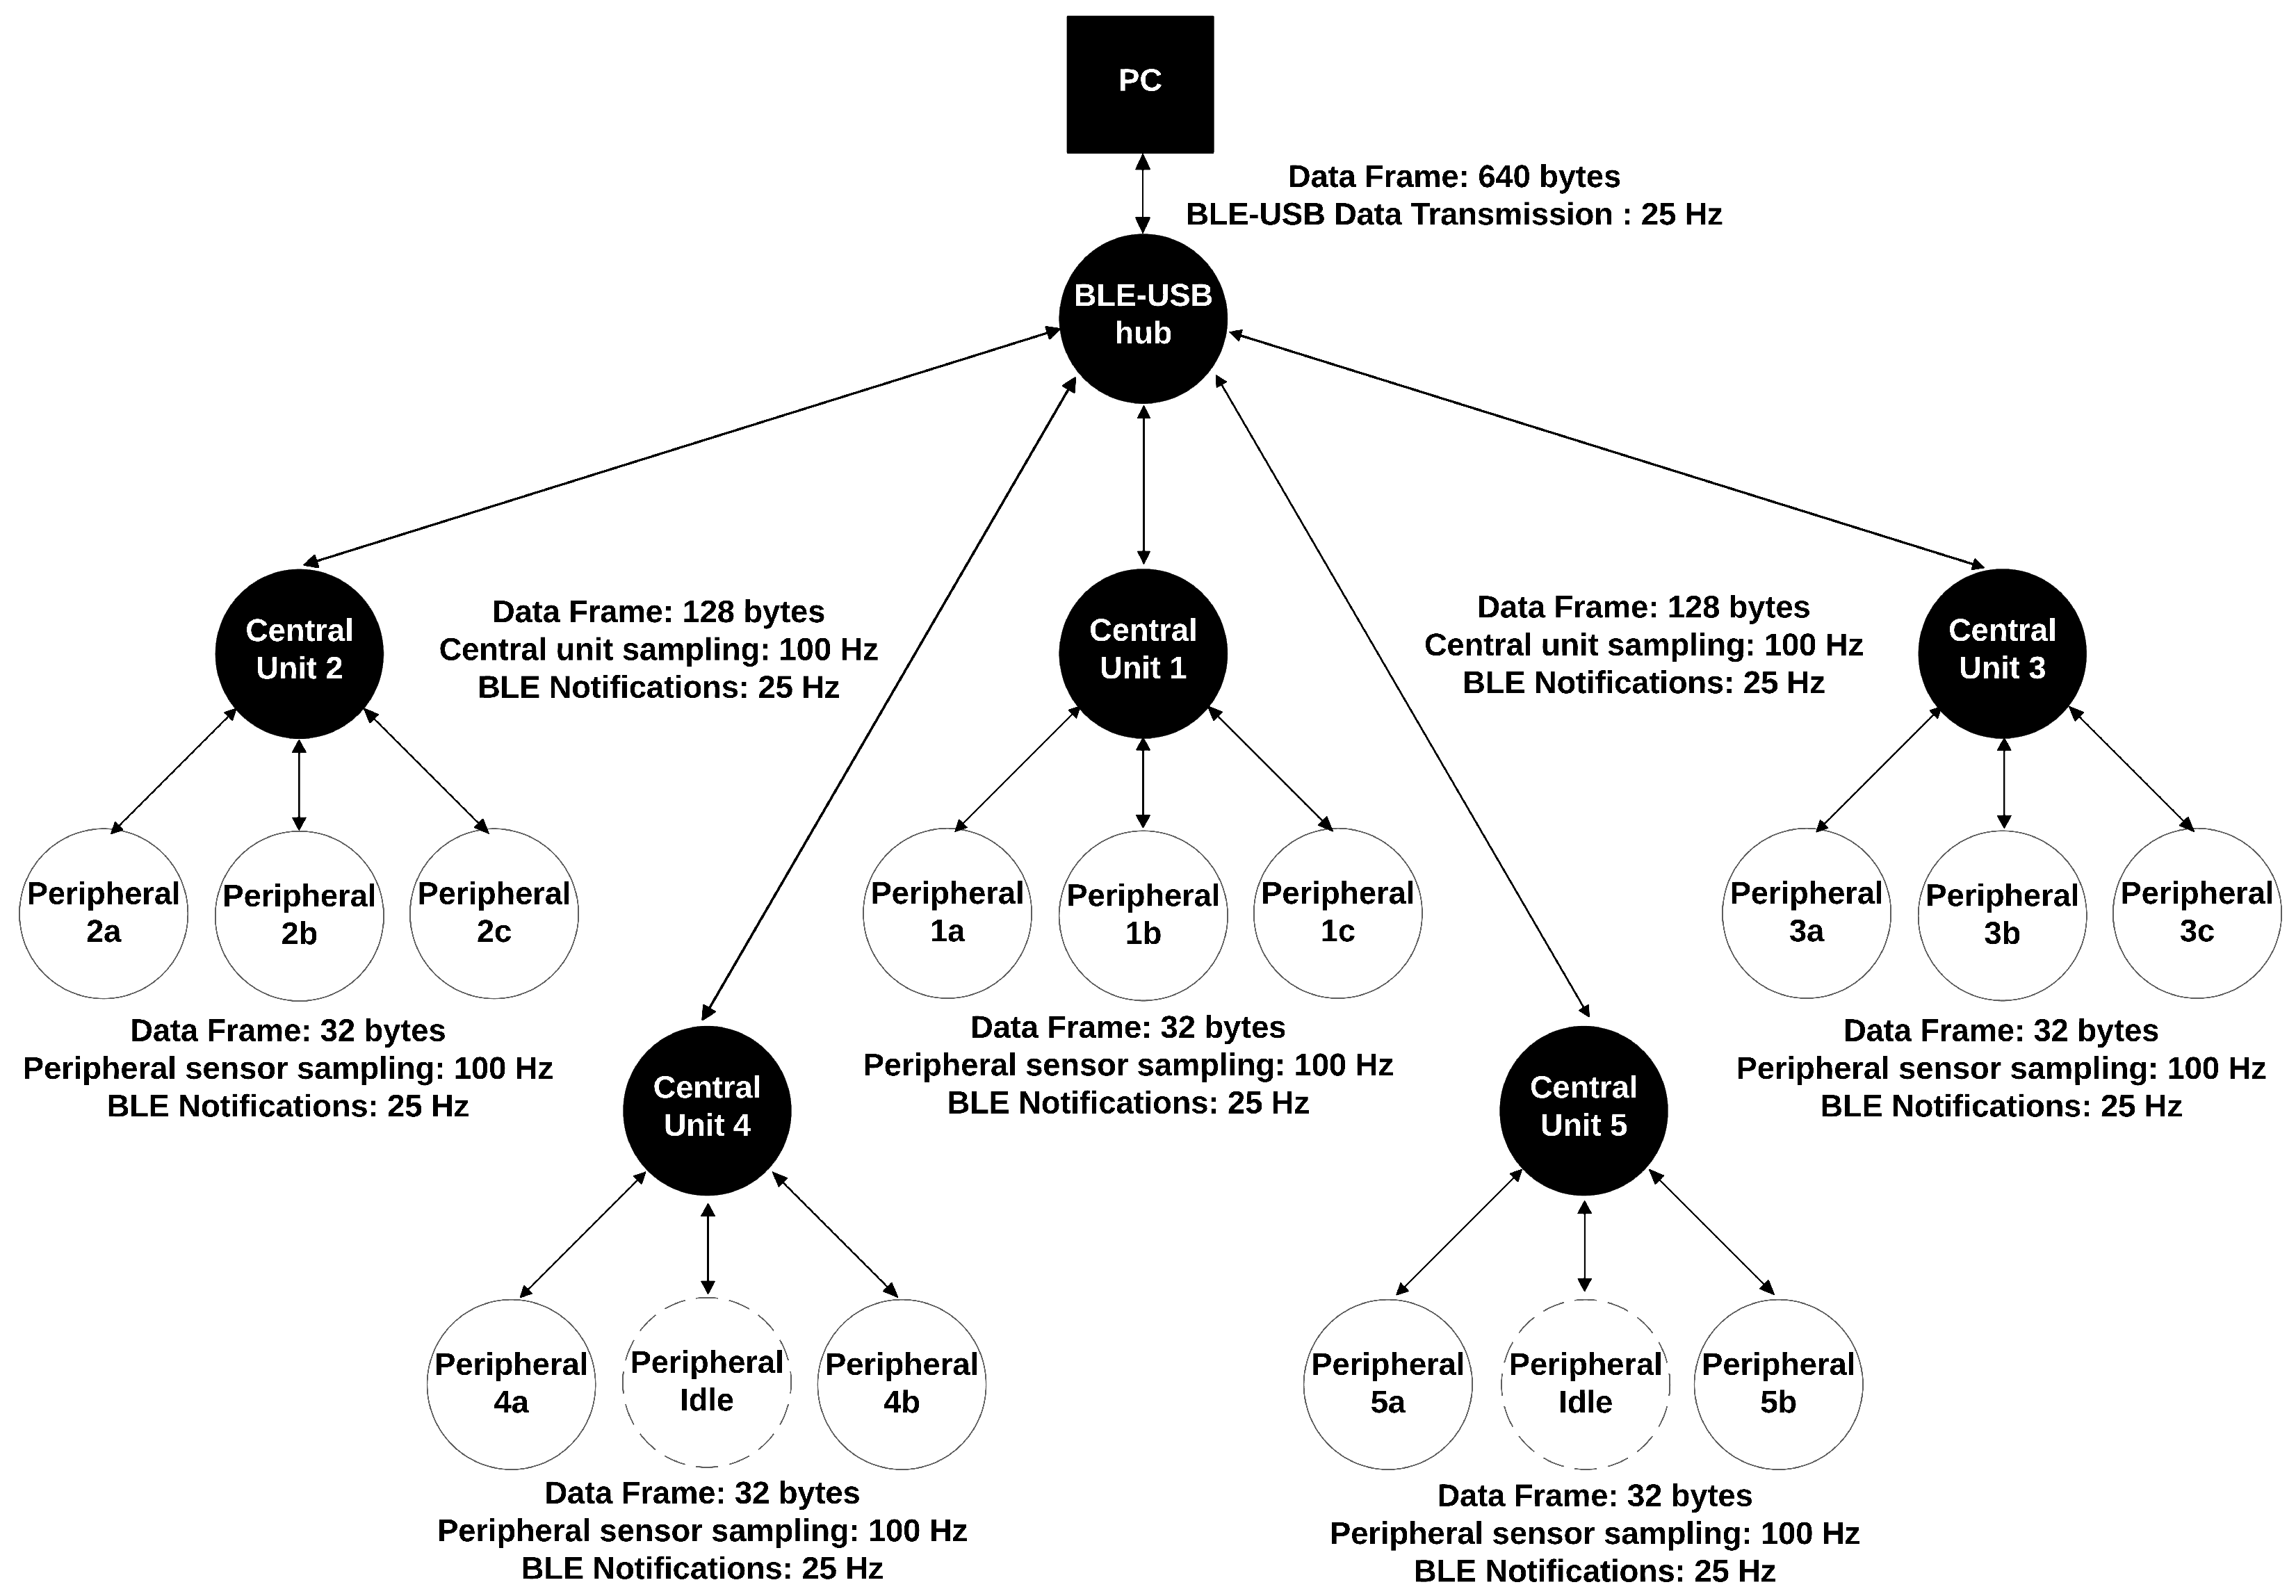
The inertial MoCap system used in this study was developed in the Biomedical Engineering Laboratory at the Universidad de Concepción, and comprises 18 measurement units. Its primary feature is the utilization of Bluetooth 5.0 for wireless communication to a central acquisition computer running a specialized program for ergonomic risk assessment. The organization of the sensor connections and communication is based on a “tree topology” network, where 5 of the 18 sensors function as central units and the remaining ones as peripheral units (see Figure 5).

Figure 5.
Bluetooth 5.0 tree topology implemented for the wireless communication of the custom inertial motion capture system, where: Central Units 1 to 5 represent the head, right shoulder, left shoulder, right thigh, and left thigh sensors, respectively. Peripheral 1a to 1c represent thoracic, lumbar, and sacral spine sensors. Peripheral 2a to 2c and 3a to 3c represent arm, forearm, and hand sensors for the right and left sides, respectively. Peripheral 4a to 4b and 5a to 5b represent leg and foot sensors for the right and left sides, respectively. The Peripheral Idle represents a virtual device that contains dummy data to maintain the frame format for each central node.
The sensor organization is as follows:
- Head sensor (Central Unit 1) connects with three peripherals (thoracic spine, lumbar spine, and sacral spine).
- The right shoulder sensor (Central Unit 2) connects with three peripherals (right arm, right forearm, and right hand).
- The left shoulder sensor (Central Unit 3) connects with three peripherals (left arm, left forearm, and left hand).
- Right thigh sensor (Central Unit 4) connects with two peripherals (right leg and right foot).
- Left thigh sensor (Central Unit 5) connects with two peripherals (left leg and left foot).
- A Bluetooth USB serial dongle is a hub for the five central units and connects to the PC.
Each sensor unit (central and peripheral) integrates a 9-degree-of-freedom Inertial Measurement Unit (IMU) consisting of a 3-axis accelerometer, 3-axis gyroscope, and 3-axis magnetometer. The system uses a BNO055 from Bosch Sensortec, an STM32L4 series microcontroller from STMicroelectronics, and a Bluetooth Low Energy v5.0 (BLE v5.0) working as a Host Processor. The BLE’s main characteristics ensure a maximum data throughput of 2 Mb/s at low energy consumption, allowing for approximately six hours of continuous measurements in our case.
Each sensor measures global quaternion rotations at a frequency of 100 Hz, organized into 8-byte frames. Unlike inertial sensors that connect directly to a central computer or using a router or Wi-Fi hub, to ensure low power consumption typically used in BLE applications, the stability of the topology, and communication via BLE notifications, a pipeline was used where each central and peripheral unit accumulates four samples. This approach results in each sensor sending notifications at a lower rate of 25 Hz to the central units. The central units organize their data, including the peripheral units’ data, creating a 128-byte data frame, which is then sent via notifications to the BLE-USB hub at 25 Hz. This ensures that notifications are generated within the time constraints of the BLE protocol, maintaining communication stability and guaranteeing a sampling rate of 100 Hz. Additionally, this allows the limbs and the dorsal trunk to be measured independently from the other units, as they are composed of separate central units.
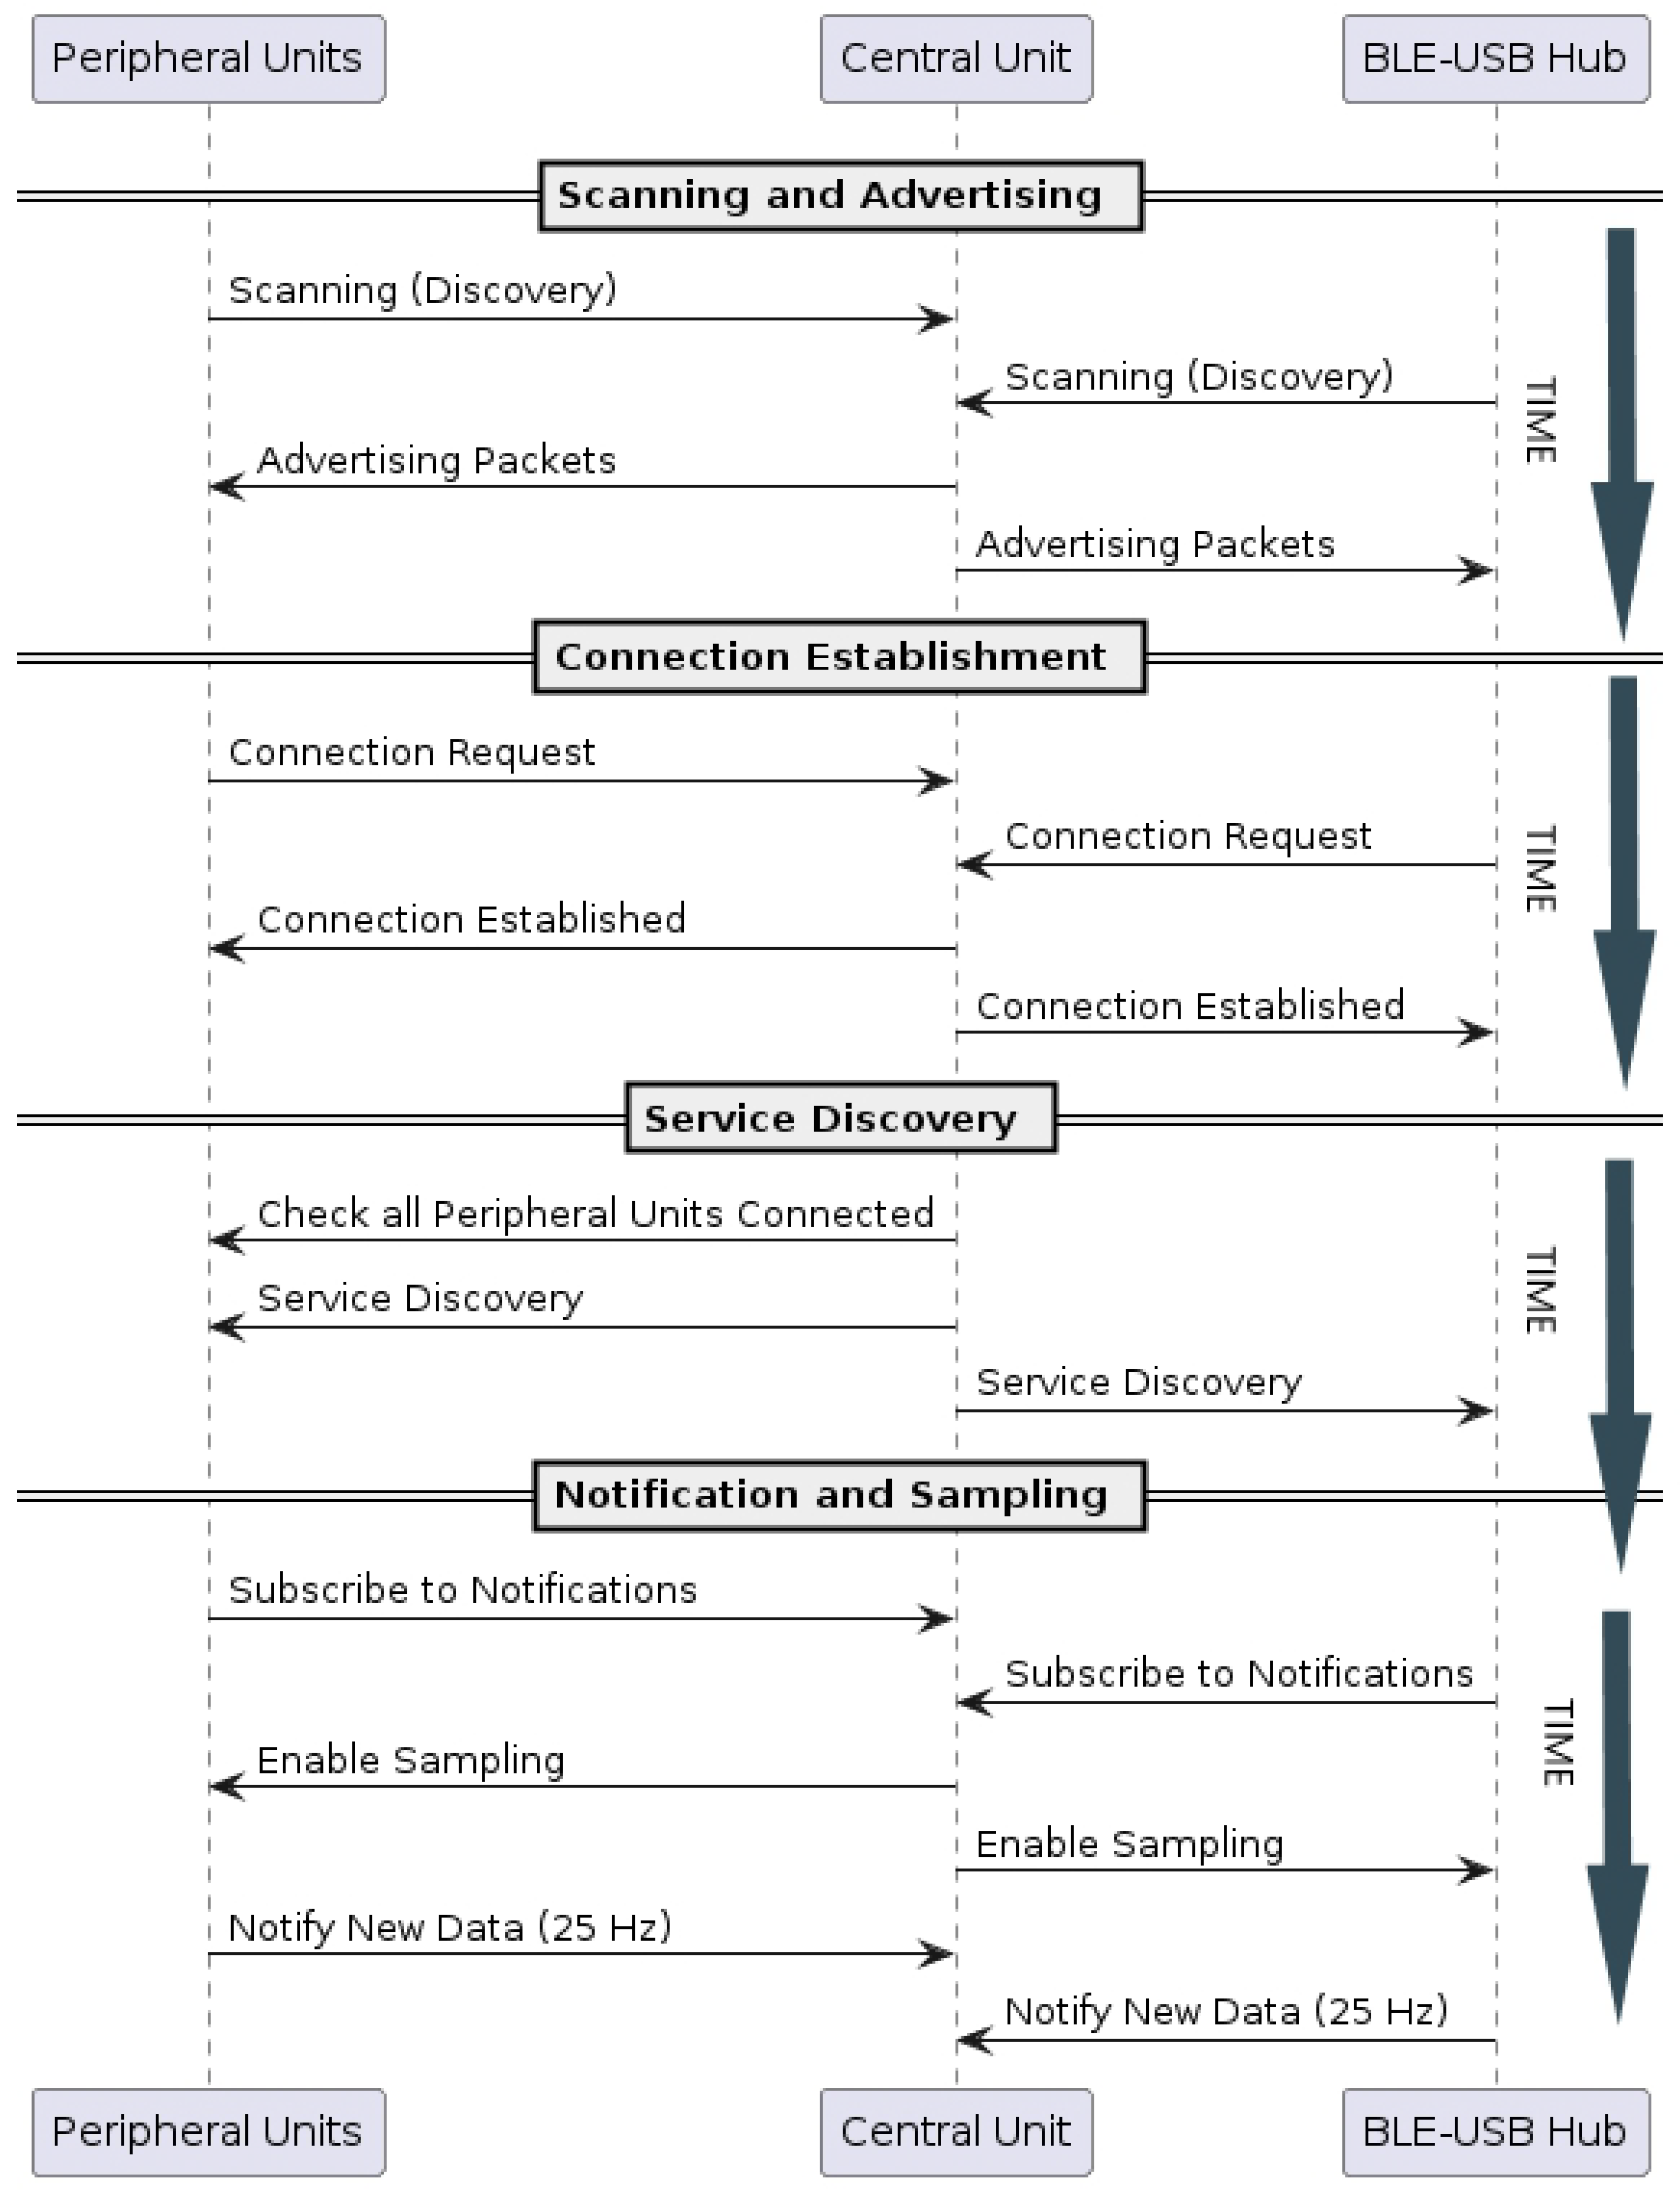
Upon powering the peripheral units, they send advertising packets scanned by the central units. When the central units scan their peripherals, they request connections. Once the central unit establishes connections with all its corresponding peripherals, it starts sending advertising packets for the BLE-USB hub to recognize and initiate connection requests. After the connection with the hub is established, the Service Discovery process starts, followed by subscription to the notifications from the connected central units and enabling inertial sensor sampling. This, in turn, causes the central units to subscribe to the notifications from their corresponding peripherals and enables sampling of their respective measurement units. All the connection and communication protocol mentioned is illustrated in Figure 6.
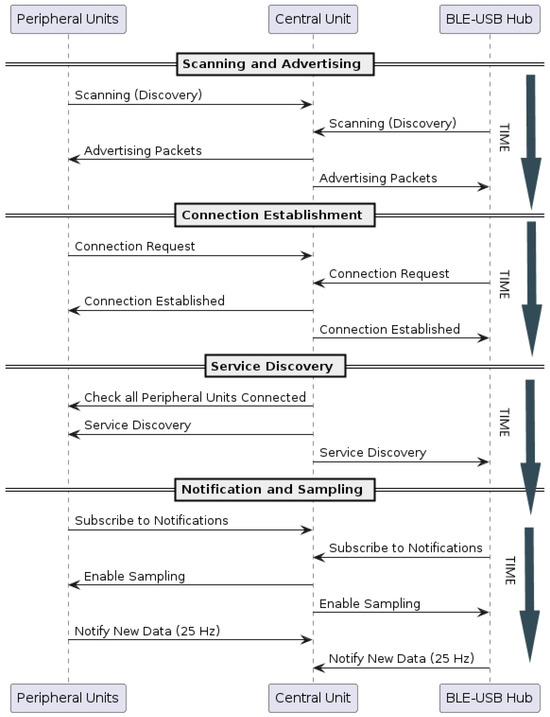
Figure 6.
Bluetooth Low Energy communication sequence and connection establishment diagram.
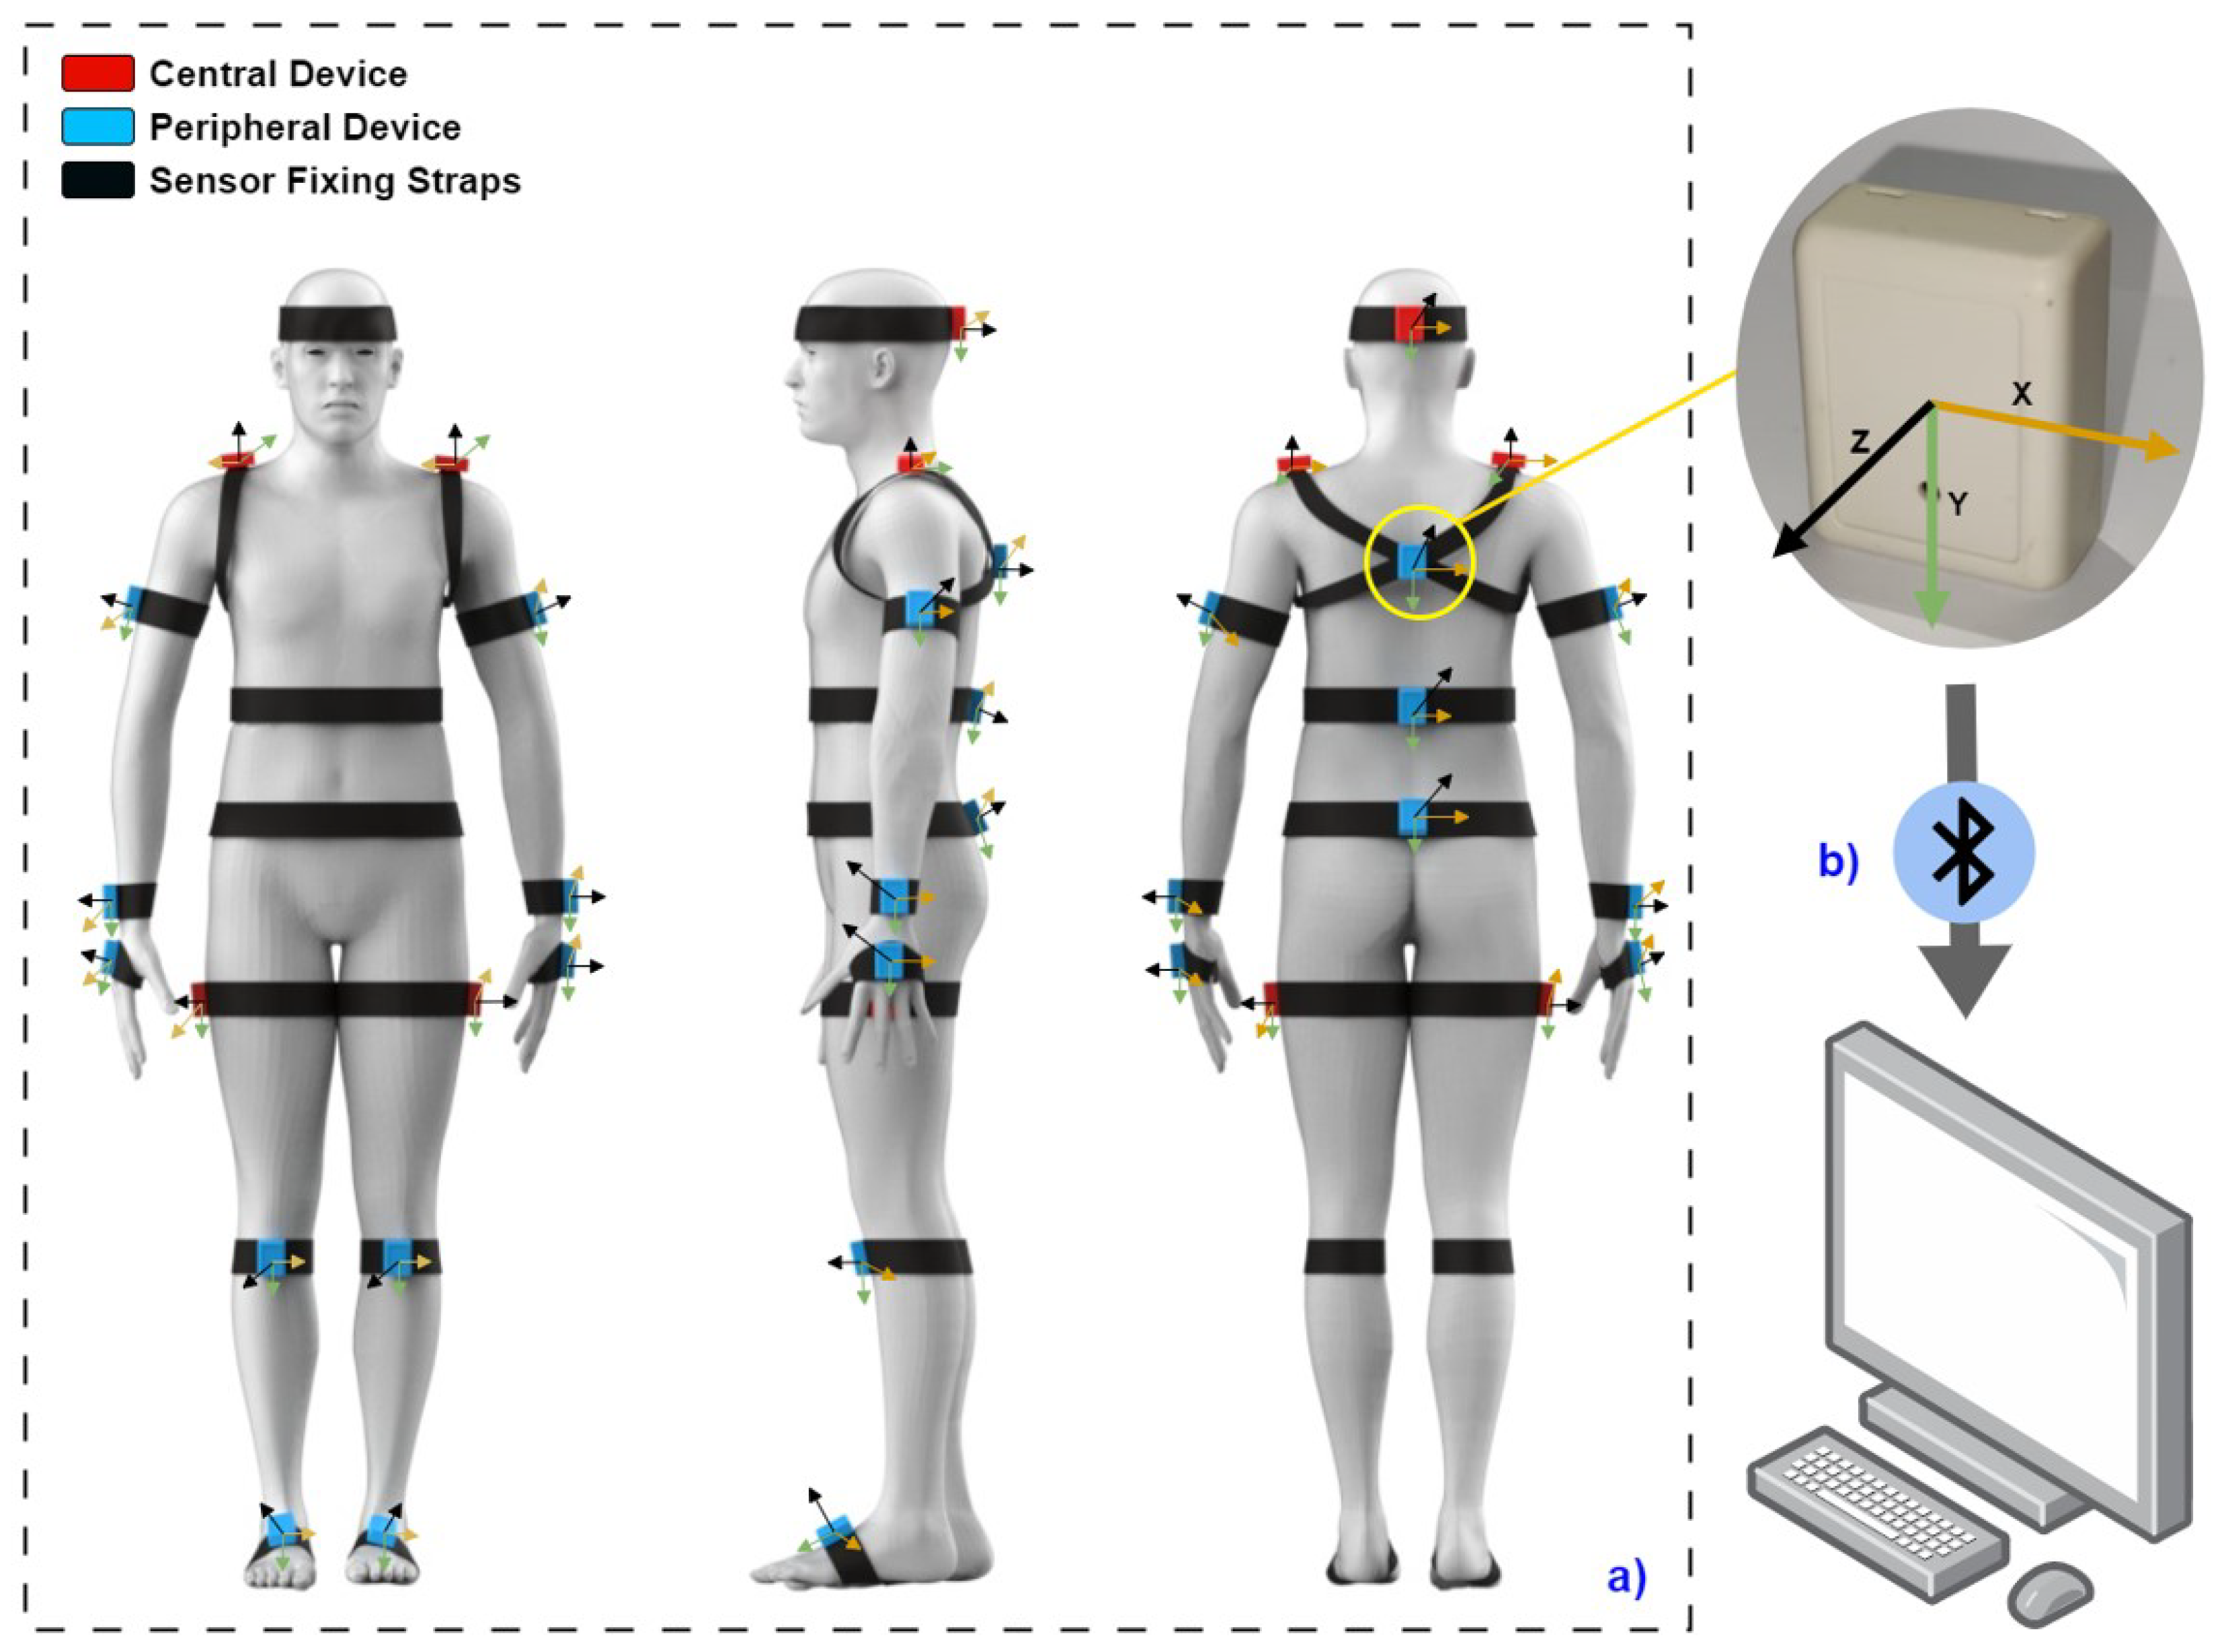
Figure 7 displays the positioning of each inertial sensor that comprises the designed suit. It also illustrates the method by which the data are transmitted from the sensors to the computer.
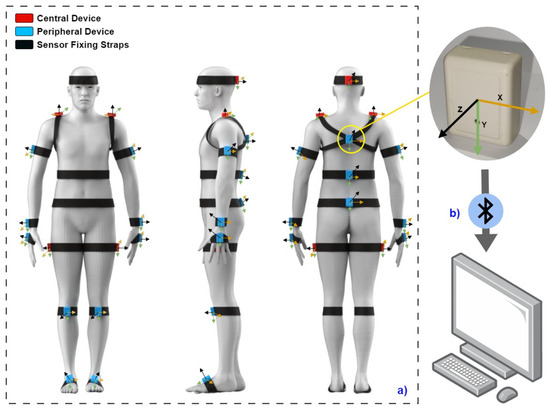
Figure 7.
Wiring diagram of the generated suit (a) front, side, and rear view of the positioning of each of the inertial sensors that make up the sensorized suit; (b) descriptive diagram of data flow via Bluetooth from the suit to a computer.
2.4. Test Procedure
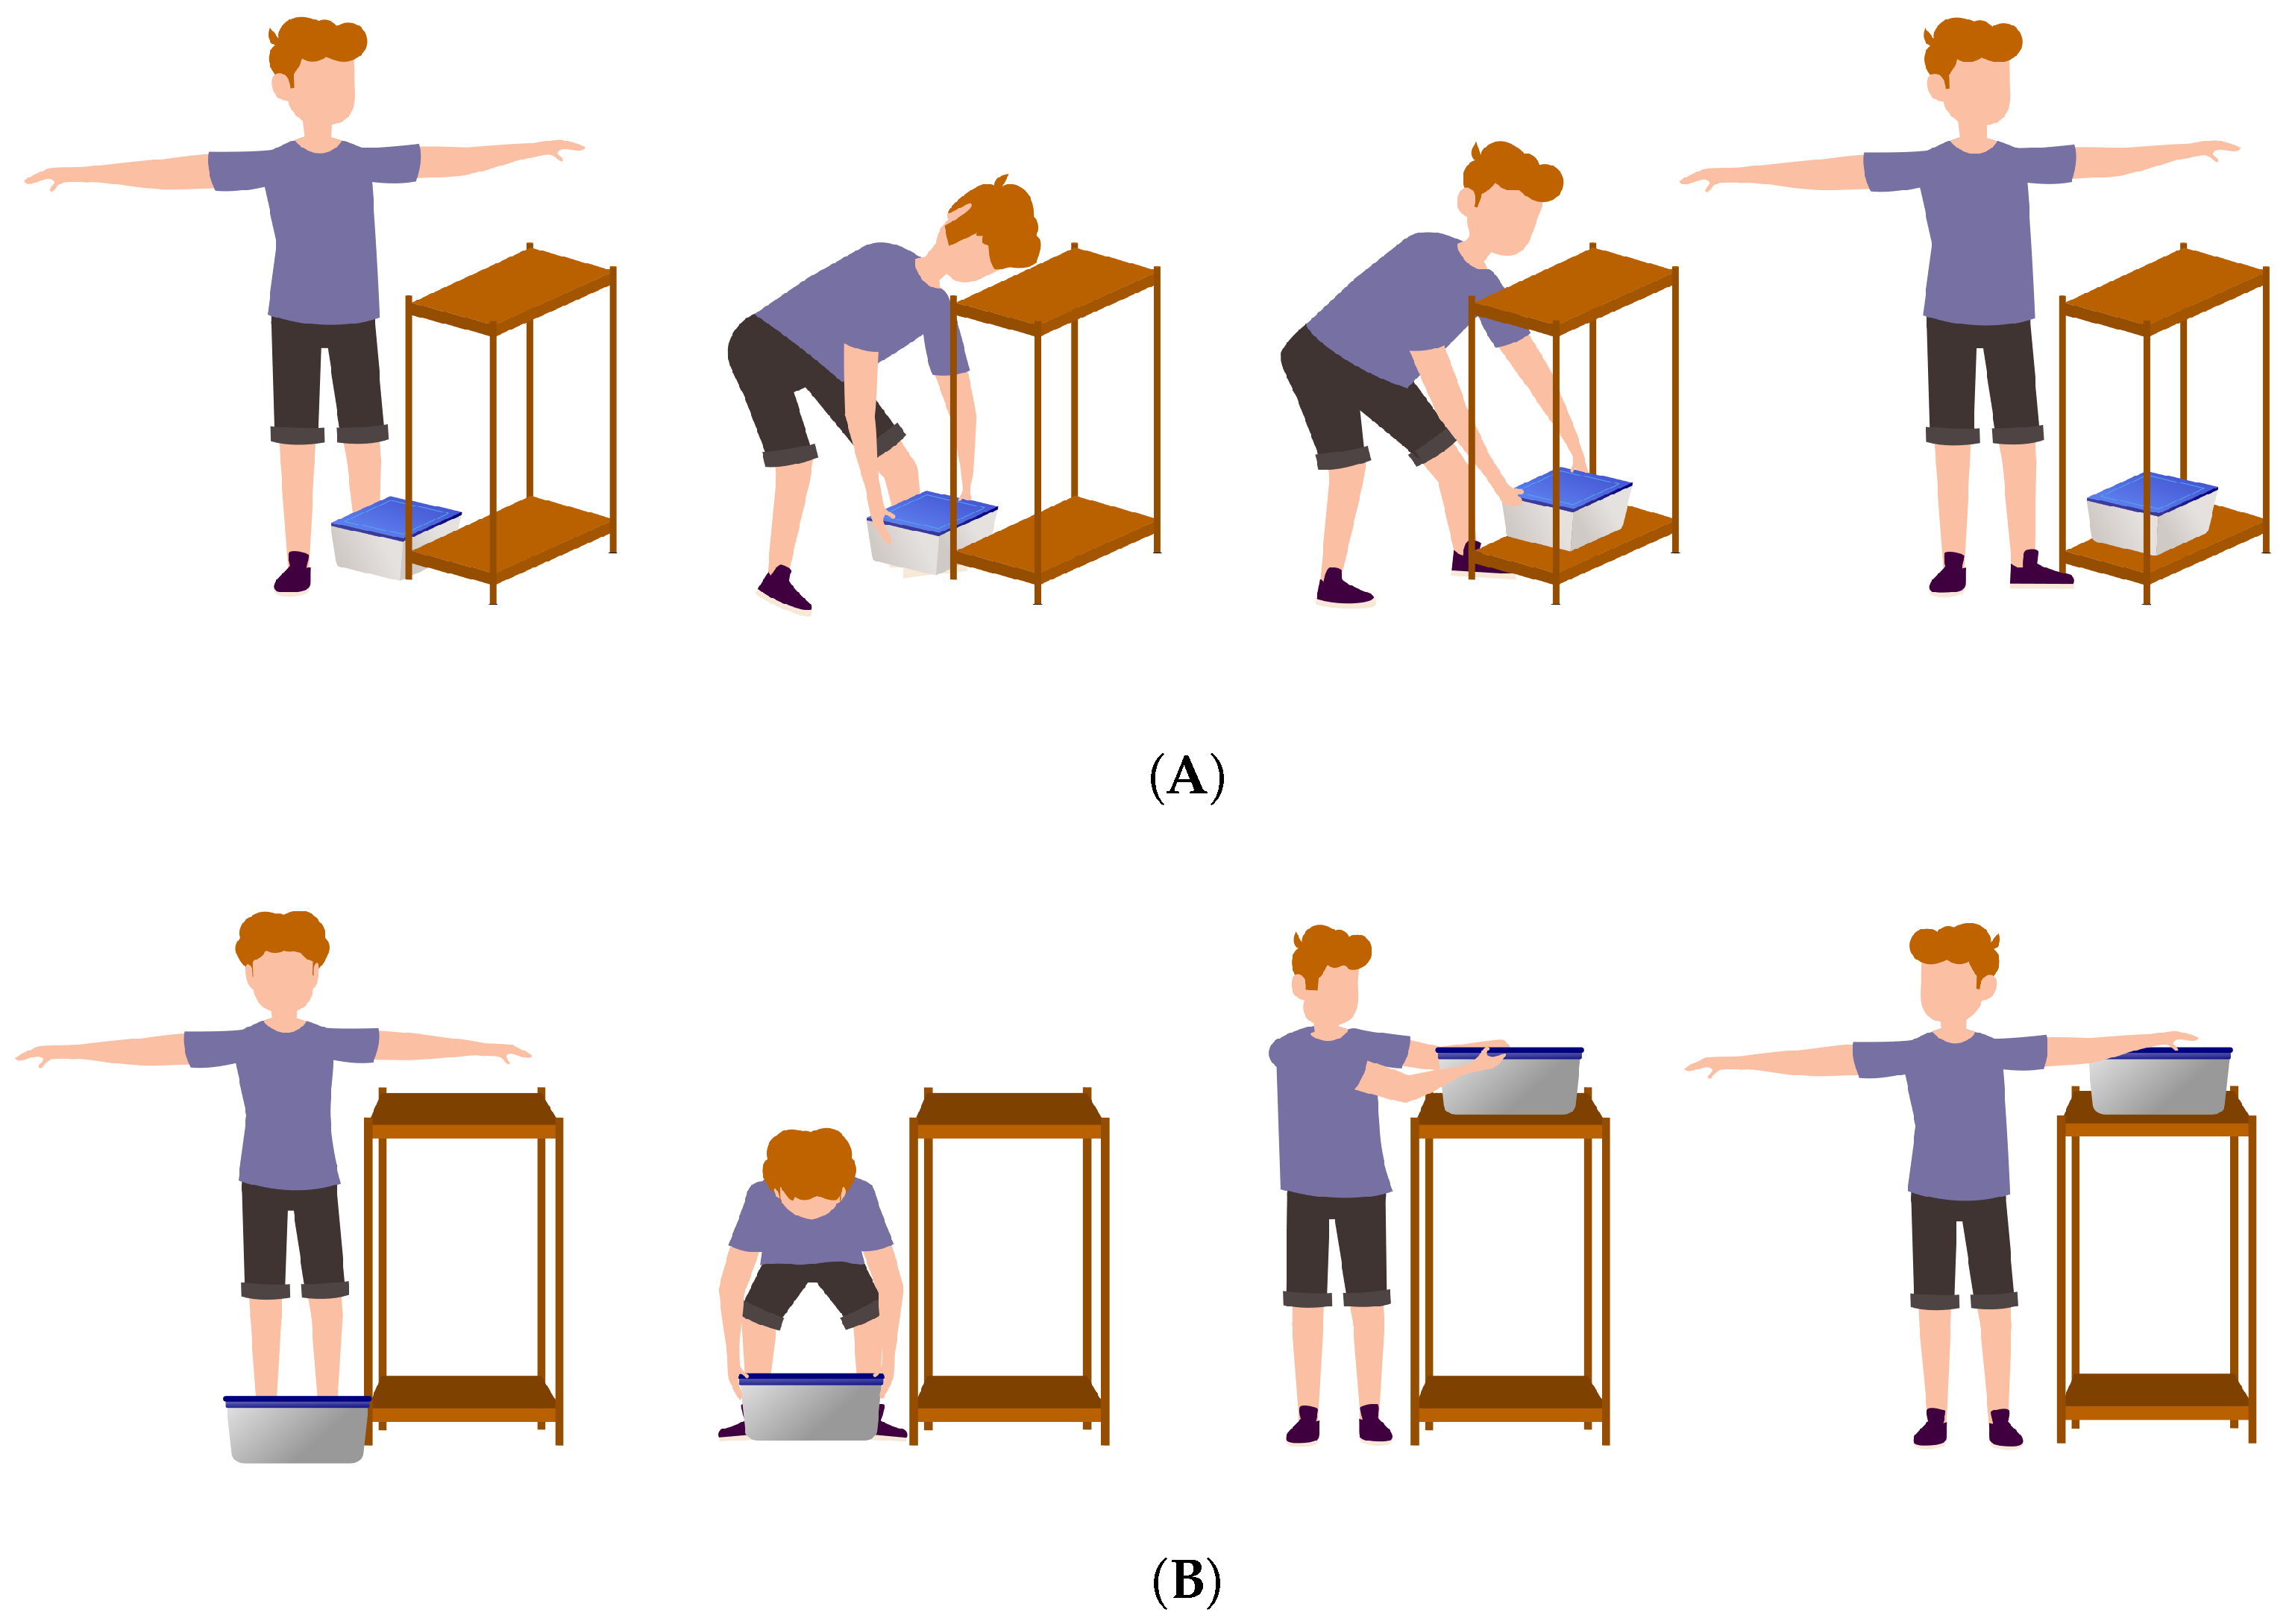
Before the trials, each participant signed an informed consent approved by the Vice-rectory for Research and Development of the Universidad de Concepción, code CEBB 794-2020. Each subject was asked to perform two lifts (Task 1 and Task 2) of a load to a shelf located in front of them (Figure 8A,B). The load was a plastic box with dimensions 42 × 15 × 32 cm (width × height × depth) and a fixed mass of 9 kg. The target shelf was 74 cm wide and 39 cm long, with fixed heights of 32 and 79 cm. The protocol consisted of lifting the box from the ground, using a “Good” grip (), and placing it on the aforementioned shelf. This activity was designed to create variation in the measurements of H, V, A, and D. For the remaining factors related to the method, a 7-h workday was assumed, with a lifting frequency of two lifts per minute followed by a sound rhythm to control it ().
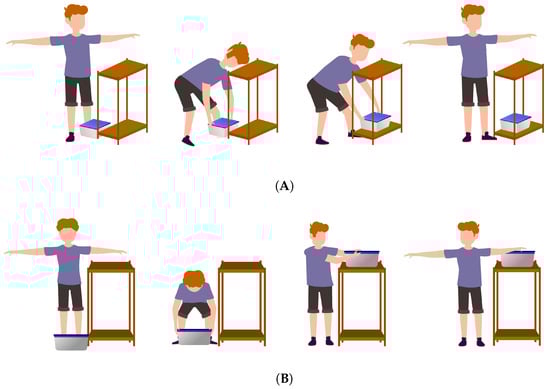
Figure 8.
Tasks 1 (A) and 2 (B) for ergonomic risk evaluation.
The H, V, A, and D measurements at both the start and finish of the lift were determined using a manual goniometer and a tape measure. These tools were also used to mark positions on the ground and on the shelf, providing a traditional measurement to take the necessary measurements to calculate the reference values that are the Gold Standard in this study. These data allowed us to compute the lifting index traditionally for comparison with the proposed semi-automatic system.
The expected values for these metrics were based on the ergonomic standards outlined in the Technical Guide for Manual Handling of Loads from the Chilean Social Security.
These values provide a baseline from which deviations in sensor measurements can be assessed, enabling a direct comparison of the accuracy and reliability of the inertial and optoelectronic systems in capturing key ergonomic metrics.
At the end of the tests, Biovision Hierarchy (BVH) motion files were exported from an optoelectronic MoCap system for each subject and imported into the proposed platform.
Figure 8A,B show the experimental tasks conducted, illustrating the path from the initial position. Specifically, Figure 8A corresponds to Task 1, with a fixed trunk rotation of 45° without foot movement from the initial position. Conversely, Figure 8B represents Task 2, with a fixed trunk rotation of 90° without foot movement from the initial position.
2.5. Statistical Analysis and Performance Assessment
A comprehensive analysis methodology was used to assess risk across 20 subjects. Three distinct assessment tools were used: a traditional reference method involving manual measurements with a tape measure and a digital goniometer, an optoelectronic system (OptiTrack®), and a custom BLE-based inertial sensor system. The core of our analysis was to compare the ergonomically significant variables H, V, A, and D captured by these instrumented methods.
The analysis included a statistical evaluation of the variability and accuracy of these variables, with the aim of identifying any significant differences in the data collected by the instrumented methods.
The assessment of normality or data distribution was performed using the Shapiro–Wilk test. In this case, none of the distributions of the measured metrics (H, V, A, and D) were normal.
The performance of both systems was quantitatively evaluated using four key metrics: Precision, Sensitivity, F1 Score, and Accuracy.
- Precision measures the proportion of correctly identified positive cases (i.e., instances where risk is present) out of all cases predicted as positive by the system. A high precision rate indicates that when the system predicts a risk, it is likely to be correct.
- Sensitivity (also known as recall) assesses the system’s ability to correctly identify actual positive cases (i.e., instances where actual risk is present) among all cases. High sensitivity means the system effectively captures most of the at-risk tasks without missing many.
- F1 Score provides a balance between precision and sensitivity, considering both false positives and false negatives. This metric is particularly useful when the class distribution is uneven. Scores close to 100% indicate high precision and high sensitivity.
- Accuracy represents the ratio of correctly predicted observations to the total number of observations.
The analysis results and graphs were created using Matlab R2023b (MathWorks, Apple Hill Campus, Natick, MA, USA).
3. Results
The evaluation of ergonomic risks associated with manual load handling tasks was conducted using both Bluetooth Low Energy (BLE) and optical (OptiTrack®) motion capture systems. The analysis focused on comparing the distribution and statistical metrics of horizontal displacement (H), vertical displacement (V), trunk rotation (A), and vertical absolute displacement (D) captured by both systems. This section presents the results obtained from these analyses. The expected values for H, V, A, and D were predetermined based on ergonomic standards [18].
3.1. Distribution of Ergonomic Metrics
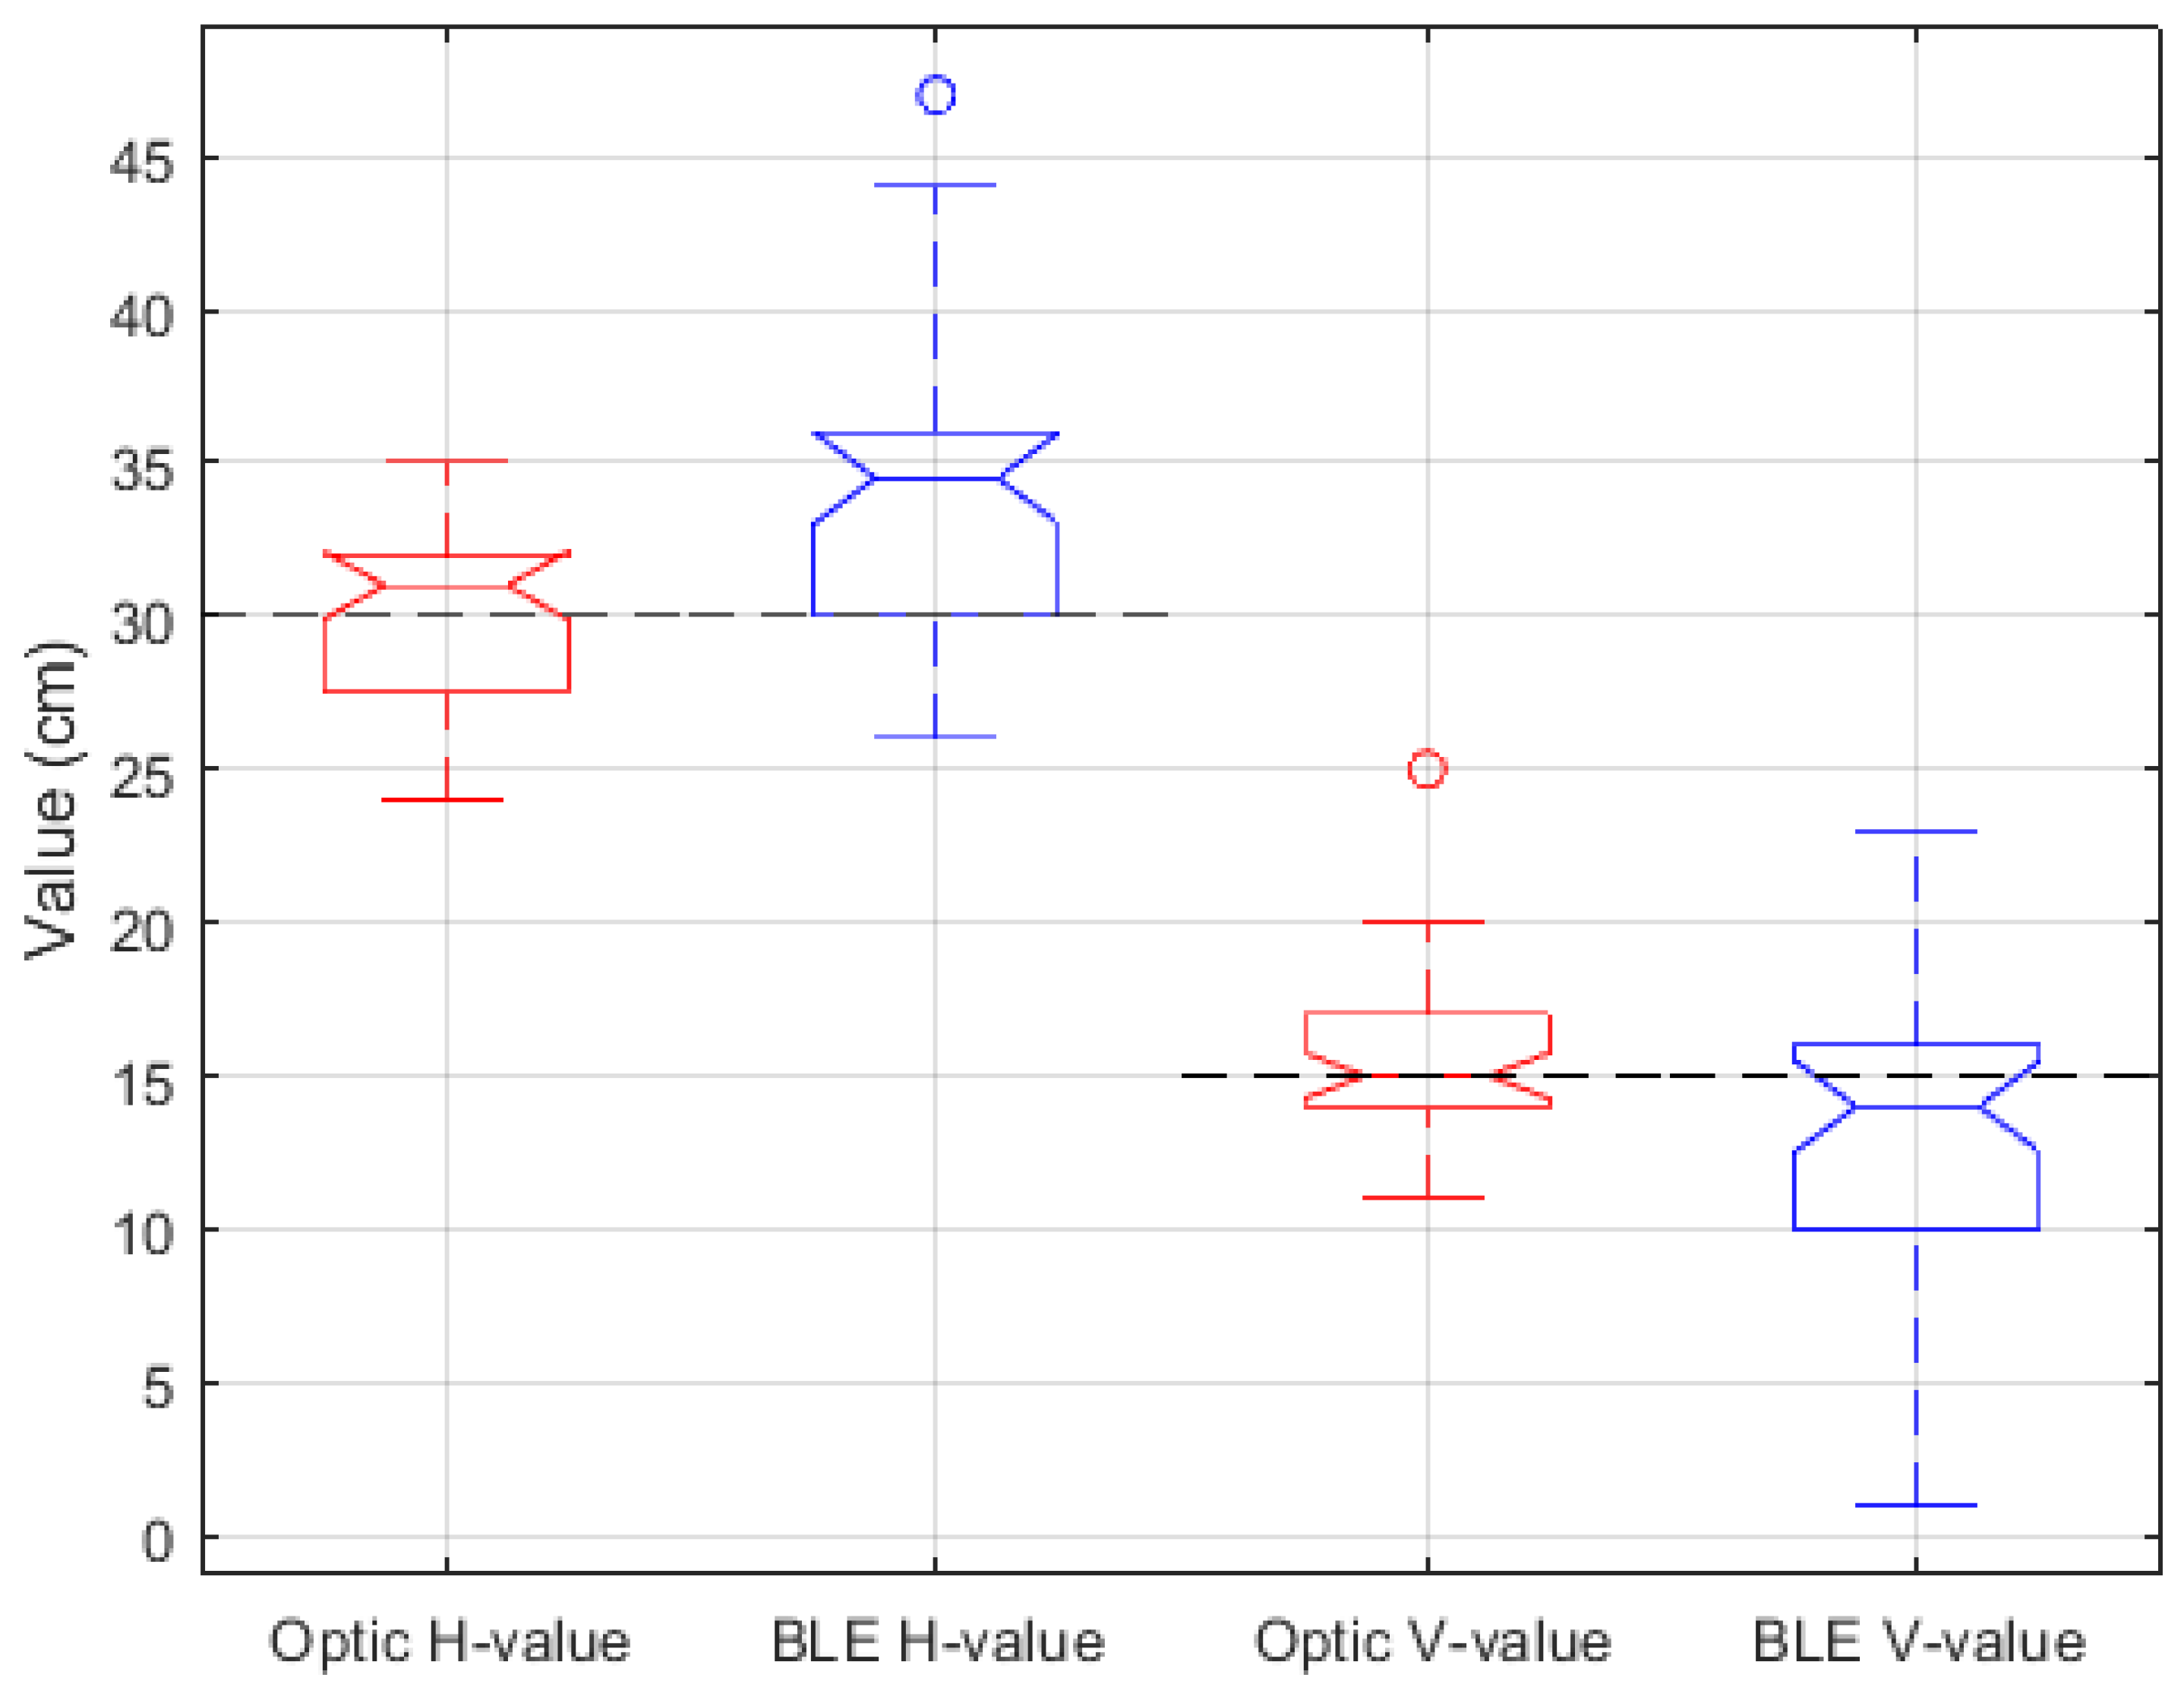
The distribution of the ergonomic metrics V, H, A, and D for the BLE Inertial MoCap and optical systems is illustrated through a series of box plots.
Figure 9 shows the variability in measurements of vertical displacement (V) and horizontal displacement (H) among participants. The BLE Inertial MoCap system displayed a wider range of values, showing a higher variability compared to the optical system. However, both systems are aligned with the expected values. The variability could reflect either inherent differences in the population or measurement technology, or a combination of both. In this case, the variability observed is due in part to participants not always staying within the requested markers, as well as differences in anthropometric assumptions made by the measurement systems. Outlier data were not treated, as the intention was to demonstrate the full and realistic functionality of our proposed system.
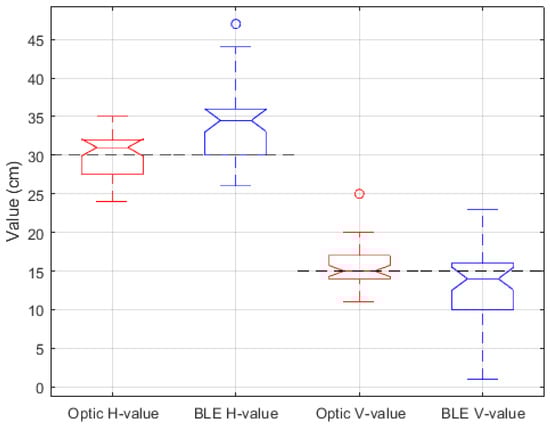
Figure 9.
Distribution of ergonomic metrics V and H captured by BLE Inertial MoCap and optical system. Segmented lines correspond to expected values from Tasks 1 and 2. The box represents the interquartile range (25th to 75th percentile), with the line inside indicating the median. Whiskers extend to 1.5 times the interquartile range, and points outside are outliers.
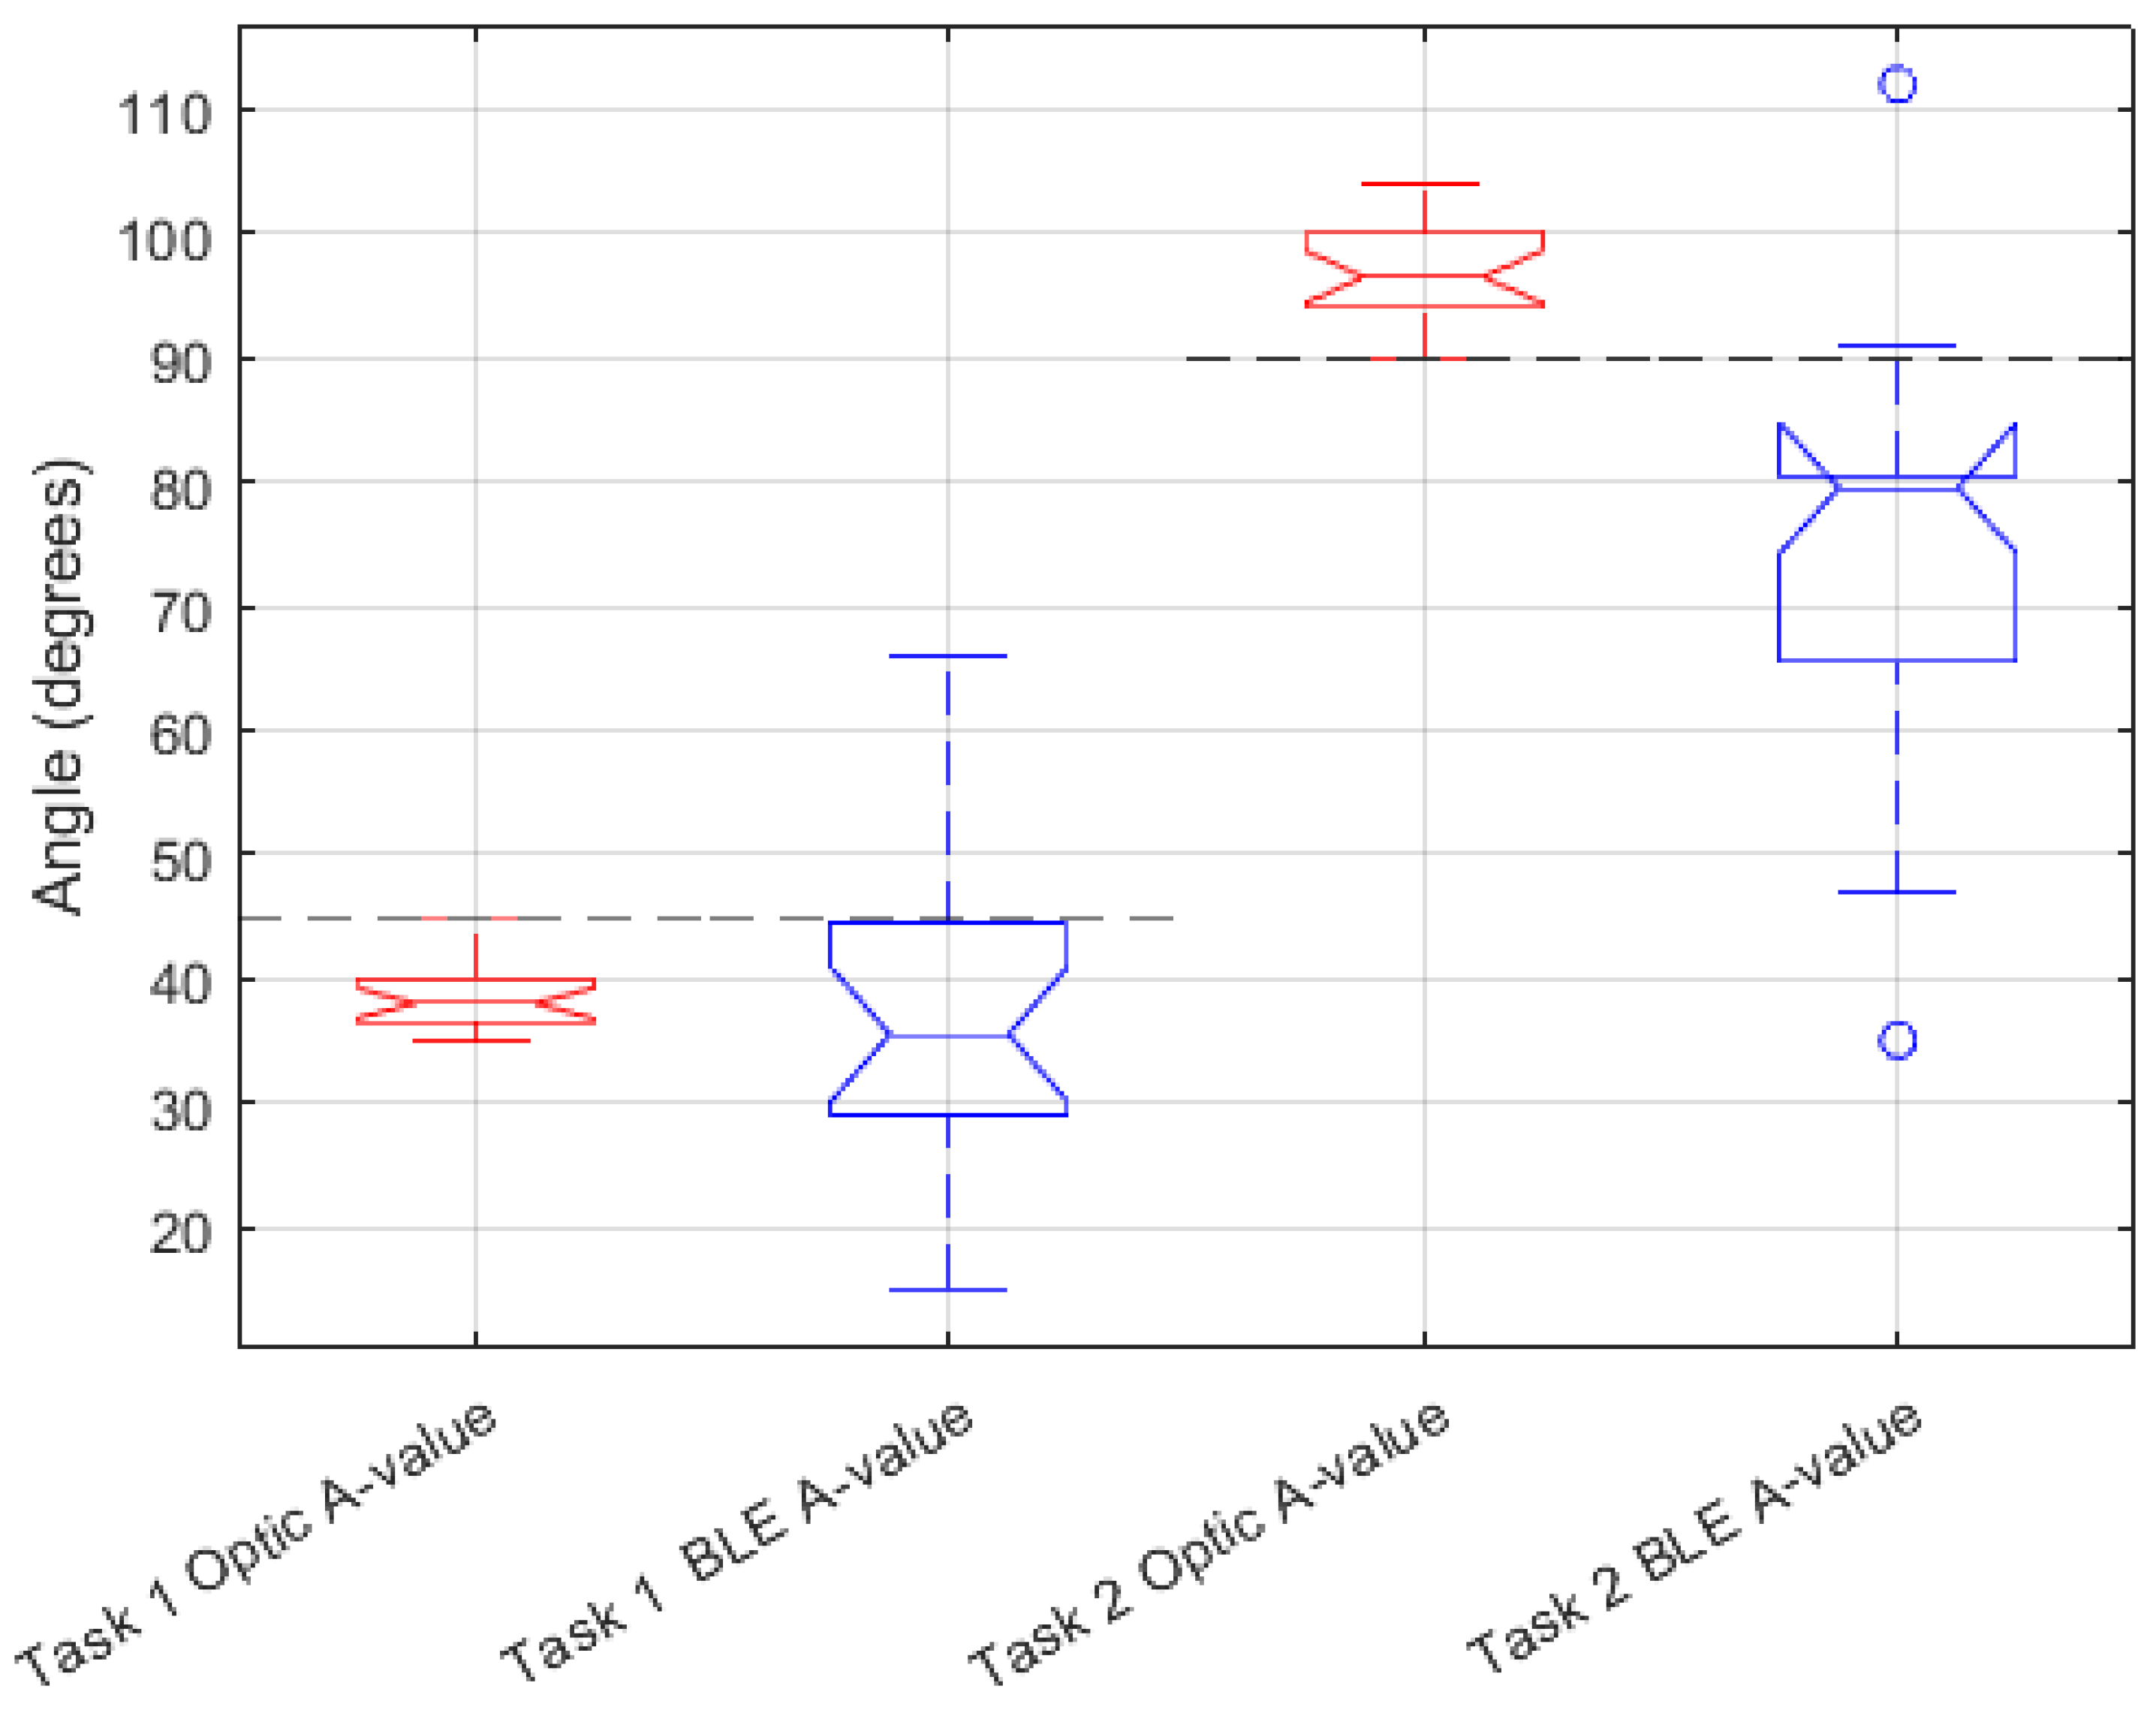
In Figure 10, the angle of trunk rotation (A) measurements indicate an alignment between the BLE Inertial MoCap and optical systems, with both aligned with the expected task-specific values.
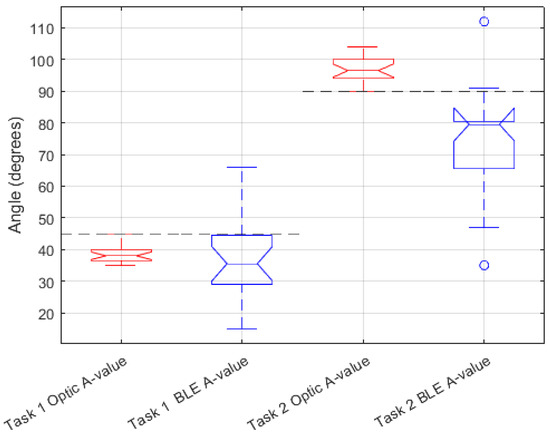
Figure 10.
Distribution of ergonomic metric A (Trunk Rotation) captured by BLE and optical system. Segmented lines correspond to expected values from each task.
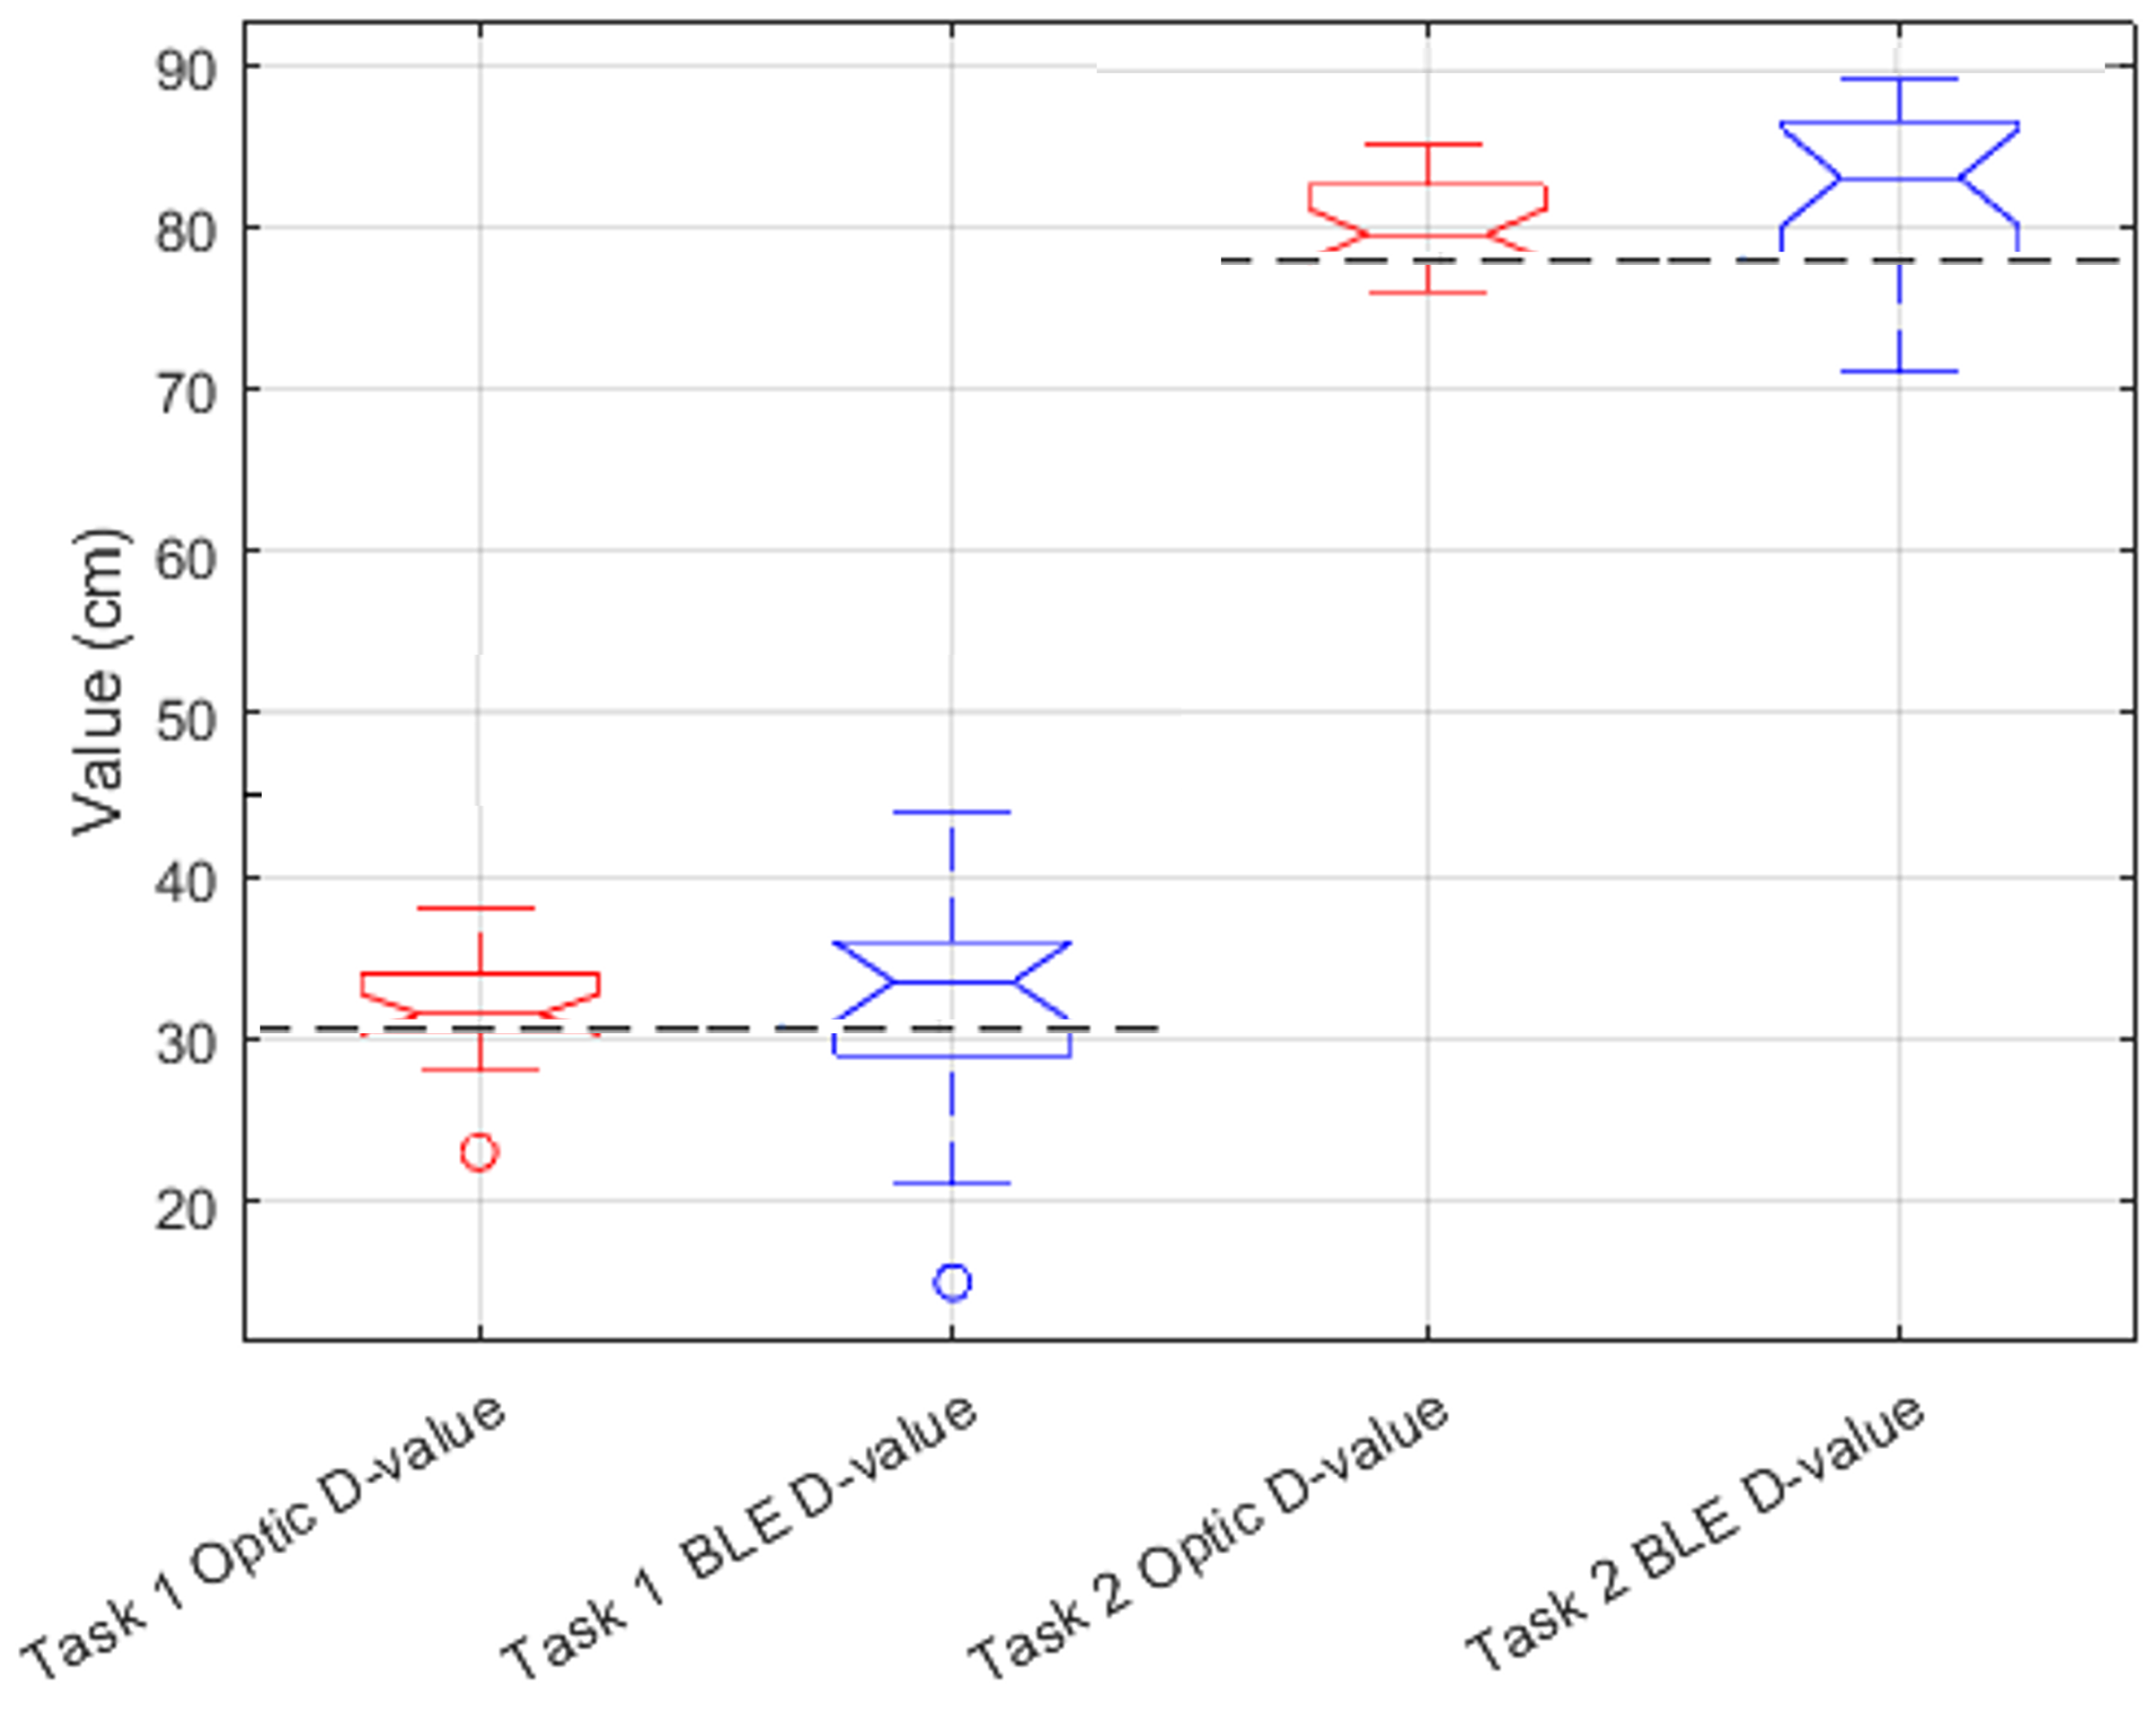
The box plots in Figure 11 reveal a discrepancy between the systems in measuring vertical absolute displacement (D), with the BLE Inertial MoCap system exhibiting a broader spread of values.
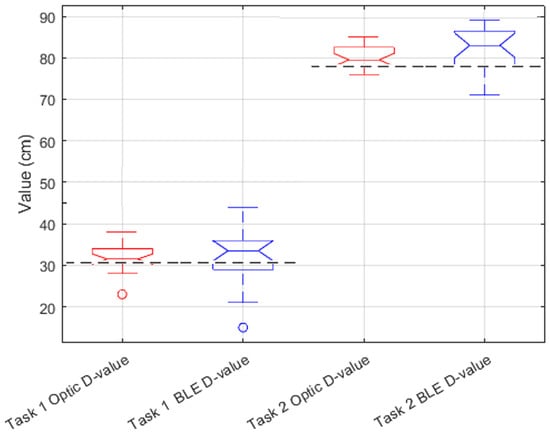
Figure 11.
Distribution of ergonomic metric D captured by BLE Inertial MoCap and optical system. Segmented lines correspond to expected values from each task.
Table 5 summarizes the distribution metrics obtained from each motion capture system.
Table 5.
Means and standard deviations of horizontal displacement (H), vertical displacement (V), vertical absolute displacement (D), and trunk rotations (A) for BLE Inertial MoCap and optical systems. Here, A1 denotes the results from Task 1 and A2 from Task 2.
3.2. Lifting Index and Recommended Weight Limit
The Lifting Index (LI) and Recommended Weight Limit (RWL) were calculated to assess ergonomic risks associated with lifting tasks.
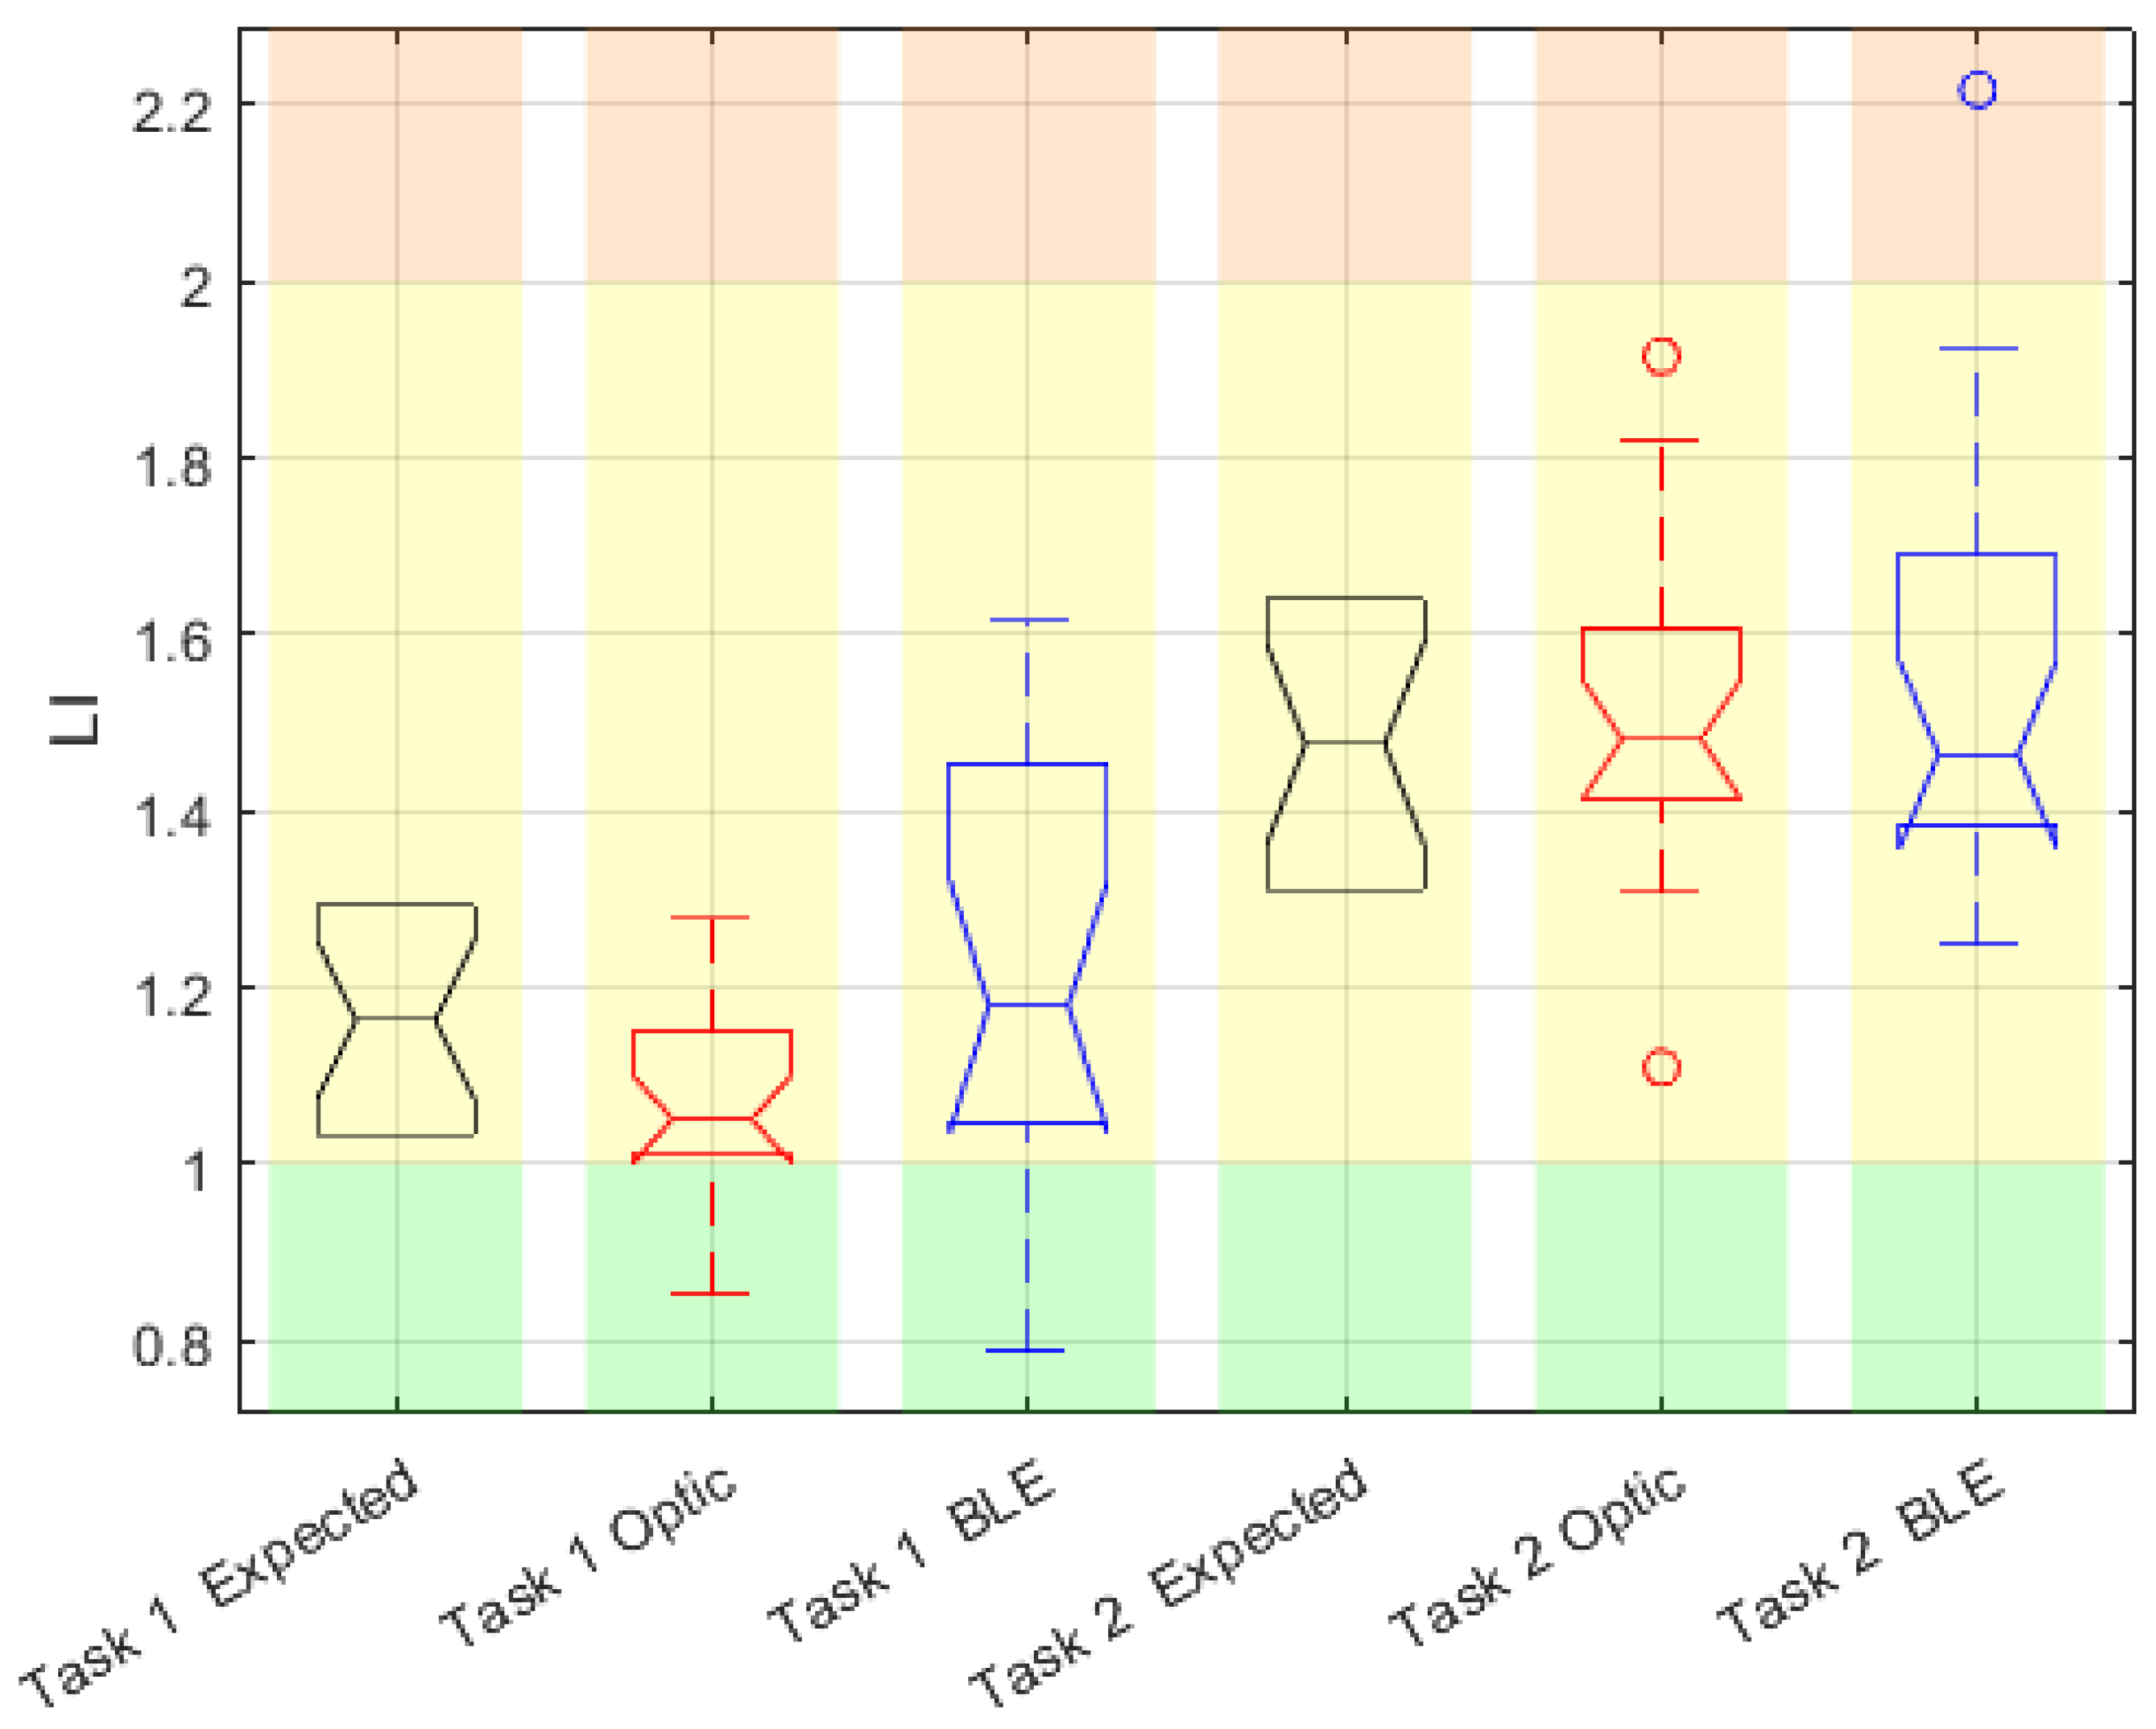
Figure 12 visualizes the risk levels based on LI values. The majority of measurements fall within the acceptable to low risk categories, indicating that the tasks performed are within ergonomic safety limits.
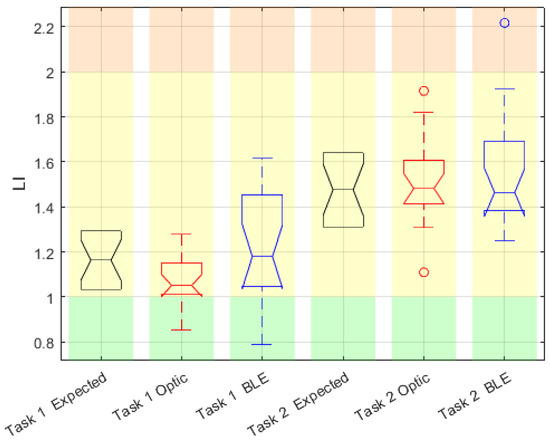
Figure 12.
Distribution of the lifting index (LI) estimated by the developed platform using BVH files from each motion capture system: BLE Inertial MoCap and optical. Here, the green area is acceptable risk, yellow is low level risk, and orange is high level risk.
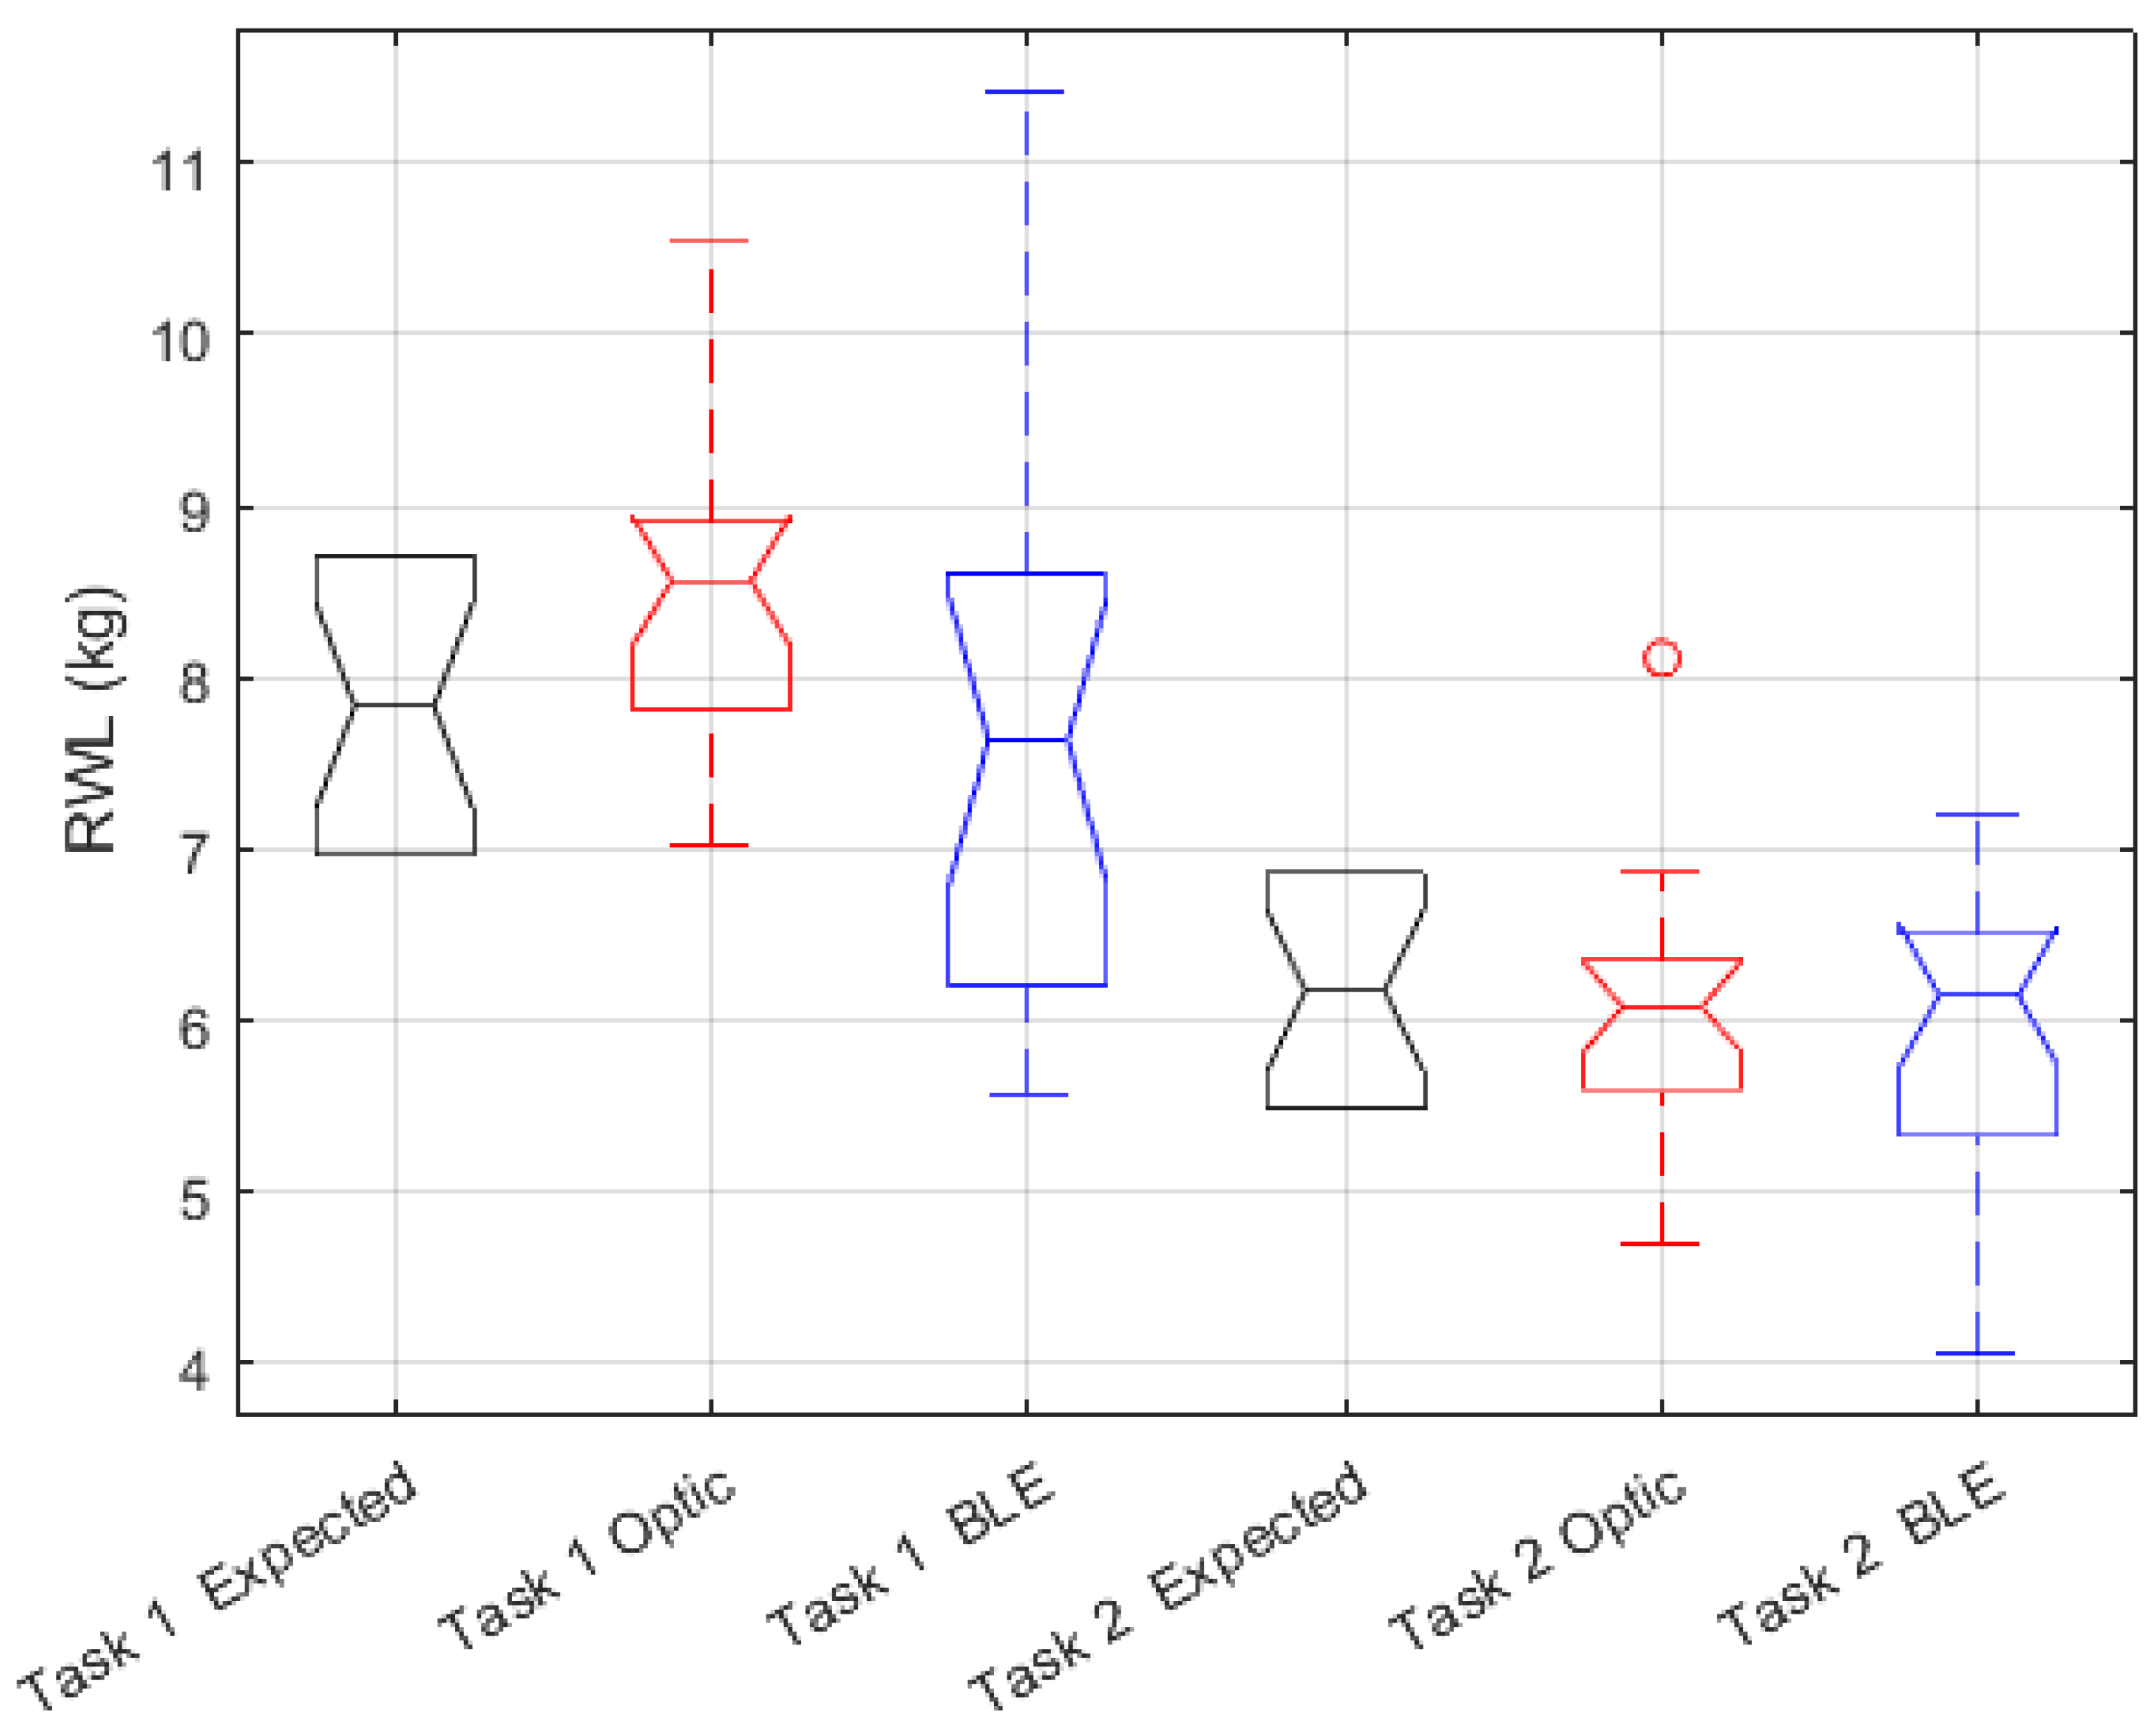
Similarly, Figure 13 illustrates the RWL estimations, which shows the reliability of both systems and the developed semi-automatic platform in identifying ergonomic risk levels associated with the manual handling tasks.
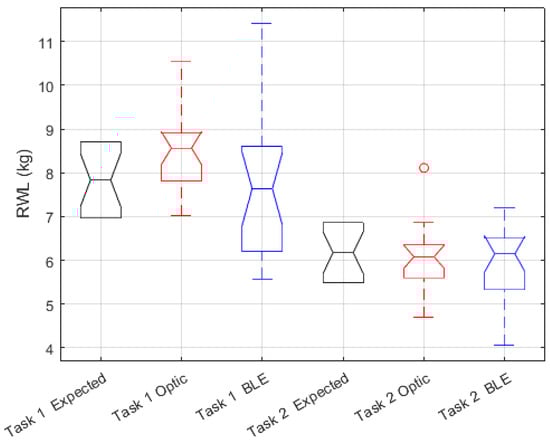
Figure 13.
Distribution of the recommended weight limit (RWL) estimated by the developed platform using BVH files from each motion capture system: BLE Inertial MoCap and optical.
Table 6.
Means and standard deviations of LI1 and LI2, along with expected values, for BLE Inertial MoCap and optical systems. Here, LI1 denotes the results from Task 1 and LI2 from Task 2.
Table 7.
Means and standard deviations of RWL1 and RWL2, along with expected values, for BLE Inertial MoCap and optical systems. Here, RWL1 denotes the results from Task 1 and RWL2 from Task 2.
3.3. Correlation and Statistical Significance
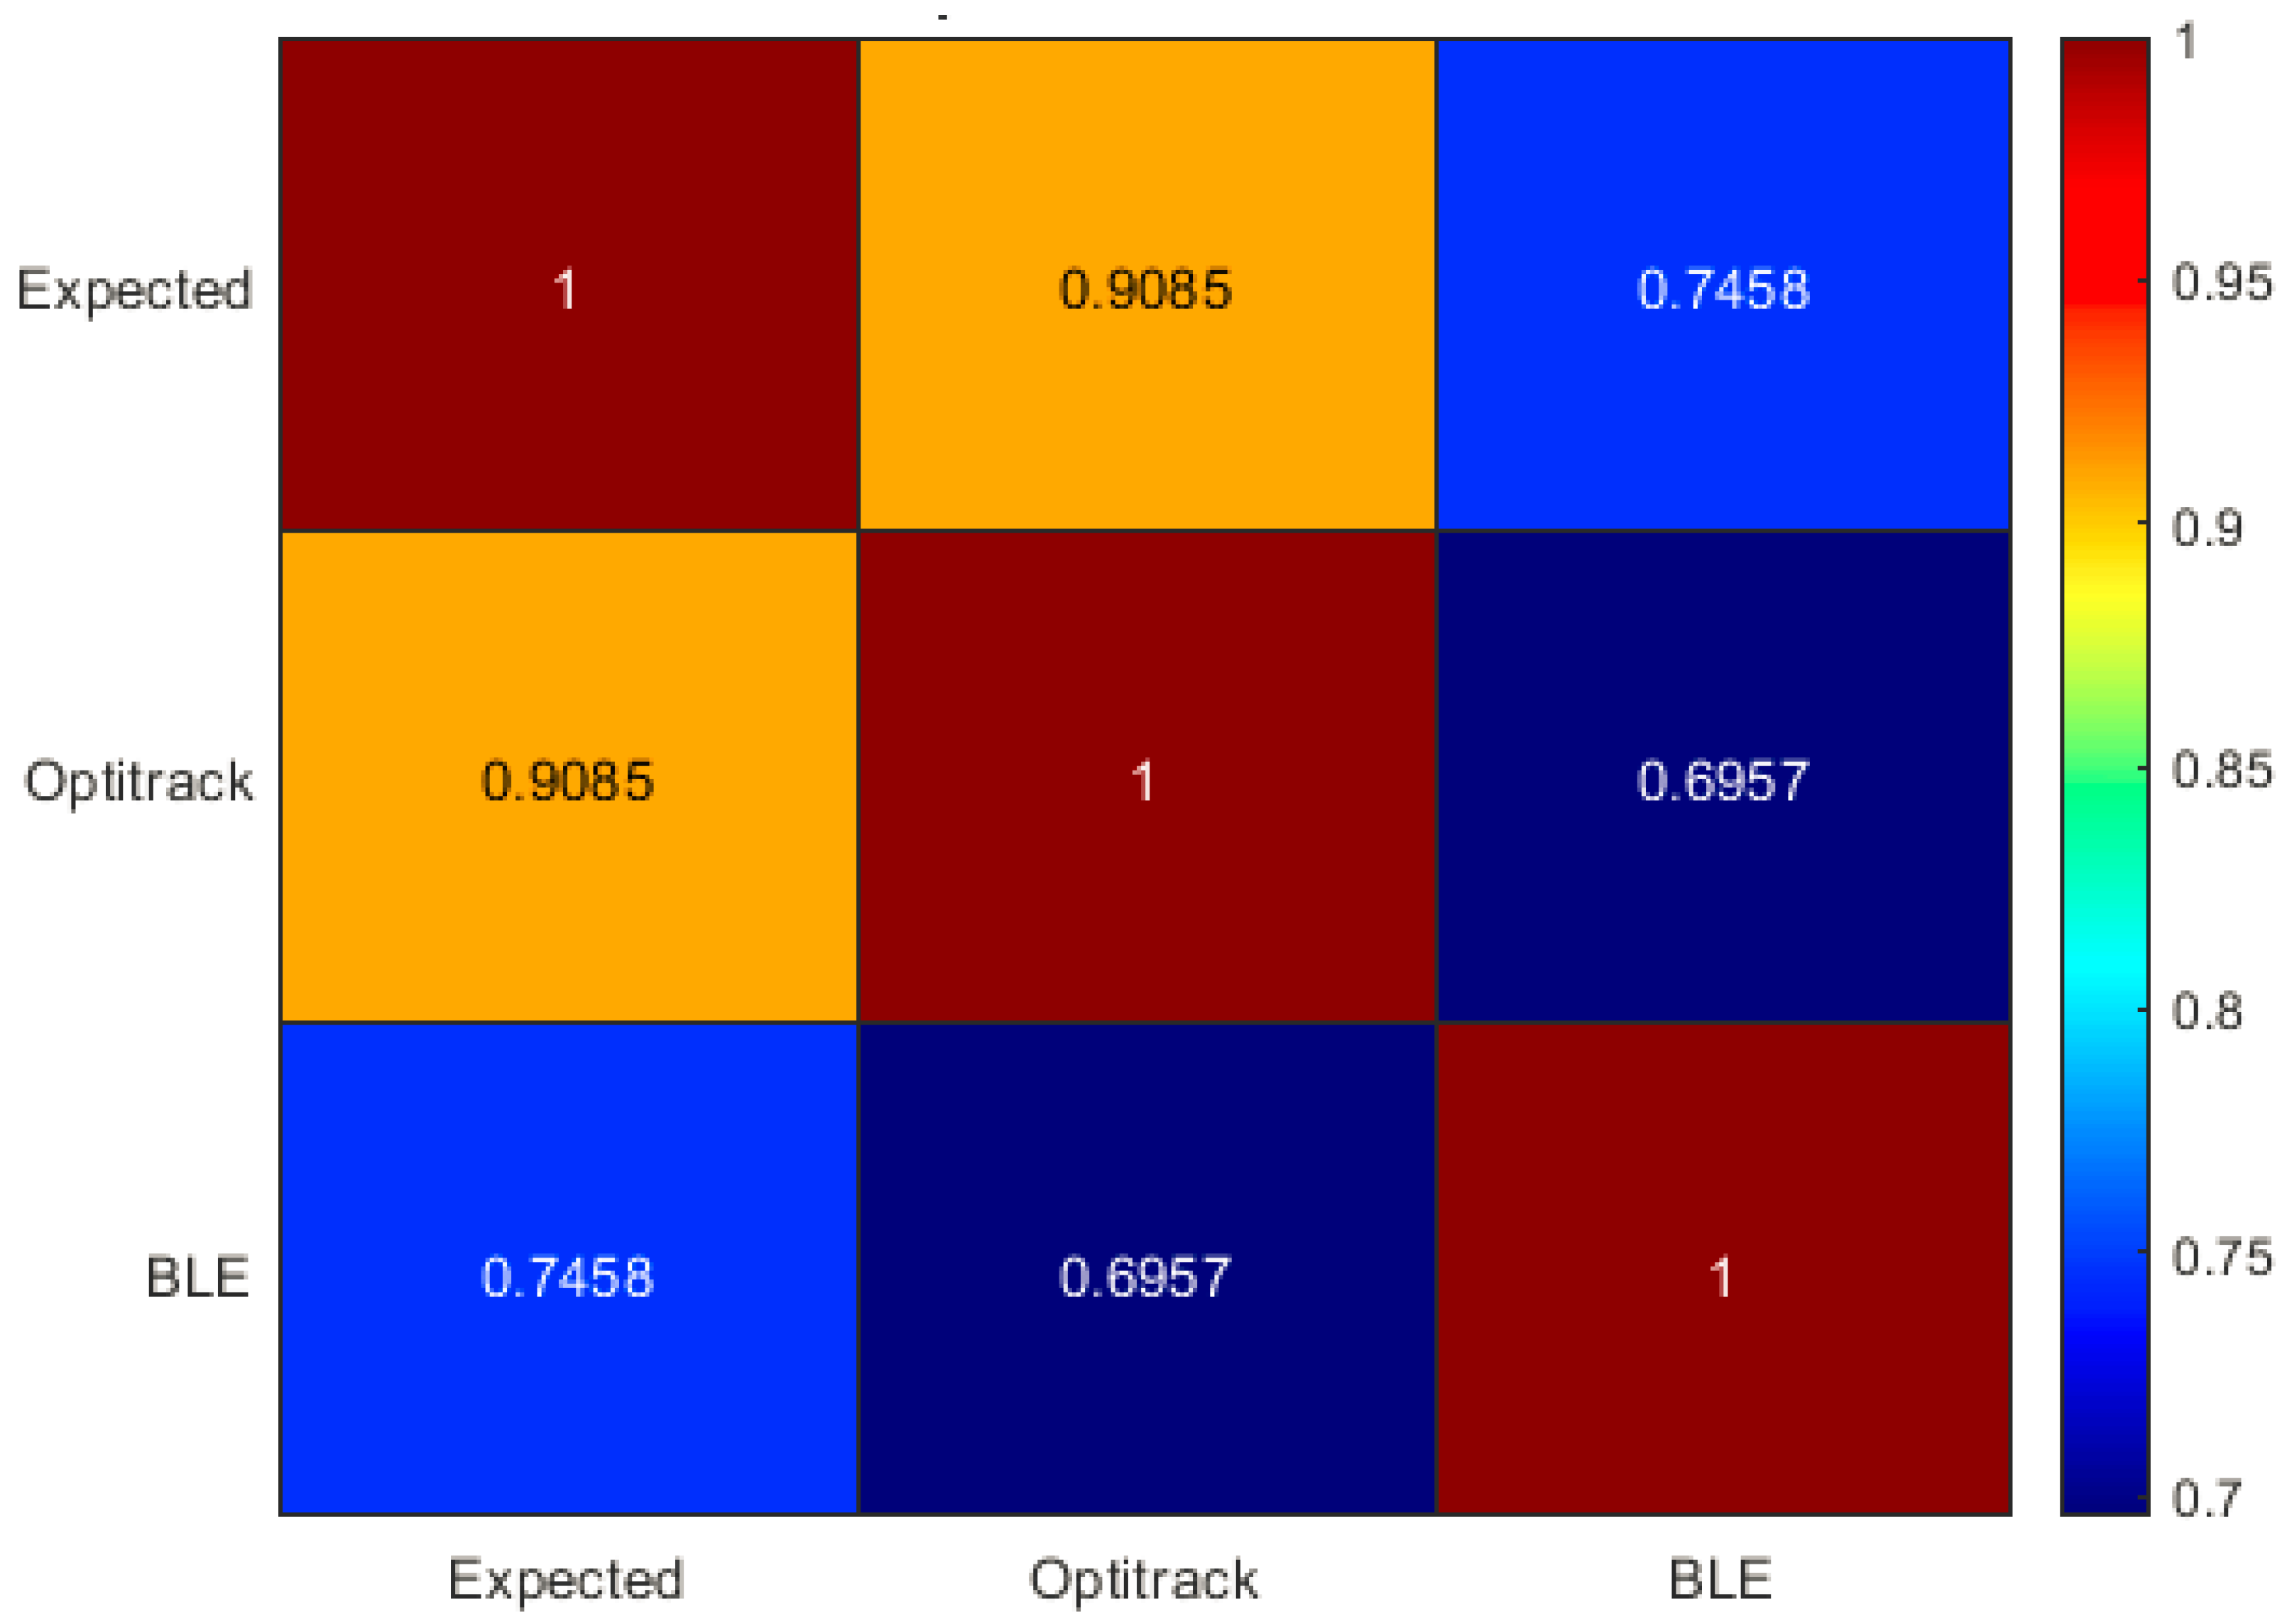
A Spearman correlation analysis was conducted to evaluate the agreement between the BLE Inertial MoCap and optical systems in estimating LI with the proposed platform. The analysis revealed a strong positive correlation, indicating that both systems produce consistent LI estimations (see Figure 14).

Figure 14.
Spearman correlation matrix for the LI values obtained from the two motion capture systems and the expected values.
Further analysis involved calculating the lifting index (LI) and recommended weight limit (RWL) for assessing ergonomic risk. The LI and RWL values were derived for each system and compared against expected benchmarks to determine risk levels.
Statistical tests, including Mann–Whitney U, were performed to assess the significance of differences between the systems and expected values (see Table 8). The tests showed that for certain metrics (V, H, and A), there were significant differences showing areas for improvement in measurement accuracy or methodological adjustments for future assessments.
Table 8.
Significance of differences in metrics between BLE Inertial MoCap and OptiTrack® systems with respect the expected values (* p-value < 0.05).
The performance obtained due the risk classification values are shown in Table 9.
Table 9.
Risk categorization performance of BLE Inertial MoCap and OptiTrack® Systems from the LI values respect the expected metrics.
- Precision: Both BLE Inertial MoCap and OptiTrack® systems achieved a precision rate of 98.5%, indicating that the 98.5% risk categorizations they made were correct when they predicted a risk.
- Sensitivity: The BLE Inertial MoCap system exhibited a sensitivity of 97.5%, meaning it could identify 97.5% of the tasks that were actually at risk. The OptiTrack® system achieved a sensitivity of 98.7%.
- F1 Score: The BLE Inertial MoCap system’s F1 score was 97.9%, and the OptiTrack® system achieved an score of 98.6%.
- Accuracy: The BLE Inertial MoCap system’s accuracy was 97.5%, and the OptiTrack® system scored 98.5%.
The OptiTrack® system demonstrated consistent performance across all metrics, achieving a precision of 98.5%, sensitivity of 98.7%, F1 score of 98.6%, and accuracy of 98.5%. The BLE Inertial MoCap system, while lower in sensitivity and accuracy, still showed robust performance with a precision of 98.5%, sensitivity of 97.5%, F1 score of 97.9%, and accuracy of 97.5%. These results shows that although the BLE system had minor variations in risk detection, it still maintained a strong performance in precision and overall balance between precision and sensitivity.
4. Discussion
This study compares an optical system (OptiTrack®) and a BLE-based system with IMUs in assessing ergonomic risks through the NIOSH Lifting Index. The analysis involved the evaluation of key ergonomic variables (horizontal displacement H, vertical displacement V, trunk rotation A, and vertical absolute displacement D), which are important in calculating the Recommended Weight Limit (RWL) and Lifting Index (LI).
The findings revealed that both systems demonstrated high precision in LI-based risk categorization, with the BLE Inertial MoCap system achieving a precision rate of 98.5% and the OptiTrack® system achieving 98.5% as well (Table 9). This indicates that when risks were identified by either system, they reliably reflected ergonomic concerns. However, it is important to acknowledge that these conclusions are based on only two tasks, which cannot fully represent the wide range of real-world settings. Additionally, the expected values for Task 2 lie in the middle of the low-risk band, increasing the likelihood that any deviations in the OptiTrack® or BLE values would remain in the same band. Therefore, it is important to recognize that if the expected values were closer to the limits of the classification bands (e.g., LI = 1 or LI = 2), the metrics might not have been as strong as they are.
While the BLE Inertial MoCap system demonstrated lower sensitivity (97.5%) and accuracy (97.5%) compared to the OptiTrack® system’s sensitivity (98.7%) and accuracy (98.5%), it still performed robustly in real-world settings where versatility and ease of deployment are crucial. Additionally, the BLE Inertial MoCap system’s F1 score of 97.9% reflects a strong balance between precision and sensitivity, while the OptiTrack® system’s F1 score of 98.6% reflects a higher overall performance. These results demonstrate the potential of both systems in ergonomic risk assessment, although the superior performance of the OptiTrack® system suggests that it may be more reliable in certain scenarios.
An observation from the results was the alignment of both systems with expected ergonomic standards for measurements of H and V (Figure 9). The BLE Inertial MoCap system exhibited higher variability in V measurements, which could be attributed to the inherent nature of wearable systems that may be subjected to more noise and movement artifacts than stationary optical systems. Despite this variability, the BLE Inertial MoCap system’s measurements for D were consistent with those of the OptiTrack® system. However, the increased variability in some measurements, such as V and H, suggests that further refinement of the BLE system is necessary to enhance its measurement accuracy.
Significant differences were noted in the measurements of V, H, and A between the systems (Table 8), highlighting specific areas for improvement in the BLE-based system. These differences underline the need for ongoing refinement of BLE-based systems to better match the accuracy of optical systems like OptiTrack®, especially when applied in complex real-world environments. While both systems produced reliable LI estimations, the comparison between the systems’ performance and their proximity to the expected ergonomic values shows that the BLE system may require additional adjustments to achieve the same level of precision as OptiTrack®.
The results of this study align with previous research validating inertial measurement units (IMUs) against optoelectronic systems. For instance, Robert-Lachaine et al. demonstrated that IMUs provide accurate whole-body motion analysis, comparable to optoelectronic systems [26]. However, it is important to note that these studies also emphasize certain limitations of IMUs, such as susceptibility to drift and noise, which may explain some of the variability observed in the BLE Inertial MoCap system’s performance in this study.
Moreover, critical ergonomic variables H, V, A, and D were essential in the risk assessment methodology. These variables are fundamental in ergonomic risk evaluation, as corroborated by Yunus et al., who developed a portable system for real-time biomechanical risk assessment in repetitive tasks [34]. Nevertheless, the differences observed in the measurements of V, H, and A highlight that, while the BLE Inertial MoCap system has great potential for practical applications, it may still require refinement to match the level of precision achieved by more established systems like OptiTrack®.
The practical applicability of BLE Inertial MoCap systems in real-world work environments, emphasized in this study, aligns with the findings of Giannini et al., who discussed the advantages of inertial systems for field studies over optoelectronic systems, which are often hindered by occlusion issues and high costs [32]. However, it is important to remain cautious when generalizing these results, as additional testing and validation in a broader range of tasks and environments are necessary to fully understand the limitations and strengths of each system.
On the other hand, there are simpler systems that utilize straightforward methods for measuring ergonomic risks associated with manual material handling [10,35]. However, these systems incorporate complex algorithms and have only been tested in controlled and unrealistic conditions, neglecting their practical applicability in real environments and the possibility of detecting not only the presence of risk, but also identifying the specific joint or segment at risk due to the lack of full-body sensorization. This highlights the advantages of full-body motion capture systems like BLE and OptiTrack®, which provide a more comprehensive analysis of ergonomic risks.
While both the BLE Inertial MoCap and OptiTrack® systems provide valuable tools for ergonomic risk assessment, further research is needed to evaluate their performance in more diverse and complex settings. The practical implications are significant for workplace ergonomics, where rapid, accurate risk assessments are crucial for preventing musculoskeletal disorders. The semi-automatic platform developed for this study facilitates more efficient and precise risk assessments across diverse work environments using instrumented MoCap technologies.
Future work will focus on minimizing the variability and enhancing the sensitivity of BLE Inertial MoCap systems to match the reliability seen in optical systems. Additionally, it will be important to investigate the specific scenarios in which each system excels and determine the most appropriate contexts for their use.
This research advances the capabilities in ergonomic assessment, providing robust tools that combine advanced technology with practical applications in workplace safety.
5. Limitations and Future Work
This study focused on validating the semi-automatic system rather than detecting risks per se, and hence, a cohort of healthy subjects was used. Future studies should implement the system in real-world conditions and evaluate subjects who present ergonomic risks to provide a comprehensive assessment of its effectiveness in detecting and mitigating musculoskeletal disorders in diverse workplace environments.
Author Contributions
Conceptualization, M.G. and P.A.; methodology, M.G., P.O.-B. and P.A.; software, M.G., B.G., G.R, G.P., E.G. and P.A.; validation, M.G., B.G., G.R., G.P., E.G. and P.A.; formal analysis, M.G., B.G., G.R. and P.A.; investigation, B.G. and G.R.; resources, M.G. and P.A.; data curation, B.G. and G.R.; writing—original draft preparation, M.G., B.G., G.R. and P.A.; writing—review and editing, M.G., B.G., E.G., P.O.-B. and P.A.; visualization, M.G., B.G., E.G., P.O.-B. and P.A.; supervision, M.G. and P.A.; project administration, M.G. and P.A.; funding acquisition, M.G. and P.A. All authors have read and agreed to the published version of the manuscript.
Funding
This research was funded by ANID Chile and Fondef IdeA project “Technological system for the evaluation of ergonomic risks of disorders musculoskeletal following national regulations and international methodologies”, Code: ID 20I10297.
Institutional Review Board Statement
The study was conducted in accordance with the Declaration of Helsinki, and approved by the Vicerectory for Research and Development of the Universidad de Concepción, code CEBB 794-2020.
Informed Consent Statement
Informed consent was obtained from all subjects involved in the study.
Data Availability Statement
The original contributions presented in the study are included in the article, further inquiries can be directed to the corresponding author.
Conflicts of Interest
The authors declare no conflicts of interest.
Abbreviations
The following abbreviations are used in this manuscript:
| MSDs | Assessing musculoskeletal disorders |
| BLE | Bluetooth Low Energy |
| IMUs | Inertial Measurement Units |
| H | Horizontal Displacement |
| V | Vertical Displacement |
| A | Asymmetry Angle |
| D | Absolute Vertical Displacement between Start and Finish |
| RWL | Recommended Weight Limit |
| LI | NIOSH Lifting Index |
| MoCap | Motion Capture |
References
- Gomes, J.O. El papel de la ergonomía en el cambio de las condiciones de trabajo: Perspectivas en América Latina. Rev. Cienc. Salud 2014, 12, 5–8. [Google Scholar] [CrossRef]
- Jaffar, N.; Abdul-Tharim, A.; Mohd-Kamar, I.; Lop, N. A literature review of ergonomics risk factors in construction industry. Procedia Eng. 2011, 20, 89–97. [Google Scholar] [CrossRef]
- Asensio Cuesta, S.; Bastante Ceca, M.J.; Diego Más, J.A. Evaluación Ergonómica de Puestos de Trabajo; Ediciones Paraninfo, SA: Madrid, Spain, 2012. [Google Scholar]
- Tompa, E.; Mofidi, A.; Van Den Heuvel, S.; Van Bree, T.; Michaelsen, F.; Jung, Y.; Porsch, L.; Van Emmerik, M. The Value of Occupational Safety and Health and the Societal Costs of Work-Related Injuries and Diseases. Publications Office. Online, 2019. Available online: https://data.europa.eu/doi/10.2802/251128 (accessed on 27 September 2024).
- Centers for Disease Control and Prevention. Musculoskeletal Disorders. Online, 2020. Available online: https://www.cdc.gov/workplacehealthpromotion/health-strategies/musculoskeletal-disorders/index.html (accessed on 13 January 2023).
- Putz-Anderson, V.; Bernard, B.P.; Burt, S.E.; Cole, L.L.; Fairfield-Estill, C.; Fine, L.J.; Grant, K.A.; Gjessing, C.; Jenkins, L.; Hurrell, J.J., Jr.; et al. Musculoskeletal disorders and workplace factors. Natl. Inst. Occup. Saf. Health (NIOSH) 1997, 104, 97–141. [Google Scholar]
- Rajendran, M.; Sajeev, A.; Shanmugavel, R.; Rajpradeesh, T. Ergonomic evaluation of workers during manual material handling. Mater. Today Proc. 2021, 46, 7770–7776. [Google Scholar] [CrossRef]
- Garg, A.; Boda, S.; Hegmann, K.T.; Moore, J.S.; Kapellusch, J.M.; Bhoyar, P.; Thiese, M.S.; Merryweather, A.; Deckow-Schaefer, G.; Bloswick, D.; et al. The NIOSH lifting equation and low-back pain, Part 1: Association with low-back pain in the backworks prospective cohort study. Hum. Factors 2014, 56, 6–28. [Google Scholar] [CrossRef] [PubMed]
- Hafez, K. The Influence of Lifting Horizontal Distance Measurement Error on NIOSH Lifting Equation Assessment Outcomes. Phys. Ergon. Hum. Factors 2022, 63, 170–178. [Google Scholar]
- Donisi, L.; Cesarelli, G.; Coccia, A.; Panigazzi, M.; Capodaglio, E.M.; D’Addio, G. Work-related risk assessment according to the revised NIOSH lifting equation: A preliminary study using a wearable inertial sensor and machine learning. Sensors 2021, 21, 2593. [Google Scholar] [CrossRef] [PubMed]
- Greene, R.L.; Chen, G.; Lu, M.L.; Hen Hu, Y.; Radwin, R.G. Enhancing the Revised NIOSH Lifting Equation using ComputerVision. In Proceedings of the Human Factors and Ergonomics Society Annual Meeting; SAGE Publications Sage CA: Los Angeles, CA, USA,, 2021; Online; Volume 65, pp. 467–471. Available online: https://journals.sagepub.com/doi/10.1177/1071181321651211 (accessed on 27 September 2024).
- Spector, J.T.; Lieblich, M.; Bao, S.; McQuade, K.; Hughes, M. Automation of workplace lifting hazard assessment for musculoskeletal injury prevention. Ann. Occup. Environ. Med. 2014, 26, 15. [Google Scholar] [CrossRef] [PubMed]
- Harari, Y.; Bechar, A.; Riemer, R. Workers’ biomechanical loads and kinematics during multiple-task manual material handling. Appl. Ergon. 2020, 83, 102985. [Google Scholar] [CrossRef]
- Akhmad, S.; Arendra, A.; Findiastuti, W.; Lumintu, I.; Pramudita, Y.D.; Mualim. Wearable IMU Wireless Sensors Network for Smart Instrument of Ergonomic Risk Assessment. In Proceedings of the 2020 6th Information Technology International Seminar (ITIS), Surabaya, Indonesia, 14–16 October 2020; pp. 213–218. [Google Scholar] [CrossRef]
- Muller, A.; Corbeil, P. Back loading estimation during team handling: Is the use of only motion data sufficient? PLoS ONE 2020, 15, e0244405. [Google Scholar] [CrossRef]
- Skals, S.; Bláfoss, R.; de Zee, M.; Andersen, L.L.; Andersen, M.S. Effects of load mass and position on the dynamic loading of the knees, shoulders and lumbar spine during lifting: A musculoskeletal modelling approach. Appl. Ergon. 2021, 96, 103491. [Google Scholar] [CrossRef] [PubMed]
- Mendívil, J.A.G.; Rodríguez-Paz, M.X.; Caballero-Montes, E.; Zamora-Hernandez, I. Defining optimal lifting loads using augmented reality and internet of things. Hum. Factors Syst. Interact. 2023, 84. [Google Scholar] [CrossRef]
- Superintendencia de Seguridad Social. Guía Técnica: Manejo Manual de Carga; Superintendency of Social Security, SUSESO: Santiago, Chile, 2021. [Google Scholar]
- Retamal, G.; Gutiérrez, M.; Gómez, B.; Aqueveque, P.; Peña, G.; Baquedano, D. Desarrollo de plataforma para evaluar riesgo de trastornos musculoesqueléticos en actividades de manipulación manual de carga-resultados preliminares. Ergon. Investig. Desarro. 2022, 4, 54–67. [Google Scholar] [CrossRef]
- Gutiérrez Henríquez, M.; Aqueveque Navarro, P.; Gómez Arias, B.; Figueroa Galindo, F. Diseño de Maniquí Informático para la Representación Gráfica de Posturas: Ergonomía y Diseño. Atacama Journal of Health Sciences, 1. Online, 2022. Available online: https://salud.uda.cl/ajhs/index.php/ajhs/article/view/56 (accessed on 27 September 2024).
- Castellucci, I.; Viviani, C.; Martínez, M. Tablas de Antropometría de la Población Trabajadora chilena; Universidad de Valparíaso, Mutual de Seguridad: Viña del Mar, Chile, 2017. [Google Scholar]
- Pheasant, S.; Haslegrave, C.M. Bodyspace: Anthropometry, Ergonomics and the Design of Work; CRC Press: Boca Raton, FL, USA, 2018. [Google Scholar]
- Waters, T.R.; Putz-Anderson, V.; Garg, A.; Fine, L.J. Revised NIOSH equation for the design and evaluation of manual lifting tasks. Ergonomics 1993, 36, 749–776. [Google Scholar] [CrossRef]
- Mavor, M.P.; Ross, G.B.; Clouthier, A.L.; Karakolis, T.; Graham, R.B. Validation of an IMU suit for military-based tasks. Sensors 2020, 20, 4280. [Google Scholar] [CrossRef] [PubMed]
- Zügner, R.; Tranberg, R.; Timperley, J.; Hodgins, D.; Mohaddes, M.; Kärrholm, J. Validation of inertial measurement units with optical tracking system in patients operated with Total hip arthroplasty. BMC Musculoskelet. Disord. 2019, 20, 52. [Google Scholar] [CrossRef]
- Robert-Lachaine, X.; Mecheri, H.; Larue, C.; Plamondon, A. Validation of inertial measurement units with an optoelectronic system for whole-body motion analysis. Med Biol. Eng. Comput. 2017, 55, 609–619. [Google Scholar] [CrossRef]
- Mündermann, L.; Corazza, S.; Andriacchi, T.P. The evolution of methods for the capture of human movement leading to markerless motion capture for biomechanical applications. J. Neuroeng. Rehabil. 2006, 3, 1–11. [Google Scholar] [CrossRef] [PubMed]
- Bravo, D.; Rengifo, C.; Agredo, W. Comparación de dos Sistemas de Captura de Movimiento por medio de las Trayectorias Articulares de Marcha. Rev. Mex. Ing. Biomed. 2016, 37, 149–160. [Google Scholar]
- Furtado, J.S.; Liu, H.H.; Lai, G.; Lacheray, H.; Desouza-Coelho, J. Comparative analysis of optitrack motion capture systems. In Proceedings of the Advances in Motion Sensing and Control for Robotic Applications: Selected Papers from the Symposium on Mechatronics, Robotics, and Control (SMRC’18)-CSME International Congress 2018, Toronto, ON, Canada, 27–30 May 2018; Springer: Berlin/Heidelberg, Germany, 2019; pp. 15–31. [Google Scholar]
- Alarcón-Aldana, A.C.; Callejas-Cuervo, M.; Bo, A.P.L. Upper limb physical rehabilitation using serious videogames and motion capture systems: A systematic review. Sensors 2020, 20, 5989. [Google Scholar] [CrossRef]
- Corrales, J.A.; Candelas, F.A.; Torres, F. Hybrid tracking of human operators using IMU/UWB data fusion by a Kalman filter. In Proceedings of the 3rd ACM/IEEE International Conference on Human Robot Interaction, Amsterdam, The Netherlands, 12–15 March 2008; pp. 193–200. [Google Scholar]
- Giannini, P.; Bassani, G.; Avizzano, C.A.; Filippeschi, A. Wearable sensor network for biomechanical overload assessment in manual material handling. Sensors 2020, 20, 3877. [Google Scholar] [CrossRef] [PubMed]
- Echeverry, L.L.G.; Henao, A.M.J.; Molina, M.A.R.; Restrepo, S.M.V.; Velásquez, C.A.P.; Bolívar, G.J.S. Human motion capture and analysis systems: A systematic review/Sistemas de captura y análisis de movimiento cinemático humano: Una revisión sistemática. Prospectiva 2018, 16, 24–34. [Google Scholar] [CrossRef]
- Yunus, M.N.H.; Jaafar, M.H.; Mohamed, A.S.A.; Azraai, N.Z.; Hossain, M.S. Implementation of kinetic and kinematic variables in ergonomic risk assessment using motion capture simulation: A review. Int. J. Environ. Res. Public Health 2021, 18, 8342. [Google Scholar] [CrossRef] [PubMed]
- Prisco, G.; Romano, M.; Esposito, F.; Cesarelli, M.; Santone, A.; Donisi, L.; Amato, F. Capability of Machine Learning Algorithms to Classify Safe and Unsafe Postures during Weight Lifting Tasks Using Inertial Sensors. Diagnostics 2024, 14, 576. [Google Scholar] [CrossRef] [PubMed]


Disclaimer/Publisher’s Note: The statements, opinions and data contained in all publications are solely those of the individual author(s) and contributor(s) and not of MDPI and/or the editor(s). MDPI and/or the editor(s) disclaim responsibility for any injury to people or property resulting from any ideas, methods, instructions or products referred to in the content. |
© 2024 by the authors. Licensee MDPI, Basel, Switzerland. This article is an open access article distributed under the terms and conditions of the Creative Commons Attribution (CC BY) license (https://creativecommons.org/licenses/by/4.0/).