Article

Energy Sustainability Indicators for the Use of Biomass as Fuel for the Sugar Industry

by
Reinier Jiménez Borges
1,†,
Luis Angel Iturralde Carrera
2,†,
Eduardo Julio Lopez Bastida
1,†,
José R. García-Martínez
3,†,
Roberto V. Carrillo-Serrano
2,*,† and
Juvenal Rodríguez-Reséndiz
2,*,†
1
Center for Energy and Environment Studies (CEEMA), Faculty of Engineering, University of Cienfuegos Carlos Rafael Rodriguez, Cienfuegos 59430, Cuba
2
Faculty of Engineering, Autonomous University of Querétaro, Querétaro 76010, Mexico
3
Faculty of Electronics and Communications Engineering, Universidad Veracruzana, Poza Rica 93390, Mexico
*
Authors to whom correspondence should be addressed.
These authors contributed equally to this work.
Technologies 2024, 12(3), 36; https://doi.org/10.3390/technologies12030036
Submission received: 9 February 2024 / Revised: 1 March 2024 / Accepted: 6 March 2024 / Published: 8 March 2024
(This article belongs to the Section Environmental Technology)

Abstract

:
There are numerous analytical and/or computational tools for evaluating the energetic sustainability of biomass in the sugar industry. However, the simultaneous integration of the energetic–exergetic and emergetic criteria for such evaluation is still insufficient. The objective of the present work is to propose a range of indicators to evaluate the sustainability of the use of biomass as fuel in the sugar industry. For this purpose, energy, exergy, and emergy evaluation tools were theoretically used as sustainability indicators. They were validated in five variants of different biomass and their mixtures in two studies of technologies used in Cuba for the sugar industry. As a result, the energy method showed, for all variants, an increase in efficiency of about 5% in the VU-40 technology compared to the Retal technology. There is an increase in energy efficiency when considering AHRs of 2.8% or Marabu (Dichrostachys cinerea) (5.3%) compared to the V 1 variant. Through the study of the exergetic efficiency, an increase of 2% was determined in both technologies for the case of the V 1 variant, and an increase in efficiency is observed in the V 2 variant of 5% and the V 3 variant (5.6%) over the V 1 variant. The emergetic method showed superior results for the VU-40 technology over the Retal technology due to higher fuel utilization. In the case of the V 1 variant, there was a 7% increase in the renewability ratio and an 11.07% increase in the sustainability index. This is because more energy is produced per unit of environmental load.

1. Introduction

The World Energy Council defines energy sustainability as a balance between energy security, environmental sustainability, and social equity. In other words, it takes the concept of balance between economic, social, and ecological dimensions for sustainable development to the energy level, recognizing that energy is critical to the development of any society.
In the case of energy sustainability, it seeks the reduction in energy dependence and the guarantee of supply, reduced CO 2 emissions, competitiveness in energy markets and industry, and the affordability of energy prices for the public and the economy [1,2,3].
From a systemic and thermodynamic perspective, the sustainability of an energy system can be accepted as the property of the system that reflects its restorative tendencies in the face of environmental, social, and economic transformations caused by the interaction between the systemic object and the environment [4,5].
World sugarcane production was recorded to amount to 1869 million tons, obtained in a harvested area of 26.4 million hectares, so the average yield was 70.4 tons per hectare, according to Ref. [6]. In Cuba, the total harvested area in the 2020–2021 harvest was approximately 300 Mha, representing only 1.14% of the harvested area worldwide, for a production of 10,200 Mt as well as a yield of approximately 34 t ha . According to Ref. [7], the production of sugarcane bagasse was 2551.2 Mt of sugarcane.
Biomass energy conversion has reached a high level of development in the dizzying race of the technology industry, and is faced with a growing demand for resources and the difficult challenge of evolving and satisfying increasingly demanding users [8,9,10,11,12].
The conversion technologies for these fuels fall into two broad categories, first and second generations, which include thermochemical and biochemical processes [13,14]. Thermochemical processes such as combustion, pyrolysis, and gasification are based on heat as a source of biomass transformation. They are well adapted to dry biomass, particularly straw and wood, where the energy contained is more straightforward to harness [8,15,16].
The literature has numerous studies and methods related to the quantitative estimation of biomass and its utilization for energy and exergy purposes [17,18,19,20,21,22]; however, these studies primarily do not consider an assessment of the associated environmental impact of biomass use.
On the other hand, some methodologies integrate various evaluation criteria for biomass utilization. They also take into account aspects such as price, logistics, and biomass production, but do not evaluate energetic, exergy, or emergy methods [23,24,25,26,27,28,29,30,31].
According to Ref. [32], the use of renewable energy sources in Cuba is currently low since only 4.3% of the country’s electricity is produced with them, where biomass reaches 3.5%. Especially for sugarcane-producing countries, producing energy from sugarcane biomass, consisting of bagasse and agricultural harvesting residues (AHRs), in addition to Dichrostachys cinerea, which are available in areas near these facilities that contribute to the delivery of energy for the National Electroenergy System (NES), represents an excellent opportunity to increase economic efficiency and protect the environment.
No less significant is the environmental impact generated by the use of fossil fuels for power generation; hence, the potential of renewable sources for the country should allow for a greater participation of these sources by 31%, in particular, the role of biomass will represent 9% of power generation.
Current energy needs, given the depletion of fossil fuels, the increase in their cost, as well as the increase in environmental pollution, require alternatives that allow the efficient use of available and usable energy sources from industrial waste, among which bagasse is a leader [33].
In Cuba, at the end of the sugar harvest, there is a significant surplus of sugarcane residue with excellent physical, chemical, and biological properties [34,35], which can be stored adequately for its subsequent use as an energy or electricity carrier [36,37,38,39] as well as for obtaining biofuels under the concept of biorefineries [40].
In Cuba, AHRs constitute 28% of sugarcane straw and bud, which are the most important type of processed biomass and can be used for energy purposes, particularly in low-pressure technologies [41,42,43] as animal feed or to produce other sugarcane derivatives [44,45].
The Dichrostachys cinerea is identified in Cuba as an essential source of biomass for electricity generation, for which large quantities are demanded, which forces the mechanization of its harvest. Its properties obtained under mechanized conditions have not been studied in depth [46,47].
Dichrostachys cinerea exists in Cuba in large quantities at an estimated 1.14 million ha with an average density of 37 t/ha [33]. This has led to its identification as an essential complementary fuel for bioelectric power plants. In the case of AHR and bagasse blends, depending on the availability of one or the other in the literature, several blends were previously reported [21,48,49,50,51].
In the case of the bagasse—Dichrostachys cinerea mixture, it was considered to decrease to 10% since the availability of Dichrostachys cinerea is more limited and the technical data sheet of the technology where the mixture is evaluated recommends considering a minimum of 10% of this biomass.
On the other hand, the use of Dichrostachys cinerea in low-parameter technologies is not justified due to its own particularities and technological characteristics for its use. One of the fundamental guidelines of using additional biomass in bioelectric plants is to be able to generate electricity with biomes all year round and not only in the sugar harvest stage, so in addition to using bagasse as a base fuel, it is advisable to incorporate additional biomass for this purpose. Also, in the sampling stage, it will be possible to cover possible deficiencies in the quantity of bagasse required to supply all the energy needed by the sugar mill. Therefore, this research focuses on determining those indicators to measure energy sustainability in the biomes and mixtures to be used as fuel in the sugar industry.
This article presents several contributions, including the following:
  • It considers various fuels (biomass) within the steam generation process, particularly Dichrostachys cinerea, and compares the energy and exergetic efficiencies of two technologies in the sugar industry.
  • It Proposes an emergetic method applied to the conditions of the study as a fundamental indicator to measure the sustainability of biomass, in correspondence with the evaluated technologies.
  • Fuel mixtures are considered, determining the energy and exergy efficiencies for the evaluated case studies.
This article is structured as follows: Section 1 is the introduction, presenting in general terms the concept of sustainability; moreover, the main studies focused on biomass are detailed, mainly dealing with energy and exergetic quantification. This section also presents the potential of the sugar industry in generating energy from these fuels. Section 2 is the Materials and Methods section, which describes the fuel variants to be considered, their elemental compositions, the technical characteristics of both technologies to be evaluated, and the theoretical foundations of the energetic, exergetic, and emergetic methods. In Section 3, the Results and Discussion section, first, the indicators to measure energy sustainability in the study are proposed. Then, the energy losses for each of the variants are determined, along with the energy and exergetic efficiencies according to each technology, and the leading emergetic indicators are described. Section 4, the Conclusions section, shows the most sustainable variant based on the validation of the indicators obtained.

2. Materials and Methods

Stage 1 first includes a description of the fuels used. The use of sugarcane bagasse, AHR, Dichrostachys cinerea, and blends of this biomass was considered for this study. In the case of AHR and bagasse mixtures, depending on the availability of one or the other in the literature, several mixtures were reported [21,48,49,50], whereby a mixture of 50% bagasse and 50% AHR was considered as an intermediate sample. In the case of the bagasse—Dichrostachys cinerea mixture, the latter was considered to decrease to 10% since the availability of Dichrostachys cinerea is more limited and the technical data sheet of the technology where the mixture is evaluated recommends considering a minimum of 10% of this biomass.
On the other hand, the use of Dichrostachys cinerea in low-parameter technologies is not justified due to its own particularities and technological characteristics for its use. The fuel variants and blends were established as variant V 1 (100% bagasse), variant V 2 (100% AHR), variant V 3 (100% Dichrostachys cinerea), variant V 4 (50% bagasse and 50% AHR), and variant V 5 (90% bagasse and 10% Dichrostachys cinerea), which are grouped in Table 1. The elemental composition required for the thermoenergetic balance is described below.
Variants V 1 , V 2 , and V 4 were considered for the evaluation in the Retal-type G.V, while variants V 1 , V 3 , and V 5 were considered for the VU-40-type G.V. This is due to the particularities of each biomass; for the VU-40-type G.V, it was demonstrated that the use of A H R s was highly corrosive, while Dichrostachys cinerea was not evaluated in the Retal-type G.V due to the characteristics of this fuel and the current technology installed.
Bagasse, AHRs, and Dichrostachys cinerea, in addition to their use from the energy point of view, present possibilities for incorporation and use in other sectors. The elemental composition of the working mass for the biomass considered—where its content is denoted as ash (A) and the average moisture content is denoted as W—in the study is shown in Table 2.

2.1. Description of Technologies

The Retal-type G.V., widely used in the Cuban sugar industry, was considered a combustion technology, with 12.5 kg s and 16.7 kg s , with pressures of 1.9 MPa. Table 3 and Figure 1 show this technology’s technical characteristics and typical installation scheme.
In addition, the G.V VU-40 of 65.28 kg s steam, pressure 8 MPa, and 723.15 K were considered. This G.V is a balanced draft or alternative technology tested with the furnace operating at negative pressure. The structure and casing are designed to withstand furnace pressure variations (implosion or explosion) that could occur due to fan malfunction or fuel firing. The technical characteristics of this technology are presented in Table 4. This biomass will be evaluated for these two technologies, considered as a case study, where the selection corresponds to the fact that the Retal-type G.V. is practically installed in most of the sugar factories in the country and the high-parameter G.V VU-40 is a technology recently installed in a bioelectric plant.

2.2. Direct and Indirect Method to Quantify the Efficiency of a Steam Generator

According to the literature, there are mainly two methods to calculate energy efficiency: the direct method and the indirect method. The latter takes into account a more significant amount of combustion losses [54]. Next, the procedure to determine both methods will be shown.
Direct method: This method relates the heat used, the enthalpy of the superheated steam I v s , and the available heat delivered during combustion of the working mass of the fuel or lower heating power Q i t , as shown in Equation (1).
η t = D v I v s I a a Q i t B c × 100
The determination of the theoretical lower calorific value based on the elemental chemical composition of the biomass is determined using Equation (2):
η Q i t = 339 C t + 1030 H t 109 ( O t S t ) 24 W t
The calculation of the efficiency by the indirect balance method η t is obtained from the following Equation (3):
η η t = 100 ( q 2 + q 3 + q 4 + q 5 + q 6 ) [ % ]
According to Ref. [54], the most efficient losses in the G.V. are the losses due to the sensible heat of the steam generation process, and by radiation and convection, the first one has the most marked influence in the efficiency of this type of technology.
The heat lost through the mass of gases leaving the steam generator represents the significant loss of the system as indicated above, and its relative value is determined as follows via Equation (4):
q 2 = I g s α g s I 0 a f ( 100 q 4 ) Q t d [ % ]

2.3. Exergy Method

The objective of the exergy analysis within an exergy balance is to evaluate the exergy efficiency, defined as the ratio between the exergy used in the product or process and the exergy supplied to the process (Equation (5)):
η e x = E s E e
The physical exergy (Equation (6)) is defined by the maximum total work obtained when the material becomes reversible from its initial state of pressure P i 4 and temperature T i to the state in equilibrium with the environment or to T o and P 0 by the physical process, without changes in its chemical composition.
e x = ( h i h 0 ) T 0 ( s i s 0 )

2.4. Emergetic Method

Emergy modeling includes the definition of the spatiotemporal limits of the system, the actual energy modeling, and the determination of the fundamental indicators based on established and/or calculated transformities [55,56].
Spatiotemporal limits of thermodynamic systems are defined as any spatial region within a prescribed limit selected for the study. They must be established for a given time since this factor determines the flows that cross the system. At this stage, what is needed is the object of analysis and the period during which the assessment will be made. Failure to adequately establish these variables may result in errors in quantifying inputs and outputs consumed and provided by the system, respectively.

Emergetic Modeling

This step consists of the representation using matter and energy flow diagrams using the emergy symbology to represent the interaction between the internal and external sources of the system, as well as the output and feedback flows of the system.
The primary function of this step is to organize the data, making it possible to determine the flows and interactions in the system, highlighting the most relevant ones. The scale and degree of detail may vary depending on the objectives and socio-ecosystem type [57].
Modeling consists of the following steps [57]:
  • Starting from the system boundaries, the system’s main energy inputs and outputs are defined and classified according to their nature (biogeophysical, economic, human, etc.), from left to right, to increase transformity around the system boundary symbol.
  • The system’s internal components and their relationships, both with the inputs and outputs of matter and energy and with each other, are defined, taking care to involve all the elements of the system that regulate the processes that constitute the system’s operation. They are placed under the same criteria as in the previous point.
  • Money flows corresponding to the economic use that some flows of the system may have, such as the inflows of money that move some of the socio-economic components of the system, are included.
  • Degradation corresponding to the second law of thermodynamics is included.
  • The diagram is simplified according to the objectives of the study by aggregating categories at the level of detail to be carried out.
As previously stated, the emergy analysis classifies the inputs of the system into renewable resources (R), non-renewable resources (N), materials of the economy (M), and services of the economy (F). This allows for the calculation of a series of indices that provide information on various system characteristics and enables comparisons between multiple scenarios for managing this from the economic and environmental perspective and the comparison between different systems. These indicators are shown in detail below. Transformity ( T r ) expresses the resources required to obtain a specific product [58]. It is the ratio between the total emergy entering the system (Y) and the emergy of the products leaving ( E p ); its unit is in seJ.
This index reveals the quality of the system; the higher the Tr value, the more emergy is required to generate products. It can be interpreted as the inverse value of the efficiency of an agroecosystem (Y) emergy incorporated by the system and (E) energy of the resource [59]. Equation (7) presents the determination of the transforming process.
T r = Y E p
The specific emergy is defined as the total emergy (Y) per unit mass of the output products (P), so its unit is usually seJ g . As energy is required to concentrate the materials, this unit of emergy value (UEV) increases with the concentration of the substances.
Therefore, elements and compounds not very abundant in nature have a higher specific energy when they are concentrated since more work is required to concentrate them, spatially and chemically [60]. This specific emergy can be obtained using Equation (8):
E m = Y P
The renewability ratio evaluates the sustainability of the production system; it is defined as the ratio between the energy content of renewable resources (R) divided by the total energy used to obtain the product (Y) and expressed as a percentage.
It follows that natural systems will have high values of renewability, while low values of renewability indicate a more significant use of non-renewable natural resources to obtain the product and consequently an increase in the associated economic costs [55].
Therefore, it reflects some aspects of a system’s sustainability or its ability to be driven by local renewable resources because only processes with a high yield ( % R ) are ecologically sustainable. This index is determined by Equation (9):
% R = R Y
The emerging efficiency ratio measures the process’s ability to exploit and make available natural resources for external investment. It looks at the process from a different perspective as it analyzes the appropriation of local resources, which is interpreted as an additional contribution to the economy.
The lowest possible value of the E Y R is 1, which indicates that a process delivers the same amount of energy provided for its operation, so it cannot exploit natural resources.
Therefore, processes with an E Y R equal to 1 or slightly higher do not feed back to the economy significantly in terms of emergy and transform only the resources previously accessed by other processes. By doing so, these processes function more as consumers than creators, fostering opportunities for the growth of the system [60].
Equation (10) shows how to calculate this index:
E Y R = R + N + F F
The environmental load ratio is the ratio between the sum of the non-renewable resources of nature (N) and those of the economy (F) by the renewable resources of nature (R); it is dimensionless. The higher the value of the index, the more significant the system’s environmental impact.
It also indicates that the economic costs of production are higher. Therefore, its final price will increase, making the product or producing areas less competitive with a lower environmental load ratio.
This index is high for systems with high non-renewable inputs or with high environmental emissions and highly technological processes, including increases in the associated economic costs [61]. Equation (11) can be used to obtain this indicator:
E L R = N + F R
If E L R and E Y R are combined, a sustainability index is created to measure the system’s potential contribution ( E Y R ) per unit of load imposed on the local system ( E L R ). This indicator ( E S I ) measures openness and load changes over time in technological processes and economies. This index is determined using Equation (12):
E S I = E Y R E L R

3. Results and Discussion

In the study [62], the authors present several indicators to analyze the sustainability of the sugar industry, grouped into its different aspects or dimensions. However, the indicators presented in the research, grouped in economic, social, and environmental aspects, present a vision from the energy quantification methods to the evaluation of sustainability by considering several fuels or biomass used in the generation of energy in sugar factories. In addition, the emergetic method was applied as a complement to the energy and exergetic analysis to provide a wide range of indicators that contribute to the energy sustainability of the use of these fuels.
Table 5 presents the criteria and sub-criteria to be considered in each evaluation method.
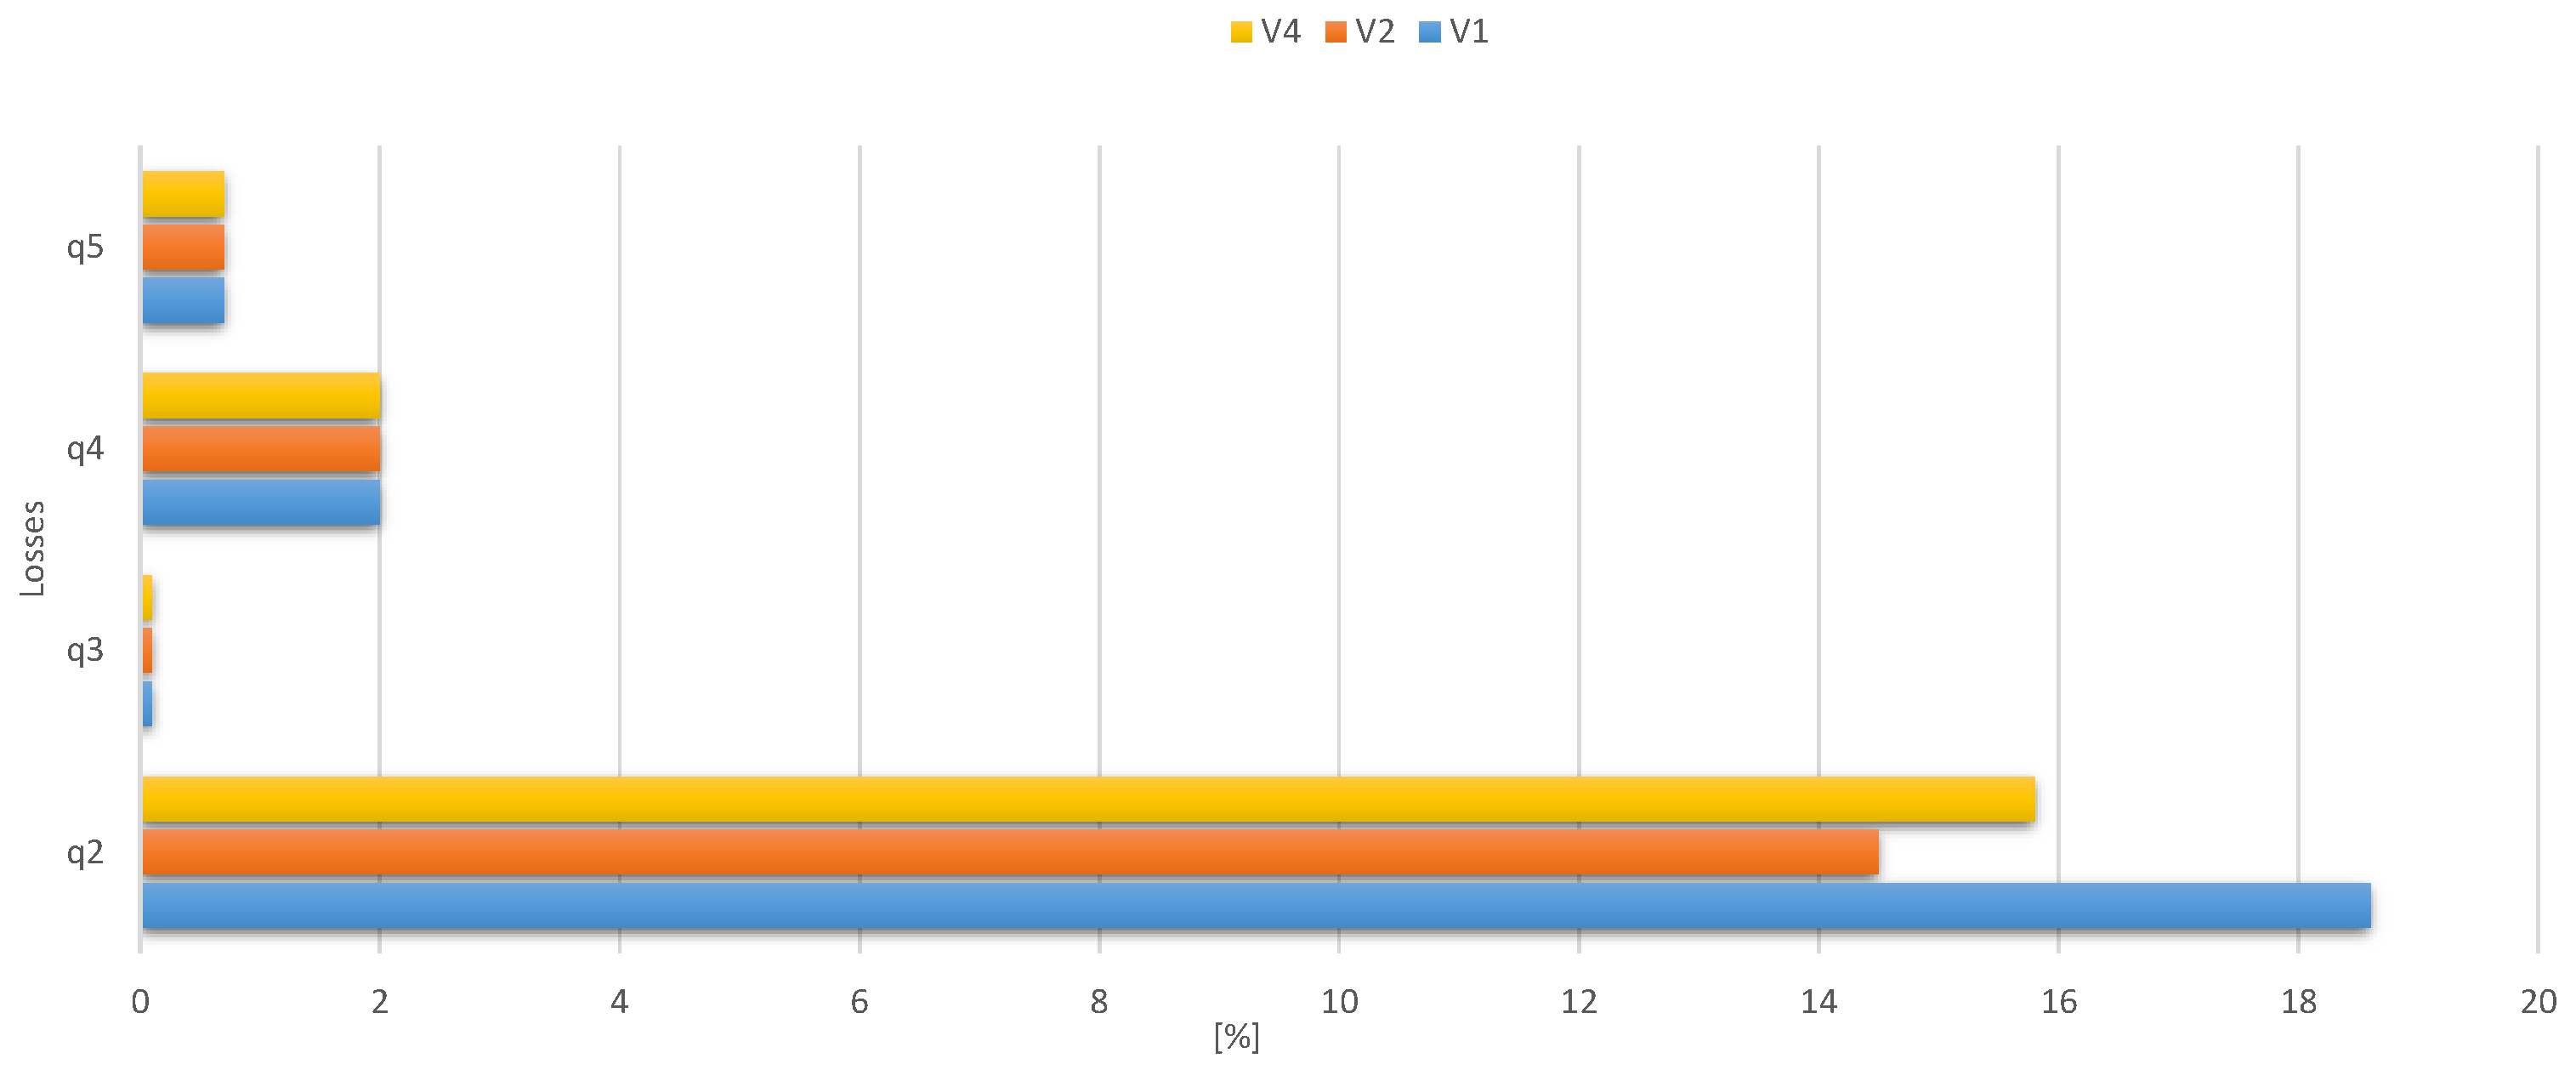
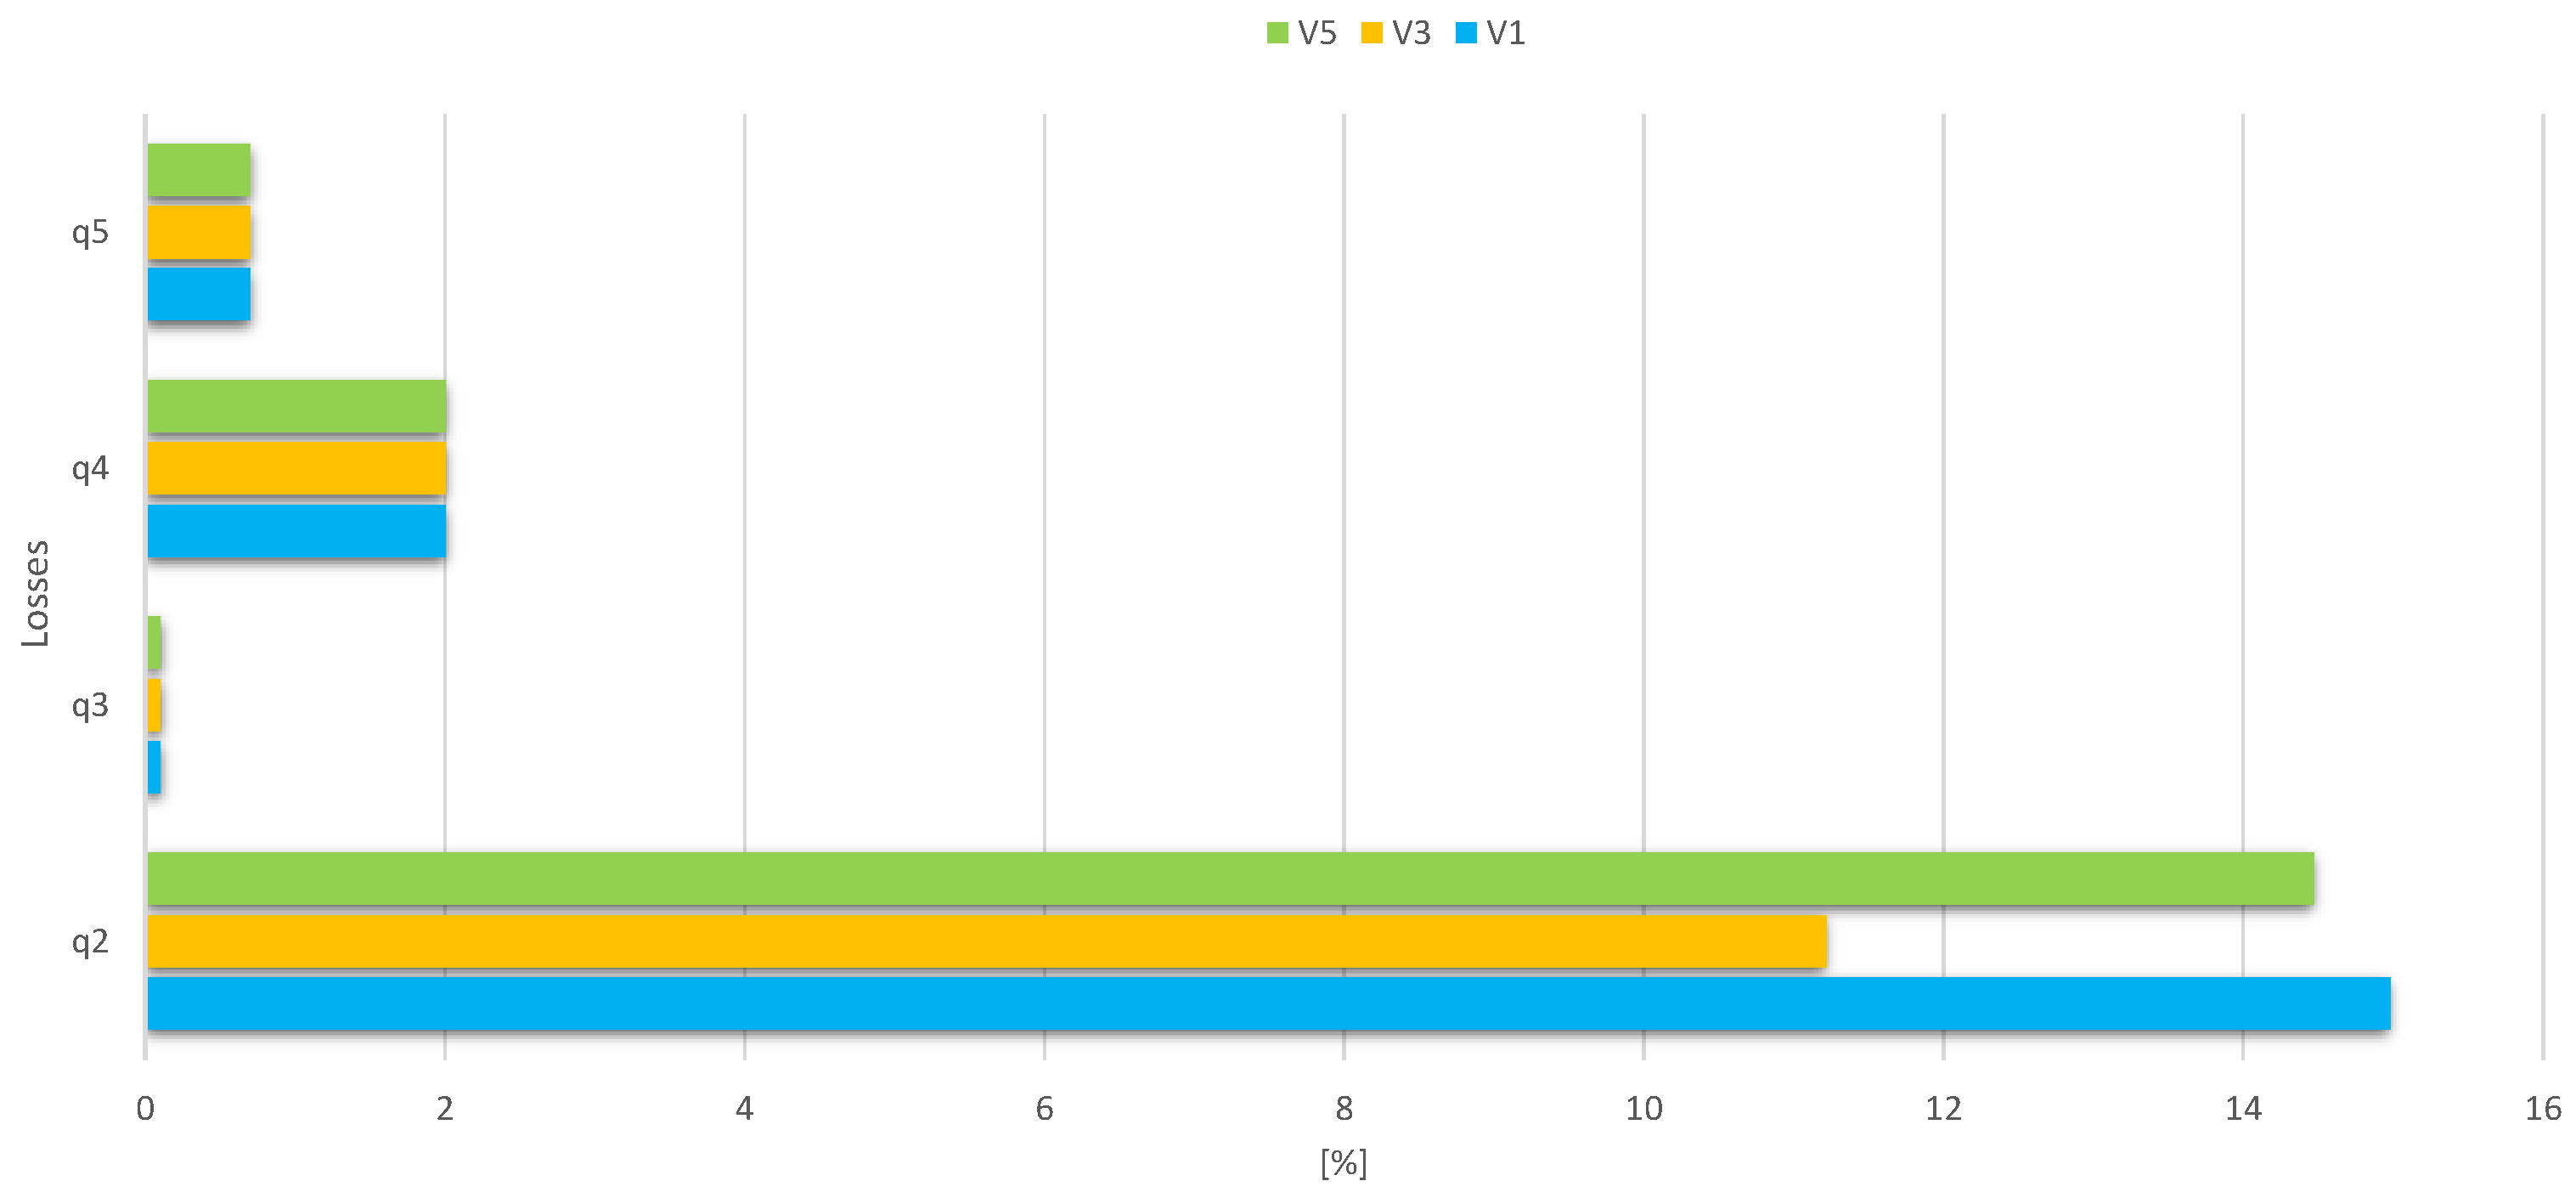
The different losses were first estimated to determine the efficiency of the process. The loss due to the exhaust gases ( q 2 ) depends on the coefficient of excess air at the boiler outlet; for our case study, the coefficient of excess air was set at 1.8 for a VU-40-type G.V and 2 for the Retal-type G.V. Analyzing the energy losses from an environmental point of view determined by the indirect method, we can see that the losses q 3 , q 4 , and q 5 have only a slight decrease from case 2 (Figure 2) to case 1 (Figure 3). However, the loss q 2 in the case of the Retal technology ranges between 14 and 18%, and in the case of the high-pressure variant, the losses range between 11 and 15%. These decreases in losses at the same time bring about similar decreases in CO 2 emissions to the environment and can therefore be considered as an environmental parameter.
For the case studies, the percentage of chemical incombustion losses ( q 3 ), the percentage of mechanical incombustion losses ( q 4 ), and the percentage of external cooling losses ( q 5 ) were determined according to Ref. [54]; all these losses can be seen in Figure 2 and Figure 3 where it is evident that the highest losses correspond to exhaust gas losses as indicated above.
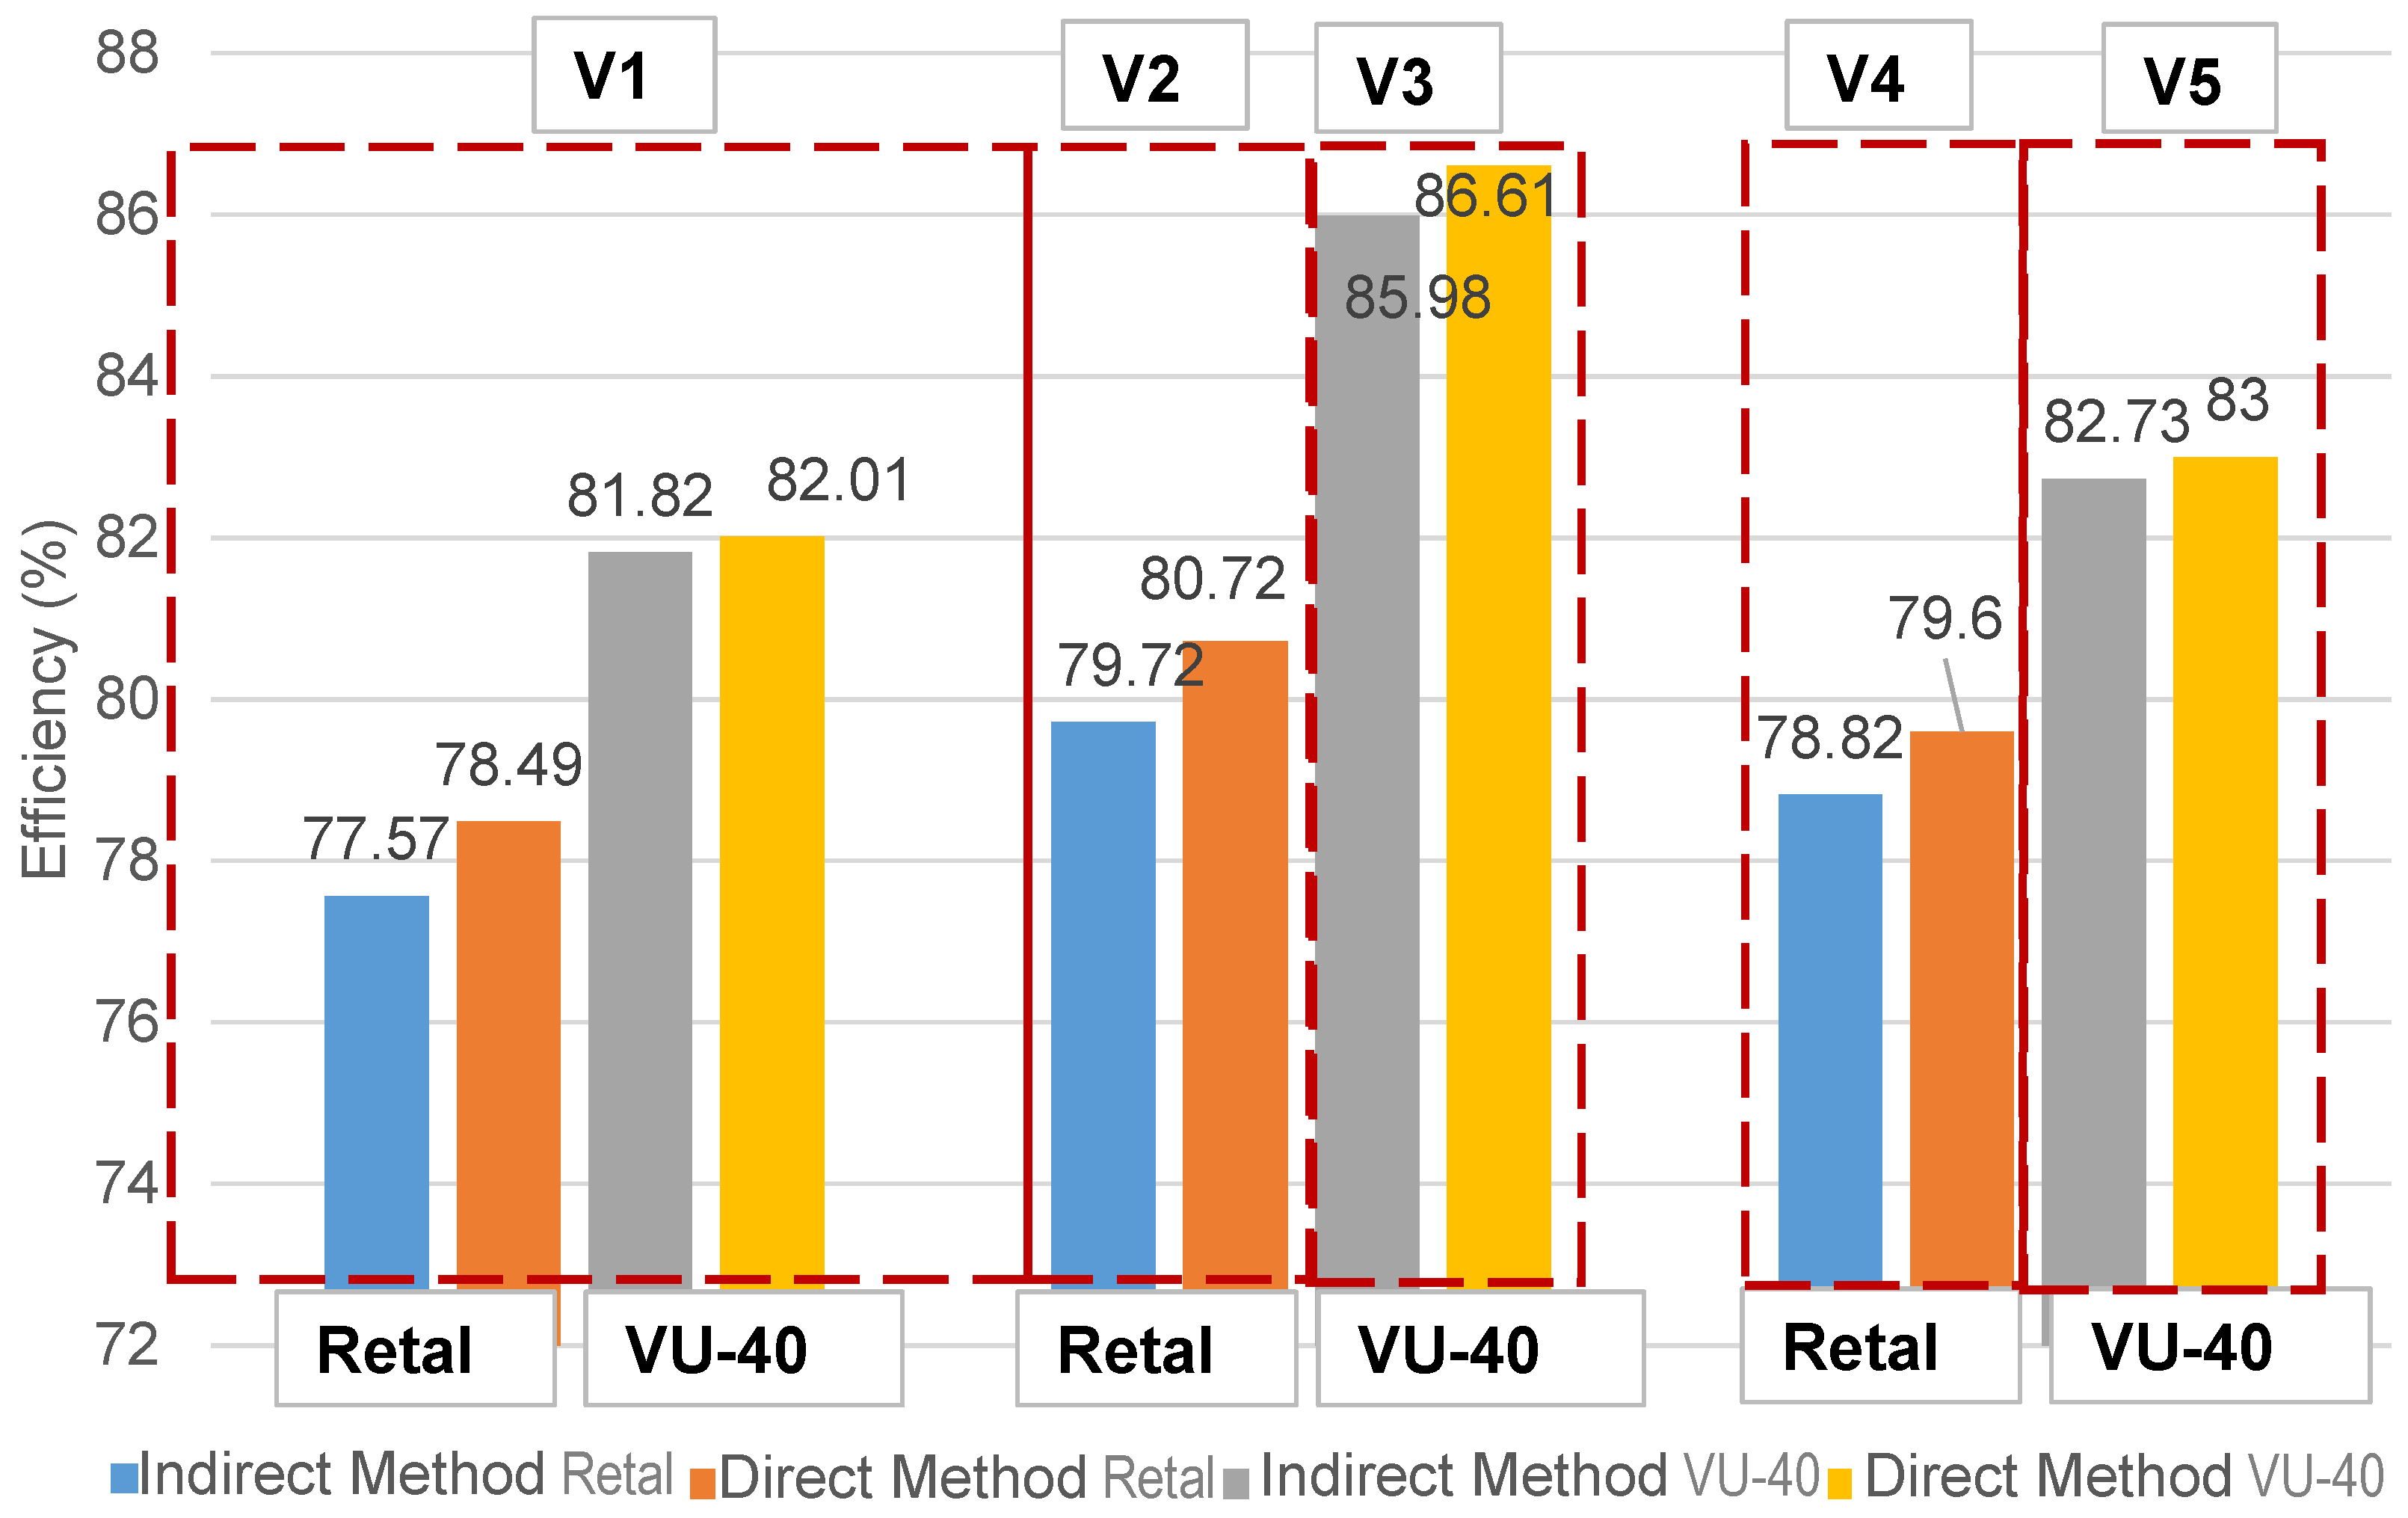
The energy efficiencies were determined for each variable depending on the technology, considering both direct method Equation (1) and indirect method Equation (3), to know the efficiencies of each of the analyzed combinations. Figure 4 shows the results obtained.
Figure 4 shows the energy efficiency for both methods for the two case studies in the variants to be applied. In most cases, there are no significant differences in the results obtained by both methods. From the analysis of the graph, it can be observed that in the case of VU-40 technology, there is an increase of 5.2% on average for the energy efficiency, compared with in the case of V 1 , which was the only one possible to evaluate in the two case studies. Comparing the possible mixtures to work in the Retal, we see that in the case of the AHRs, the efficiencies increase by 2.8%, which can be explained by the fact that the AHRs have higher caloric power and better energy use. V 4 behaved in average values between V 1 and V 2 . In the VU-40 technology, an energy efficiency of 5.3% was also observed for the V 3 variant due to the higher caloric power of the marabou and the possibility of working with less excess air. Meanwhile, the V 5 variant behaved according to the results of the V 1 variant. The energy efficiency results shown in Figure 4 for the case of a G.V of high parameters and with bagasse as fuel are similar to those reported by Refs. [21,63]. Table 6 presents the estimated energy yield values for similar scenarios, highlighting the correspondence with the evaluation provided in this study.
The exergy analysis was evaluated for the different variants and case studies. Starting from Equation (6), the exergies of feedwater, fuels, exhaust gases, and steam produced were calculated for each of the variants depending on the percentage composition of the mixture and the different values of enthalpies, entropies, and conditions of the exhaust gases with the help of the Chemical Logic Steam Tab Companion (CLSTC or Steam Tables) software.
Once the exergies of the inputs and outputs were obtained, the exergy efficiencies were determined using Equation (5). Table 7 shows the values of the calculated efficiencies.
From an economic point of view, for the case of the three variants considering the G.V. Retal type, an exergy efficiency of 29.1% is observed for the case of the AHR compared to the V 1 variant. Of the three possible variants to be evaluated in the G.V VU-40, there is an increase in exergetic efficiency of about 10.9% with the use of Dichrostachys cinerea compared to bagasse.
As shown in Table 7, the highest values of exergy losses are represented by V 1 , with a respective exergy efficiency of 28.35%. Taking into consideration the V 1 variant in both technologies, there is an increase of 5.9% of case 2 compared with case 1. These obtained results are also similar to those reported by Refs. [65,66]. Table 8 presents a summary of the results in the literature and the bibliography consulted to obtain them.
The flows involved in the process were first classified to determine the emerging indicators (Table 9). The analysis takes into account renewable resources (R), non-renewable resources (N), material resources of the economy (M), and services of the economy (S), which are the different inputs and emerging indicators that allow for obtaining this analysis.
Emergenetic modeling starts by delimiting the boundaries of the system under study. Thermodynamic systems are defined as any spatial region within a prescribed boundary selected for study. They must be established for a given time since this factor defines the flows passing through the system.
For this stage, what is needed is the object of analysis and the period during which the evaluation will be performed. The limit of the study is the process of steam generation from biomass, for which it is necessary to define the flows involved.
The energy modeling itself consists of the representation using matter and energy flow diagrams using the symbology described for it to represent the interaction between the internal and external sources of the system, in addition to the output and feedback flows of the system [68,69,70].
The main function of this step is the organization of the data, allowing us to determine the flows and interactions in the system, highlighting the most relevant ones. The scale and degree of detail may vary according to the objectives and the type of ecosystem. Figure 5 presents the emergy diagram for the study.
Legend:
  • E.V: Evaporates perspiration;
  • R 1 : Solar radiation;
  • N 1 : Precipitation;
  • N 2 : Air;
  • M 1 : Fertilizers;
  • M 2 : Pesticides and herbicides;
  • M 3 : Fuels;
  • S: Services;
  • L.H: Human labor;
  • G.V: Steam generation;
  • R.S: Reserve seed;
  • T: Arable land;
  • P.C.A: Sugar cane production;
  • P: Process.
The primary input into the system analyzed, i.e., in the case of bagasse and AHR, is that the sugarcane process conditions are considered. The case of Dichrostachys cinerea was considered as a direct input to the steam generation process and research contribution. Comparing the results obtained for the case of the indicators [71] results in an emergy analysis for sugarcane, where the EYR, ELR, and ESI resulted in 9.51, 5.44, and 1.75, respectively, which are higher than those given in Table 10, because the latter are fundamentally framed in the steam generation process.
From an economic perspective, comparing indicators E 1 and E 2 , as shown in Table 10 in the case of variant V 1 , these represent the lowest cost items, 29.4% lower than in the case of variant V 3 , as well as 24.6% lower than in comparison with V 5 , mainly due to the consideration of the collection and transportation of this biomass.
The indicators described above, although they are considered intermediate, can be said to influence the rest of the energy indicators. The expenses for the VU-40 technology of these indicators taking bagasse as a base are higher by 9.6%; for this technology, the transfer of bagasse from neighboring areas can also be considered.
The renewability index was determined at 62.67%, higher by 25% than the data found in Ref. [72] for the production of bioethanol. The emergetic efficiency index (3.53) was higher than 2, showing that the natural resources are moderately exploited, and was a value higher than the 1.39 given by the authors of Ref. [73] for the case of an energy–environmental assessment of a scenario in Brazil for a biorefinery. In addition, the relatively low value of the environmental load index of the process (2.92) shows that it has a low environmental impact—lower than the 3.1 found in Ref. [73] for a conventional ethanol scheme.
The relationship between the value of the emergy efficiency index (EYR) and the environmental load index (ELR) is reflected in the emergy sustainability index (ESI = 5.96). This shows that, in the long term, the system is sustainable by itself because this value is higher than 5, whereas in Ref. [72], an emergy assessment of biomass determined the ESI to be lower than 1; however, the value obtained gives proof that the system contributes moderately to the economy.
In the analysis of the emerging indicators for the case of variant V 3 , this results in a renewability index (R = 42.54), which is 32.1% lower than in the case of V 1 , and the emerging efficiency index (EYR = 2.01) indicates that local natural resources are moderately exploited during the process.
The environmental impact is not so significant compared to other processes due to the low value of the ecological load ratio (ELR = 3.97), despite being higher by 26.4% compared to bagasse, and the existing impact must be evaluated by considering the surrounding areas. Despite the above, the Emerging Sustainability Index (ESI) indicates that in the long term, the system is not sustainable by itself (ESI < 5). Table 11 presents the emergence indicators for the different variants of biomasses in a Retal-type G.V. As can be seen in this type of G.V., the use of bagasse is more favorable in the long term than other additional fuels; however, the bagasse–AHR mixture, according to the indicators obtained, may present an opportunity for utilization.
On the other hand, in the bagasse–AHR mixture, the renewability ratio (23.58%) is higher by 18.77% compared with that found in Ref. [74]. Nevertheless, in both cases, its use is undoubtedly lower than the use of bagasse. The collection and cost of collecting the AHR has an impact on the renewability of the system, and the ratio of energy efficiency (1.31) shows that the system exploits natural resources in a much smaller amount. This is because the cost of AHR collection and transportation is higher than that of bagasse.
In the case of the environmental load index (3.24), it shows that it has a higher impact on the environment compared to bagasse; additionally, Ref. [74] also indicates a higher environmental impact in the case of AHR, at 4.33. However, its value that is close to 2 shows that it also has a low environmental impact.
The emergent sustainability index for the bagasse–AHR mixture has a relatively low value, ESI = 0.40, which shows that it is not sustainable in the long term.
Comparing the indicators obtained for the biomass mixtures in a Retal-type G.V (Table 11) with those obtained for the case of a VU-40-type G.V (Table 10), it is observed that the consideration of bagasse as base fuel plays a decisive role, presenting timely indicators in both evaluation study cases.

4. Conclusions

The energetic method showed, for all variants, an increase in efficiency of about 5% in the VU-40 technology compared with the Retal technology. There is an increase in energy efficiencies when considering the AHRs of 2.8% or Dichrostachys cinerea (5.3%) compared to the V 1 variant, which can be mainly explained by the higher calorific value of the fuel and other possible causes.
The study of the exergy efficiency showed an increase of 2% in both technologies in the case of the V 1 variant, an increase in efficiency of 5% in the V 2 variant, and 5.6% in the V3 variant over the V 1 variant.
The emergetic method showed superior results for the VU-40 technology over the Retal technology due to higher fuel utilization. In the case of the V 1 variant, there is a 7% increase in the renewability ratio and an 11.07% increase in the sustainability index. This is because more energy is produced per unit of environmental load.
This article presents several contributions, as follows:
  • This study considered various fuels (biomass) within the steam generation process, particularly Dichrostachys cinerea, and compared energy and exergetic efficiencies of two technologies in the sugar industry.
  • It proposed the emergetic method applied to the conditions of the study as fundamental indicators to measure the sustainability of biomass in correspondence with the evaluated technologies.
  • Fuel mixtures were considered, determining the energy and exergy efficiencies for the evaluated case studies.

Author Contributions

Conceptualization, R.J.B., L.A.I.C. and E.J.L.B.; Methodology, R.J.B., L.A.I.C., R.V.C.-S. and J.R.-R.; Software, R.J.B.; Validation, J.R.-R., R.V.C.-S. and J.R.G.-M.; Formal analysis, J.R.-R., R.V.C.-S. and J.R.G.-M.; Investigation, R.J.B., L.A.I.C. and E.J.L.B.; Resources, J.R.-R., J.R.G.-M. and R.V.C.-S.; Data curation, R.J.B., L.A.I.C. and E.J.L.B.; Writing original draft preparation, review, and editing, R.J.B., L.A.I.C., E.J.L.B., J.R.G.-M., J.R.-R. and R.V.C.-S. All authors have read and agreed to the published version of the manuscript.

Funding

This research received no external funding.

Institutional Review Board Statement

Not applicable.

Informed Consent Statement

Not applicable.

Data Availability Statement

Data is contained within this article.

Conflicts of Interest

The authors declare no conflicts of interest.

References

  1. Razmjoo, A.; Kaigutha, L.G.; Rad, M.V.; Marzband, M.; Davarpanah, A.; Denai, M. A Technical analysis investigating energy sustainability utilizing reliable renewable energy sources to reduce CO2 emissions in a high potential area. Renew. Energy 2021, 164, 46–57. [Google Scholar] [CrossRef]
  2. Majid, M. Renewable energy for sustainable development in India: Current status, future prospects, challenges, employment, and investment opportunities. Energy Sustain. Soc. 2020, 10, 1–36. [Google Scholar]
  3. Østergaard, P.A.; Duic, N.; Noorollahi, Y.; Kalogirou, S. Renewable energy for sustainable development. Renew. Energy 2022, 199, 1145–1152. [Google Scholar] [CrossRef]
  4. Zakari, A.; Khan, I.; Tan, D.; Alvarado, R.; Dagar, V. Energy efficiency and sustainable development goals (SDGs). Energy 2022, 239, 122365. [Google Scholar] [CrossRef]
  5. Khan, I.; Hou, F.; Zakari, A.; Tawiah, V.K. The dynamic links among energy transitions, energy consumption, and sustainable economic growth: A novel framework for IEA countries. Energy 2021, 222, 119935. [Google Scholar] [CrossRef]
  6. OECD; FAO. OCDE-FAO Perspectivas Agrícolas 2021–2030; OECD: Paris, France, 2021. [Google Scholar] [CrossRef]
  7. ONEI-CUBA. Anuario Estadístico de Cuba; Republic of Cuba: Havana, Cuba, 2019.
  8. Capareda, S. Introduction to Biomass Energy Conversions; CRC Press: Boca Raton, FL, USA, 2023. [Google Scholar]
  9. Ong, H.C.; Chen, W.H.; Singh, Y.; Gan, Y.Y.; Chen, C.Y.; Show, P.L. A state-of-the-art review on thermochemical conversion of biomass for biofuel production: A TG-FTIR approach. Energy Convers. Manag. 2020, 209, 112634. [Google Scholar] [CrossRef]
  10. Jekayinfa, S.O.; Orisaleye, J.I.; Pecenka, R. An assessment of potential resources for biomass energy in Nigeria. Resources 2020, 9, 92. [Google Scholar] [CrossRef]
  11. Irfan, M.; Zhao, Z.Y.; Panjwani, M.K.; Mangi, F.H.; Li, H.; Jan, A.; Ahmad, M.; Rehman, A. Assessing the energy dynamics of Pakistan: Prospects of biomass energy. Energy Rep. 2020, 6, 80–93. [Google Scholar] [CrossRef]
  12. Das, P.; Chandramohan, V.; Mathimani, T.; Pugazhendhi, A. A comprehensive review on the factors affecting thermochemical conversion efficiency of algal biomass to energy. Sci. Total Environ. 2021, 766, 144213. [Google Scholar] [CrossRef]
  13. Banu, J.R.; Sharmila, V.G.; Ushani, U.; Amudha, V.; Kumar, G. Impervious and influence in the liquid fuel production from municipal plastic waste through thermo-chemical biomass conversion technologies-A review. Sci. Total Environ. 2020, 718, 137287. [Google Scholar] [CrossRef]
  14. Shahbaz, M.; AlNouss, A.; Ghiat, I.; Mckay, G.; Mackey, H.; Elkhalifa, S.; Al-Ansari, T. A comprehensive review of biomass based thermochemical conversion technologies integrated with CO2 capture and utilisation within BECCS networks. Resour. Conserv. Recycl. 2021, 173, 105734. [Google Scholar] [CrossRef]
  15. Lewandowski, W.M.; Ryms, M.; Kosakowski, W. Thermal biomass conversion: A review. Processes 2020, 8, 516. [Google Scholar] [CrossRef]
  16. Shahbaz, M.; Al-Ansari, T.; Aslam, M.; Khan, Z.; Inayat, A.; Athar, M.; Naqvi, S.R.; Ahmed, M.A.; McKay, G. A state of the art review on biomass processing and conversion technologies to produce hydrogen and its recovery via membrane separation. Int. J. Hydrogen Energy 2020, 45, 15166–15195. [Google Scholar] [CrossRef]
  17. Cavalcanti, E.J.; Carvalho, M.; da Silva, D.R. Energy, exergy and exergoenvironmental analyses of a sugarcane bagasse power cogeneration system. Energy Convers. Manag. 2020, 222, 113232. [Google Scholar] [CrossRef] [PubMed]
  18. Singh, O.K. Exergy analysis of a grid-connected bagasse-based cogeneration plant of sugar factory and exhaust heat utilization for running a cold storage. Renew. Energy 2019, 143, 149–163. [Google Scholar] [CrossRef]
  19. Ameri, M.; Ahmadi, P.; Hamidi, A. Energy, exergy and exergoeconomic analysis of a steam power plant: A case study. Int. J. Energy Res. 2009, 33, 499–512. [Google Scholar] [CrossRef]
  20. Barroso, J.; Barreras, F.; Amaveda, H.; Lozano, A. On the optimization of boiler efficiency using bagasse as fuel. Fuel 2003, 82, 1451–1463. [Google Scholar] [CrossRef]
  21. Guerra, J.P.; Cardoso, F.H.; Nogueira, A.; Kulay, L. Thermodynamic and Environmental Feasibility Analysis of Cogeneration Units Powered by Biomass with a View to Exporting Electricity. Adv. Energy Res. 2020, 2020, 45. [Google Scholar]
  22. Li, Y.; Zhou, L.; Wang, R. Urban biomass and methods of estimating municipal biomass resources. Renew. Sustain. Energy Rev. 2017, 80, 1017–1030. [Google Scholar] [CrossRef]
  23. Vávrová, K.; Knápek, J.; Weger, J.; Králík, T.; Beranovskỳ, J. Model for evaluation of locally available biomass competitiveness for decentralized space heating in villages and small towns. Renew. Energy 2018, 129, 853–865. [Google Scholar] [CrossRef]
  24. Toklu, E. Biomass energy potential and utilization in Turkey. Renew. Energy 2017, 107, 235–244. [Google Scholar] [CrossRef]
  25. Ferreira, S.; Monteiro, E.; Brito, P.; Vilarinho, C. Biomass resources in Portugal: Current status and prospects. Renew. Sustain. Energy Rev. 2017, 78, 1221–1235. [Google Scholar] [CrossRef]
  26. Thomas, P.; Soren, N.; Rumjit, N.P.; James, J.G.; Saravanakumar, M. Biomass resources and potential of anaerobic digestion in Indian scenario. Renew. Sustain. Energy Rev. 2017, 77, 718–730. [Google Scholar] [CrossRef]
  27. Ozturk, M.; Saba, N.; Altay, V.; Iqbal, R.; Hakeem, K.R.; Jawaid, M.; Ibrahim, F.H. Biomass and bioenergy: An overview of the development potential in Turkey and Malaysia. Renew. Sustain. Energy Rev. 2017, 79, 1285–1302. [Google Scholar] [CrossRef]
  28. Suzuki, K.; Tsuji, N.; Shirai, Y.; Hassan, M.A.; Osaki, M. Evaluation of biomass energy potential towards achieving sustainability in biomass energy utilization in Sabah, Malaysia. Biomass Bioenergy 2017, 97, 149–154. [Google Scholar] [CrossRef]
  29. Ozoegwu, C.; Eze, C.; Onwosi, C.; Mgbemene, C.; Ozor, P. Biomass and bioenergy potential of cassava waste in Nigeria: Estimations based partly on rural-level garri processing case studies. Renew. Sustain. Energy Rev. 2017, 72, 625–638. [Google Scholar] [CrossRef]
  30. Ozcan, M.; Öztürk, S.; Oguz, Y. Potential evaluation of biomass-based energy sources for Turkey. Eng. Sci. Technol. Int. J. 2015, 18, 178–184. [Google Scholar] [CrossRef]
  31. Gonzalez-Salazar, M.A.; Venturini, M.; Poganietz, W.R.; Finkenrath, M.; Spina, P.R. Methodology for improving the reliability of biomass energy potential estimation. Biomass Bioenergy 2016, 88, 43–58. [Google Scholar] [CrossRef]
  32. Sánchez, A.A.; Guerra, I.M. Las Energías Verdes. Análisis Desde la Revolución Verde en Cuba. Eur. J. Soc. Law Revue Eur. Droit Soc. 2022, 57, 202–216. [Google Scholar]
  33. Hernández Sardien, A.; González Morales, V.C.M.; Freide Orozco, M.L. Taking advantage of possible biomass sources to deliver more electricity in the fá-factor de az’ucar Antonio Sanchez. Sugar Cent. 2017, 44, 88–97. [Google Scholar]
  34. Garcés Paz, R.V.; Martínez Silva, S.V. Estudio del Poder Calorífico del Bagazo de Caña de Azúcar en la Industria Azucarera de la Zona de Risaralda. Bachelor’s Thesis, Universidad Tecnológica de Pereira, Pereira, Colombia, 2007. [Google Scholar]
  35. Orozco, N.V.B.; Díaz, E.A. Evaluación económica y social del uso del bagazo de caña en la generación de energía eléctrica en Nicaragua. Tecnol. Marcha 2014, 27, 107–121. [Google Scholar]
  36. Solano, I.; Aguilar, O.; Domí-nguez, C.; Ramírez, G.; Aguilar, O.A. Evaluation of the energy–thin performance of the bagasse of a sugar millback bagasse of a sugar mill vs its use using gasification–on. Rev. Sci. Initiat. 2020, 6, 30–35. [Google Scholar]
  37. Rodríguez-Pérez, B.; Contreras-Moya, A.M.; Rosa-Domínguez, E. Comparación ambiental de la generación de energía eléctrica a partir del bagazo y fuel oil. ICIDCA 2014, 48, 70–79. [Google Scholar]
  38. Rodríguez, P.A.; Lombardi, G.; Ometto, A.; Zumalacarregui, L.M.; Pérez, O. Potencialidades de generación de eletricidad a partir de biomasa. Sci. Tech. 2010, 16, 267–271. [Google Scholar]
  39. Villar, J. Alimento animal y energía de la caña de azúcar. ICIDCA 2010, 43, 41–48. [Google Scholar]
  40. Cárdenas, Z.D.; Margarita, L.; Pérez-Ones, O.; Rodríguez-Ramos, P.A.; Cárdenas, Z.D.; María, B.; Lombardi, G. Potential uses of bagasse for ethanol production versus electricity production. Eng. Investig. Tecnol. 2015, 16, 407–418. [Google Scholar]
  41. Muñoz, M. Producción de Pellets Combustibles a Partir de Residuos Agrícolas de la Cosecha de la Caña De Azúcar. In Memoria Presentación de Resultados de Investigación Zafra; Cengicana: Zafra, Spain, 2017; pp. 463–491. [Google Scholar]
  42. Ripoli, T.; Molina, W., Jr.; Stupiello, J.; Nogueira, M.; Saccomano, J. Potencial energético de residuos de cosecha de la caña verde. Piracicaba STAB 1991, 10, 22–26. [Google Scholar]
  43. Mesa, Y.M.; Correa, A.G.; Valdés, R.G.; Alarcón, F.M.; Camacho, M.R. Evaluación económico-energética de la recogida y transportación de los residuos agrícolas cañeros (RAC). Estudio de caso Empresa Azucarera «Héctor Molina Riaño». Rev. Cienc. Tec. Agropecu. 2008, 17, 19–23. [Google Scholar]
  44. Yes-Brizuela, N.; Orozco-Guill’en, E.; Galaán-an Hernández, N.S. Taking advantage of agro-industrial waste and their contribution to the sustainable development of Mexico. Rev. Environ. Sci. Nat. Resour. 2016, 20, 27–41. [Google Scholar]
  45. León-Martínez, T.S.; Dopíco-Ramírez, D.; Triana-Hernández, O.; Medina-Estevez, M. Paja de la caña de azúcar. Sus usos en la actualidad. ICIDCA 2013, 47, 13–22. [Google Scholar]
  46. Rubio-González, A.; Iturria Quintero, P.J.; Rodrí-guez Machín, L.; Palmero Marín, D. Propiedades del Marabu. (Dichrostachs cinerea L.) Cosechated with Máquinas, Combustible Combustil for the Generation Of Electricity (Primera Part). Centro Azucar 2021, 48, 93–104. [Google Scholar]
  47. Cano-Estrella, O.; López-Sánchez, O.; Guerrero-Posada, P.A.; San José-González, P. Evaluación de la calidad de triturado del marabú cortado con una cosechadora forestal. Ing. Agric. 2022, 12, 63–68. [Google Scholar]
  48. Rodríguez Arias, A.D.; Carrasco García, S.Y.; López Bastida, E.J.; Jiménez Borges, R. Metodología para la evaluación del proceso de co/combustión de biomasas a partir de diferentes tecnologías en una caldera retal. Rev. Univ. Soc. 2019, 11, 295–302. [Google Scholar]
  49. Golato, M.A.; Feijóo, E.A.; Franck Colombres, F.J.; Paz, D.; Cárdenas, G.J. Estudio preliminar del aprovechamiento de los residuos agrícolas de cosecha de la caña de azúcar como combustible adicional para calderas bagaceras de Tucumán (Argentina). Rev. Ind. Agric. Tucuman 2017, 94, 21–31. [Google Scholar]
  50. Khattak, S.; Greenough, R.; Sardeshpande, V.; Brown, N. Exergy analysis of a four pan jaggery making process. Energy Rep. 2018, 4, 470–477. [Google Scholar] [CrossRef]
  51. Ameri, M.; Ahmadi, P.; Khanmohammadi, S. Exergy analysis of a 420 MW combined cycle power plant. Int. J. Energy Res. 2008, 32, 175–183. [Google Scholar] [CrossRef]
  52. Rubio González, A.; Clara, V. Estudio de la pérdida de calor por incombustión mecánica volátil en calderas RETAL, mediante simulación aerodinámica. Int. Sugar J. 2019, 100, 32–34. [Google Scholar]
  53. Rodríguez, A.; Rosabal, L.; Martínez, P. Teoría y Práctica de los Procesos de Combustión. In Combustibles Sólidos; Citmatel: La Habana, Cuba, 2000. [Google Scholar]
  54. Rubio-González, A. Generadores de vapor. In Funcionamiento y Explotación; Editorial Feijóo; Universidad Central “Marta Abreu” de Las Villas: Santa Clara, Cuba, 2015; pp. 75–103. [Google Scholar]
  55. Tovar, V.S.; Gutiérrez, L.F.; García, J.A.O. Análisis emergético del policultivo de cachama blanca (Piaractus brachypomus) y bocachico (Prochilodus sp.) en la estación piscicola Vai, municipio de el Doncello–Caquetá–Colombia. Momentos Cienc. 2006, 3. [Google Scholar]
  56. Naredo, J.M. Fundamentos de la economía ecológica. de la Economía Ambiental a la Economía Ecológica; FUHEM: Barcelona, Spain, 1994; pp. 373–399. [Google Scholar]
  57. Lomas Huertas, P.L. Aportaciones de la Sintesis Emergética a la Evaluación Multi-Escalar del Empleo de los Servicios de los Ecosistemas a Través de Casos de Estudio. Ph.D. Thesis, Universidad Autónoma de Madrid, Madrid, Spain, 2009. [Google Scholar]
  58. Haro Sanchez, R.M. Software Libre Para Evaluar la Sostenibilidad de la Agroexportación Peruana por el Método Emergético. Ph.D. Thesis, Universidad Nacional de Trujillo, Trujillo, Peru, 2019. [Google Scholar]
  59. Aguilar-Rivera, N.; Alejandre-Rosas, J.; Espinosa-López, R. Evaluación emergy Y LCA en la agroindustria azucarera de Veracruz, México. Cultiv. Trop. 2015, 36, 144–157. [Google Scholar]
  60. Brown, M.T.; Ulgiati, S. Emergy analysis and environmental accounting. In Encyclopedia of Energy; Elsevier: Amsterdam, The Netherlands, 2004. [Google Scholar]
  61. Cano, N.A.; Céspedes-Zuluaga, S.; Guerrero-Martin, C.; Gallego, D. Exergy and emergy: Complementary tools for assessing the environmental sustainability use of biosolids generated in wastewater-treatment plant for energy-production. Quim. Nova 2022, 45, 4–15. [Google Scholar] [CrossRef]
  62. García-Bustamante, C.A.; Aguilar-Rivera, N.; Zepeda-Pirrón, M.; Armendáriz-Arnez, C. Development of indicators for the sustainability of the sugar industry. Environ. Socio-Econ. Stud. 2018, 6, 22–38. [Google Scholar] [CrossRef]
  63. Cruz, M.; Franck Colombres, F.J.; Golato, M.A.; Morales, W.D.; Paz, D. Improve in the efficiency of high-price bagacera boilers in Argentina, by bagasse drying. Ind. Rev. Agric. Tucuman 2013, 90, 7–16. [Google Scholar]
  64. Franck Colombres, F.J.; Golato, M.A.; Morales, W.D.; Cruz, C.; Paz, D. Rendimiento térmico de calderas bagaceras modernas en Tucumán, R. Argentina. Rev. Ind. Agric. Tucuman 2011, 88, 41–49. [Google Scholar]
  65. Kamate, S.; Gangavati, P. Exergy analysis of cogeneration power plants in sugar industries. Appl. Therm. Eng. 2009, 29, 1187–1194. [Google Scholar] [CrossRef]
  66. Echeverry Arbeláez, A. Análisis Exérgetico y Termoecológico de una Caldera Acuotubular de Bagazo y Carbón en un Ingenio Azucarero del Valle del Cauca. Bachelor’s Thesis, Universidad Autónoma de Occidente, Cali, Colombia, 2017. [Google Scholar]
  67. Fals Acuña, M.M.; Loret de Mola López, M.A.; Alonso Cervantes, D. Análisis exergoeconómico de la planta de cogeneración de la empresa azucarera “Carlos Manuel de Céspedes”. Centro Azucar 2010, 37, 11–17. [Google Scholar]
  68. Brown, M.T.; Ulgiati, S. Updated evaluation of exergy and emergy driving the geobiosphere: A review and refinement of the emergy baseline. Ecol. Model. 2010, 221, 2501–2508. [Google Scholar] [CrossRef]
  69. Brown, M.T.; Ulgiati, S. Can emergy sustainability index be improved? A response to Harizaj. Ecol. Model. 2011, 222, 2034–2035. [Google Scholar] [CrossRef]
  70. Lei, K.; Zhou, S.; Wang, Z. Ecological Emergy Accounting for a Limited System: General Principles and a Case Study of Macao; Springer: Cham, Switzerland, 2014. [Google Scholar]
  71. Amponsah, N.; Hanlon, E.; Izursa, J.; Capece, J. Sugarcane biomass production in south Florida: A comparative emergy assessment of organic soil and mineral soil production systems. J. Environ. Account. Manag. 2014, 2, 302–314. [Google Scholar] [CrossRef]
  72. Mandade, P.; Bakshi, B.R.; Yadav, G. Ethanol from Indian agro-industrial lignocellulosic biomass: An emergy evaluation. Clean Technol. Environ. Policy 2016, 18, 2625–2634. [Google Scholar] [CrossRef]
  73. Agostinho, F.; Ortega, E. Energetic-environmental assessment of a scenario for Brazilian cellulosic ethanol. J. Clean. Prod. 2013, 47, 474–489. [Google Scholar] [CrossRef]
  74. Vitória, E.L.D.; Rodrigues, J.P. Emergy efficiency analysis of sugarcane as a raw material for ethanol production. Rev. Cienc. Agron. 2016, 47, 616–623. [Google Scholar] [CrossRef]
Figure 1. Sketch of a Retal bagasse boiler showing the principal thermal surfaces (numbers) and location of measuring points: (1) furnace grill, (2) spreader stoker, (3) furnace, (4) superheater, (5) drums, (6) generating tubes, (7) air heater, (8) economizer, (9) exhaust gases duct, (10) air supply fan, (11) air extraction fan, (12) smokestack, and (13) the ash hopper in the U-turn of the exhaust gas duct. Letters refer to the measured parameters: A, ash concentration; GA, exhaust gas composition analysis; N, motor power; P, pressure; r, revolutions per minute; R, residual weight; T, temperature; and W, bagasse moisture percentage [20,52].
Technologies 12 00036 g001
Figure 2. Energy losses by the indirect method for Retal-type G.V.
Technologies 12 00036 g002
Figure 3. Energy losses by the indirect method for the G.V. type VU-40.
Technologies 12 00036 g003
Figure 4. Energy efficiency values for both methods in % of the variants evaluated.
Technologies 12 00036 g004
Figure 5. Emergy diagram of the case studies.
Technologies 12 00036 g005
Table 1. Distribution of the variants to be evaluated for the different case studies.
VariantsRetal TechnologyVU-40 Technology
V 1 (100% bagasse)EvaluatedEvaluated
V 2 (100% AHR)EvaluatedNot evaluated (corrosion proven)
V 3 (100% Dichrostachys cinerea)Not evaluated (not adapted for such biomass)Evaluated
V 4 (50% bagasse and 50% AHR)EvaluatedNot evaluated
V 5 (90% bagasse and 10% Dichrostachys cinerea)Not evaluatedEvaluated
Table 2. Elemental composition of the working mass for bagasse, AHR, and Dichrostachys cinerea % [52,53].
BiomassC (%)H (%)O (%)N (%)S (%)A (%)W (%)
Bagasse23.503.0022.920.060.020.5050
AHRs43.705.7544.320.220.065.9515
Dichrostachys cinerea21.36.0441.80.330.032.8023
Table 3. Working parameters of a 12.5 kg s G.V Retal type.
Pressure1.9 MPa
Temperature593.15 K
Steam production (Dv)12.5 kg s
Feed water temperature (Taa)353.15 K
Bagasse fuel consumption (Bc)6.11 kg s
Bagasse consumption for 50%3.05 kg s
AHR consumption for 50%1.71 kg s
Excess air coefficient at boiler outlet (alpha)2
Coefficient of excess air at furnace outlet (alpha Ht)1.8
Flue gas temperature (Tgs)546.89 K
Table 4. Working parameters of a G.V VU-40 of 65.28 kg s , 8.0 MPa, and 723.15 K of steam.
ParametersValue
Nominal capacity65.28   kg s
Design pressure8.0 MPa
Operating pressure6.2 MPa
Steam temperature723.15 K
Feed water temperature410.15 K
Average air temperature299.15 K
Table 5. Criteria and/or sub-criteria to be used in the evaluation.
Sustainability IssuesMethodsSub-Criteria
EconomicEnergyEnergy Efficiency (Direct ( E n 1 ) and Indirect ( E n 2 ) method)
EconomicExergyExergy Efficiency ( E x 1 )
EconomicEmergyMaterials of the Economy ( E 1 ); Services of the Economy ( E 2 )
EnvironmentalEnergyEnergy Losses ( P E ) Energy Efficiency
EnvironmentalExergyEnergy Efficiency ( E x 1 )
EnvironmentalEmergyRenewability Ratio ( E m 1 ); Sustainability Index ( E m 2 ); Environmental Burden Ratio ( E m 3 ); Energy Efficiency ( E m 4 )
SocialEmergyMaterials Economics ( E 1 ); Services Economics ( E 2 ); Human Labor ( S 1 )
Table 6. Energy efficiency values and bibliography consulted.
Energy Efficiency [%]Type of TechnologySource Consulted
77–88High parameters (pressure and temperature) [21]
86High parameters (pressure and temperature) [64]
76–80Retal [52]
77.9Retal [20]
Table 7. Exergy efficiency values as a function of technology.
Variants [%]Exergy Efficiency of Steam Generator Retal [%]Exergy Efficiency of Steam Generator VU-40 [%]
V 1 26.6928.35
V 2 37.68-
V 3 -31.81
V 4 32.18-
V 5 -29.11
Table 8. Exergy efficiency values and the literature consulted.
Exergy Efficiency [%]Type of TechnologySource Consulted
21–35.7High parameters (pressure and temperature) [65]
23.2High parameters (pressure and temperature) [67]
22High parameters (pressure and temperature) [66]
Table 9. Main streams within the process required for emergy assessment.
FlowsBagasseBagasse–AHRDichrostachys cinereaUnit/YearClassification
Air7.5453E+139.7185E+131.20078E+14JR.
Bagasse6.1600E+073.0800E+07-kgR
AHR-1.7224E+07-kgR
Dichrostachys cinerea--5.6E+07kgR
Water1.2600E+081.2600E+081.2600E+11kgN
Cost RT bagasse4.6200E+079.2400E+07-M
RT Dichrostachys cinerea cost--1.0528E+06$M
Cost of water4.1580E+044.1580E+044.1580E+04$M
Maintenance2.8000E+022.8000E+022.8000E+02$S
Human labor1.2056E+071.3012E+071.6012E+07JS
RT bagasse/AHR cost-2.3192E+08-MM
Table 10. Emerging indicators for the use of biomass in a VU-40-type G.V.
Emergetic Indicators V 1 V 3 V 5
Renewability Ratio (R)62.6742.5450.22
Energy Efficiency Ratio (EYR)3.532.012.46
Environmental Load Ratio (ELR)2.923.973.01
Emerging Sustainability Index (ESI)5.962.723.91
Economy Materials (E1)5.1100E+077.2400E+076.7800E+07
Economy Services (E2)2.9000E+023.7100E+022.8600E+02
Human Labor (S1)1.4256E+071.6012E+071.5832E+07
Table 11. Emergetic indicators for the use of biomass in a Retal-type G.V.
Emergy Indicators V 1 V 2 V 4
Renewability Ratio (%R)58.0423.5839.55
Energy Efficiency Ratio (EYR)2.381.312.28
Environmental Load Ratio (ELR)0.723.241.53
Emerging Sustainability Index (ESI)5.300.401.49
Economy Materials (E1)4.6200E+079.2400E+076.1300E+07
Economy Services (E2)2.8000E+023.0100E+022.8700E+02
Human Labor (S1)1.2056E+071.3012E+071.2532E+07
Disclaimer/Publisher’s Note: The statements, opinions and data contained in all publications are solely those of the individual author(s) and contributor(s) and not of MDPI and/or the editor(s). MDPI and/or the editor(s) disclaim responsibility for any injury to people or property resulting from any ideas, methods, instructions or products referred to in the content.

