
Experimental and Numerical Analysis of a Novel Cycloid-Type Rotor versus S-Type Rotor for Vertical-Axis Wind Turbine

 , , , , and
Abstract
:1. Introduction
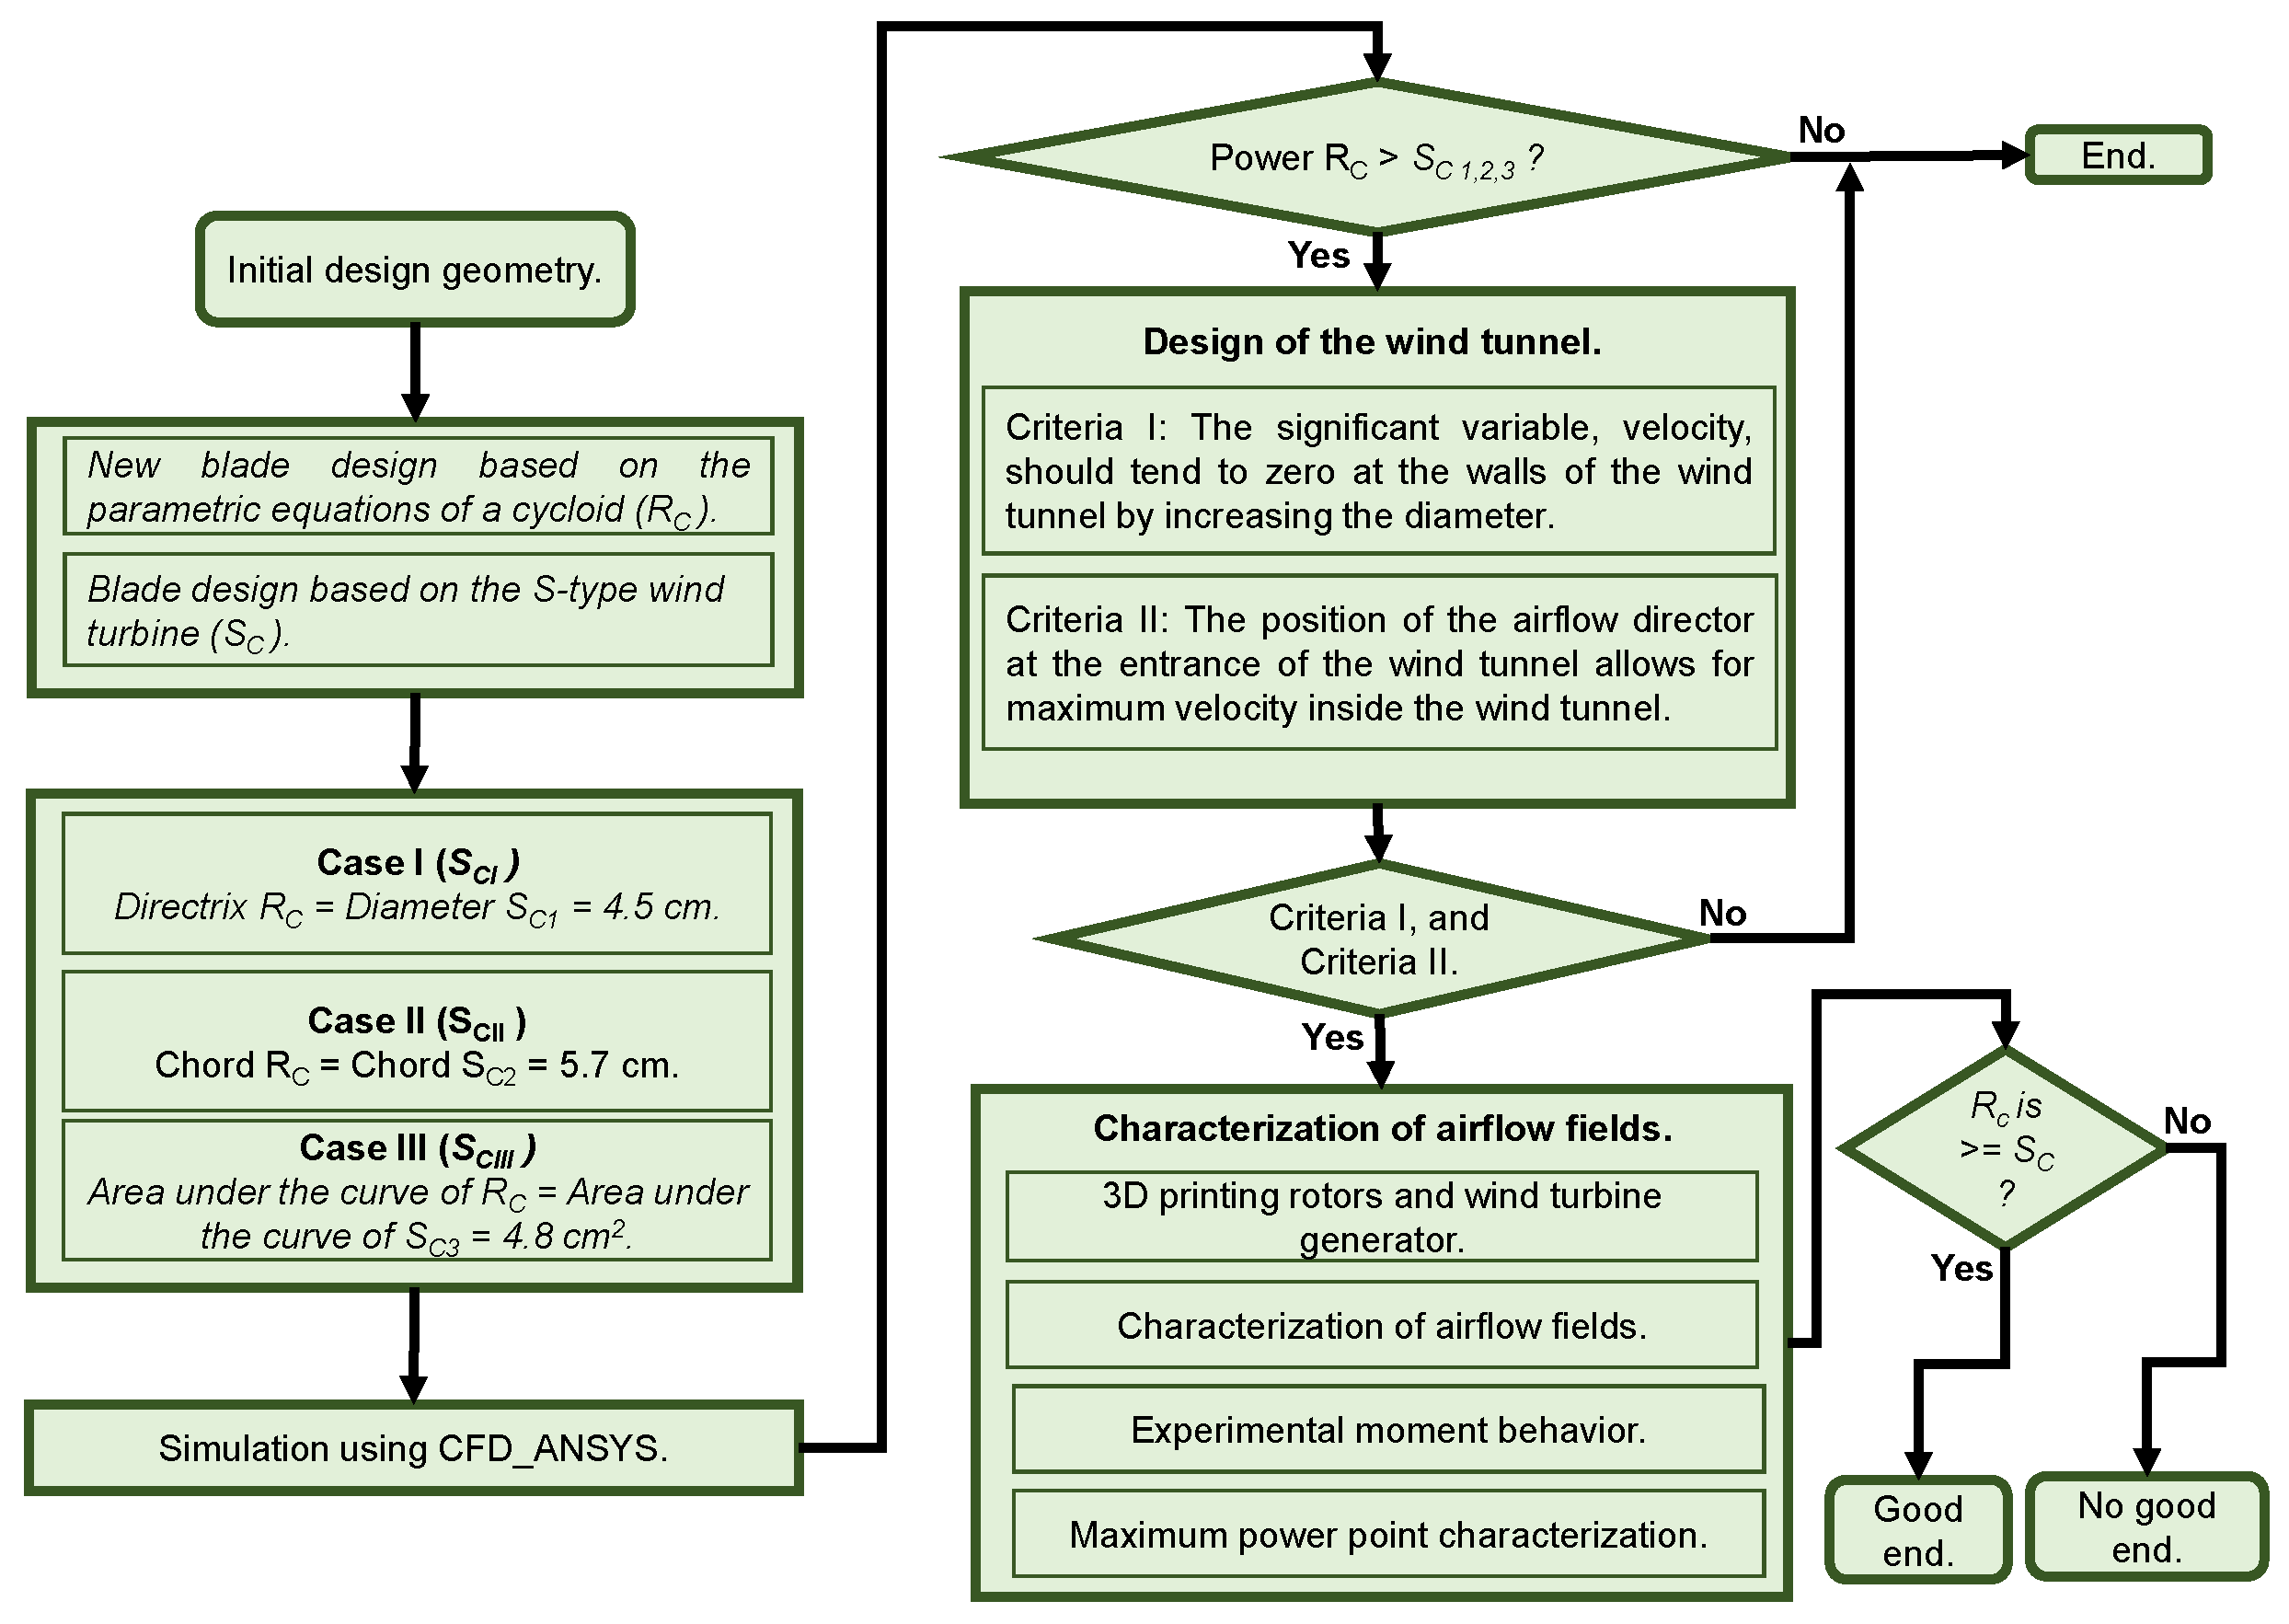
2. Methods
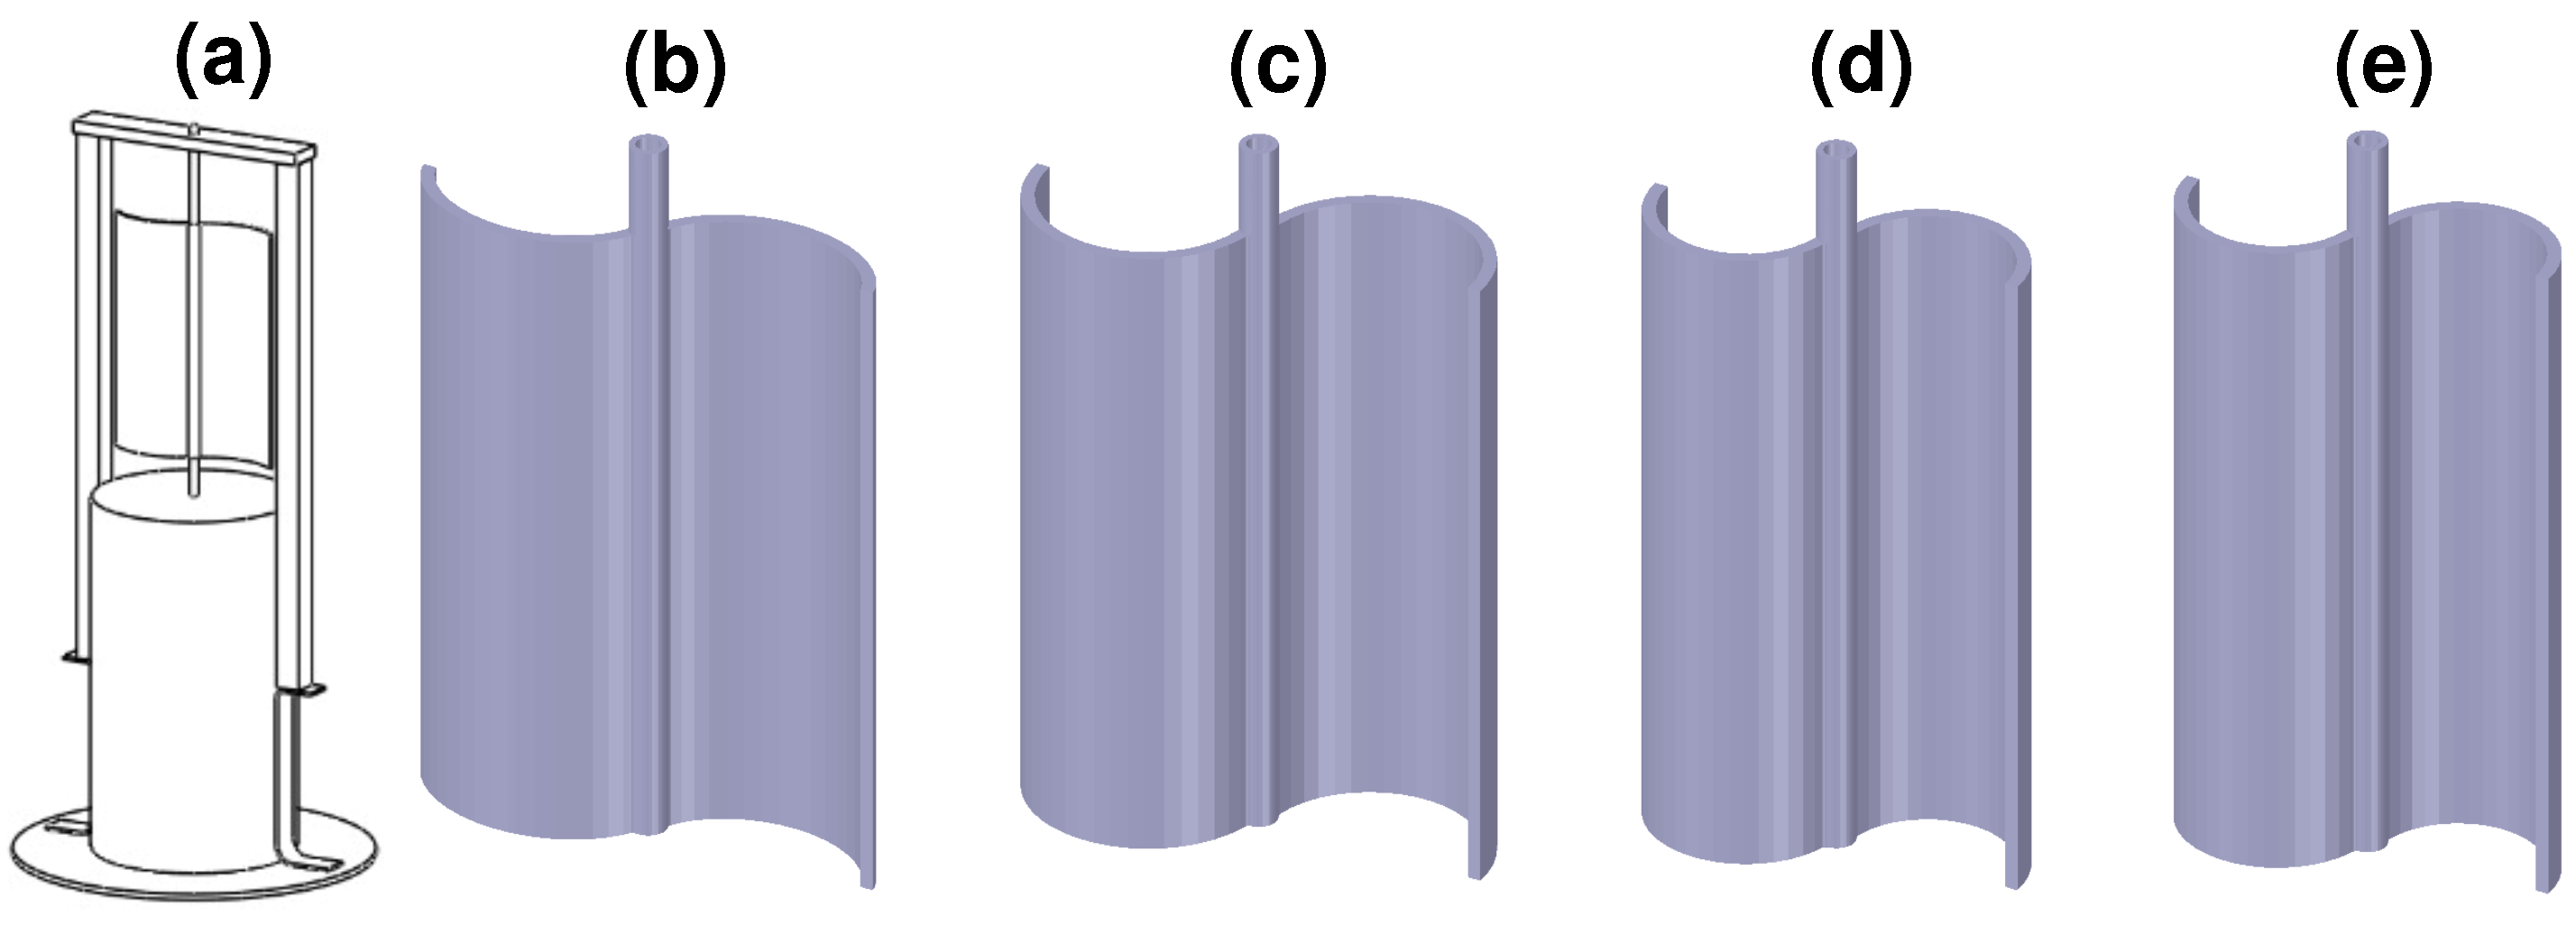
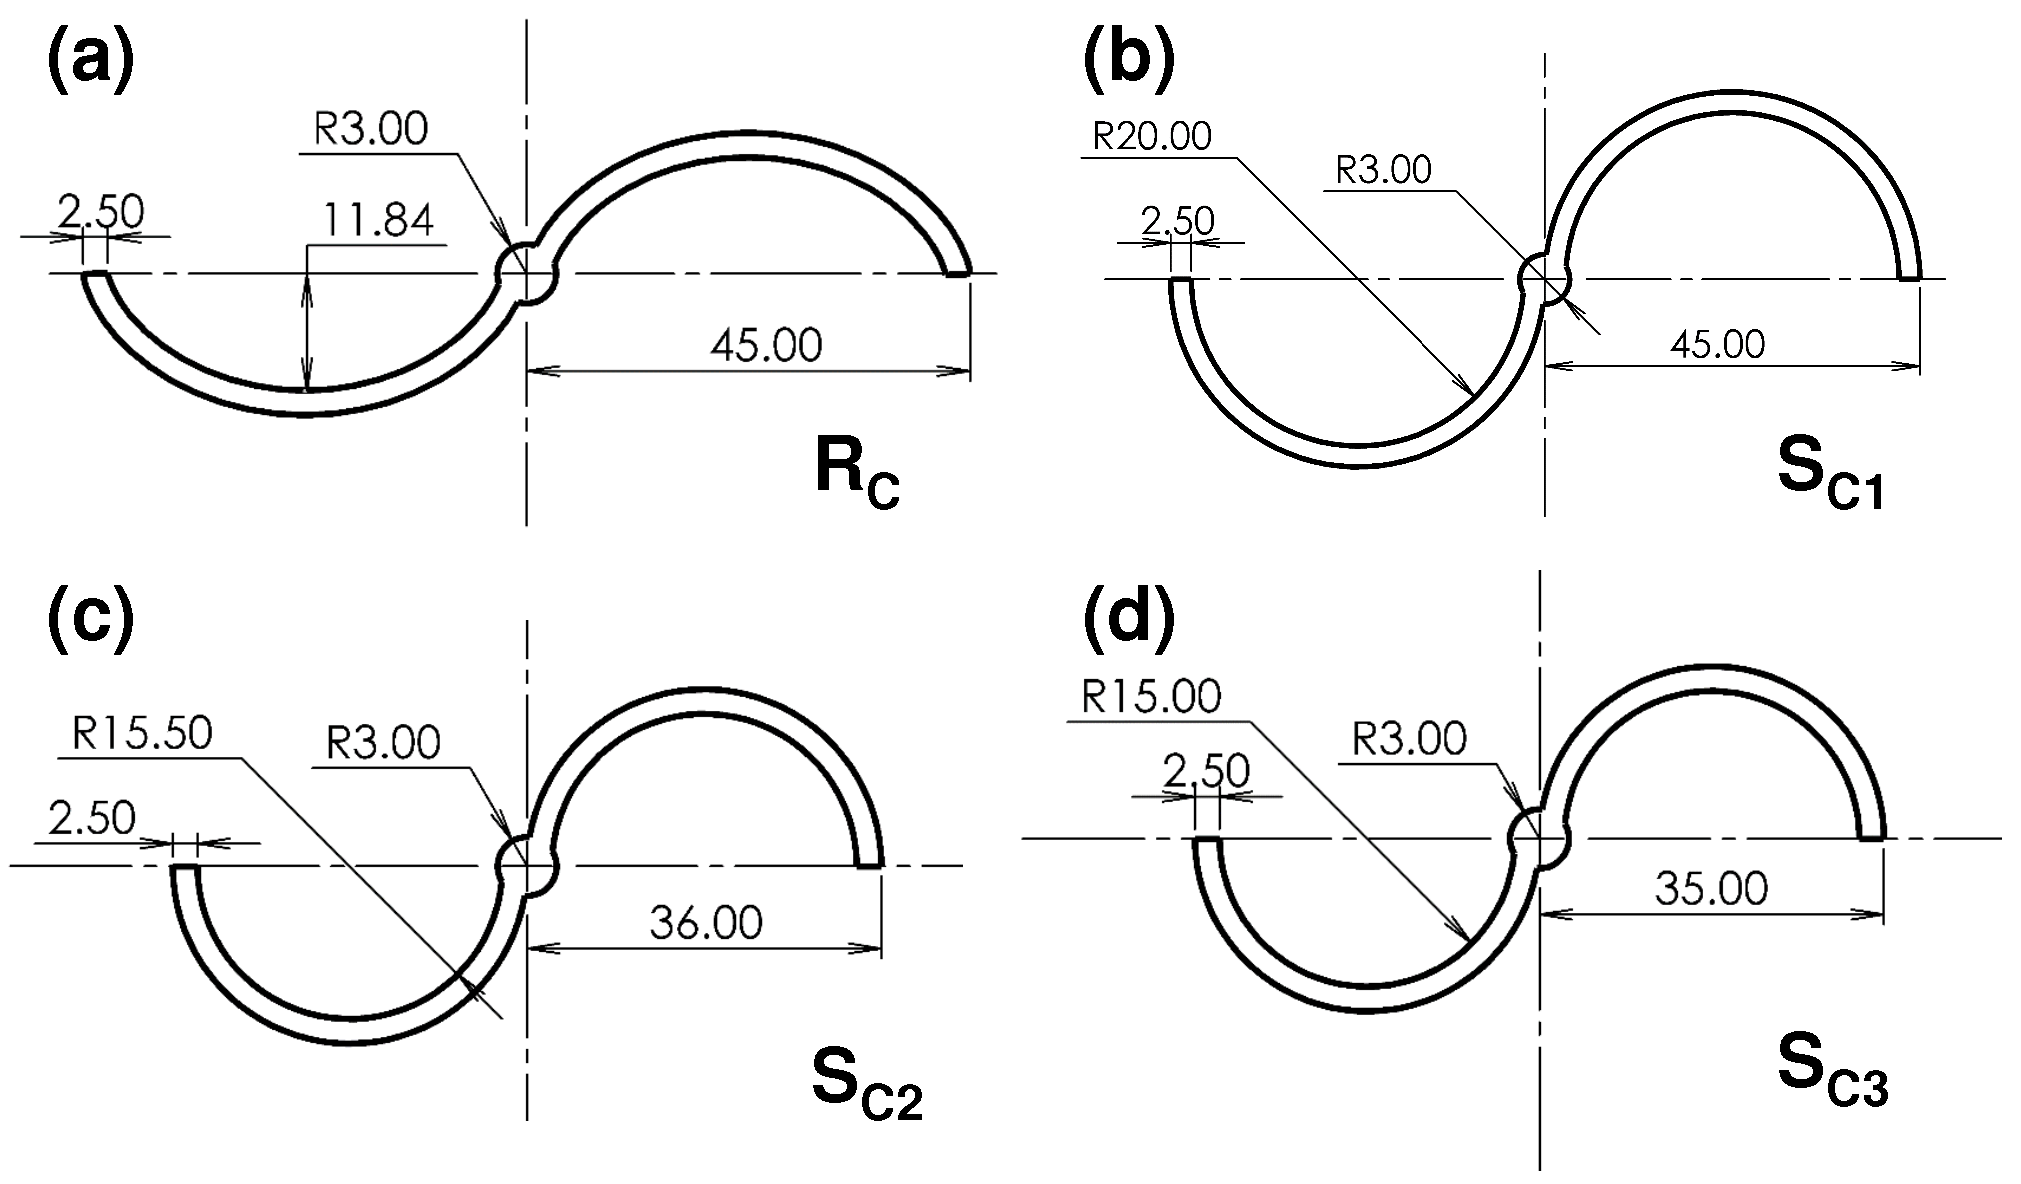
2.1. Geometries
- Case I (): the diameter (4.5 cm) of the S-type rotor () with circular geometry is equal to 4.5 cm of the directrix.
- Case II (): the chord (5.7 cm) of the S-type rotor () with circular geometry is equal to the chord (5.7 cm) of the arc of the () geometry.
- Case III (): the area under the curve () of the S-type rotor () with circular geometry is equal to the area under the curve () of the arc of the () geometry.

2.2. CFD
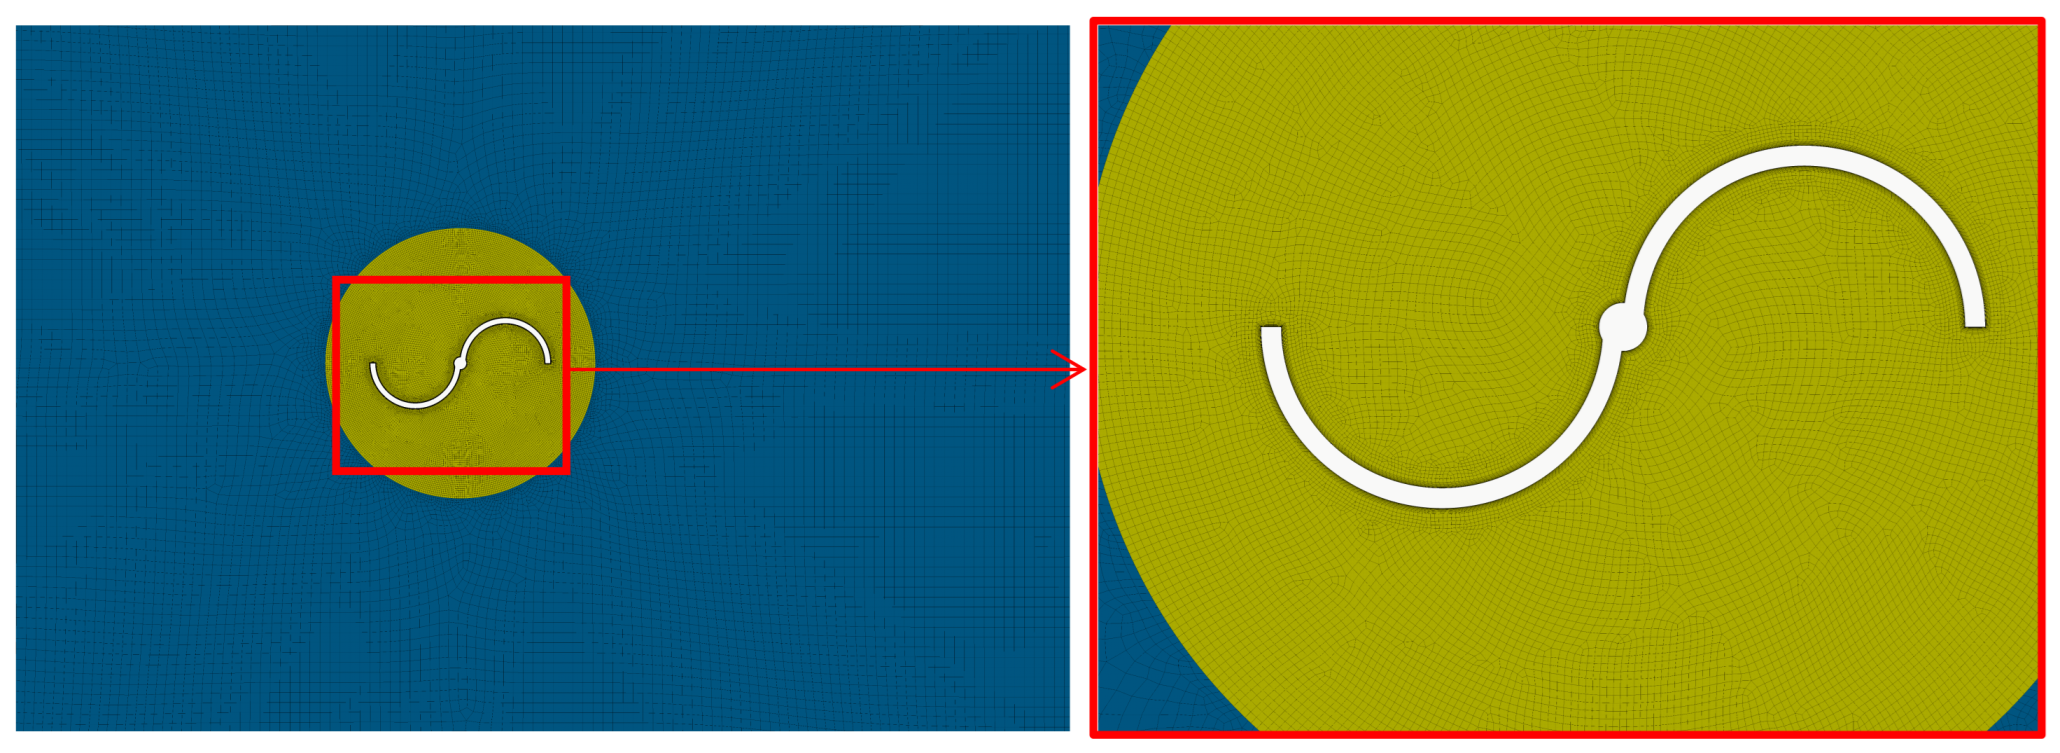
2.2.1. Modeling of Geometries
2.2.2. Mesh
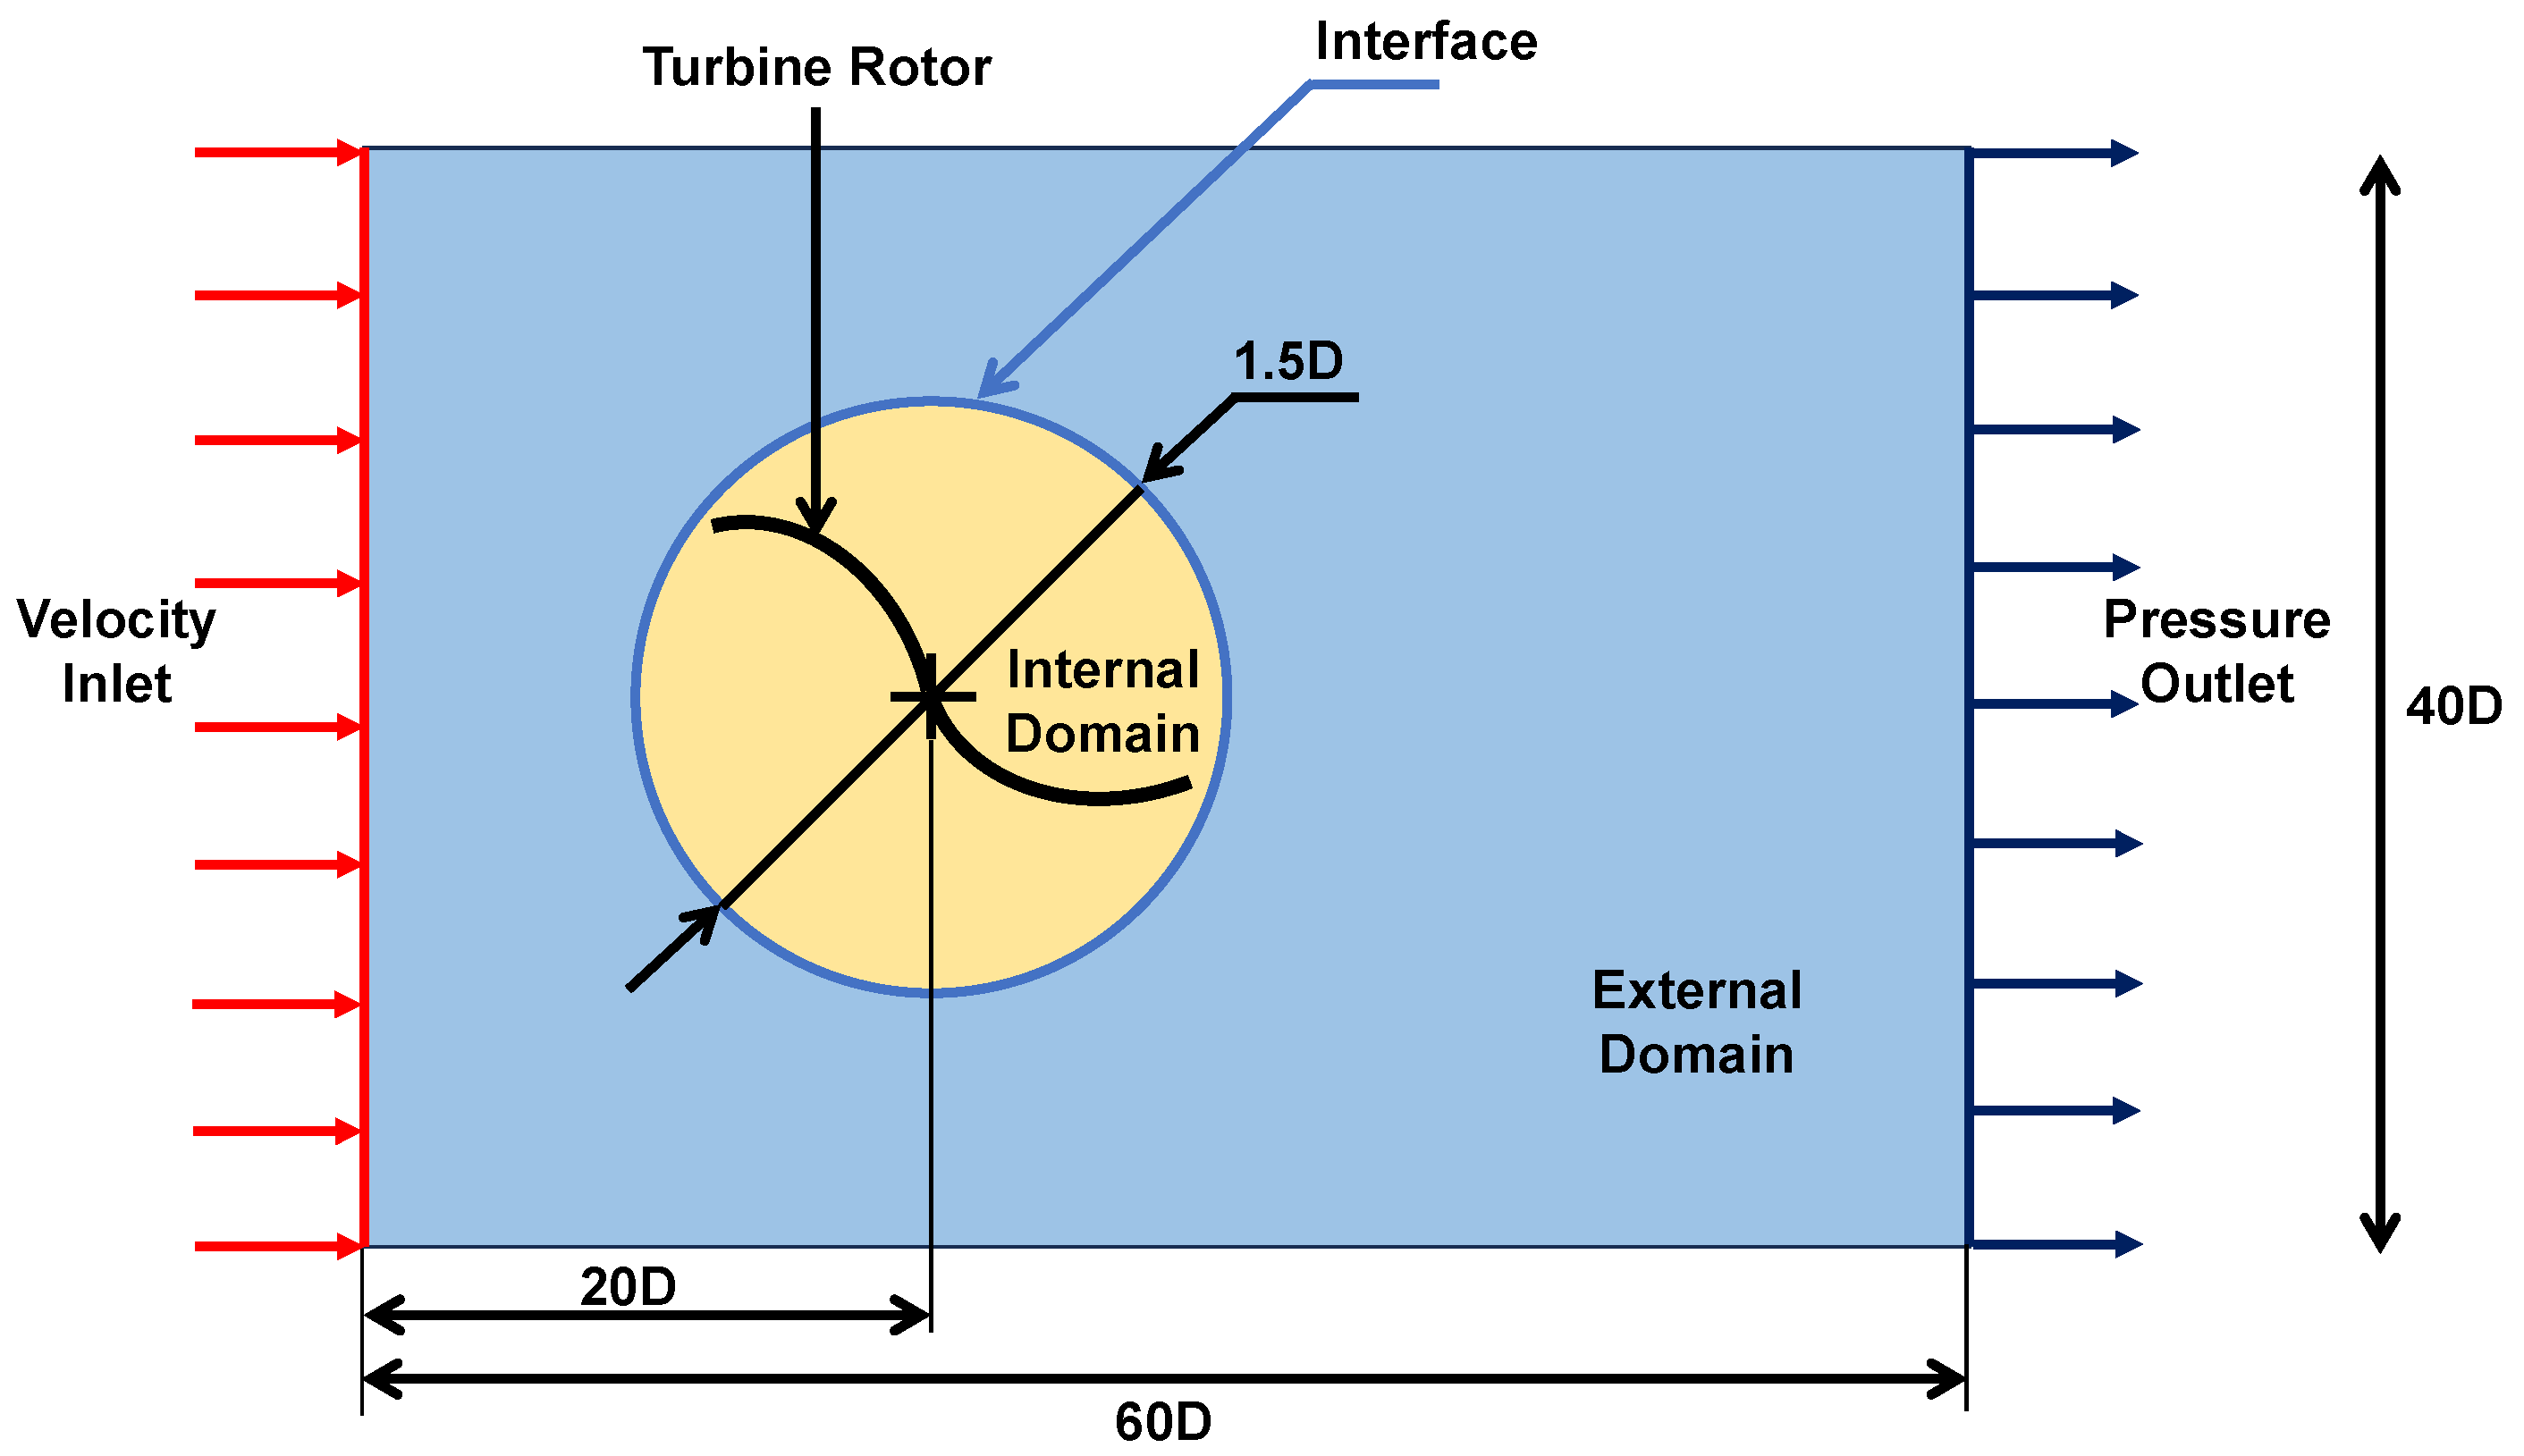
2.2.3. Boundary Conditions
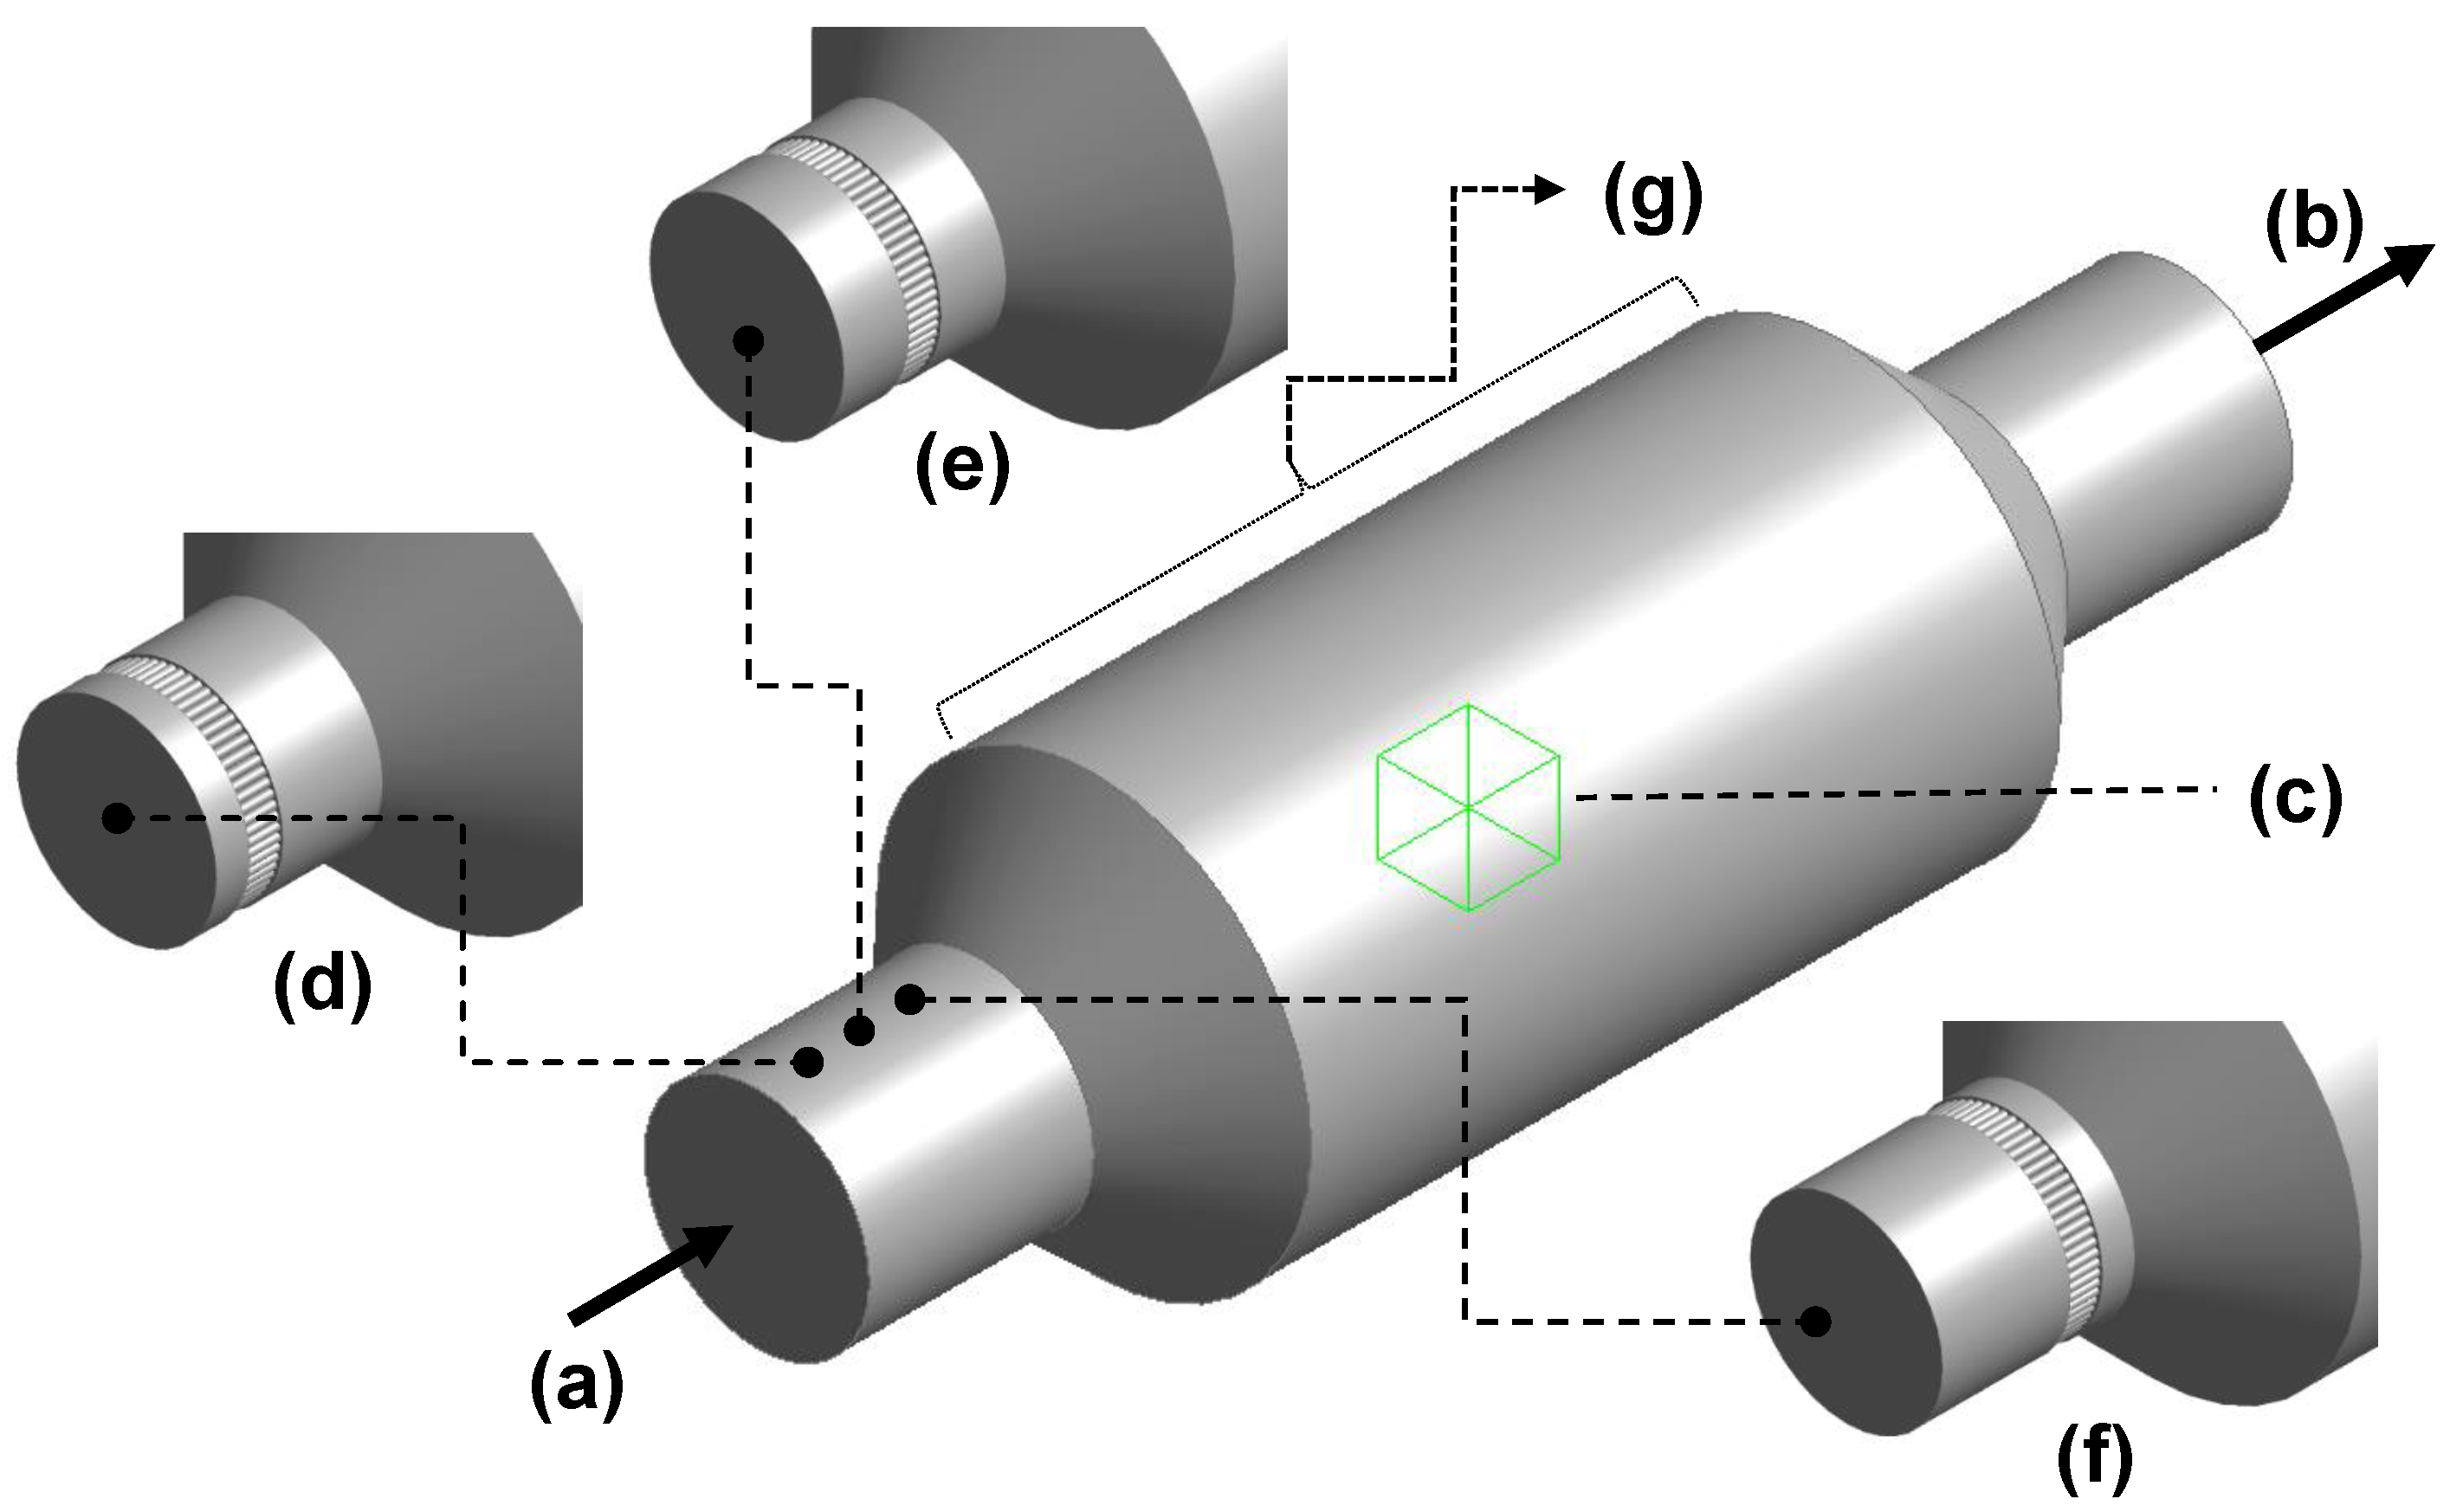
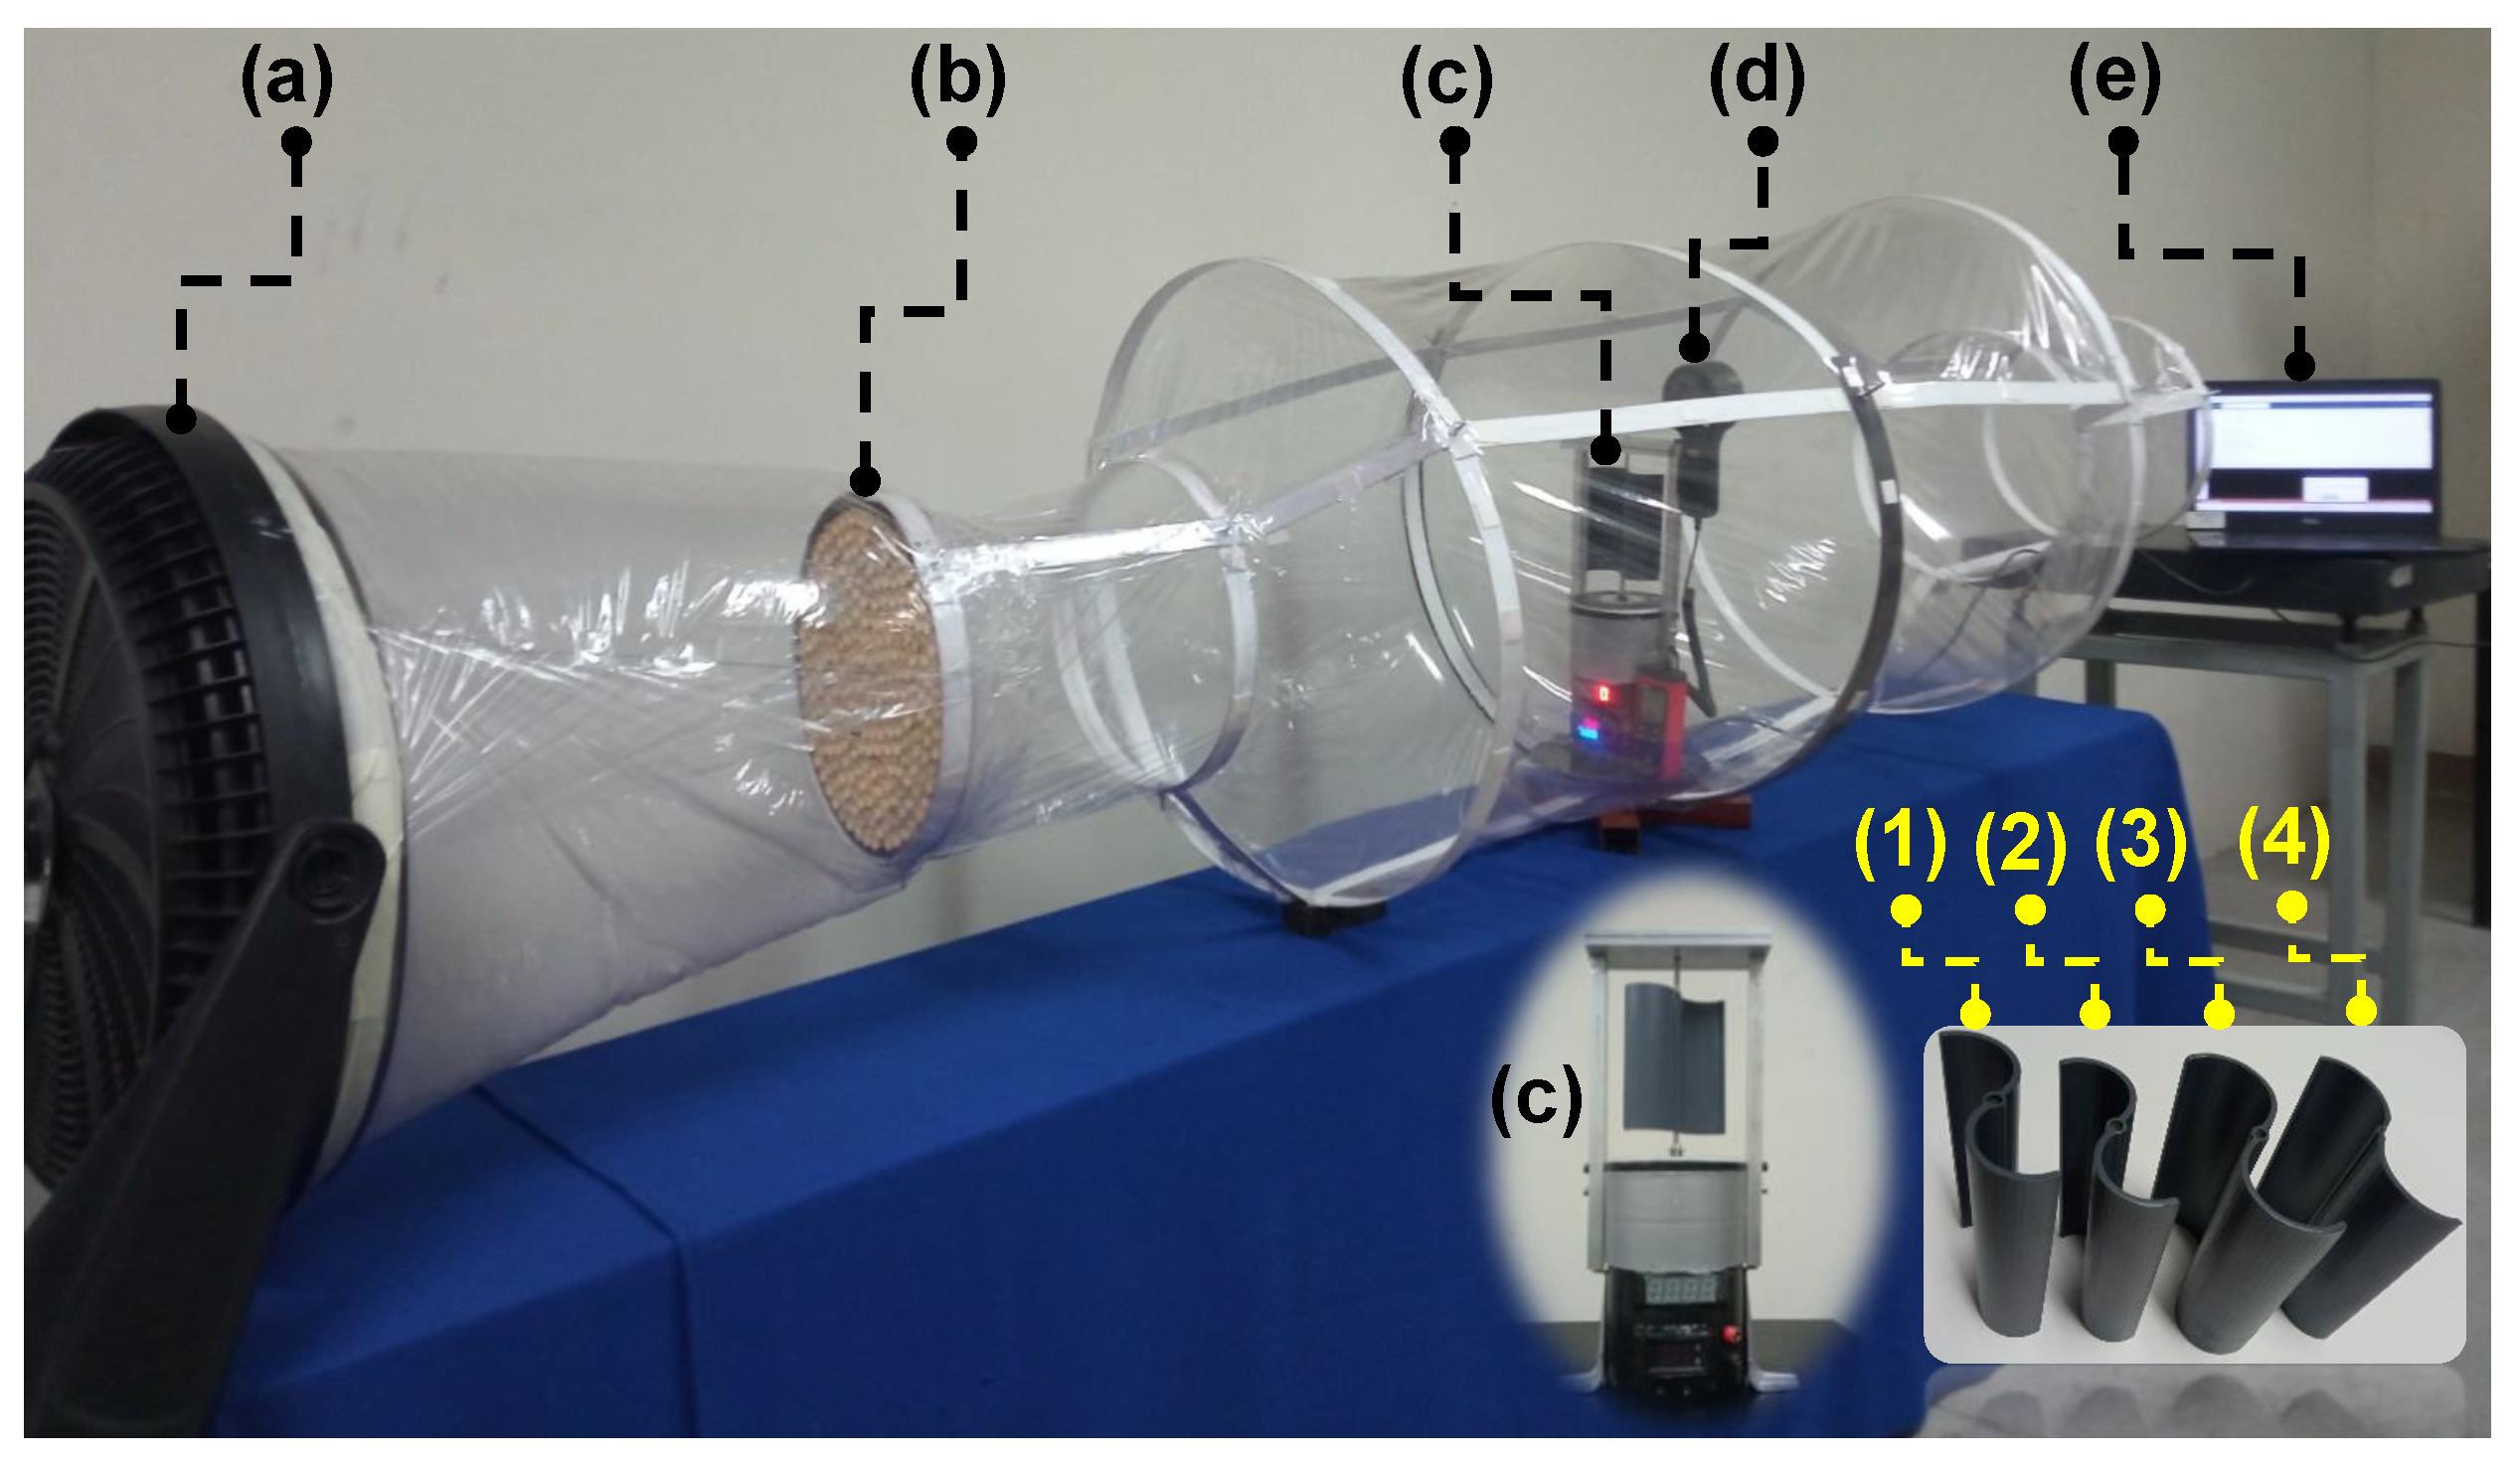
2.3. Design of the Wind Tunnel
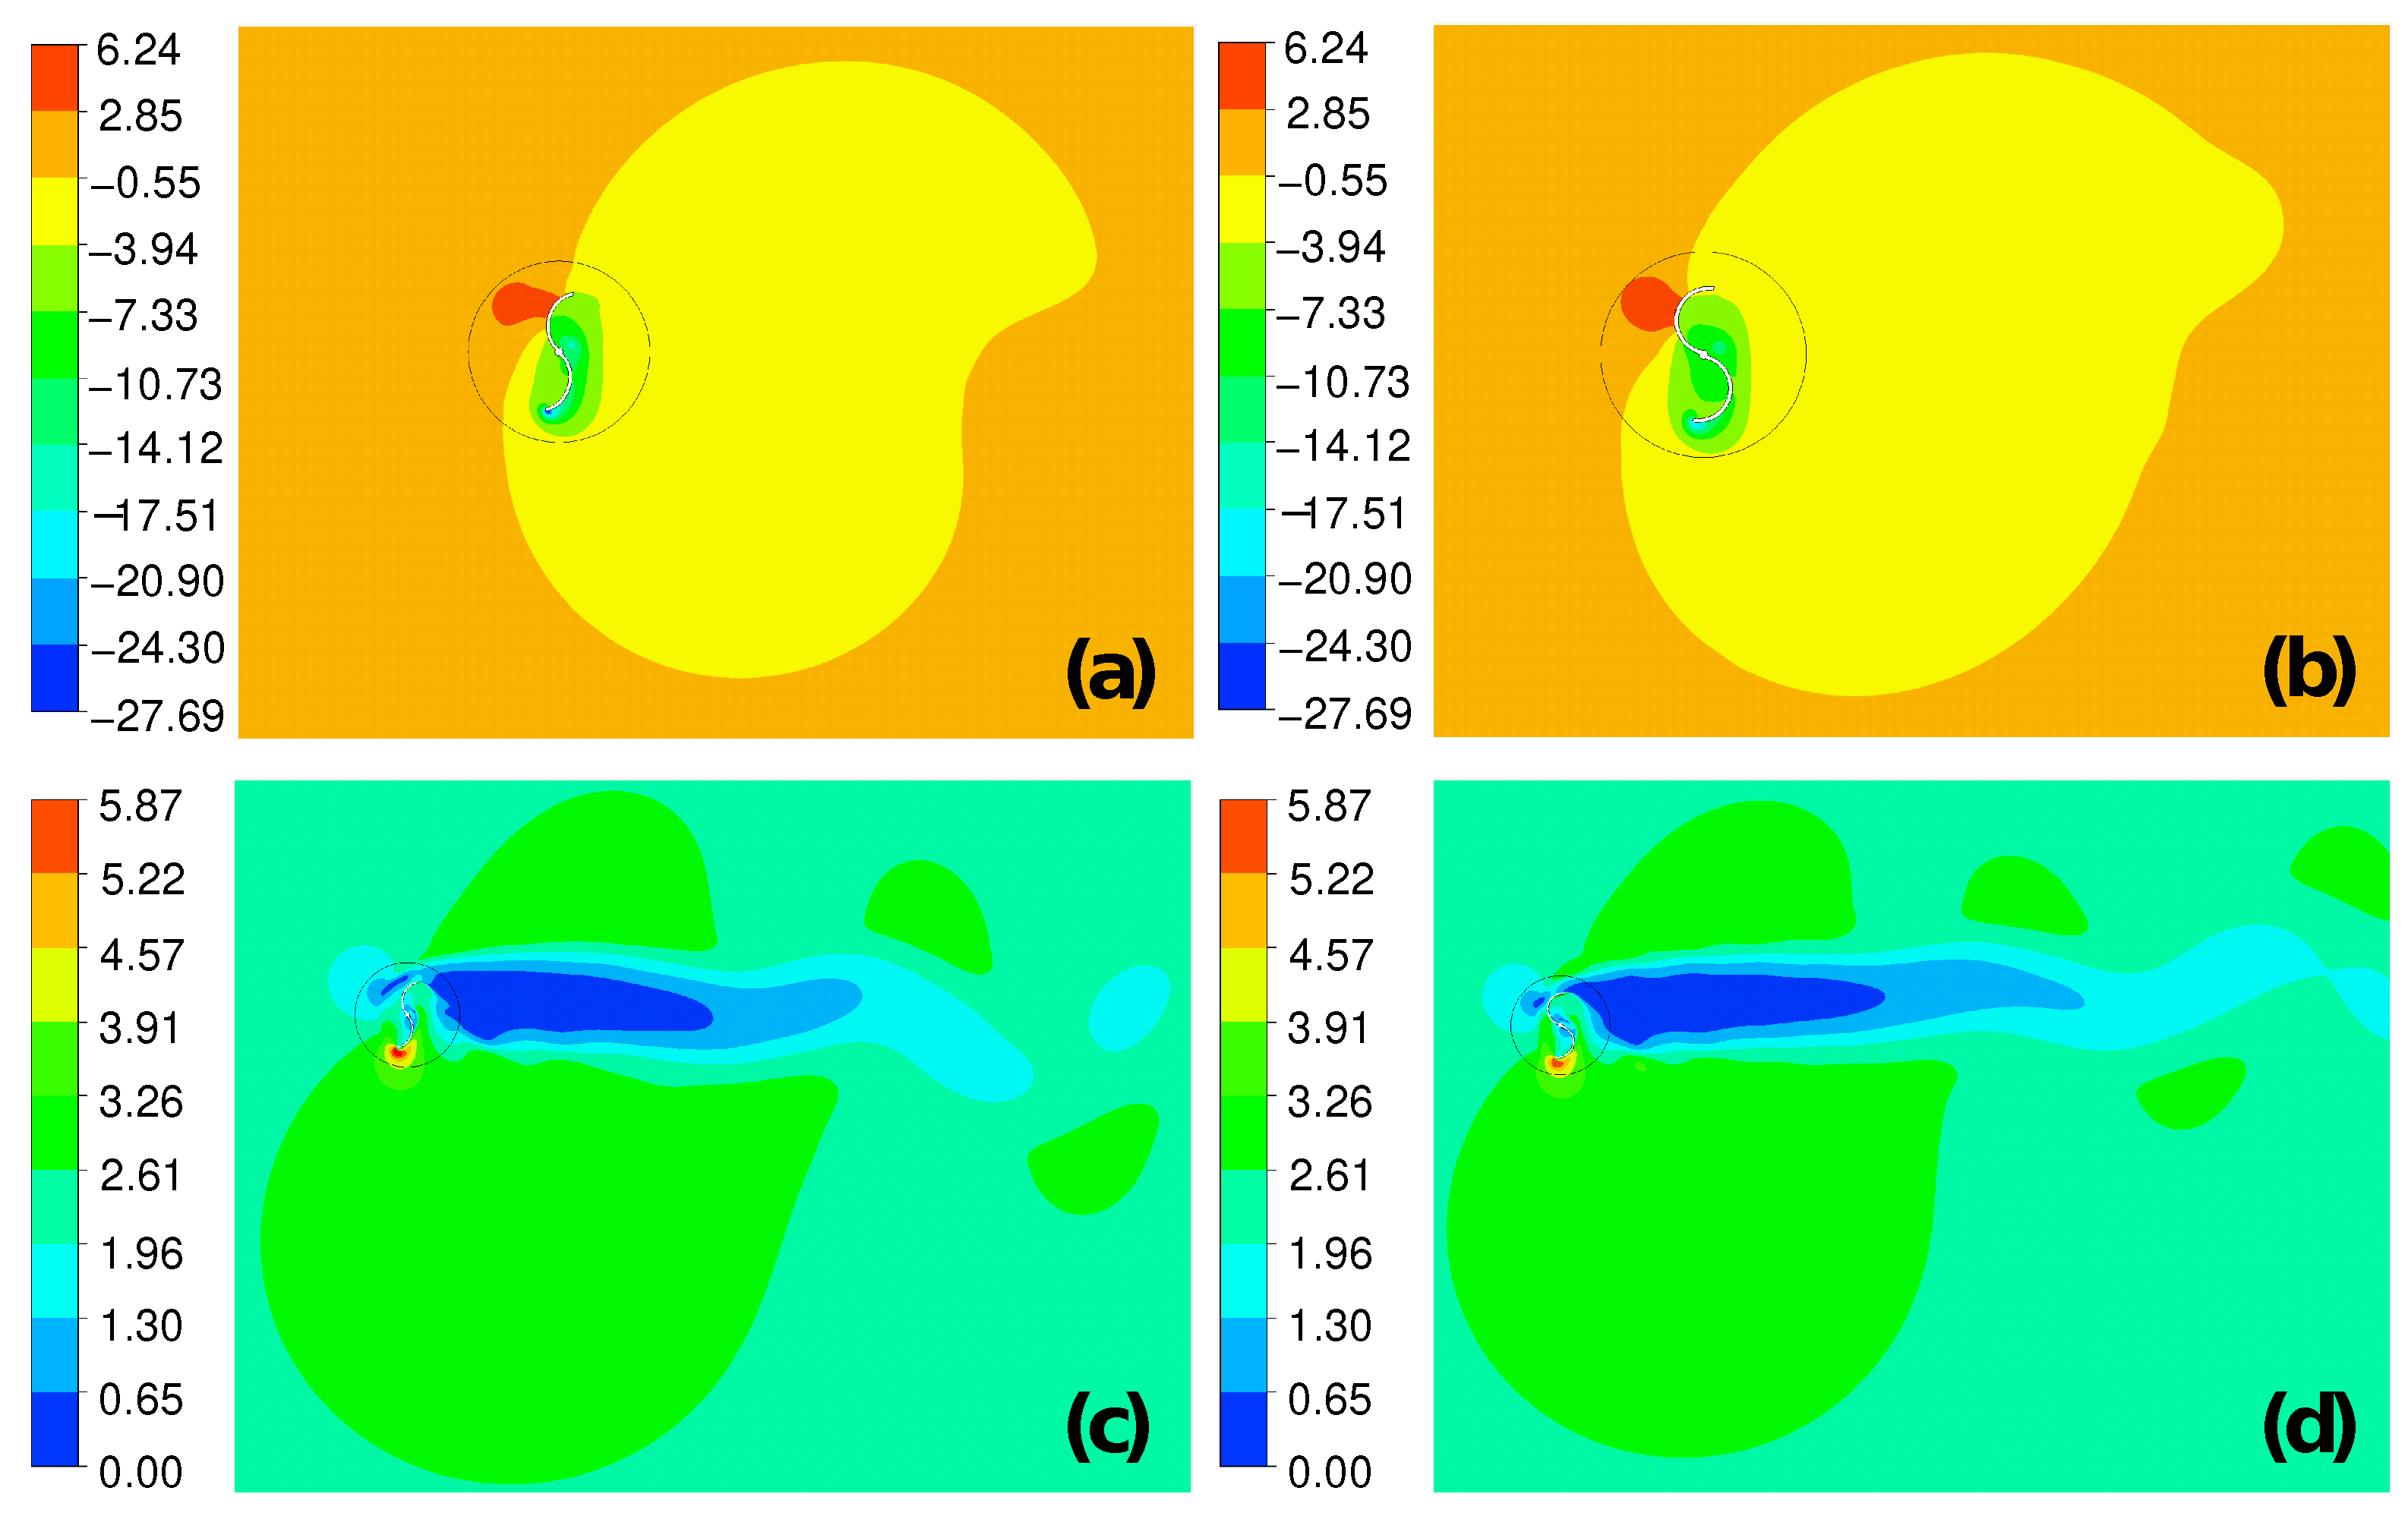
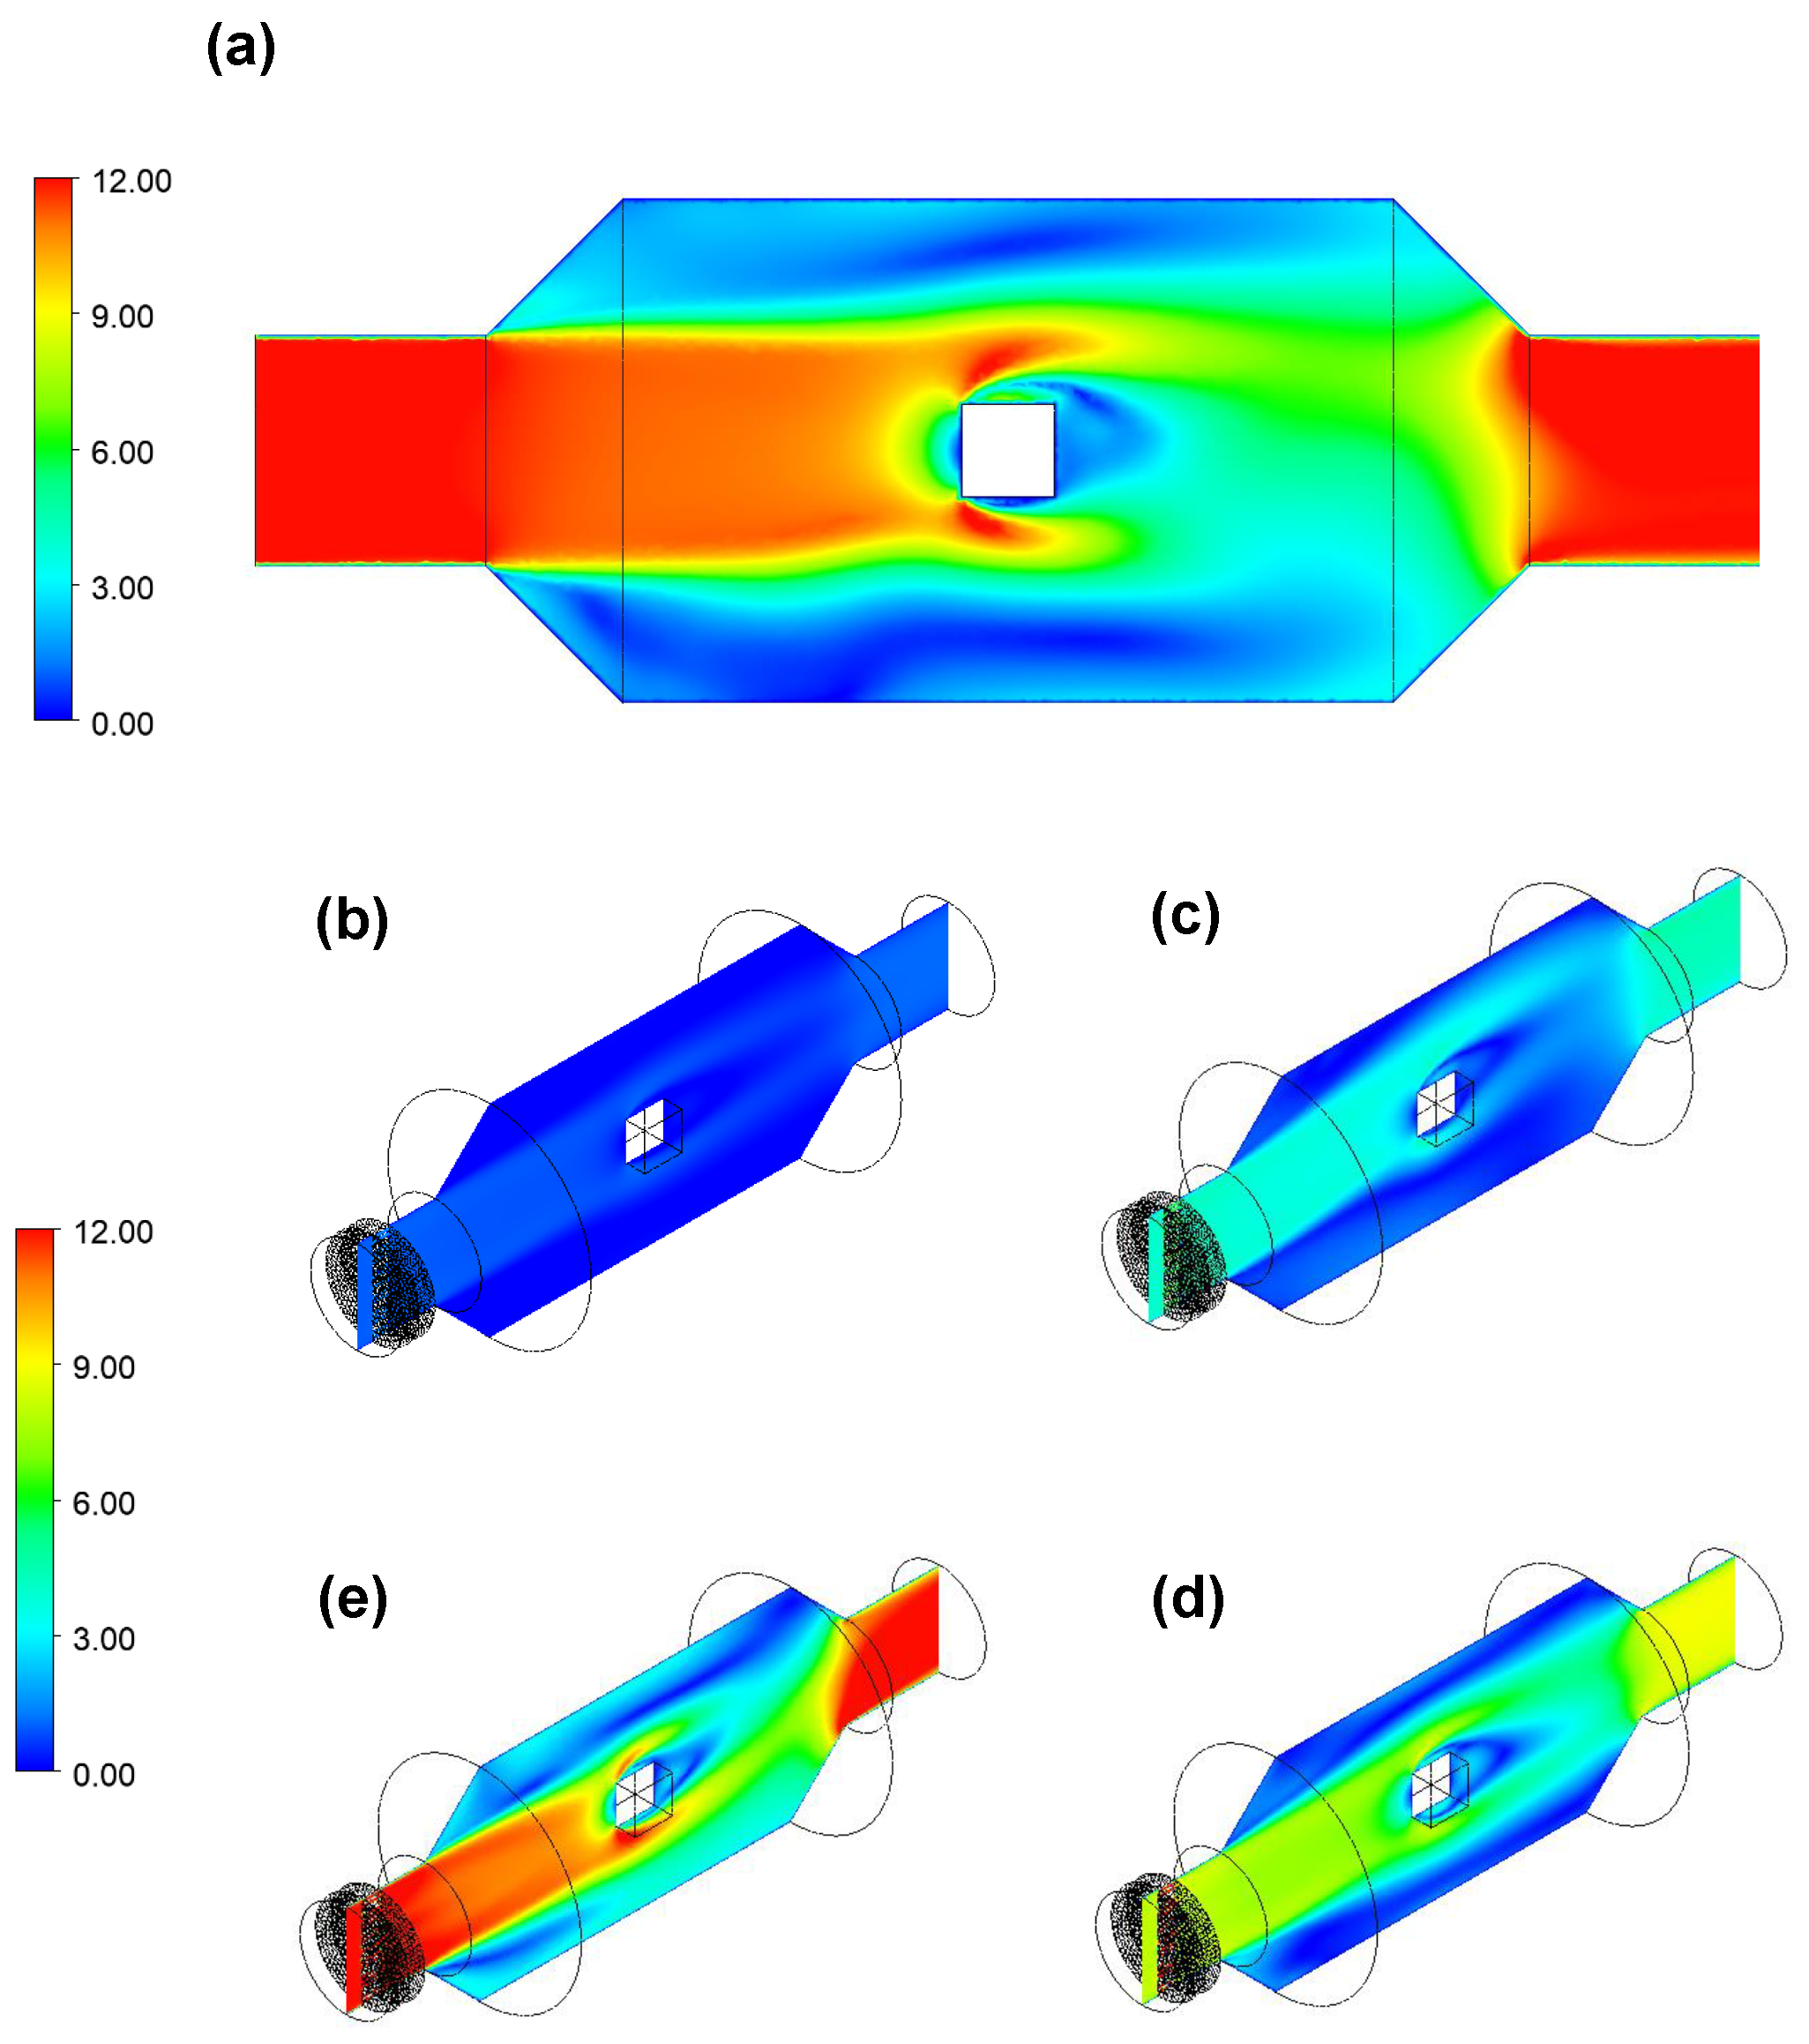
2.3.1. Velocity Fields
2.3.2. Airflow Director
2.4. Construction and Characterization of the 3D Printed Rotors
2.4.1. 3D Printing Rotors and Wind Turbine
2.4.2. Characterization of Airflow Fields
2.4.3. Experimental Moment Behavior
2.4.4. Maximum Power Point Characterization (MPP)
3. Results
3.1. Simulation with CFD
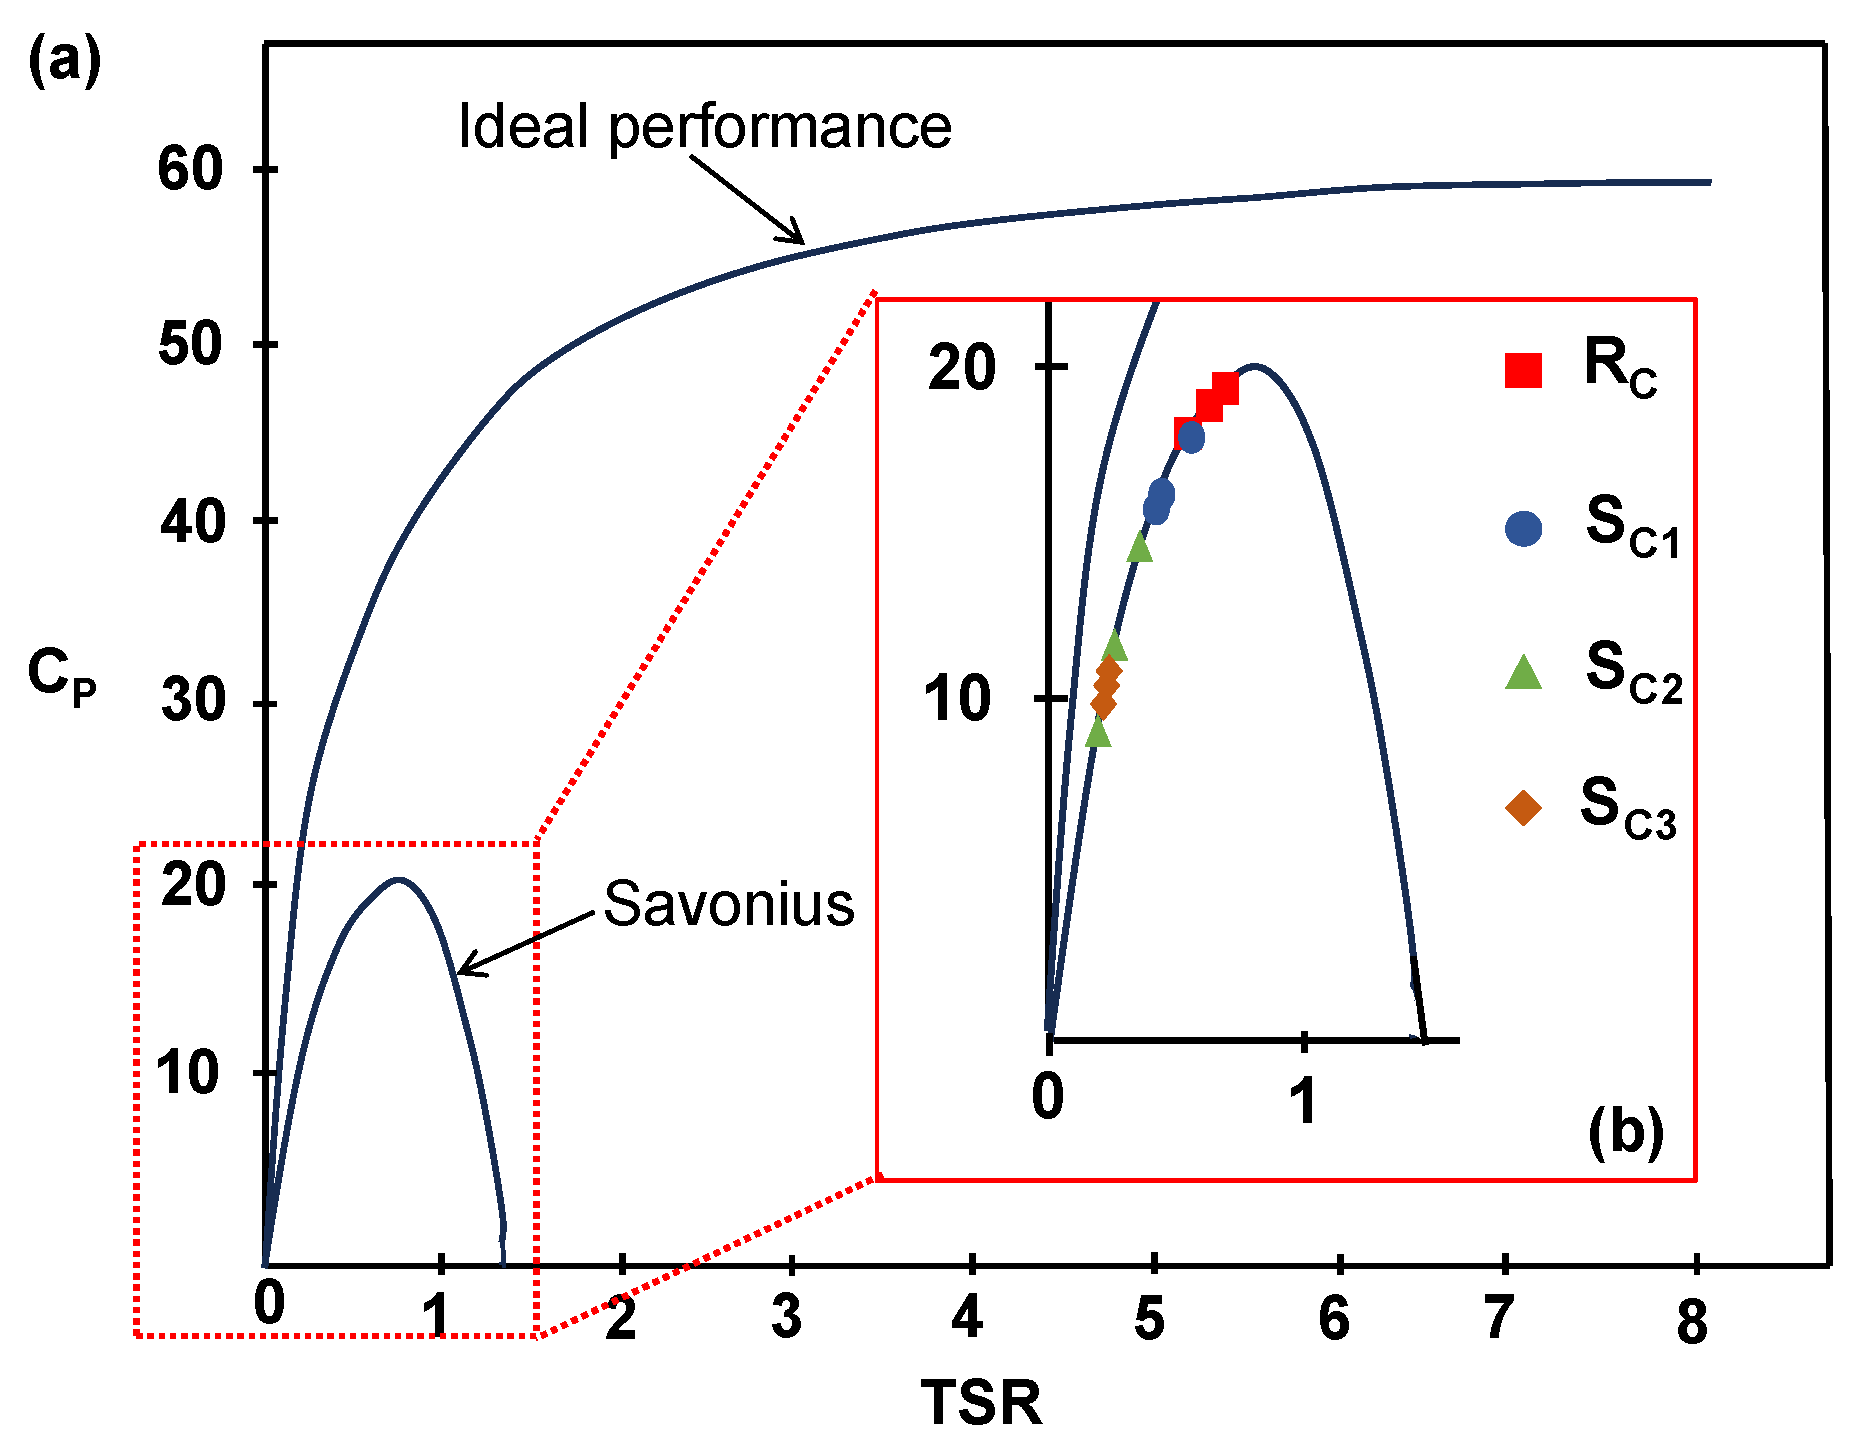
- If the diameter of the semicircular geometry for the is equal to the directrix of the , which is 4.5 cm, the power will be 1.15 times greater than that of the . This indicates that the will provide better performance.
- If the chord length of the is equal to the chord length of the arc of the (5.7 cm), the power output of the is 10.44 times greater than that of the .
- If the area (4.8 cm2) under the curve of the rotor is equal to the area (4.8 cm2) under the curve of the arc of the , the power is 11.60 times greater than .
3.2. Wind Tunnel Design
3.3. Characterization of Airflow Fields
3.4. Experimental Moment Behavior
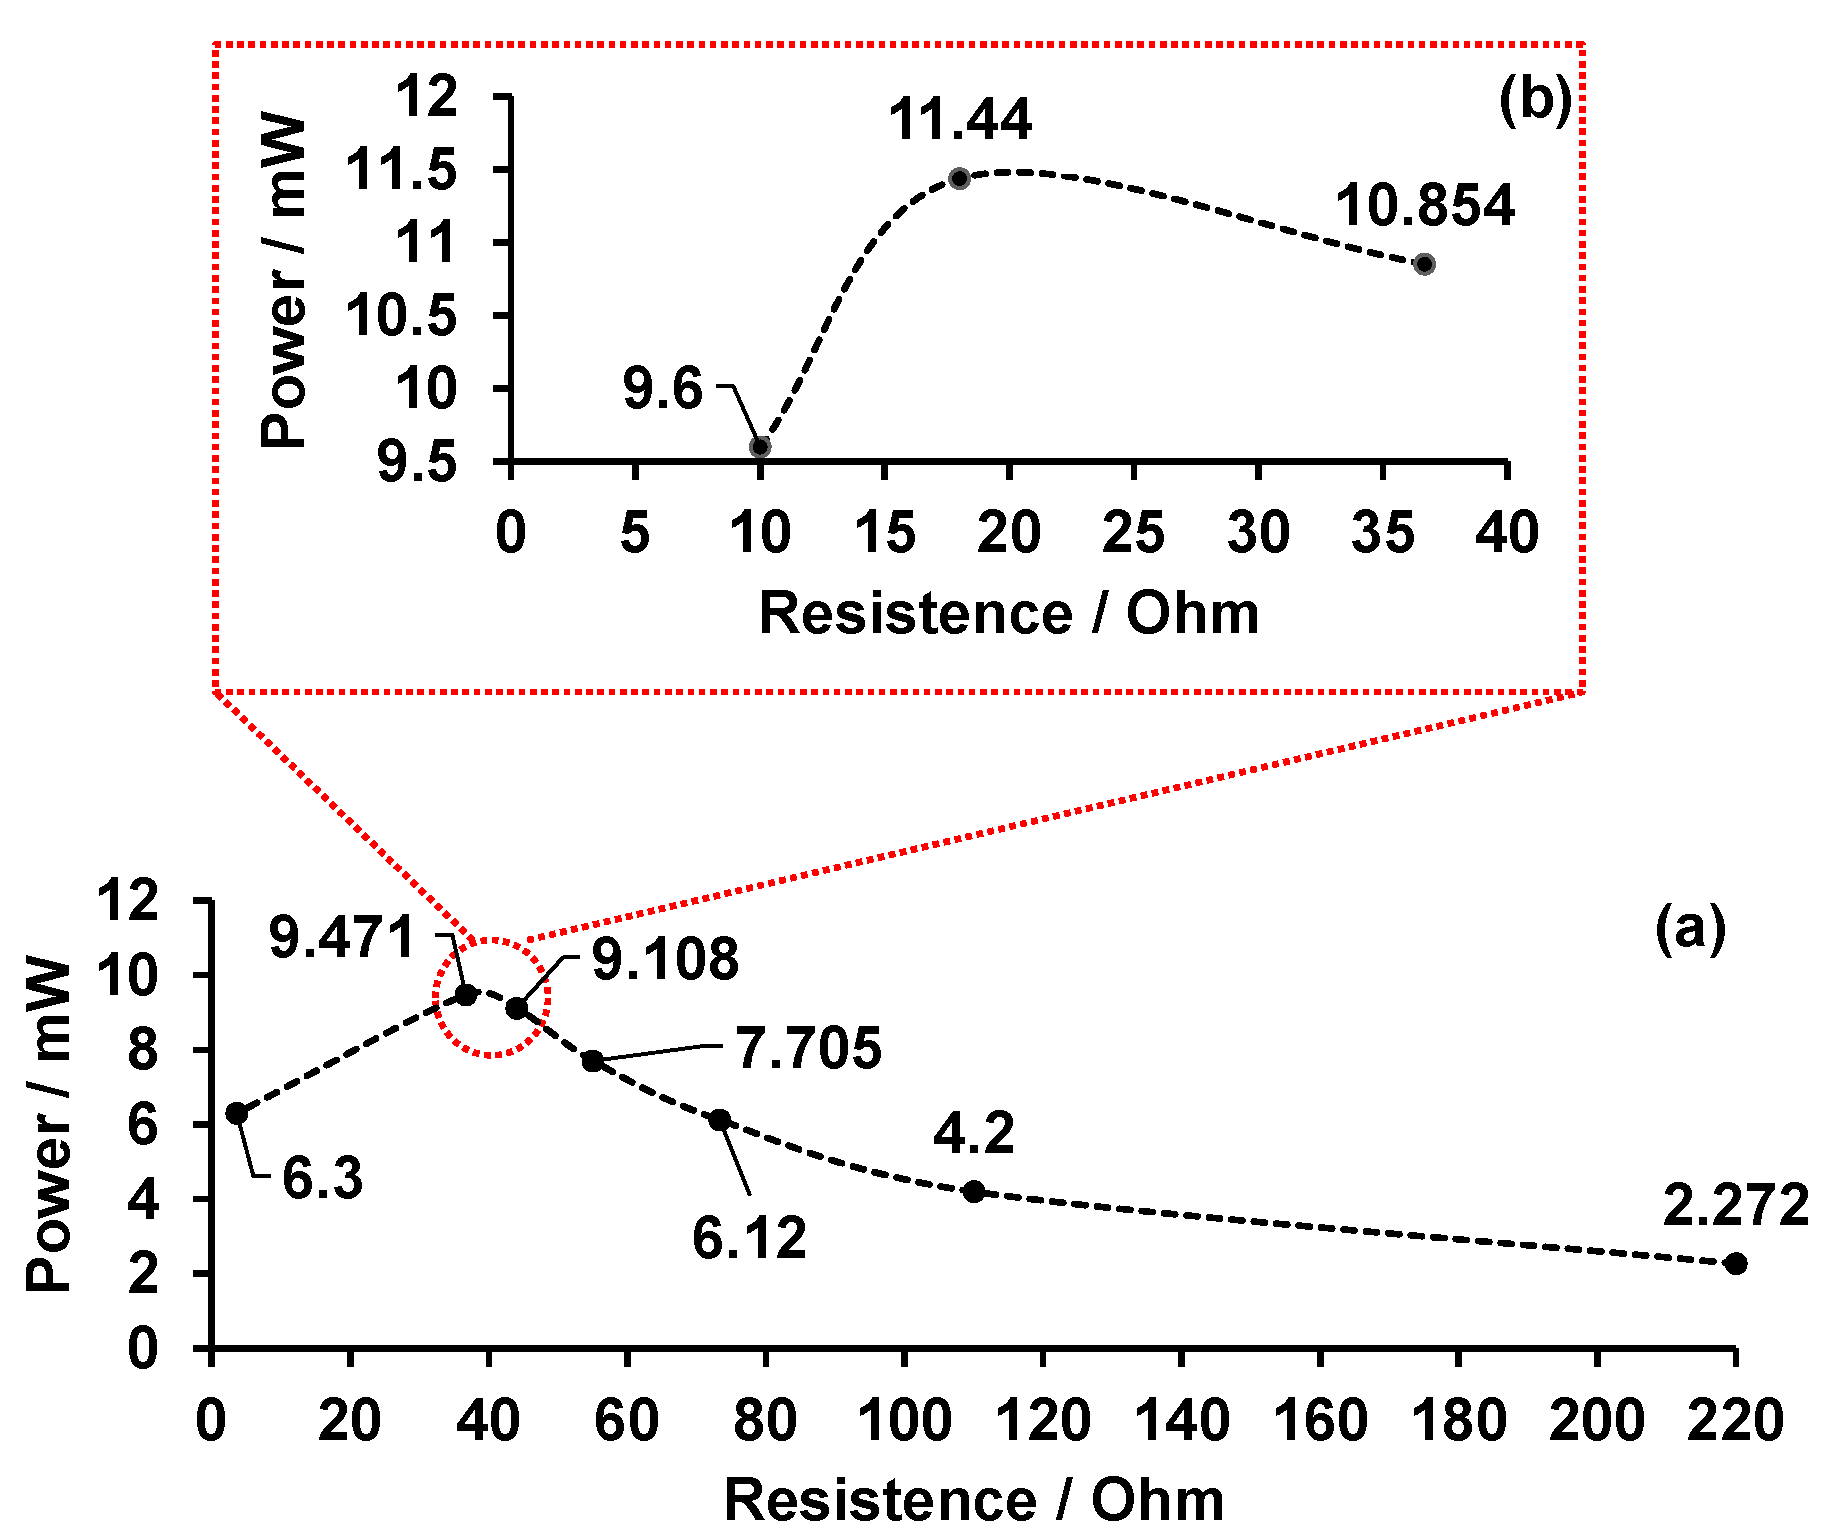
MPP Characterization
4. Conclusions
5. Patents
Author Contributions
Funding
Institutional Review Board Statement
Informed Consent Statement
Data Availability Statement
Acknowledgments
Conflicts of Interest
Abbreviations
| AoA | Angle of Attack |
| AR | Aspect Ratio |
| CAD | Computer-Aided Design |
| CFD | Computational Fluid Dynamics |
| D | Rotor diameter |
| DES | Detached Eddy Simulation |
| DOF | Degree of Freedom |
| D-VAWT | Darrieus-type Vertical-Axis Wind Turbine |
| FFT | Fast Fourier Transform |
| GF | Gurney Flap |
| HDPE | High Density Poly Ethylene |
| UHMW | Ultra High Molecular Weight Poly Ethylene |
| HDWT | H-Darrieus Vertical-Axis Wind Turbine |
| MPP | Maximum Power Point |
| P_High | Power calculated with the current value and momentum obtained with a velocity high |
| P_Low | Power calculated with the current value and momentum obtained with a velocity low |
| RMS | Root Mean Square |
| Cycloid-type rotor | |
| RCC | Ratio of the airfoil Chord length to the rotor Circumference |
| RV | Rotate Vector |
| S-type rotor to case I | |
| S-type rotor to case II | |
| S-type rotor to case III | |
| SB-VAWTs | Straight Blade Vertical Axe Wind Turbine |
| TSR | Tip Speed Ratio |
| UDF | User-Defined Function |
| URANS | Unsteady Reynolds-Averaged-Navier-Stokes |
| VAWT | Vertical-Axis Wind Turbine |
| vel_low | velocity high |
| vel_low | velocity low |
| Power Coefficient | |
| I | Current (A) |
| Moment of Inertia () | |
| Factor experimentally determined | |
| The blade tip speed ratio | |
| Angle (Rad) | |
| P | Power (W) |
| R | Rotor radius (m) |
| r | The radius of the generating circle (m) |
| Density () | |
| Solidity | |
| T | Torque o momentum (Nm) |
| v | Velocity (m/s) |
| Wind speed (m/s) | |
| Angular velocity (rad/s) | |
| x | Coordinate on the abscissa axis |
| y | Coordinate on the ordinate axis |
References
- Ando, Y.; Oku, T.; Yasuda, M.; Ushijima, K.; Murozono, M. A Transportable Photovoltaic Power Generation System Utilizing a SiC Inverter and Spherical Si Solar Cells. Technologies 2017, 5, 18. [Google Scholar] [CrossRef]
- Hidalgo, H.; Vázquez, N.; Orosco, R.; Huerta-Ávila, H.; Pinto, S.; Estrada, L. Floating Interleaved Boost Converter with Zero-Ripple Input Current Using Variable Inductor. Technologies 2023, 11, 21. [Google Scholar] [CrossRef]
- Sumaiya, S.; Kardel, K.; El-Shahat, A. Organic Solar Cell by Inkjet Printing—An Overview. Technologies 2017, 5, 53. [Google Scholar] [CrossRef]
- Kovtunenko, V.A. The Holby–Morgan Model of Platinum Catalyst Degradation in PEM Fuel Cells: Range of Feasible Parameters Achieved Using Voltage Cycling. Technologies 2023, 11, 184. [Google Scholar] [CrossRef]
- Kovtunenko, V.A.; Karpenko-Jereb, L. Lifetime of Catalyst under Voltage Cycling in Polymer Electrolyte Fuel Cell Due to Platinum Oxidation and Dissolution. Technologies 2021, 9, 80. [Google Scholar] [CrossRef]
- Dorrego-Portela, J.R.; Ponce-Martínez, A.E.; Pérez-Chaltell, E.; Peña-Antonio, J.; Mateos-Mendoza, C.A.; Robles-Ocampo, J.B.; Sevilla-Camacho, P.Y.; Aviles, M.; Rodríguez-Reséndiz, J. Angle Calculus-Based Thrust Force Determination on the Blades of a 10 kW Wind Turbine. Technologies 2024, 12, 22. [Google Scholar] [CrossRef]
- Day, H.; Ingham, D.; Ma, L.; Pourkashanian, M. Adjoint based optimisation for efficient VAWT blade aerodynamics using CFD. J. Wind Eng. Ind. Aerodyn. 2021, 208, 104431. [Google Scholar] [CrossRef]
- Zhang, T.; Wang, Z.; Huang, W.; Ingham, D.; Ma, L.; Pourkashanian, M. A numerical study on choosing the best configuration of the blade for vertical axis wind turbines. J. Wind Eng. Ind. Aerodyn. 2020, 201, 104162. [Google Scholar] [CrossRef]
- Ye, M.; Chen, H.C.; Koop, A. Verification and validation of CFD simulations of the NTNU BT1 wind turbine. J. Wind Eng. Ind. Aerodyn. 2023, 234, 105336. [Google Scholar] [CrossRef]
- Celik, Y.; Ma, L.; Ingham, D.; Pourkashanian, M. Aerodynamic investigation of the start-up process of H-type vertical axis wind turbines using CFD. J. Wind Eng. Ind. Aerodyn. 2020, 204, 104252. [Google Scholar] [CrossRef]
- Ghareghani, M.S.M.; Abdolahifar, A.; Karimian, S.M.H. Numerical investigation on the helix angle to smoothen aerodynamic torque output of the 3-PB Darrieus vertical axis wind turbine. J. Wind Eng. Ind. Aerodyn. 2023, 234, 105323. [Google Scholar] [CrossRef]
- Li, G.; Xu, W.; Li, Y.; Wang, F. Univariate analysis of scaling effects on the aerodynamics of vertical axis wind turbines based on high-resolution numerical simulations: The Reynolds number effects. J. Wind Eng. Ind. Aerodyn. 2022, 223, 104938. [Google Scholar] [CrossRef]
- Ali, U.; Modrek, M.; Islam, M.; Janajreh, I. Numerical Study of Airfoil Shape and Blade Pitching on Vertical Axis Wind Turbine Through CFD Simulations. In Proceedings of the ASME International Mechanical Engineering Congress and Exposition, Online, 16–19 November 2020; Volume 8. [Google Scholar] [CrossRef]
- Jiang, Y.; Zhao, P.; Zou, L.; Zong, Z.; Wang, K. Two-Dimensional Computational Fluid Dynamics Study on the Performance of Twin Vertical Axis Wind Turbine With Deflector. J. Energy Resour. Technol. 2020, 142, 081303. [Google Scholar] [CrossRef]
- Ghoneam, S.; Hamada, A.; Sherif, T. Modeling and Optimization for the Dynamic Performance of Vertical-Axis Wind Turbine Composite Blades. J. Sol. Energy Eng. 2020, 143, 021005. [Google Scholar] [CrossRef]
- Wilberforce, T.; Alaswad, A. Performance analysis of a vertical axis wind turbine using computational fluid dynamics. Energy 2023, 263, 125892. [Google Scholar] [CrossRef]
- Singh, E.; Roy, S.; Yam, K.S.; Law, M.C. Numerical analysis of H-Darrieus vertical axis wind turbines with varying aspect ratios for exhaust energy extractions. Energy 2023, 277, 127739. [Google Scholar] [CrossRef]
- Huang, H.; Luo, J.; Li, G. Study on the optimal design of vertical axis wind turbine with novel variable solidity type for self-starting capability and aerodynamic performance. Energy 2023, 271, 127031. [Google Scholar] [CrossRef]
- Farzadi, R.; Bazargan, M. 3D numerical simulation of the Darrieus vertical axis wind turbine with J-type and straight blades under various operating conditions including self-starting mode. Energy 2023, 278, 128040. [Google Scholar] [CrossRef]
- Tong, G.; Yang, S.; Li, Y.; Feng, F. Effects of blade tip flow on aerodynamic characteristics of straight-bladed vertical axis wind turbines. Energy 2023, 283, 129105. [Google Scholar] [CrossRef]
- Li, G.; Li, Y.; Li, J.; Huang, H.; Huang, L. Research on dynamic characteristics of vertical axis wind turbine extended to the outside of buildings. Energy 2023, 272, 127182. [Google Scholar] [CrossRef]
- Shubham, S.; Naik, K.; Sachar, S.; Ianakiev, A. Performance analysis of low Reynolds number vertical axis wind turbines using low-fidelity and mid-fidelity methods and wind conditions in the city of Nottingham. Energy 2023, 279, 127904. [Google Scholar] [CrossRef]
- Tong, G.; Li, Y.; Tagawa, K.; Feng, F. Effects of blade airfoil chord length and rotor diameter on aerodynamic performance of straight-bladed vertical axis wind turbines by numerical simulation. Energy 2023, 265, 126325. [Google Scholar] [CrossRef]
- Xu, W.; Li, C.-C.; Huang, S.-X.; Wang, Y. Aerodynamic performance improvement analysis of Savonius Vertical Axis Wind Turbine utilizing plasma excitation flow control. Energy 2022, 239, 122133. [Google Scholar] [CrossRef]
- Hohman, T.C.; Martinelli, L.; Smits, A.J. The effect of blade geometry on the structure of vertical axis wind turbine wakes. J. Wind Eng. Ind. Aerodyn. 2020, 207, 104328. [Google Scholar] [CrossRef]
- Kuang, L.; Zhang, R.; Su, J.; Shao, Y.; Zhang, K.; Chen, Y.; Zhang, Z.; Tu, Y.; Zhou, D.; Han, Z.; et al. Systematic investigation of effect of rotor solidity on vertical-axis wind turbines: Power performance and aerodynamics analysis. J. Wind Eng. Ind. Aerodyn. 2023, 233, 105284. [Google Scholar] [CrossRef]
- Vergaerde, A.; Troyer, T.D.; Muggiasca, S.; Bayati, I.; Belloli, M.; Kluczewska-Bordier, J.; Parneix, N.; Silvert, F.; Runacres, M.C. Experimental characterisation of the wake behind paired vertical-axis wind turbines. J. Wind Eng. Ind. Aerodyn. 2020, 206, 104353. [Google Scholar] [CrossRef]
- Thomai, M.P.; Sivamani, S.; Venkatesan, H. Experimental and Numerical Investigation to Assess the Performance of Helical Bach Vertical Axis Wind Turbine at Low Wind Velocity Conditions. J. Sol. Energy Eng. 2022, 144, 051010. [Google Scholar] [CrossRef]
- Yan, Y.; Avital, E.; Williams, J.; Cui, J. Aerodynamic performance improvements of a vertical axis wind turbine by leading-edge protuberance. J. Wind Eng. Ind. Aerodyn. 2021, 211, 104535. [Google Scholar] [CrossRef]
- Kim, D.; Gharib, M. Efficiency improvement of straight-bladed vertical-axis wind turbines with an upstream deflector. J. Wind Eng. Ind. Aerodyn. 2013, 115, 48–52. [Google Scholar] [CrossRef]
- Thomai, M.P.; Thangaraj, M.; Palanivel, S.; Sivamani, S. Numerical Simulation of Cluster of Small Vertical Axis Wind Turbine to Develop a Wind Tree for Low Wind Speed Regime. In Proceedings of the Gas Turbine India Conference, Bangalore, India, 7–8 December 2017; Volume 2. [Google Scholar] [CrossRef]
- Zheng, H.D.; Zheng, X.Y.; Lei, Y. Model Test of a Novel Floating Vertical-Axis Wind Turbine Under Wind and Wave Joint Loads. In Proceedings of the International Conference on Offshore Mechanics and Arctic Engineering, Online, 21–30 June 2021; Volume 9. [Google Scholar] [CrossRef]
- Shah, O.R.; Jamal, M.A.; Khan, T.I.; Qazi, U.W. Experimental and Numerical Evaluation of Performance of a Variable Pitch Vertical-Axis Wind Turbine. J. Energy Resour. Technol. 2021, 144, 061303. [Google Scholar] [CrossRef]
- Ghoneam, S.M.; Hamada, A.A.; Sherif, T.S. Dynamic Analysis of the Optimized Savonius Vertical Axis Wind Turbine Composite Blades. J. Sol. Energy Eng. 2021, 143, 054502. [Google Scholar] [CrossRef]
- Su, J.; Chen, Y.; Zhou, D.; Han, Z.; Bao, Y. Swept Blade for Performance Improvement on a Vertical Axis Wind Turbine. In Proceedings of the International Conference on Offshore Mechanics and Arctic Engineering, Online, 3–7 August 2020; Volume 9. [Google Scholar] [CrossRef]
- Roy, S.; Branger, H.; Luneau, C.; Bourras, D.; Paillard, B. Design of an Offshore Three-Bladed Vertical Axis Wind Turbine for Wind Tunnel Experiments. In Proceedings of the International Conference on Offshore Mechanics and Arctic Engineering, Trondheim, Norway, 25–30 June 2017; Volume 10. [Google Scholar] [CrossRef]
- Seralathan, S.; Thomai, M.P.; Jayakumar, R.L.; Reddy, B.V.L.; Venkatesan, H. Experimental and Numerical Assessment of Cross Flow Vertical Axis Wind Turbine. In Proceedings of the Gas Turbine India Conference, Chennai, India, 5–6 December 2019; Volume 2. [Google Scholar] [CrossRef]
- Su, H.; Meng, H.; Guo, J.; Qu, T.; Lei, L. Wind Tunnel Experiment on the Aerodynamic Interaction Between Vertical Axis Wind Turbine Pair. In Proceedings of the Fluids Engineering Division Summer Meeting, Online, 10–12 August 2021; Volume 2. [Google Scholar] [CrossRef]
- Tanzawa, Y.; Sato, T.; Hashizume, T. Wind Direction Characteristics of a Vertical Axis Wind Turbine Using the Mechanism of a Bird’s Wing With a Wind Collector. In Proceedings of the ASME Power Conference, Denver, CO, USA, 12–14 July 2011; Volume 2, pp. 557–561. [Google Scholar] [CrossRef]
- Rahman, M.; Salyers, T.; Ahmed, M.; ElShahat, A.; Soloiu, V.; Maroha, E. Investigation of Aerodynamic Performance of Helical Shape Vertical-Axis Wind Turbine Models With Various Number of Blades Using Wind Tunnel Testing and Computational Fluid Dynamics. In Proceedings of the ASME International Mechanical Engineering Congress and Exposition, Phoenix, AZ, USA, 11–17 November 2016; Volume 7. [Google Scholar] [CrossRef]
- Naik, K.; Sahoo, N. Synergistic Effect of J-Shape Airfoil on the Performance of Darrieus-Type Straight-Bladed Vertical Axis Wind Turbine. J. Energy Resour. Technol. 2023, 145, 101301. [Google Scholar] [CrossRef]
- Sarkar, D.; Shukla, S.; Alom, N.; Sharma, P.; Bora, B.J. Investigation of a Newly Developed Slotted Bladed Darrieus Vertical Axis Wind Turbine: A Numerical and Response Surface Methodology Analysis. J. Energy Resour. Technol. 2022, 145, 051302. [Google Scholar] [CrossRef]
- Zilberman, M.; Sbaih, A.A.; Hadad, I. Optimized Small Vertical Axis Wind Turbine (VAWT), Phase I. In Proceedings of the Gas Turbine India Conference. American Society of Mechanical Engineers, Online, 2–3 December 2021. [Google Scholar] [CrossRef]
- Kumar, K.K.S.; Kulkarni, V.; Sahoo, N. Investigation on Flow Characteristics and Performance of a Vertical Axis Wind Turbine with Deflector Plates. In Proceedings of the Gas Turbine India Conference, Chennai, India, 5–6 December 2019; Volume 2. [Google Scholar] [CrossRef]
- Liu, X.; Chen, Q.; Yang, B.; Song, M. Research on the Performance of a Vertical-Axis Wind Turbine With Helical Blades by Detached Eddy Simulation. J. Sol. Energy Eng. 2020, 142, 031008. [Google Scholar] [CrossRef]
- Mohammed, A.A.; Sahin, A.Z.; Ouakad, H.M. Numerical Investigation of a Vertical Axis Wind Turbine Performance Characterization Using New Variable Pitch Control Scheme. J. Energy Resour. Technol. 2019, 142, 031302. [Google Scholar] [CrossRef]
- Yan, Y.; Avital, E.; Williams, J.; Cui, J. Performance Improvements for a Vertical Axis Wind Turbine by Means of Gurney Flap. J. Fluids Eng. 2019, 142, 021205. [Google Scholar] [CrossRef]
- Li, Q.; Cai, C.; Maeda, T.; Kamada, Y.; Shimizu, K.; Dong, Y.; Zhang, F.; Xu, J. Visualization of aerodynamic forces and flow field on a straight-bladed vertical axis wind turbine by wind tunnel experiments and panel method. Energy 2021, 225, 120274. [Google Scholar] [CrossRef]
- Hosseini, A.; Goudarzi, N. CFD and Control Analysis of a Smart Hybrid Vertical Axis Wind Turbine. In Proceedings of the ASME Power Conference, Lake Buena Vista, FL, USA, 24–28 June 2018; Volume 1. [Google Scholar] [CrossRef]
- Korprasertsak, N.; Leephakpreeda, T. Analysis and optimal design of wind boosters for Vertical Axis Wind Turbines at low wind speed. J. Wind Eng. Ind. Aerodyn. 2016, 159, 9–18. [Google Scholar] [CrossRef]
- Vlasveld, E.; Huijs, F.; Savenije, F.; Paillard, B. Coupled Dynamics of a Vertical Axis Wind Turbine (VAWT) With Active Blade Pitch Control on a Semi-Submersible Floater. In Proceedings of the International Conference on Offshore Mechanics and Arctic Engineering, Madrid, Spain, 17–22 June 2018; Volume 10. [Google Scholar] [CrossRef]
- Mishra, N.; Gupta, A.S.; Dawar, J.; Kumar, A.; Mitra, S. Numerical and Experimental Study on Performance Enhancement of Darrieus Vertical Axis Wind Turbine With Wingtip Devices. J. Energy Resour. Technol. 2018, 140, 121201. [Google Scholar] [CrossRef]
- Wang, Z.; Zhuang, M. A Numerical Study on the Performance Improvement for a Vertical-Axis Wind Turbine at Low Tip-Speed-Ratios. In Proceedings of the Fluids Engineering Division Summer Meeting, Waikoloa, HI, USA, 30 July–3 August 2017; Volume 1A. [Google Scholar] [CrossRef]
- Chen, Y.; Guo, P.; Zhang, D.; Chai, K.; Zhao, C.; Li, J. Power improvement of a cluster of three Savonius wind turbines using the variable-speed control method. Renew. Energy 2022, 193, 832–842. [Google Scholar] [CrossRef]
- Nag, A.K.; Sarkar, S. Performance analysis of Helical Savonius Hydrokinetic turbines arranged in array. Ocean Eng. 2021, 241, 110020. [Google Scholar] [CrossRef]
- Dion, J.L.; Pawelski, Z.; Chianca, V.; Zdziennicki, Z.; Peyret, N.; Uszpolewicz, G.; Ormezowski, J.; Mitukiewicz, G.; Lelasseux, X. Theoretical and Experimental Study for An Improved Cycloid Drive Model. J. Appl. Mech. 2019, 87, 011002. [Google Scholar] [CrossRef]
- Li, X.; Li, C.; Wang, Y.; Chen, B.; Lim, T.C. Analysis of a Cycloid Speed Reducer Considering Tooth Profile Modification and Clearance-Fit Output Mechanism. J. Mech. Des. 2017, 139, 033303. [Google Scholar] [CrossRef]
- Zhu, C.; Sun, Z.; Liu, H.; Song, C.; Li, Z.; Wang, Z. Effect of the Shape of Inlet Oil-Supply Layer on Starved Lubrication Performance of a Cycloid Drive. In Proceedings of the International Design Engineering Technical Conferences and Computers and Information in Engineering Conference, Boston, MA, USA, 2–5 August 2015; Volume 10. [Google Scholar] [CrossRef]
- Sensinger, J.W. Efficiency of High-Sensitivity Gear Trains, Such as Cycloid Drives. J. Mech. Des. 2013, 135, 071006. [Google Scholar] [CrossRef]
- Rashidi, Y.; Arzanpour, S.; Tabatabaian, M. Energy Absorption and Dissipation Performance in Cycloid Guided Pendulum Absorbers. In Proceedings of the ASME International Mechanical Engineering Congress and Exposition, Vancouver, BC, Canada, 12–18 November 2010; Volume 13, pp. 297–302. [Google Scholar] [CrossRef]
- Choi, T.H.; Kim, M.S.; Lee, G.S.; Jung, S.Y.; Bae, J.H.; Kim, C. Design of Rotor for Internal Gear Pump Using Cycloid and Circular-Arc Curves. J. Mech. Des. 2012, 134, 011005. [Google Scholar] [CrossRef]
- Kim, K.-H.; Lee, C.-S.; Ahn, H.J. Torsional Rigidity of a Cycloid Drive Considering Finite Bearing and Hertz Contact Stiffness. In Proceedings of the International Design Engineering Technical Conferences and Computers and Information in Engineering Conference, San Diego, CA, USA, 30 August–2 September 2009; Volume 6, pp. 125–130. [Google Scholar] [CrossRef]
- Sensinger, J.W. Unified Approach to Cycloid Drive Profile, Stress, and Efficiency Optimization. J. Mech. Des. 2010, 132, 024503. [Google Scholar] [CrossRef]
- Xu, W.; Fu, Y.; Du, R. A Power Flow Analysis and Control Methodology for Cycloid Gear Train in Precision Transmission. In Proceedings of the International Conference on Integration and Commercialization of Micro and Nanosystems, Sanya, China, 10–13 January 2007; pp. 41–46. [Google Scholar] [CrossRef]
- Tutulan, F.G.; Nagamura, K.; Ikejo, K. Tooth Root Stress and Tooth Contact Stress of the Modified Cycloid Helical Gear. In Proceedings of the International Design Engineering Technical Conferences and Computers and Information in Engineering Conference, Chicago, IL, USA, 2–6 September 2003; Volume 4, pp. 91–96. [Google Scholar] [CrossRef]
- Zhou, J. A New Cycloid Drive With Ceramic Balls as Its Gear Teeth. In Proceedings of the International Design Engineering Technical Conferences and Computers and Information in Engineering Conference, Long Beach, CA, USA, 24–28 September 2005; Volume 5b, pp. 891–895. [Google Scholar] [CrossRef]
- Li, X.; He, W.; Li, L.; Schmidt, L.C. A New Cycloid Drive With High-Load Capacity and High Efficiency. J. Mech. Des. 2004, 126, 683–686. [Google Scholar] [CrossRef]
- Blanche, J.G.; Yang, D.C.H. Cycloid Drives With Machining Tolerances. J. Mech. Transm. Autom. Des. 1989, 111, 337–344. [Google Scholar] [CrossRef]
- Pollitt, E.P. Some Applications of the Cycloid in Machine Design. J. Eng. Ind. 1960, 82, 407–414. [Google Scholar] [CrossRef]
- Mao, H.; Liu, G.; Zeng, D.; Cao, Y.; He, K.; Du, R. A New Design of Cycloidal Planetary Reducer With Internal Cycloidal Profile. In Proceedings of the ASME International Mechanical Engineering Congress and Exposition ASME International Mechanical Engineering Congress and Exposition, Pittsburgh, PA, USA, 9–15 November 2018; Volume 2. [Google Scholar] [CrossRef]
- Ohya, Y.; Karasudani, T.; Sakurai, A.; Abe, K.-I.; Inoue, M. Development of a shrouded wind turbine with a flanged diffuser. J. Wind Eng. Ind. Aerodyn. 2008, 96, 524–539. [Google Scholar] [CrossRef]
- Liu, J.; Song, M.; Chen, K.; Wu, B.; Zhang, X. An optimization methodology for wind lens profile using Computational Fluid Dynamics simulation. Energy 2016, 109, 602–611. [Google Scholar] [CrossRef]
- Zimmer, F.; Gagnon, L. Study on the Performance of a Cycloidal Rotor in Hover at Different Reynolds Numbers. J. Fluids Eng. 2023, 145, 051204. [Google Scholar] [CrossRef]
- Ben-Abu, Y.; Wolfson, I.; Wolfson, I.; Wolfson, I. Energy, Christiaan Huygens, and the Wonderful Cycloid—Theory versus Experiment. Symmetry 2018, 10, 111. [Google Scholar] [CrossRef]
- Sobczak, K. Numerical investigations of an influence of the aspect ratio on the Savonius rotor performance. J. Phys. Conf. Ser. 2018, 1101, 012034. [Google Scholar] [CrossRef]
- Mohamed, M.; Janiga, G.; Pap, E.; Thévenin, D. Optimal blade shape of a modified Savonius turbine using an obstacle shielding the returning blade. Energy Convers. Manag. 2011, 52, 236–242. [Google Scholar] [CrossRef]
- Sobczak, K.; Obidowski, D.; Reorowicz, P.; Marchewka, E. Numerical Investigations of the Savonius Turbine with Deformable Blades. Energies 2020, 13, 3717. [Google Scholar] [CrossRef]
- Aramendia, I.; Fernandez-Gamiz, U.; Zulueta, E.; Saenz-Aguirre, A.; Teso-Fz-Betoño, D. Parametric Study of a Gurney Flap Implementation in a DU91W(2)250 Airfoil. Energies 2019, 12, 294. [Google Scholar] [CrossRef]
- Kacprzak, K.; Sobczak, K. Numerical analysis of the flow around the Bach-type Savonius wind turbine. J. Phys. Conf. Ser. 2014, 530, 012063. [Google Scholar] [CrossRef]
- Sakri, F.M.; Ali, M.S.M.; Salim, S.A.Z.S. Computational investigations and grid refinement study of 3D transient flow in a cylindrical tank using OpenFOAM. IOP Conf. Ser. Mater. Sci. Eng. 2016, 152, 012058. [Google Scholar] [CrossRef]
- Procedure for Estimation and Reporting of Uncertainty Due to Discretization in CFD Applications. J. Fluids Eng. 2008, 130, 078001. [CrossRef]
- METEOCAST Incorporation. Available online: https://meteocast.net/forecast/mx/san-juan-del-rio/ (accessed on 1 November 2023).


| Mesh | Richardson’s Extrapolation | ||||||
|---|---|---|---|---|---|---|---|
| Coarse | Medium | Fine | RE | p | R | FGCI | |
| Rc | 248,570 | 564,877 | 849,869 | 0.3508 | 0.61 | 0.67 | 2.25% |
| 0.3235 | 0.3324 | 0.3384 | |||||
| Sc | 204,202 | 482,799 | 805,162 | 0.2942 | 3.87 | 0.07 | 0.16% |
| 0.2753 | 0.2929 | 0.2941 | |||||
| Variable | ||
|---|---|---|
| v inlet (m/s) | 2.5 | |
| Pressure outlet (Pa) | 0 | |
| Mass (kg) | 0.042 | 0.034 |
| Moment of inertia (kg·m2) | ||
| Pressure–velocity coupling | Simple | |
| Gradients | Least squares cell based | |
| Pressure | Second order | |
| Moment | Second order upwind | |
| Time step size | 0.001 | |
| Number of time steps | 3000 | |
| Max. iterations | 60 | |
| Rotor | Wind Speed (m/s) | Angular Velocity (rad/s) | TSR |
|---|---|---|---|
| 2.40 | 29.53 | 0.55 | |
| 4 | 53.44 | 0.60 | |
| 5 | 55.5 | 0.49 | |
| 3.40 | 29.53 | 0.39 | |
| 4 | 42.93 | 0.48 | |
| 5 | 45.03 | 0.40 | |
| 4 | 29.32 | 0.26 | |
| 4.5 | 16.96 | 0.13 | |
| 5 | 33.51 | 0.23 | |
| 3.2 | 16.96 | 0.18 | |
| 4 | 24.08 | 0.21 | |
| 5 | 28.27 | 0.19 |
| Rotor | Rotor Diameter (m) | Power (mW) |
|---|---|---|
| 0.09 | 121.5 | |
| 0.09 | 121.5 | |
| 0.07 | 95.9 | |
| 0.07 | 94.5 |
| Rotor | Angular Velocity (rad/s) | Moment (Nm) | P_Low (mW) | P_High (mW) | |
|---|---|---|---|---|---|
| Vel_LOW | Vel_HIGH | ||||
| 53.4 | 65 | 90 | 3.47 | 4.81 | |
| 55.5 | 6.31 | 5.00 | |||
| 59.69 | 3.88 | 5.37 | |||
| 42.93 | 61 | 88 | 2.62 | 3.78 | |
| 45.03 | 2.75 | 3.96 | |||
| 48.17 | 2.94 | 4.24 | |||
| 29.32 | 53 | 74 | 1.55 | 2.17 | |
| 33.51 | 1.78 | 2.48 | |||
| 35.6 | 1.89 | 2.63 | |||
| 24.08 | 54 | 73 | 1.30 | 1.76 | |
| 28.27 | 1.53 | 2.06 | |||
| 32.46 | 1.75 | 2.37 | |||
| Rotor | Voltage (Volts) | Current (Ampere) | Electrical Power (mW) |
|---|---|---|---|
| 0.52 | 0.022 | 11.44 | |
| 0.60 | 0.022 | 13.2 | |
| 0.44 | 0.018 | 8.14 | |
| 0.50 | 0.019 | 9.55 | |
| 0.15 | 0.006 | 0.9 | |
| 0.11 | 0.005 | 0.66 |
| Rotor | Theoretical Power (mW) | Experimental Electrical Power (mW) | Efficiency (%) |
|---|---|---|---|
| 121.5 | 13.2 | 10.86 | |
| 121.5 | 9.55 | 7.86 | |
| 95.9 | 0.90 | 0.94 | |
| 94.5 | 0.66 | 0.69 |
Disclaimer/Publisher’s Note: The statements, opinions and data contained in all publications are solely those of the individual author(s) and contributor(s) and not of MDPI and/or the editor(s). MDPI and/or the editor(s) disclaim responsibility for any injury to people or property resulting from any ideas, methods, instructions or products referred to in the content. |
© 2024 by the authors. Licensee MDPI, Basel, Switzerland. This article is an open access article distributed under the terms and conditions of the Creative Commons Attribution (CC BY) license (https://creativecommons.org/licenses/by/4.0/).
Share and Cite
González-Durán, J.E.E.; Olivares-Ramírez, J.M.; Luján-Vega, M.A.; Soto-Osornio, J.E.; García-Guendulain, J.M.; Rodriguez-Resendiz, J. Experimental and Numerical Analysis of a Novel Cycloid-Type Rotor versus S-Type Rotor for Vertical-Axis Wind Turbine. Technologies 2024, 12, 54. https://doi.org/10.3390/technologies12040054
González-Durán JEE, Olivares-Ramírez JM, Luján-Vega MA, Soto-Osornio JE, García-Guendulain JM, Rodriguez-Resendiz J. Experimental and Numerical Analysis of a Novel Cycloid-Type Rotor versus S-Type Rotor for Vertical-Axis Wind Turbine. Technologies. 2024; 12(4):54. https://doi.org/10.3390/technologies12040054
Chicago/Turabian StyleGonzález-Durán, José Eli Eduardo, Juan Manuel Olivares-Ramírez, María Angélica Luján-Vega, Juan Emigdio Soto-Osornio, Juan Manuel García-Guendulain, and Juvenal Rodriguez-Resendiz. 2024. "Experimental and Numerical Analysis of a Novel Cycloid-Type Rotor versus S-Type Rotor for Vertical-Axis Wind Turbine" Technologies 12, no. 4: 54. https://doi.org/10.3390/technologies12040054