Article

Understanding Technology Perception in Autism with Separate Analyses for Anxiety and Depression Using Quantum Circuit Simulation Approach †

by
Gema Benedicto-Rodríguez
1,2,*,
Vanessa Zorrilla-Muñoz
2,3,*,
Nicolas Garcia-Aracil
2,
Eduardo Fernandez
2,4 and
José Manuel Ferrández
1
1
Department of Electronics and Computer Technology, Universidad Politécnica de Cartagena, 30202 Murcia, Spain
2
Bioengineering Institute, Miguel Hernández University of Elche, 03202 Elche, Spain
3
Bioengineering Institute of Gender Studies, University Carlos III of Madrid, 28903 Madrid, Spain
4
Networking Research Centre of Bioengineering, Biomaterials and Nanomedicine (CIBER-BBN), 03202 Elche, Spain
*
Authors to whom correspondence should be addressed.
This paper is an extended version of our paper published in the Third International Conference on Innovations in Computing Research (ICR’24), Athens, Greece, 12–14 August 2024; “Technological Influence on the Measurement of Quality of Life in Persons with Autism Spectrum Disorder”, doi:10.1007/978-3-031-65522-7_60.
Technologies 2025, 13(4), 165; https://doi.org/10.3390/technologies13040165
Submission received: 20 February 2025 / Revised: 13 April 2025 / Accepted: 14 April 2025 / Published: 20 April 2025

Abstract

:
Background: This work explores the current use of technologies and the perception of their impact on people diagnosed with Autism Spectrum Disorder (ASD) and other comorbidities—Chronic Anxiety (CA) and Chronic Depression (CD). Autistic people often experience anxiety and/or depression. These mental health issues are exacerbated by social stigma, affecting their quality of life (QoL) and well-being. Aims: The study aims to analyze how emerging technologies can reduce communication difficulties, as well as stress, anxiety, and depression, and thus improve QoL for individuals with ASD and comorbidities like CA and CD. Methods: This study analyzes data from the secondary questionnaire ‘Encuesta de Discapacidad, Autonomía Personal y situaciones de Dependencia (EDAD)’ developed in 2020–2021 by the ‘Instituto Nacional de Estadística (INE)’ for people with ASD (n = 241), ASD and CA (n = 61), and ASD and CD (n = 29). The analysis includes Pearson correlation tests to examine the relationship between various factors affecting QoL. Results: The results highlight differences in difficulties affecting the QoL of ASD persons. Pearson correlation analysis showed significant negative correlations in communication and learning for ASD patients, with similar patterns in the separate analyses of CA and CD. More significant variables were found in the ‘Learning’ and ‘Communication’ indices for ASD, while CA and CD represented more significant variables in ‘Mobility’ index. Conclusions: This work suggests that technological interventions, such as the integration of advanced technologies, could enhance emotional regulation and social skills in individuals with ASD. In this sense, the quantum computing approach could help in the emerging technologies impact evaluation, analyzing devices adapted to the user to optimize their QoL and well-being.

1. Introduction

The WHO (2023) estimates that one in every hundred people under 18 years of age suffers from Autism Spectrum Disorder (ASD) [1].
For these reasons, the early detection of ASD is essential. However, currently, there is no biological test that allows its diagnosis. As a consequence, the evaluation is mainly based on the use of validated scales [2], which in turn necessitate clinical evaluation, and this directly impacts the functional capabilities and quality of life (QoL) of the person who suffers this disease.
QoL, both for individuals with ASD and neurotypicals, is understood as a multidimensional concept that refers to people’s perception of their existence within the values and environment in which they are situated, related to their goals, expectations, concerns, and norms [1]. From both medical and physiotherapeutic perspectives, managing ASD involves addressing not only the cognitive and behavioral symptoms, but also the physical challenges that can significantly affect daily life [3]. Physiotherapy, tailored to the specific needs of individuals with ASD, can improve motor function, sensory processing, and propioception, which are often compromised. These physical improvements can lead to enhanced self-efficacy and independence, potentially reducing anxiety and depression symptoms by fostering a better sense of control over one’s environment [4,5]. Medical interventions, on the other hand, focus on pharmacological and non-pharmacological treatments for co-occurring mental health issues, aiming to stabilize mood and behavior in a way that complements physical therapy efforts [6], thereby contributing to an overall better quality of life.
Moreover, familiar caregivers for ASD patients often experience a reduction in QoL, especially in parents of children with ASD, who face significant physical, social, and emotional stress [7].

1.1. Co-Occurrence of Anxiety and Depression in ASD

People with ASD can live with various mental disorders (MDS), and vice versa. For example, the symptoms of anxiety may be present in autistic people (this is not the case in all cases of autism) and the characteristics of autism may manifest in people with an anxiety disorder. The prevalence of anxiety in individuals with ASD varies widely, with estimates ranging from 11% to 84%, depending on the sample and methodology used [8]. However, a higher percentage of anxiety was found in young people with ASD (63%), where 17% showed traditional anxiety disorders and only 15% showed atypical symptoms of TA related to ASD. The current prevalence of ASD and anxiety remains a contentious issue, as highlighted Sánchez et al. [9]. The symptoms of anxiety observed in people with autism form an independent entity from ASD [8].

1.2. Perception of Technology in ASD, Anxiety, and Depression

The perceptions that people with autism, anxiety and depression have of technologies play an important role in the design of therapies and their effectiveness. According to previous studies, people with autism can experience technology in a variety of ways, ranging from as a potential source of stress and sensory overload, to offering devices that are tailored to each individual’s specific needs [10]. As for anxiety, the perception of technology is ambiguous, as technologies can offer a positive sense of control and predictability, but constant exposure can produce emotional overload [11].
However, in depression, a positive perception arises as technology offers a form of avoidance or distraction from emotional symptoms, which can always vary depending on the nature of the symptoms [12]. However, some research has shown that cognitive behavioral therapy apps are effective for treating depression, as long as users maintain a positive attitude toward technologies [12].
The moment technologies adapt to people’s needs, people begin to perceive them as useful and non-invasive. In this way, they manage to have a significant impact on their quality of life (QoL), and therefore, the perception of technology becomes fundamental for the development of effective therapeutic tools. Otherwise, technologies can be perceived as counterproductive [13]. This user-centered approach can contribute to the creation of technological solutions that enhance emotional well-being, social inclusion and personal development [14].

1.3. Challenges of Co-Morbidity: Anxiety and Depression in ASD

In this context, it is also common for adolescents with both anxiety and autism to experience high levels of social anxiety or depressive symptoms compared to neurotypical adolescents [11,15]. People with both conditions often face serious challenges in managing intolerance and uncertainty, and in carrying out daily activities, which undoubtedly affects their QoL. Anxiety can have a negative impact on the QoL of individuals with ASD, as well as other types of mental conditions, among which depression stands out [16,17,18,19]. According to the WHO [1], it is estimated that 5% of adults suffer from depression, but it also affects minors [18] and the young, being found in around 2.8% of children under 13 years of age and 5.6% of those aged 13–18 years [20]. That is, its incidence increases from early adolescence and may persist into adulthood [21]. Furthermore, the risk of depression increases with age [1,22].
According to a study by Hudson, Hall and Harkness [23], the combined prevalence rate of depression and ASD ranges from 12 to 14%, and is higher in adolescent and child populations [24]. Hollocks et al. [25] found that the combined prevalence rates of both diseases varied between 23 and 37% over a lifetime, suggesting that individuals with ASD may be at a higher risk of developing depressive disorders than individuals without ASD [23,24,26]. Although it is evident that the prevalence of depressive disorders is higher in youth, it is highly variable depending on the type of study conducted and the cultural, temporal, contextual, and environmental factors considered [27].
Among the social causes of depression, there is a focus on cognitive processes due to failures in an individual’s information processing system. Another argument cites the social images and strategies that the individual and surrounding community use to cope with depression (adaptation strategies, social support, self-esteem, and self-image) [28,29].
Childhood depression can be related to severe deficiencies in various areas of life, including social, family, personal, and educational aspects, which manifest over time as an emotional response [20]. The comorbidity of anxiety and depression significantly complicates daily life for individuals with ASD, impacting stress management, social interactions, and access to support services, which affect QoL [30,31].

1.4. Technological Intervention for Emotional Regulation

These factors underscore the importance of a comprehensive approach in managing individuals with ASD who also have anxiety and depression.
Consequently, developing intervention strategies that address both ASD characteristics and additional conditions to enhance QoL and promote healthy, satisfying personal development is crucial. Moreover, addressing emotional regulation through technology promises to enhance QoL and help manage stress, including complications such as anxiety or depression in individuals with ASD.
In line with this context, a recent suggestion has been made of the significant therapeutic benefits of using socially disruptive technologies to delve into emotional regulation in individuals with ASD [32], as well as patients with mental illnesses such as anxiety and/or depression [33]. It is foreseeable that new technologies could help improve QoL in individuals affected by disability by reducing communication gaps and managing stressful situations [34].
This is linked to how people perceive technology in relation to the difficulties they face on a daily basis, which is the focus of this study. The results suggest that interventions should focus on a deeper understanding of how people with ASD, anxiety, and depression perceive technology, with the aim of improving the design, development, and advancement of therapeutic technologies that are practical, accessible to all people, and, above all, effective.

1.5. The Role of Quantum Computing in Collaborative AI

In this regard, generative algorithms could represent an approach to generate useful tools that explore the correlations between ASD, anxiety, and depression. For example, collaborative artificial intelligence (CAI) techniques have demonstrated the ability to handle correlations and complex patterns in diverse datasets that traditional computational methods may find challenging due to their increasing exponential complexity. CAI enables the combination of knowledge and capabilities from multiple agents or models to analyze large and complex datasets more effectively. For instance, CAI has demonstrated positive results in Quantitative Modeling in Drug Discovery [35] and Employ Service Coproduction [36]. Moreover, the agent-based model produces a more comprehensive analysis by leveraging distributed expertise and perspectives. Additionally, databases with limited data can be enhanced using CAI to augment and refine the existing information through synthetic data generation or advanced data imputation techniques. For this reason, exploring the application of algorithms in quantum computing (QC) could be particularly interesting. QC offers potential advantages in handling complex correlations and patterns within diverse datasets, which traditional computing methods may struggle with due to their exponential growth in complexity. Moreover, QC could potentially enhance the analysis of dependencies between variables, particularly in domains regarding QoL and others relevant to Autism Spectrum Disorder (ASD) and other comorbidities (Chronic Anxiety (CA) and Chronic Depression (CD)). By leveraging QA, it may be possible to uncover deeper insights into the interplay of these variables, thereby informing more targeted interventions and therapies aimed at improving quality of life and managing stress in individuals affected by these conditions. In this context, the objective of this study is to investigate the prevalence and impact of anxiety and depression in persons affected by Autism Spectrum Disorder (ASD) and to develop a comprehensive, technology-enhanced intervention strategy that addresses these comorbid conditions to improve their QoL. This study [37] aims to explore the role of perceived technology and its observed impact on persons with Autism Spectrum Disorder (ASD), and separately, Chronic Anxiety (CA) and Chronic Depression (CD), concerning aspects related to their daily challenges.

2. Materials and Methods

2.1. Objective of the Study

To carry out the objectives of this study, separate analyses will be conducted for each condition to identify distinct patterns, and evaluate how technology can positively influence the QoL in these groups.

2.2. Data Collection

To accomplish this, data are collected from the ‘Encuesta de Discapacidad, Autonomía Personal y situaciones de Dependencia (EDAD)’ of the ‘Instituto Nacional de Estadística (INE)’ [38]. This large-scale survey targets individuals residing in family households in Spain, collected during 2020. The survey is based on the statistic that 4.38 million people (94.9 per thousand inhabitants) had some form of disability in Spain during the year 2020 [38]. The questionnaire underwent validation by the National Institute of Statistics (INE) before implementation. This study received approval from the Ethics Committee of the Miguel Hernández University of Elche (code AUT.IB.EFJ.240202).
The EDAD survey provides a robust dataset, but certain limitations and potential biases should be acknowledged. The survey’s focus on individuals in family households may exclude those living in institutional settings, such as care facilities, potentially underrepresenting the full scope of disability prevalence in Spain. Additionally, self-reported data, which form the basis of the questionnaire, may be subject to recall bias or varying interpretations of disability among respondents. The data, collected solely in 2020, may also reflect specific socio-economic or health-related conditions unique to that year, such as the impact of the COVID-19 pandemic, which could limit their generalizability to other time periods. These factors should be considered when interpreting the study’s findings.
A two-stage stratified sampling approach was employed using a multi-channel methodology, including computer-assisted web interviewing (CAWI), computer-assisted telephone interview (CATI), and paper questionnaires sent via ordinary mail. Upon locating individuals with disabilities, data from individual questionnaires were collected through computer-assisted personal interviews (CAPI). Ultimately, 11,650 participants were included, comprising 4790 males (41.12%) and 6890 females (58.88%).
The prevalence rate for Autism Spectrum Disorder (ASD) was 2.07%, while Chronic Anxiety (CA) 17.77% and Chronic Depression (CD) were seen in 18.70% of the total 11,650 surveyed individuals. Notably, within the group of individuals with CD, 0.25% also suffered from CA, and 12.40% had ASD (Table 1).

2.3. Measuring Instruments

The secondary questionnaire applied aspects related to quality of life (QoL) based on the index of the WHOQOL-100 scale used by the World Health Organization (WHO) [1], which has previously been validated in ASD patients [31,39,40,41]. This multidimensional construct [42] focuses on physical, emotional, and social well-being, which includes physical health perception, physiological state, level of independence, social relationships, and relationships with the environment, as shown in Table 2.
Each question in the survey used a Likert scale ranging from 1 to 4 points. The question addressing the perception of technology and its impact on quality of life was: ‘In your opinion, has the use of new technologies improved aspects of your daily life?’. This question served as the cornerstone for measuring technology perception among individuals with Autism Spectrum Disorder (ASD) who are also affected by co-occurring conditions such as Chronic Anxiety (CA) and Chronic Depression (CD), providing critical insights into how technological advancements influence their daily experiences.

2.4. Statistical Methods

Statistical analysis of the mean indices was performed with all variables of the specified domains ‘Communication’, ‘Learning’, ‘Mobility’, ‘Self-care’ ‘Domestic Life or Social Support’ and ‘Interpersonal Relationships’ and the dependent variable ‘‘Do you believe that the use of new technologies has improved aspects of your daily life?’, using STATA/MP 17.0 software. Mean index and standard error analyses are presented for the ASD variables.
This questionnaire employed a Likert scale, which presents challenges for parametric tests due to its ordinal nature. The Likert scale categorizes responses into ordered categories without assuming equal intervals between them, making it non-continuous and less suitable for traditional parametric analyses. Therefore, an ANOVA analysis was conducted to explore potential differences among groups based on Likert-scale responses related to the dependent variable. In addition to ANOVA, several non-parametric tests were performed, such as Spearman’s correlation and the Kruskal–Wallis test.
Non-parametric tests offer a robust alternative when the assumptions for parametric tests are violated, such as the non-normality or heterogeneity of variances. By incorporating both parametric and non-parametric analyses, a comprehensive understanding of the data can be achieved, ensuring the robustness and reliability in the findings.
These tests were used to examine the relationship between each independent variable and the dependent variable ‘Do you believe that the use of new technologies has improved aspects of your daily life?’. For the Spearman test, a p-value < 0.05 indicates a statistically significant correlation. For Kruskall–Wallis, if the p-value is ≥0.05, there is not enough evidence to support significant differences between the medians of the compared categories.

2.5. Reliability and Internal Consistency Analysis

Given the questionnaire nature of the study, an analysis of internal consistency using Cronbach’s alpha was conducted across the various domains encompassing the independent variables and the dependent variable. The test of average interitem correlation was conducted to assess the internal consistency within each domain of the questionnaire. For Cronbach’s alpha, a minimum value of 0.70 is typically considered acceptable for research purposes, indicating sufficient reliability. The average interitem correlation should ideally fall between 0.15 and 0.50, suggesting moderate to strong interrelatedness among the variables within each domain. This analysis provides insights into how closely related the items within each domain are, ensuring that the questionnaire measures the intended constructs reliably.

2.6. Factor Analysis

For the ASD and CA groups, and the ASD and CD groups, a factor analysis will be conducted to evaluate two aspects—uniqueness and the Kaiser–Meyer–Olkin (KMO) measure—as well as the factor structure using Varimax rotation. Varimax rotation will be used as an orthogonal technique to simplify the interpretation of the factors by maximizing high factor loadings on some factors and minimizing low loadings on others. This will facilitate the identification of variables that are strongly associated with each factor, making the resulting model more interpretable and useful for data analysis. Uniqueness measures the proportion of each variable’s variability that is not explained by the extracted factors. Low uniqueness values below 0.5 indicate that a variable is well represented by the factors, which reinforces the validity of the factor model. Values above 0.6 suggest that the sample is adequate, while values below 0.5 indicate that the data are not ideal for this analysis.

2.7. Quantum Algorithms

Based on the results, an appropriate quantum algorithm will be used to analyze the relationships between the independent variable of technology ‘Do you believe that the use of new technologies has improved aspects of your daily life?’ and the specific domains wherein dependent variables have obtained significance according to the p-value Pearson correlation.
The proposed algorithm will use the Hamiltonian operator, which is particularly suitable for modeling complex interactions between variables. Hamiltonians are fundamental in quantum simulation, allowing for the simulation of the temporal evolution of a quantum system. This capability is particularly valuable for studying how correlations between variables change over time or under different conditions [49,50].
By using quantum simulation techniques, one can obtain an exact description of the interactions, surpassing the limitations of classical methods.
This adaptability allows for the efficient handling of both small and large systems, making Hamiltonians a scalable solution for quantum data analysis [51].

3. Results

For each domain, the analysis includes statistical evaluations using both parametric and non-parametric methods. Non-parametric tests do not assume a normal distribution of data, which is advantageous when dealing with diverse and heterogeneous datasets like those found in studies of ASD and related developmental conditions.

3.1. Parametric and Non-Parametric Statistical Analysis

Table 3 concerns the statistical analysis of the data. In the domain of Communication, there are pronounced differences in several areas. For instance, the item “…speak in an understandable way or make sentences that make sense” has an ANOVA value of 9.60 and p < 0.05, indicating substantial variability in how different groups can effectively articulate their thoughts. This suggests that some groups may face challenges in clear verbal expression, impacting their overall communication effectiveness. Similarly, the item “…understand the meaning of what others say” has an ANOVA value of 6.13 with p < 0.05, showing differences in comprehension abilities. For example, individuals who can better understand spoken language might have a more effective interaction with others compared to those who struggle with comprehension.
The item “…use the telephone (landline or mobile) or other communication devices” exhibits an exceptionally high ANOVA value of 35.46 with p < 0.05, highlighting significant differences in the ability to use communication devices. This variance could be due to factors such as familiarity with technology or the presence of physical or cognitive barriers that affect device usage. For instance, individuals with more advanced communication skills might use phones and other devices more efficiently, whereas others might face challenges due to less familiarity or physical limitations.
In the Learning domain, significant differences are seen in the ability to perform both simple and complex tasks. For instance, the item “…carry out simple tasks” has an ANOVA value of 5.01 with p < 0.05, indicating notable variability in performing basic tasks. This may reflect differences in cognitive processing or support received, whereby some individuals can manage simple tasks independently, while others might require assistance.
The item “…carry out complex tasks” shows an ANOVA value of 4.94 with p < 0.05, revealing differences in handling more intricate tasks. This could include activities requiring higher levels of problem-solving or multi-step processes. The Kruskal–Wallis test confirms this with a value of 12.600 and p < 0.05, indicating significant differences in the median abilities of groups. For example, individuals who can effectively manage complex tasks might have developed better cognitive strategies or received more comprehensive support compared to those who find such tasks challenging.
In the Mobility domain, significant differences are apparent in various physical activities. For example, the item “…change position” has an ANOVA value of 8.06 with p < 0.05, indicating variability in how groups manage physical repositioning. This difference could be influenced by physical strength, coordination, or the presence of assistive devices.
The item “…manipulate small objects with hands and fingers” demonstrates significant differences with a Kruskal–Wallis value of 11.236 and p < 0.05, highlighting variations in fine motor skills. For example, individuals with dexterity issues may struggle with tasks requiring precise hand movements, affecting their ability to perform everyday activities like buttoning a shirt or handling small tools.
The item “…walk or move around inside the home” has an ANOVA value of 1.82 with p < 0.05, reflecting differences in the ability to navigate indoor environments. These differences could be related to physical strength, balance, or the layout of the living space. Variability in mobility can impact an individual’s independence and their ability to perform routine tasks within their home.
In the Self-Care domain, significant differences are observed in personal hygiene and daily care tasks. For example, the item “…perform basic body care” shows an ANOVA value of 3.33 with p < 0.05, indicating variability in managing personal hygiene tasks. This may include activities such as bathing or grooming, where some individuals may require more support due to physical or cognitive limitations.
The item “…eat and drink” demonstrates significant differences, with a Kruskal–Wallis value of 5.132 and p < 0.05, reflecting variability in the ability to perform eating and drinking activities. This could be influenced by factors such as fine motor skills, oral motor function, or access to appropriate utensils and food. Individuals facing difficulties in this area might need assistance with mealtimes, impacting their nutritional intake and overall well-being.
In the Domestic Life domain, significant differences are observed in managing household responsibilities. For instance, the item “…manage the household budget” has an ANOVA value of 2.20 with p < 0.05, indicating variability in financial management skills. Some individuals may handle budgeting tasks with ease, while others might struggle, possibly due to differences in financial literacy or support systems.
The item “…prepare meals” shows a Kruskal–Wallis value of 7.243 with p < 0.05, suggesting differences in meal preparation abilities. This could reflect varying levels of culinary skills or access to resources like cooking facilities and ingredients. Individuals who are more skilled in meal preparation might be able to cook diverse and nutritious meals, whereas others might face challenges that limit their dietary options.
The item “…go to the toilet and relieve yourself or take care of your intimate hygiene” also shows variability, with an ANOVA value of 3.03 and p < 0.05, indicating differences in managing personal hygiene related to toileting. This task may present challenges for individuals with mobility issues or cognitive impairments, affecting their ability to maintain personal hygiene independently.
In the Individual Relationships domain, most items did not show statistically significant differences. For example, the items “…show affection, respect or feelings” (with ANOVA values around 1.87 and p > 0.05) and “…create and maintain relationships with friends, neighbors, acquaintances, subordinates, superiors, or colleagues” (with ANOVA values around 2.22 and p > 0.05) did not reveal significant variability. These results suggest that skills related to forming and maintaining relationships are relatively consistent across different groups, indicating that such interpersonal abilities might be less influenced by the factors that affect other domains.
In the context of the provided data, several variables exhibited skewness or kurtosis that deviated from normality, as indicated by the Shapiro–Wilk test and the skewness–kurtosis results.

3.2. Pearson Correlation Analysis for ASD, ASD and CA and, and ASC and CD

Individuals with ASD alone have a negative correlation of −0.2994 (p < 0.05), indicating moderate difficulty. This difficulty is exacerbated in those with ASD + CA, who exhibit a stronger negative correlation of −0.5765 (p < 0.05), pointing to a more significant challenge in learning simple tasks.
This difficulty is more pronounced in individuals with ASD + CA, who have a strong negative correlation of −0.6375 (p < 0.05), reflecting significant challenges with fine motor tasks.
However, individuals with ASD + CA show a weaker positive correlation of 0.0424, while those with ASD + CD have a negative correlation of −0.1291, indicating more pronounced difficulties.
This difficulty is more pronounced for individuals with ASD + CA (−0.4367) and ASD + CD (−0.5433), indicating that meal preparation becomes increasingly challenging with additional conditions.
For example, individuals with ASD alone show a slight negative correlation of −0.1795 for ‘associating with unknown people’, suggesting some difficulty, but less severe compared to other domains. This variability suggests that the impact on individual relationships may be more influenced by personal experiences than by the presence of specific additional conditions (Table 4).

3.3. Reliability and Consistency Analysis

The Cronbach’s alpha values are consistently above 0.8, such as 0.8326 and 0.8417 (Table 5), reflecting good internal consistency.

3.4. Quantum Associative Memory Algorithm

To explicitly incorporate the role of quantum simulation in analyzing the relationships between technology use, Autism Spectrum Disorder (ASD), and related conditions like anxiety and depression, this study employs quantum simulation techniques to model complex interactions among variables. Specifically, we focus on the independent variable ‘Do you believe that the use of new technologies has improved aspects of your daily life?’ and its correlations with dependent variables tied to functional domains in ASD (e.g., difficulties in communication and task performance), identified through significant Pearson’s correlations (p < 0.05). Quantum simulation enhances this analysis by representing each variable as a qubit within a quantum system, leveraging the Hamiltonian operator to capture intricate interactions and energy states that classical methods may oversimplify. Unlike traditional approaches, quantum simulation exploits superposition and entanglement to explore nonlinear relationships and temporal dynamics, offering a more nuanced understanding of how technology influences these domains in ASD and co-occurring conditions. For instance, the Quantum Associative Memory (QAM) algorithm is applied to associate technology use with multiple dependent variables simultaneously, revealing patterns that might be computationally infeasible with classical techniques. This approach not only provides a precise mathematical framework, but also scales efficiently to larger datasets, facilitating deeper insights into the interplay of autism, mental health, and technological impact.
In summary, the QAM algorithm would facilitate the exploration and understanding of how technology influences specific domains differently across ASD and CA, leveraging the significant correlations identified in Table 1 and the mean index analyses conducted.
The dependent variables are selected by the significant Pearson’s correlation for the cases of ASD in CA/CD, which are the following:
  • A1. Difficulties in understanding and expressing themselves through written language;
  • A2. Difficulties in learning how to do simple things when receiving personal help or assistance;
  • A3. Difficulties in carrying out complex tasks when receiving personal help or assistance.
In addition, there is the dependent variable ‘A4. Do you believe that the use of new technologies has improved aspects of your daily life?’
To represent these variables in a quantum model, we assigned one qubit to each independent variable and one to the dependent variable. The coefficients αi and βi represent the influences of the independent variables on the dependent variable and the self-interactions of the dependent variable, respectively. The proposed model is a Hamiltonian in QAM, and it is expressed by
H = i = 1 3 i α i A i + β i B i + i   δ i A i B i  
where the following pertains:
αi are the coefficients of the independent variables A1, A2, and A3;
β is the coefficient of the dependent variable A4;
δi are the interaction coefficients between each independent variable Ai and the dependent variable B.
The quantum circuit graph using logic gates is represented in Figure 1, where the following pertains:
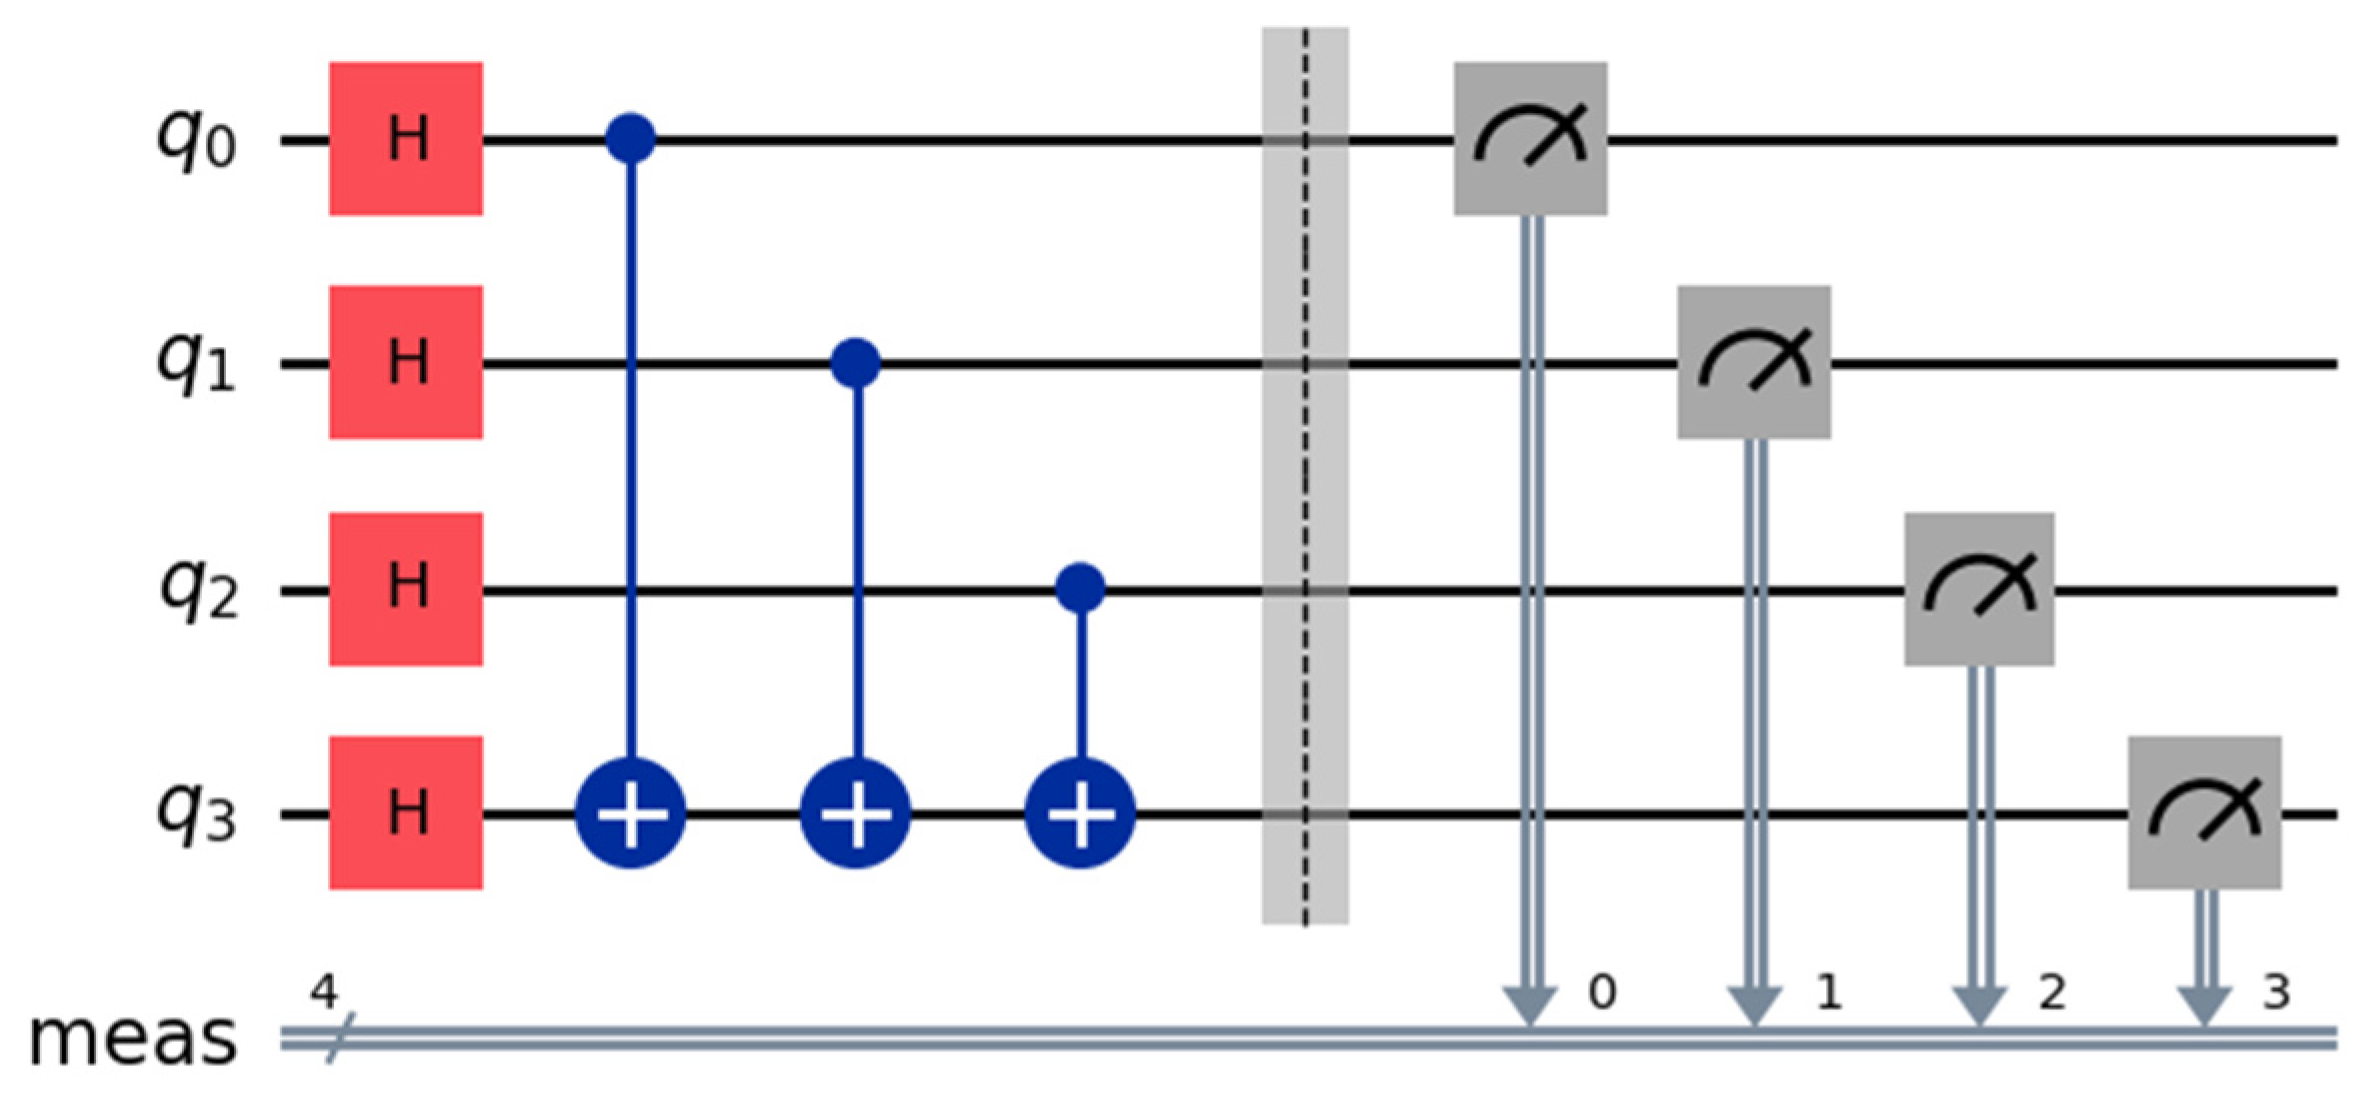
  • Hadamard gates (H) initialize qubits in a superposition;
  • CNOT gates (with a point) represent the interactions between the independent and dependent variables;
  • Measurement gates (M) measure the final state of the qubits.
The quantum circuit begins with the application of Hadamard gates to each qubit, thereby creating an initial state of superposition. Subsequently, CNOT gates are used to entangle the qubits corresponding to the independent variables Ai with the qubit of the dependent variable B. Finally, a measurement is performed on the B qubit to obtain results that reflect the quantum correlations between the variables, as predicted by the defined Hamiltonian.
This quantum simulation not only provides a visual and mathematical representation of the interactions between the variables of interest, but also allows the exploration of quantum phenomena such as superposition and entanglement, which can reveal nonlinear and complex relationships between the study variables. Measurement results offer a unique quantum perspective on how independent variables impact the dependent variable within the theoretical framework of quantum mechanics applied to modeling complex systems.
Algebraically, this quantum circuit starts with the 16-dimensional state vector for |0000⟩, represented as ∣ψ0⟩ = (100….0), and applies the tensor product of four Hadamard matrices, H4 = H⊗H⊗H⊗H, where H = 1 2   1   1   1 1   , to create a uniform superposition across all possible four-qubit states, resulting in ∣ψ1⟩ = H4∣ψ0⟩ = 1 4 (111…1).
Each qubit’s transformation by the Hadamard gate yields an equal distribution of amplitudes. Following this, three CNOT gates are applied, each represented by a 16 × 16 permutation matrix where qubits 0, 1, and 2 control qubit 3, leading to entanglement; the final state is given by ∣ψ2⟩ = CNOT2,3⋅CNOT1,3⋅CNOT0,3⋅∣ψ1⟩, where each CNOT matrix permutes specific rows based on the control–target relationship. The final state vector after these operations reflects a complex superposition and entanglement pattern, which requires much computation to describe explicitly due to the intricacy of the entanglement involved.
This quantum circuit, implemented using Qiskit, consists of four qubits initialized in the |0⟩ state. First, Hadamard gates (H) are applied to each qubit, creating an equal superposition of all possible 4-bit states, ranging from |0000⟩ to |1111⟩. Subsequently, three controlled-NOT (CNOT) gates are applied, where qubits 0, 1, and 2 act as control qubits, and qubit 3 serves as the target qubit. These CNOT gates entangle the state of qubit 3 with the states of the first three qubits, resulting in a highly entangled quantum state. The circuit is then visualized using using the Phyton library Matplotlib (“mpl”) to display its structure graphically.
  • # Create a quantum circuit with 4 qubits
  • qc = QuantumCircuit(4)
  • # Apply Hadamard gates to each qubit
  • qc.h(0)
  • qc.h(1)
  • qc.h(2)
  • qc.h(3)
  • # Apply CNOT gates with qubits 0, 1, and 2 as controls and qubit 3 as the target
  • qc.cx(0, 3)
  • qc.cx(1, 3)
  • qc.cx(2, 3)
  • # Add measurement to all qubits
  • qc.measure_all()
  • # Draw the circuit
  • qc.draw(“mpl”)
The representation of this circuit is included in Figure 1.
The analysis of the quantum circuit results shows a relatively uniform distribution of correlations across the 16 possible states, with counts ranging between 49 and 78 (see Figure 2). This suggests that the correlations between the variables A1, A2 and A3 (representing difficulties in various areas) and the dependent variable A4 (reflecting the perceived improvement through technology use) are fairly balanced. However, the state 1110, with 78 counts, stands out as the most dominant, indicating a stronger correlation in this case. This state reflects a significant interaction between the variables, where the difficulties in A1, A2, and A3 are associated with a perception of improvement in A4. This suggests that in this particular pattern of interactions, the influence of the difficulties on the perception of technology is more pronounced. On the other hand, the state 0111, with 49 counts, shows the fewest measurements, indicating a weaker or less significant correlation compared to other states. However, the presence of several intermediate states with counts ranging between 60 and 70 reflects a balanced distribution of probabilities, suggesting that the relationships between the variables are generally consistent, although there is no single dominant state. This variability is typical in quantum systems, where the behavior of the variables does not follow a predictable linear structure. This pattern of distribution can be attributed to the quantum entanglement between the qubits. The CNOT gates applied between the qubits corresponding to the independent variables (A1, A2, A3) and the dependent variable (A4) create a non-classical correlation between these qubits, allowing the probabilities of the states to be distributed in a complex and entangled manner. Entanglement means that the state of each qubit cannot be described independently, but is intrinsically linked to the state of the other qubits. This phenomenon is key to explaining the uniformity in the counts, while also accounting for the dominance of certain states like 1110, which reflect stronger interactions between the variables. In summary, while the counts are relatively uniform across the range of states, quantum entanglement generates complex relationships between the variables, favoring certain states with higher correlation, such as state 1110, which represents the most significant interactions between the variables in the model.

4. Discussion

The analysis results provide a detailed insight into how individuals with ASD and associated conditions (such as concomitant developmental conditions, CD, or additional conditions, AC) perform in various domains of daily life. Both parametric and non-parametric statistical methods are employed to assess differences and relationships in areas such as communication, learning, mobility, self-care, domestic life, and individual relationships. The findings underscore the importance of combining parametric and non-parametric methods to accurately capture variability and strengthen the study’s conclusions. Furthermore, this approach reinforces the need for the development of a differentiated approach for carrying out technological or combined interventions, adapting to the specific needs of each diagnostic group.
The results suggest that the domains in which people find the most challenges are Communication and Learning, finding a significant correlation between communication skills and the ability to learn and perform simple tasks with the dependent variable, that is, the positive impact of new technologies. However, the Mobility and Personal Care domains are also correlated, but show a different pattern from the previous two domains, indicating differences in each subdomain in relation to technology.
In the domain of Communication, significant differences are observed in key skills, such as the ability to speak intelligibly and understand what others say. ANOVA values and tests like Kruskal–Wallis show variability between groups, suggesting that persons face greater challenges in verbal expression and the use of communication devices, which may be related to their level of familiarity with technology or cognitive and physical barriers.
Regarding Learning, differences are evident in the ability to perform simple and complex tasks. The analysis shows that individuals with ASD and additional conditions (AC or CD) face greater difficulties, which may be due to differences in cognitive processing or the type of support received. For example, the ability to perform complex tasks is more affected in individuals with ASD and CD, reflecting potential challenges in advanced cognitive strategies.
The analysis of the Mobility domain reveals significant differences in physical activities, such as changing positions or manipulating small objects. Non-parametric tests, such as the Kruskal–Wallis test, highlight variability in fine motor skills, where some groups show considerable difficulties, possibly due to dexterity or coordination issues.
In Self-Care, significant differences are evident in tasks related to personal hygiene and feeding. For example, some individuals with ASD require more support to perform basic body care or to eat and drink, impacting their independence and overall well-being.
In the domain of Domestic Life, skills related to managing household responsibilities, such as preparing meals or managing a budget, also show significant variability. Persons with ASD and additional conditions may face greater difficulties in these areas, which could be due to a lack of culinary or financial management skills.
In the domain of Individual Relationships, it is observed that the skills required to show affection or maintain relationships do not show such pronounced differences between groups, suggesting that these abilities may be less influenced by the conditions affecting other domains. Among the different factors presented by this population with ASD are sensory overload [52], low flexibility in routines, and difficulties in interpreting and managing different social situations, all of which are related to the high prevalence of anxiety in this study. The same is true for high levels of depression, which seems to be linked to the accumulation of negative experiences that lead to the desire for social isolation and future alexithymia [53]. Both disorders have a considerable impact on the quality of life of people with ASD, aggravating their difficulties in mobility, independence, and interpersonal relationships.
Additionally, the reliability and internal consistency analysis shows that domains like Self-Care and Domestic Life exhibit high internal consistency across different groups, with Cronbach’s alpha values above 0.8, indicating strong measurement reliability. However, the Individual Relationships domain presents more variability, particularly in subgroups with comorbid conditions like ASD + CA, where lower correlation coefficients and Cronbach’s alpha values suggest reduced reliability.
This may be due to the differences in the symptom profiles and needs that are addressed in the three disorders, which are reflected in the indices that make up QoL. In the case of ASD, they have difficulties in the perception of emotions and cognitive deficits, which can affect the development of communication skills and social interaction. For this reason, they present challenges for communication, and the main motivation of some studies is the analysis of the communication process in ASD [54,55].
This is why variability is found in the structure of the indices, with ASD affecting socialization and learning skills more, while AC and CD may present a greater impact on mobility or other areas. In major depressive disorder, among the symptoms that patients present are the absence of facial expression and few body movements, as well as changes in speech [56].
From other perspectives, the results of this paper indicate that Autism Spectrum Disorder (ASD) tends to be chronic and debilitating, affecting the quality of life (QoL) and necessitating timely intervention. Technology could be useful in the domains of learning and communication for people with ASD, although the results are different in the case of mobility and self-care. However, similar patterns are found in AC and CD, that is, both can affect specific areas of quality of life but do so in a different ways, varying between people.
Although this study highlights the importance of combining statistical methods to assess variability across different domains of daily life, the rapid evolution of technologies may alter the dynamics observed and analyzed. As new tools and approaches are introduced, new correlations and patterns in the data that have not yet been identified may emerge. For example, integrating advanced artificial intelligence and machine learning techniques in data analysis could reveal new insights into how technologies impact various domains of daily functioning in individuals with ASD and associated conditions. These technological advances could provide a more detailed and precise understanding, helping to tailor interventions more effectively and personally to people’s needs.

4.1. Future Patterns in New and Emerging Technologies to Treat ASD and Concomitant Developmental Conditions Such as Anxiety and Depression

The QAM algorithm applied theoretically in this work could be very useful in avoiding the dysfunctionality of questionnaires and facilitating a more precise and efficient assessment of psychological and behavioral characteristics, improving the quality and reliability of the data collected. The QAM algorithm allows for the association of multiple input variables (such as technology use and various domains) with output variables on their correlations. It can effectively handle the diverse and scattered nature of the variables observed, providing insights into how technology impacts different domains across conditions like ASD, CA, and CD. In this study, the QAM algorithm facilitates the exploration and understanding of how technology influences specific domains differently across ASD, CA, and CD, leveraging significant correlations identified and mean index analyses. By emphasizing variables consistently identified as significant across both CA and CD groups, this study aims to enhance the robustness of its findings and interpretations. Moreover, the study introduces the Quantum Associative Memory (QAM) algorithm to model the impacts of independent variables, such as difficulties in communication and task management, on perceptions of how technology influences daily life. This quantum approach allows for the exploration of complex, nonlinear relationships between variables, offering insights that traditional statistical methods might overlook, thereby broadening the understanding of how technology affects different domains across ASD, CA, and CD conditions, which could be combined with different therapies and technologies. For example, PsicAP therapy has shown efficacy in treating anxiety, depression, and somatization, highlighting the importance of emotional regulation and digital interventions [57], which could be combined with emerging technologies such QAM or existing technologies such social robots.
Apart from QAM, the determination of which strategies are the most suitable for each individual needs to comply with standardized criteria. For example, emotion is a criterion that is useful to consider from different perspectives, and with the help of technological devices. The second criterion is the application of non-invasive techniques, which includes bracelets, mobile applications, skin or temperature sensors, facial recognition technology, virtual reality or augmented reality devices, voice analysis technology, physical activity tracking devices (movement patterns and activity), and electrodermal sensors (GSR) [58].
Moreover, social robots are among the devices that are involved in emotion recognition. These machines were created in the 1990s, and have the ability to communicate with people through language; they can perform certain behaviors and adapt to social norms in different contexts such as hospitals, educational centers, work, and even in the home environment. To do this, social robots are capable of understanding a wide variety of human actions and responding to them with a human-like appearance, as well as showing certain traits that make up a personable personality and appearance, being able to engage in conversations with a high level of complexity, and achieving a certain level of confidence. with the person through the empathy that a social robot can produce [59].
An example of a social robot used to meet emotional criteria is Asimo, developed in 2000, which has the ability to identify faces and voices and converse in several languages, and even has the ability to manipulate objects using tactile sensors in its hands [60].
Another example is the iCub humanoid robot developed in Italy, which is part of the RobotCub project and has been created for research on human cognition and artificial intelligence. It can crawl, express emotions through the face, and learn and solve different activities and challenges in order to avoid moving obstacles [61].
The NAO humanoid robot, developed in France, has evolved into five different versions. It has abilities such as movement and adaptation to the surrounding environment, and maintains balance due to the degrees of freedom that characterize it. It can listen and chat with humans, in addition to detecting objects that are around it, with access to the internet.
It was followed later by the Pepper robot. This intelligent social robot was initially created by Aldebaran Robotics and later incorporated by Softbank Robotics, and is known as the first humanoid robot, designed to live among humans. Pepper communicates in a natural and friendly manner with all the people around him, with movements similar to those of humans. Its voice is pleasant, and it can recognize not only faces but also different voices and movements, responding to them in different contexts. It adapts its behavior to the interlocutor, although its size draws attention as compared to NAO, as Pepper is taller and larger, in addition to supporting a tablet with which to maintain a more visual and close interaction. However, the main uses of this robot are in shops and gastronomic establishments, or in education studies, via a Japanese app that provides online classes through the robot’s screen [62]. In line with technology that can strengthen our emotional intelligence, Pepper is implemented and equipped with skills for social interaction, allowing it to open new lines of research into autism. Other humanoid robots, such Keepon, promise to be very collaborative and effective, helping to improve social relationships, but also ground greater analyses and expressions of feelings [63]. Other positive examples applied in the context of autism include animal-like robots (zoomorphic), such as the AIBO dog or Kasha, which have been used in autism studies to treat verbal engagement and social communication, with positive results [64].
Recently, the Kaspar robot has been used to promote cooperative play, reduce isolation, and improve body awareness and the sense of self in children with ASD. Kaspar is equipped with touch sensors that allow children to observe how their actions affect the robot’s movement, encouraging turn-taking interactions, a rare behavior in children with ASD. However, Kaspar has limitations in its behavioral reaction capacity, as it cannot perform actions such as walking, grasping objects, or making fine hand gestures [64].
In comparison, the QTrobot is smaller than the Pepper robot; this is a great advantage due to its similarity with the physical dimensions of a child, and its voice is friendlier, dedicated to teaching new communicative, emotional and social skills in children diagnosed with autism or in special education settings [65]. Also considered are the robotic toys used in the study of Autism Spectrum Disorder (ASD), a set of mini-humanoid robots that look like dolls that are part of a project called Robota. The Robota studies have two main objectives: to test the reactions of children with autism to the human characteristics of a robot, and to assess their ability to distinguish between their actions and those of others. The results indicate children’s initial preference for interacting with a simple robot rather than a human or a more humanoid robot. Some children are able to communicate with the robot without the therapist present, but the robot is usually used as a mediator between the therapist and the children [66].
The current uses of disruptive technologies such as social robots have sparked widespread debate over their alleged dangers, inadequate therapeutic applicability, and social acceptance. However, there is no consensus regarding the emotional alignment offered by the use of such robots. From another perspective, technology could affect how interventions are carried out for such diseases from a holistic view, based on the positive results on QoL derived via therapies addressing anxiety interventions under the auspices of social skills. However, in the medium term, if these symptoms do not progress appropriately, other psychological disorders may develop.
In this way, they can offer advances in areas such as diagnosis and the personalization of treatment, as well as modeling and simulation, helping us to understand in a deeper way the underlying mechanisms of developmental disorders. In addition, this can involve the optimization of technology-based therapies, such as social robots and virtual reality applications that improve adherence to therapy, and offer new solutions for data security and privacy (as they protect sensitive information) and, in many cases, the protection of minors.
Additionally, future studies must consider not only the potential benefits of these technologies, but also their ethical implications, such as data privacy and the impacts on human interactions. Concerns about the use of these tools must be addressed comprehensively to ensure that the rights and dignity of the individuals using them are respected. As new technologies are developed and adopted, it is crucial for researchers and professionals in the field to collaborate in establishing ethical standards and best practices that balance innovation with the protection of individuals and their well-being.

4.2. Limitations of the Study

In social psychology studies, structural equation modeling is used to relate the scores of different tests, usually administered in groups or via online questionnaires. However, participants in these studies may not be fully engaged, affecting the accuracy of their responses. The absence of the researcher during questionnaire administration can also lead to inaccurate responses. Recent models in personality and social psychology, despite being complex, often do not consider the tendency of participants to provide socially desirable answers.
Additionally, some researchers assume high reliability between scales with similar items without proper evaluation. The quality of tests varies, and it is crucial for researchers to assess their validity before using them. The inability to distinguish between reliable and low-validity tests can result in the prolonged and dogmatic use of these tools without an adequate empirical basis [67].
This study, like other psychological questionnaires, questions the meaning of ‘measurement’ in psychological testing. While numbers are produced during scoring, their validity as true measurements of behavior is debatable. Philosophers argue that psychological test numbers differ from physical measurements, and may be inappropriate for statistical analyses. Psychological traits may not be truly quantifiable, highlighting the inadequacy of conventional statistical methods for addressing this complexity [67].
A brief review of prior studies on the relationship between mental health, technology perception, and quality of life in ASD, anxiety, and depression shows that raising an autistic child significantly impacts parental quality of life. It causes emotional, social, physical, and economic stress, with autism traits leading to greater parental stress than other disabilities. This stress results in poorer quality of life, less social support, dissatisfaction in relationships, feelings of isolation, and career sacrifices to care for autistic individuals [68,69].
Added to this, the next limitation of this study is the presence of social conception and the influence of individual perceptions. In this regard, the importance of supporting caregivers in emotional and social aspects must be highlighted, giving them the social recognition they deserve, because when we face many daily difficulties, they can generate anxiety, becoming something overwhelming that causes negative effects on the person’s QoL, as well as on their cognitive domain, and therefore, on their relationships with the environment, being considered maladaptive. For example, factors associated with ASD, such as the presentation of psychiatric comorbidities, the family environment, income level, or even parental roles, affect the levels of anxiety of both autistic people and their family or friends ç [70]. One of the aspects that most influences the quality of life of parents with children with autism is the low support they receive from society to be able to take care of their children. This can affect the severity of the autistic traits. Although anxiety is not always negative, it can represent an advantage in adapting to our environment if accompanied by appropriate coping strategies [68]. Therefore, it should not be underestimated that certain domains analyzed in ASD, CA, and CD did not show significant correlations. However, this does not necessarily mean that this accurately reflects the true situation. Various factors could contribute to this lack of correlation, including the complexity of measuring outcomes in these conditions, the diversity of symptoms and presentations within each disorder, or the limitations of the assessment tools used. Moreover, the nature of correlation in psychological and developmental disorders is intricate and multifaceted. It often involves dynamic interactions between biological, environmental, and individual factors, which may not always manifest in straightforward statistical relationships.

5. Conclusions

This study has provided valuable insights into the impact of technology on the quality of life (QoL) of individuals with Autism Spectrum Disorder (ASD), Chronic Anxiety (CA), and Chronic Depression (CD). The findings show that the perceptions these individuals have of technology (especially user-centered technologies) play a significant role in their perceived improvements in well-being.
The perception of technology by people with ASD, anxiety, and/or depression can provide information about the level of difficulty they perceive and their quality of life (QoL). This suggests that person-centered technologies can improve both cognitive abilities (such as memory and joint attention) and physical functions in people with autism, improve anxiety management, alleviate depression, and support people with dementia.
Personalized apps and devices have proven effective in enhancing different functions for participants. For individuals with ASD, such interventions led mainly to cognitive and communicative benefits—with memory and joint attention being two critical areas. Improvements in these functions help the individuals with ASD in being able to participate better in social interactions, as well as other daily activities. On the other hand, participants with ASD and CD reported improvements primarily in the mobility and self-care domains. This finding indicates that individuals with these disorders derive greater benefits from being able to carry out daily activities with more independence and less anxiety.
Personalizing technologies may be the best way to ensure that therapeutic benefits are maximized for particular groups. Quantum computing algorithms have, indeed, found use in applications analyzing large data volumes; basically, they can accommodate complex pattern recognition where traditional methods fail. This has enabled the discovery of some deeper relationships and correlations among the key variables (ASD, AC, and DC) that could help in designing more appropriate technological interventions specifically tailored to individual users’ needs. These algorithms have allowed a much keener and finer examination of the challenges and requirements of people with ASD as well as anxiety and depression, which can subsequently enhance existing technological interventions.
In summary, the lack of human resources in mental health provided by the state, with fewer professionals in psychiatry and psychology, represents one of the daily barriers that influence affected people and their environment, which could be alleviated through technological advances. This offers adequate tools to improve mental health, thus improving the quality of life of many people with autism, anxiety and depression, and their caregivers.

Suggestions for Future Developments

This study offers valuable information, but there are several potential fields of study for future research and technological developments. It is suggested to explore areas such as virtual reality, augmented reality and wearable devices to improve emotional regulation and cognitive functions in people with ASD, anxiety and depression.
In addition, the use of artificial intelligence (through machine learning and other techniques) could tailor, and therefore further personalize, interventions to users. It is key to consider the scalability of these technologies in different population and cultural contexts, and to develop interventions tailored to them. The impacts of caregiver involvement in technology interventions to improve emotional and social support should also be investigated. Finally, applying quantum computing together with artificial intelligence to other disorders could bring about significant advances in the field of mental health.

Author Contributions

G.B.-R. preparation, preparation, method, exploitation of data, bibliography, review. V.Z.-M. preparation, exploitation of data, methods and results, review. N.G.-A. review, approval, and search for funding. E.F. review, approval, search for funding. J.M.F. review, approval, search for funding. All authors have read and agreed to the published version of the manuscript.

Funding

This project received funding from the grant PID2020-115220RB-C22 funded by MCIN/AEI/10.13039/501100011033 and, as appropriate, from ‘ERDF A way of making Europe’, the “European Union” or the ‘European Union NextGenerationEU/PRTR’; grant RTI2018-098969-B-100 from the Spanish ‘Ministry of Science, Innovation and Universities’, grant PROMETEO/2019/119 from the Valencian Community (Comunitat Valenciana) in Spain, and INNTA1/2022/23 Project ‘Innovation Agent for the Bioengineering Institute, Miguel Hernandez University’ (2022–2024), co-financed by Valencian Community EU-FEDER Program, 2021–2027 and the Accessible Technologies Award from Indra and Fundación Universia.

Institutional Review Board Statement

This study was carried out with the ethical approval of the Miguel Hernández University, with the code AUT.IB.EFJ.240202. All stages of the research were carried out in accordance with established ethical standards. Secondary data from the National Institute of Statistics (INE) of Spain are used. The INE obtains informed consent and guarantees the confidentiality of participants’ data through the established CATI (computer-assisted telephone interview) and CAWI (computer-assisted web interview) methods. To analyze the secondary data, we received ethical approval from the Miguel Hernández University, ensuring compliance with all ethical regulations relevant to our specific use of the data, with the code AUT.IB.EFJ.240202.

Informed Consent Statement

Informed consent was obtained from all subjects involved in the study.

Data Availability Statement

The data from the “Survey of Disability, Personal Autonomy and Dependency Situations (2020)”, developed by the National Institute of Statistics (INE), are available at https://www.ine.es/dyngs/INEbase/en/operacion.htm?c=Estadistica_C&cid=1254736176782&idp=1254735573175. Accessed on 15 June 2024. The methodology employed for the questionnaire encompassed various aspects related to QoL based on the WHO dimensions of the WHOQOL-100 scale, available at https://www.who.int/tools/whoqol/whoqol-100.

Conflicts of Interest

The authors declare no conflicts of interest.

References

  1. WHOQOL-Measuring Quality of Life|The World Health Organization. Available online: https://www.who.int/tools/whoqol (accessed on 6 December 2023).
  2. Martínez, V.T.P.; Montero, O.A.A. Necesidades de aprendizaje de los especialistas de Medicina General Integral sobre los trastornos del espectro autista. Rev. Cuba. Med. Gen. Integral. 2013, 29, 267–280. [Google Scholar]
  3. Oreskovic, N.M.; Neumeyer, A.M.; Duggan, M.P.; Kuhlthau, K.A. Assessment of Walking Routes as a Possible Approach for Promoting Physical Activity in Children with Autism Spectrum Disorder: Brief Report. Dev. Neurorehabilit. 2020, 23, 59–63. [Google Scholar] [CrossRef] [PubMed]
  4. Ferreira, J.P.; Toscano, C.V.A.; Rodrigues, A.M.; Furtado, G.E.; Barros, M.G.; Wanderley, R.S.; Carvalho, H.M. Effects of a Physical Exercise Program (PEP-Aut) on Autistic Children’s Stereotyped Behavior, Metabolic and Physical Activity Profiles, Physical Fitness, and Health-Related Quality of Life: A Study Protocol. Front. Public Health 2018, 6, 47. [Google Scholar] [CrossRef]
  5. Huang, J.; Du, C.; Liu, J.; Tan, G. Meta-Analysis on Intervention Effects of Physical Activities on Children and Adolescents with Autism. Int. J. Environ. Res. Public. Health 2020, 17, 1950. [Google Scholar] [CrossRef]
  6. Majhi, S.; Kumar, S.; Singh, L. A Review on Autism Spectrum Disorder: Pathogenesis, Biomarkers, Pharmacological and Non-Pharmacological Interventions. CNS Neurol. Disord. Drug Targets 2023, 22, 659–677. [Google Scholar] [CrossRef]
  7. Susniene, D.; Jurkauskas, A. The Concepts of Quality of Life and Happiness–Correlation and Differences. Eng. Econ. 2009, 63. Available online: https://inzeko.ktu.lt/index.php/EE/article/view/11648 (accessed on 6 December 2023).
  8. Sakip, S.R.M.; Zukri, A.Z.M.; Rahim, P.R.M.A. Assessing the Relationship Between Environmental, Psychological, Physical and Social Towards the Quality of Life. Int. J. Sustain. Constr. Eng. Technol. 2023, 14, 256–265. [Google Scholar] [CrossRef]
  9. Happiness or Quality of Life? Or Both?|Journal of Education Culture and Society. Available online: https://jecs.pl/index.php/jecs/article/view/1408 (accessed on 16 December 2024).
  10. Beneytez, C. Síntomas de ansiedad en los trastornos del espectro del autismo desde un enfoque transdiagnóstico. Universidad Complutense de Madrid. 2019. Available online: https://dialnet.unirioja.es/servlet/tesis?codigo=223238 (accessed on 16 December 2024).
  11. Kerns, C.M.; Kendall, P.C. Autism and anxiety: Overlap, similarities, and differences. In Handbook of Autism and Anxiety; en Autism and Child Psychopathology Series; Springer International Publishing/Springer Nature: Cham, Switzerland, 2014; pp. 75–89. [Google Scholar] [CrossRef]
  12. Sánchez-Cueva, M.S.; Marín, F.A.; Alonso-Esteban, Y. Ansiedad y trastornos del espectro del autismo: Notas para la intervención psicoeducativa. Siglo. Cero. 2022, 53, 4930. [Google Scholar] [CrossRef]
  13. White, S.W.; Oswald, D.; Ollendick, T.; Scahill, L. Anxiety in children and adolescents with autism spectrum disorders. Clin. Psychol. Rev. 2009, 29, 216–229. [Google Scholar] [CrossRef]
  14. Jenkinson, R.; Milne, E.; Thompson, A. The relationship between intolerance of uncertainty and anxiety in autism: A systematic literature review and meta-analysis. Autism Int. J. Res. Pract. 2020, 24, 1933–1944. [Google Scholar] [CrossRef]
  15. Ghaziuddin, M.; Ghaziuddin, N.; Greden, J. Depression in persons with autism: Implications for research and clinical care. J. Autism Dev. Disord. 2002, 32, 299–306. [Google Scholar] [CrossRef]
  16. Hofvander, B.; Delorme, R.; Chaste, P.; Nydén, A.; Wentz, E.; Ståhlberg, O.; Herbrecht, E.; Stopin, A.; Anckarsäter, H.; Gillberg, C.; et al. Psychiatric and psychosocial problems in adults with normal-intelligence autism spectrum disorders. BMC Psychiatry 2009, 9, 35. [Google Scholar] [CrossRef] [PubMed]
  17. Lever, A.G.; Geurts, H.M. Psychiatric Co-occurring Symptoms and Disorders in Young, Middle-Aged, and Older Adults with Autism Spectrum Disorder. J. Autism Dev. Disord. 2016, 46, 1916–1930. [Google Scholar] [CrossRef] [PubMed]
  18. van Heijst, B.F.; Deserno, M.K.; Rhebergen, D.; Geurts, H.M. Autism and depression are connected: A report of two complimentary network studies. Autism 2020, 24, 680–692. [Google Scholar] [CrossRef] [PubMed]
  19. Hopkins, K.; Crosland, P.; Elliott, N.; Bewley, S.; On behalf of the Clinical Guidelines Update Committee B. Diagnosis and management of depression in children and young people: Summary of updated NICE guidance. BMJ 2015, 350, h824. [Google Scholar] [CrossRef]
  20. Kelvin, R. Depression in children and young people. Paediatr. Child Health 2016, 26, 540–547. [Google Scholar] [CrossRef]
  21. Zenebe, Y.; Akele, B.; W/Selassie, M.; Necho, M. Prevalence and determinants of depression among old age: A systematic review and meta-analysis. Ann. Gen. Psychiatry 2021, 20, 55. [Google Scholar] [CrossRef]
  22. Hudson, C.C.; Hall, L.; Harkness, K.L. Prevalence of Depressive Disorders in Individuals with Autism Spectrum Disorder: A Meta-Analysis. J. Abnorm. Child Psychol. 2019, 47, 165–175. [Google Scholar] [CrossRef]
  23. Menezes, M.; Harkins, C.; Robinson, M.F.; Mazurek, M.O. Treatment of Depression in Individuals with Autism Spectrum Disorder: A Systematic Review. Res. Autism Spectr. Disord. 2020, 78, 101639. [Google Scholar] [CrossRef]
  24. Hollocks, M.J.; Lerh, J.W.; Magiati, I.; Meiser-Stedman, R.; Brugha, T.S. Anxiety and depression in adults with autism spectrum disorder: A systematic review and meta-analysis. Psychol. Med. 2019, 49, 559–572. [Google Scholar] [CrossRef]
  25. Earls, F. The epidemiology of depression in children and adolescents. Pediatr. Ann. 1984, 13, 23–31. [Google Scholar]
  26. Fernández, F.C.; Martínez, Á.M.; Martín, A.B.B.; Pérez-Fuentes, M.D.C.; Jurado, M.D.M.M.; Linares, J.J.G. Prevalencia de la depresión en España: Análisis de los últimos 15 años. Eur. J. Investig. Health Psychol. Educ. 2015, 5, 267. [Google Scholar] [CrossRef]
  27. Pardo, G.; Sandoval, A.; Umbarila, D. ADOLESCENCIA Y DEPRESIÓN. Rev. Colomb. Psicol. 2004, 13, 13–28. [Google Scholar]
  28. Nabeshima, T.; Kim, H.-C. Involvement of Genetic and Environmental Factors in the Onset of Depression. Exp. Neurobiol. 2013, 22, 235–243. [Google Scholar] [CrossRef] [PubMed]
  29. Álvaro-Estramiana, J.L.; Garrido-Luque, A.; Schweiger-Gallo, I. Causas sociales de la depresión. Una revisión crítica del modelo atributivo de la depresión. Rev. Int. Sociol. 2010, 68, 333–348. [Google Scholar] [CrossRef]
  30. Moscoso, D.R.B.; Narvaez, L.C.V.; Ortiz, L.F.A.; Ramos, R.A.; Gonzalez, E.M.V. Ansiedad y depresión en adolescentes. Rev. Bol. Redipe 2021, 10. [Google Scholar] [CrossRef]
  31. Theoharides, T.C.; Kavalioti, M.; Tsilioni, I. Mast Cells, Stress, Fear and Autism Spectrum Disorder. Int. J. Mol. Sci. 2019, 20, 3611. [Google Scholar] [CrossRef]
  32. Espada, J.P.; Orgilés, M.; Méndez, X.; Morales, A. Problemas relacionados con la regulación emocional: Depresión y problemas de ansiedad. Libro Blanco Salud Ment. Infanto-Juv. 2021, 1, 18–31. [Google Scholar]
  33. Charlton, R.A.; McQuaid, G.A.; Wallace, G.L. Social support and links to quality of life among middle-aged and older autistic adults. Autism Int. J. Res. Pract. 2023, 27, 92–104. [Google Scholar] [CrossRef]
  34. MacKenzie, K.T.; Theodat, A.; Beck, K.B.; Conner, C.M.; Mazefsky, C.A.; Eack, S.M. Correlates of Quality of Life in Autistic Individuals. Res. Autism Spectr. Disord. 2024, 115, 102401. [Google Scholar] [CrossRef]
  35. Kouroupa, A.; Laws, K.R.; Irvine, K.; Mengoni, S.E.; Baird, A.; Sharma, S. The use of social robots with children and young people on the autism spectrum: A systematic review and meta-analysis. PLoS ONE 2022, 17, e0269800. [Google Scholar] [CrossRef] [PubMed]
  36. Health Quality Ontario. Internet-Delivered Cognitive Behavioural Therapy for Major Depression and Anxiety Disorders: A Health Technology Assessment. Ont. Health Technol. Assess. Ser. 2019, 19, 1–199. [Google Scholar]
  37. Jamwal, R.; Jarman, H.K.; Roseingrave, E.; Douglas, J.; Winkler, D. Smart home and communication technology for people with disability: A scoping review. Disabil. Rehabil. Assist. Technol. 2022, 17, 624–644. [Google Scholar] [CrossRef] [PubMed]
  38. Fellinghauer, B.; Reinhardt, J.D.; Stucki, G.; Bickenbach, J. Explaining the disability paradox: A cross-sectional analysis of the Swiss general population. BMC Public Health 2012, 12, 655. [Google Scholar] [CrossRef]
  39. Niero, M. Disability paradox: I disabili e la felicità. SALUTE E Soc 2005, 32–46. Available online: https://www.francoangeli.it/riviste/articolo@Model.IDArticolo (accessed on 6 December 2023).
  40. Cruceanu, G.L.; Clemente-Belmonte, S.; Herrero-Sanz, R.; Ayala, A.; Zorrilla-Muñoz, V.; Agulló-Tomás, M.S.; Martínez-Miguelez, C.; Fernández-Mayoralas, G. Evaluation of Older People Digital Images: Representations from a Land, Gender and Anti-ageist Perspective. Land 2023, 12, 18. [Google Scholar] [CrossRef]
  41. Van Dooren, M.; De Croon, R.; Swillen, A.; Verbert, K. Bridging the Communication Gap Between People With Cognitive Impairments and Their Caregivers Using mHealth Apps: User-Centered Design and Evaluation Study With People With 22q11 Deletion Syndrome. JMIR Hum. Factors 2023, 10, e44290. [Google Scholar] [CrossRef] [PubMed]
  42. Zannat, N.; Mahmud, M. Exploring mindmend: An innovative mental health support app for autistic adolescents and their caregivers. J. Digit. Syst. Dev. 2024, 2, 1–16. [Google Scholar] [CrossRef]
  43. Terranova, N.; Renard, D.; Shahin, M.H.; Menon, S.; Cao, Y.; Hop, C.E.C.A.; Hayes, S.; Madrasi, K.; Stodtmann, S.; Tensfeldt, T.; et al. Artificial Intelligence for Quantitative Modeling in Drug Discovery and Development: An Innovation and Quality Consortium Perspective on Use Cases and Best Practices. Clin. Pharmacol. Ther. 2024, 115, 658–672. [Google Scholar] [CrossRef]
  44. Blaurock, M.; Büttgen, M.; Schepers, J. Designing Collaborative Intelligence Systems for Employee-AI Service Co-Production. J. Serv. Res. 2024, 10946705241238751. [Google Scholar] [CrossRef]
  45. Benedicto-Rodriguez, G.; Zorrilla-Muñoz, V.; Fernandez, E.; Ferrandez, J.M. Technological Influence on the Measurement of Quality of Life in Persons with Autism Spectrum Disorder. In Proceedings of the Third International Conference on Innovations in Computing Research (ICR’24), Athens, Greece, 12–14 August 2024; Daimi, K., Al Sadoon, A., Eds.; Springer Nature: Cham, Switzerland, 2024; pp. 691–698. [Google Scholar] [CrossRef]
  46. Hong, J.; Bishop-Fitzpatrick, L.; Smith, L.E.; Greenberg, J.S.; Mailick, M.R. Factors Associated with Subjective Quality of Life of Adults with Autism Spectrum Disorder: Self-Report Versus Maternal Reports. J. Autism Dev. Disord. 2016, 46, 1368–1378. [Google Scholar] [CrossRef] [PubMed]
  47. Jariwala, K.; Khanna, R.; West-Strum, D.; Bentley, J.P.; Banahan, B.F.I.; Holmes, E.R.; Barnard, M. Psychometric properties of the world health organization’s quality of life-bref instrument (WHOQOL-BREF) among adults with autism. Value Health 2014, 17, A194. [Google Scholar] [CrossRef]
  48. Mason, D.; Rodgers, J.; Garland, D.; Wilson, C.; Parr, J.; McConachie, H. Measuring quality of life in autistic adults: The reliability and validity of the Brief Version of the World Health Organization Quality of Life scal. AMRC Open Res. 2022, 4, 3. [Google Scholar] [CrossRef]
  49. Mouelhi, Y.; Jouve, E.; Castelli, C.; Gentile, S. How is the minimal clinically important difference established in health-related quality of life instruments? Review of anchors and methods. Health Qual. Life Outcomes 2020, 18, 136. [Google Scholar] [CrossRef]
  50. Klefbeck, K. Educational Approaches to Improve Communication Skills of Learners with Autism Spectrum Disorder and Comorbid Intellectual Disability: An Integrative Systematic Review. Scand. J. Educ. Res. 2023, 67, 51–68. [Google Scholar] [CrossRef]
  51. De Houwer, J.; Barnes-Holmes, D.; Moors, A. What is learning? On the nature and merits of a functional definition of learning. Psychon. Bull. Rev. 2013, 20, 631–642. [Google Scholar] [CrossRef]
  52. Metz, D.H. Mobility of older people and their quality of life. Transp. Policy 2000, 7, 149–152. [Google Scholar] [CrossRef]
  53. Jordan, M. The power of connection: Self-care strategies of social wellbeing. J. Interprof. Educ. Pract. 2023, 31, 100586. [Google Scholar] [CrossRef]
  54. Savari, K.; Naseri, M.; Savari, Y. Evaluating the Role of Perceived Stress, Social Support, and Resilience in Predicting the Quality of Life among the Parents of Disabled Children. Int. J. Disabil. Dev. Educ. 2023, 70, 644–658. [Google Scholar] [CrossRef]
  55. Dainton, M.; Conville, R.L.; Rogers, L.E. The Meaning of “Relationship” in Interpersonal Communication. J. Marriage Fam. 1999, 61, 546. [Google Scholar] [CrossRef]
  56. Bogolyubov, N.N. A Method for Studying Model Hamiltonians: A Minimax Principle for Problems in Statistical Physics; Elsevier: Amsterdam, The Netherlands, 2013. [Google Scholar]
  57. Chabane, L.; Lazarescu, A.; Verley, G. Effective Hamiltonians and Lagrangians for Conditioned Markov Processes at Large Volume. J. Stat. Phys. 2022, 187, 6. [Google Scholar] [CrossRef]
  58. Cervera-Lierta, A.; Kottmann, J.S.; Aspuru-Guzik, A. Meta-Variational Quantum Eigensolver: Learning Energy Profiles of Parameterized Hamiltonians for Quantum Simulation. PRX Quantum 2021, 2, 020329. [Google Scholar] [CrossRef]
  59. Wilde, F.; Kshetrimayum, A.; Roth, I.; Hangleiter, D.; Sweke, R.; Eisert, J. Scalably learning quantum many-body Hamiltonians from dynamical data. arXiv 2022, arXiv:2209.14328. [Google Scholar] [CrossRef]
  60. Altman, E.; Brown, K.R.; Carleo, G.; Carr, L.D.; Demler, E.; Chin, C.; DeMarco, B.; Economou, S.E.; Eriksson, M.A. Quantum Simulators: Architectures and Opportunities. PRX Quantum 2021, 2, 017003. [Google Scholar] [CrossRef]
  61. O’Neill, M.; Jones, R.S. Sensory-perceptual abnormalities in autism: A case for more research? J. Autism Dev. Disord. 1997, 27, 283–293. [Google Scholar] [CrossRef]
  62. Kinnaird, E.; Stewart, C.; Tchanturia, K. Investigating alexithymia in autism: A systematic review and meta-analysis. Eur. Psychiatry J. Assoc. Eur. Psychiatr. 2019, 55, 80–89. [Google Scholar] [CrossRef]
  63. Alberdi-Fernández, A. Habilidades Comunicativas en Trastornos del Espectro Autista. Bachelor’s Thesis, Universidad Internacional de la Rioja, Logroño, Spain, 2015. Available online: https://reunir.unir.net/handle/123456789/3219 (accessed on 16 December 2024).
  64. Guerrero, L.C.; Padilla, E.M. Habilidades sociales y comunicativas a través del arte en jóvenes con trastorno del espectro autista (TEA). Estud. Pedagógicos Valdivia 2017, 43, 47–64. [Google Scholar] [CrossRef]
  65. Coryell, W. Trastornos Depresivos-Trastornos Psiquiátricos. Manual MSD Versión Para Profesionales. Available online: https://www.msdmanuals.com/es/professional/trastornos-psiquiátricos/trastornos-del-estado-de-ánimo/trastornos-depresivos (accessed on 16 December 2024).
  66. González-Blanch, C.; Umaran-Alfageme, O.; Cordero-Andrés, P.; Muñoz-Navarro, R.; Ruiz-Rodríguez, P.; Medrano, L.A.; Ruiz-Torres, M.; Collado, E.D.; Cano-Vindel, A. Grupo de Investigación PsicAP. Tratamiento psicológico de los trastornos emocionales en Atención Primaria: El manual de tratamiento transdiagnóstico del estudio PsicAP. Ansiedad Estrés 2018, 24, 1–11. [Google Scholar] [CrossRef]
  67. Hernandez, J.; Riobo, I.; Rozga, A.; Abowd, G.D.; Picard, R.W. Using electrodermal activity to recognize ease of engagement in children during social interactions. MIT Web Domain. 2014. Available online: https://dspace.mit.edu/handle/1721.1/107809 (accessed on 16 December 2024).
  68. Fong, T.; Nourbakhsh, I.; Dautenhahn, K. A survey of socially interactive robots. Robot. Auton. Syst. 2023, 42, 143–166. [Google Scholar] [CrossRef]
  69. Shigemi, S. ASIMO and Humanoid Robot Research at Honda. In Humanoid Robotics: A Reference; Goswami, A., Vadakkepat, P., Eds.; Springer: Dordrecht, The Netherlands, 2019; pp. 55–90. [Google Scholar] [CrossRef]
  70. O’Reilly, Z.; Navare, U.P.; Marchesi, S.; Wykowska, A. Does Embodiment and Interaction Affect the Adoption of the Intentional Stance Towards a Humanoid Robot? In Social Robotics: 14th International Conference, ICSR 2022, Florence, Italy, December 13–16, 2022, Proceedings, Part I; Springer: Berlin/Heidelberg, Germany, 2023; pp. 357–366. [Google Scholar] [CrossRef]
Figure 1. Quantum circuit representation with superposition (four Hadamard gates) and entanglement (three CNOT gates), and measurement at the end.
Technologies 13 00165 g001
Figure 2. Quantum state measurement histogram for 16 states (X) and counts (Y).
Technologies 13 00165 g002
Table 1. Diagnosed conditions and associated comorbidities in the case of Autism Spectrum Disorder (ASD), Chronic Anxiety (CA) and Chronic Depression (CD) (n = 11,650).
People Diagnosed with…Med.
Age ± SD
TotalFreq. Total (%)Total ASDFreq. ASD (%)
Autism Spectrum Disorder (ASD)36.34 ± 2.712412.07
Chronic Anxiety (CA)63.06 ± 0.37207017.77610.52
Chronic Depression (CD)43.56 ± 6.16217918.70290.25
Table 2. Index, description of variables and number of variables that make up the index.
DomainsDescription of VariablesNumber of Variables that Make up the Index
CommunicationSome variables are related to the definition of communication [43], including the following: Difficulties in speaking in an understandable way or saying meaningful sentences; speaking comprehensively or saying meaningful sentences when using the assistive device; understanding the meaning of what others say to you; understanding the meaning of what others say to you when you receive help11
LearningSome variables are related with the definition of learning [44]. Included are those variables that determine the level of difficulty in paying attention with the gaze or maintaining attention with the ear; learning how to do simple things; learning to do simple things when you receive personal help or assistance; carrying out simple tasks7
MobilitySome variables are related with the definition of mobility [45]. Difficulty is measured in variables such as changing posture; changing posture when receiving personal help or assistance; keeping the body in the same position; keeping the body in the same position when receiving personal help or assistance; walking or moving around your home; walking or moving around your home when you receive personal help or assistance.16
Self-careSome variables are related with the definition of self-care [46]. These include variables that measure the level of difficulty when washing and drying different parts of the body; washing and drying different parts of the body when receiving personal help or assistance; performing basic body care; performing basic care of the body when receiving personal help or assistance14
Domestic life or social supportSome variables are related with the definition of cosmetic life or social support [47]. These include variables that measure difficulties in managing the household budget, planning expenses, or organizing purchases; managing the household budget, planning expenses, or organizing shopping when you receive personal help or assistance; preparing meals; preparing meals when you receive personal help or assistance; taking care of other household chores6
Interpersonal relationshipsSome variables are related with the definition of interpersonal relationships [48]. These inlcude those that measure aspects related to the display of affection; respect or feelings, relationships with strangers, creating and maintaining relationships with friends and neighbors, acquaintances, and colleagues; starting a family or maintaining family relationships; creating and maintaining romantic or sexual relationships.5
Table 3. Statistical analysis for parametric (Barltlett’s test, Shapiro–Wilk, skewness–kurtosis and ANOVA) and non-parametric tests (Spearman (rho) and Kruskal–Wallis (Chi-squared with ties).
Shaphiro–Wilk and Skewness–Kurtosis tests
DomainDifficulty Level for…Mean±S.D.Bartlett’s Test Chi2(2) *Pr (Skewness) *Pr (Kurtosis) *Adj Chi2(2) *ANOVA (F) *Spearman (rho) *Kruskal–Wallis (Chi Squared with Ties)
COMMUNICATION…speak in an understandable way or say sentences that make sense1.959184±0.07093850.6257 *0.8103 *0.00099.603.63 *0.62426.806
…speak in an understandable way or say meaningful sentences when using the assistive device2.606061±0.14393942.4316 *0.6348 *0.7915 *0.30 *0.58−0.09042.568
…understand the meaning of what others say1.815534±0.06580570.7495 *0.32530.01896.131.690.00004.080
…understand the meaning of what others say to you when you receive help2.481481±0.08977180.9155 *0.42460.4305 *1.29 *2.06−0.12867.303
…understand and express themselves through written language2.245.614±0.06774634.1487 *0.07040.000016.312.490.39529953 *
…understand and express themselves through gestures, symbols, drawings or sounds1.922078±0.08424452.9057 *0.6355 *0.000014.276.69 *−0.20209755 *
…hold a dialogue and exchange ideas with one or more people2.117117±0.06493082.5252 *0.49600.00358.072.470.39845.238
…use the telephone (landline or mobile) or other communication devices or techniques2.2±0.07583480.8640 *0.11820.000035.461.500.35827.824
…use the telephone or other communication devices or techniques when receiving help2.612903±0.11113291.22190.7389 *0.1064 *2.84 *1.010.39847.783
…use remote written communication systems2.42268±0.07154870.9242 *0.00190.1429 *3.29 *2.680.41663.741
…use remote written communication systems when receiving help2.653846±0.13137122.73160.43640.1133 *1.68 *2.090.14445.878
LEARNING…pay attention with your eyes or keep your attention with your ears1.791667±0.06268254.57210.52650.2657 *22.655.01 *−0.130610.570 *
…learn to do simple things2.044944±0.07975660.45670.7632 *0.00000.27 *5.18 *−0.08339.213
…learn to do simple things when receiving personal help or assistance2.5±0.09043262.54180.7078 *0.7153 *13.851.17−0.03889.250
…carry out simple tasks2.017241±0.09988313.59820.9225 *0.00005.64 *5.01 *−0.28999.271
…carry out simple tasks when receiving personal help or assistance2.5±0.1406980.51320.6868 *0.01636.910.470.05963.678
…carry out complex tasks2.293103±0.06928341.61180.01940.00004.26 *4.94 *−0.214512.600 *
…carry out complex tasks when receiving personal help or assistance2.621053±0.10059063.96350.7766 *0.00009.602.23−0.23327.793
MOBILITY…change position2.038462±0.1412120.65330.8930 *0.1679 *8.060.80.4.832
…change posture when receiving personal help or assistance2.590909±0.22466030.68550.7807 *0.1128 *31.220.87.1.755
…keep the body in the same position2.034483±0.12636213.25500.9187 *0.3872 *.1.78.6.666
…keep the body in the same position when receiving help or personal assistance2.565217±0.18677722.49950.6384 *0.6510 *2.80 *0.60.5.328
…walk or move around your home2.130435±0.15785551.82630.6167 *0.0826 *3.20 *0.20.4.201
…walk or move around in your home when you receive help or personal assistance2.6±0.2102631.69600.5093 *0.6103 *4.62 *0.43.3.899
…walk or move outside your home2.541667±0.08911670.01370.00600.7536 *6.581.96.3.318
…walk or move outside your home when you receive help or personal assistance2.414634±0.15607851.21330.6326 *0.048218.791.99.1.915
…move using means of transport as a passenger2.538462±0.10075710.42170.00080.6935 *18.400.36.1.254
…move using means of transport as a passenger when receiving personal help or assistance2.511628±0.16088117.44770.51800.002910.431.22.0.832
…driving vehicles without adaptations2.862069±0.0957745.0.00000.000010.000.00.1.685
…driving vehicles when receiving personal help or assistance3.666667±0.3333333...27.99...
…manipulate and move objects, using hands and arms2.054054±0.1158981.13320.8358 *0.1097 *7.940.85.5.230
…manipulate and move objects, using hands and arms when receiving personal help or assistance2.862069±0.17703189.67700.5613 *0.1084 *59.600.60.2.312
…manipulate small objects with hands and fingers2.212121±0.128787914.46060.34990.0544 *11.562.76.11.236 *
…manipulate small objects with hands and fingers when receiving personal help or assistance2.884615±0.186687113.54680.8958 *0.007173.471.73 4.566
SELF-CARE…wash and dry the different parts of the body2.239437±0.09293951.15480.10910.00004.83 *0.17−0.04251.778
…wash and dry the different parts of the body when receiving help or personal assistance2.666667±0.13003161.17430.5711 *0.000011.970.48−0.00652.645
…perform basic body care2.544118±0.07960010.61050.00050.6149 *44.753.33 *0.24872.931
…perform basic body care when receiving personal help or assistance2.878788±0.13047370.27090.10820.00237.184.04 *0.17442.008
…go to the toilet and relieve yourself or take care of your intimate hygiene2.157895±0.10850280.02590.32160.000012.453.03−0.11465.903
…go to the toilet and relieve yourself or take care of your intimate hygiene when you receive help or personal assistance2.849057±0.14100054.43210.2696 *0.005125.491.37−0.23877.649
…dress or undress2.103448±0.11187682.40610.5013 *0.000021.370.860.04272.838
…dressing or undressing when receiving personal help or assistance2.535714±0.1417981.54840.9943 *0.000219.090.87−0.14614.665
…eat and drink1.977778±0.13291180.28320.8941 *0.00008.262.80−0.23435.132
…eat and drink when receiving personal help or assistance2.302326±0.15797331.31720.2263 *0.0653 *10.972.25−0.21004.365
…comply with medical prescriptions0.1579733±0.08593980.70470.00010.9239 *6.651.050.25604.795
…fulfill medical prescriptions when receiving personal help or assistance2.726027±0.13829292.06510.3132 *0.00009.220.990.03746.149
…avoid dangerous situations2.41791±0.08546375.52220.00990.2554 *7.181.03−0.05267.126
…avoid dangerous situations when receiving personal help or assistance2.967213±0.14403861.52630.05710.000612.450.36−0.08232.638
DOMESTIC LIFE…manage the household budget, plan expenses or organize purchases2.681319±0.06227113.93410.00000.010825.492.20−0.14647.544
…manage the household budget, plan expenses or organize purchases when you receive personal help or assistance3.567164±0.09797561.64650.00000.012821.370.42−0.03308.239
…prepare meals2.630435±0.06319534.85750.00000.0853 *19.092.83−0.22797.243
…prepare meals when receiving personal help or assistance3.131579±0.11446615.55360.00810.1230 *8.261.83−0.01867.257
…take care of other chores around the house2.494382±0.07344514.34560.00030.7782 *10.971.44−0.09974.225
…take care of other chores around the house when you receive personal help or assistance3.04±0.11140388.70140.0249 *0.1397 *6.652.16−0.12243.370
INDIVIDUAL RELATIONSHIPS…show affection, respect or feelings1.891304±0.07324392.25370.5269 *0.00149.221.87−0.19258.445
…associating with unknown people2.131148±0.0592950.99250.5114 *0.03554.87 *3.77 *−0.19277.782
…create and maintain relationships with friends, neighbors, acquaintances, subordinates, superiors or colleagues2±0.06367780.92311.0000.000022.702.22−0.16336.626
…form a family or maintain family relationships2.5±0.08328162.66870.00090.9094 *9.461.91−0.03926.463
…create and maintain sentimental, partner or sexual relationships2.546667±0.07423690.36460.00040.6230 *10.870.32−0.05742.151
Do you believe that the use of new technologies has improved aspects of your daily life?2.647059±0.07430890.00020.6863 *12.27
Note: For Bartlett’s test (chi2(2)), if * p > 0.05, the data refused the assumption of equal variances. In the Shapiro–Wilk test and skewness–kurtosis tests, if Pr (skewness) and Pr (kurtosis) are greater than 0.05 and/or Adj. chi2(2) probability, that is * p > 0.05, it suggests that the data may plausibly follow a normal distribution. For ANOVA, * p < 0.05. For Spearman test, * p < 0.05 suggests the correlation is statistically significant. For the Kruskal–Wallis test, if * p < 0.05, there is enough evidence to claim that there are significant differences between the medians of the compared categories.
Table 4. Pearson Correlation results for ASD, ASD with CA, ASD with CD and the dependent variable ‘Do you believe that the use of new technologies has improved aspects of your daily life?’.
DomainDifficulty Level for…ASD (n = 241)ASD with CA (n = 61)ASD with CD (n = 29)
COMMUNICATION…speak in an understandable way or say sentences that make sense−0.2053 *−0.4067−0.4143
…speak in an understandable way or say meaningful sentences when using the assistive device−0.13180.7559.
…understand the meaning of what others say−0.1804−0.4446 *−0.7354 *
…understand the meaning of what others say to you when you receive help−0.2365 *−0.1869−0.4437
…understand and express themselves through written language−0.1887 *−0.2460−0.2768
…understand and express themselves through gestures, symbols, drawings or sounds−0.3095 *−0.5649 *−0.4299
…hold a dialogue and exchange ideas with one or more people−0.0496−0.3928−0.5486
…use the telephone (landline or mobile) or other communication devices or techniques−0.1081−0.2764−0.5993
…use the telephone or other communication devices or techniques when receiving help−0.2147−0.0000−0.5000
…use remote written communication systems−0.0472−0.0475−0.6198
…use remote written communication systems when receiving help−0.24890.2000−0.4677
LEARNING…pay attention with your eyes or keep your attention with your ears−0.3116 *−0.1667−0.6142
…learn to do simple things−0.2994 *−0.5765 *−0.7385
…learn to do simple things when receiving personal help or assistance−0.2106−0.0578.
…carry out simple tasks−0.3779 *−0.3850.
…carry out simple tasks when receiving personal help or assistance−0.12010.3665.
…carry out complex tasks−0.2828 *−0.2718−0.3543
…carry out complex tasks when receiving personal help or assistance−0.2351 *0.14140.0184
MOBILITY…change position−0.2028−0.1887−0.2342
…change posture when receiving personal help or assistance−0.2284−0.0463−0.1766
…keep the body in the same position−0.3374−0.3915−0.3263
…keep the body in the same position when receiving help or personal assistance−0.20330.19420.0913
…walk or move around your home−0.06370.1295−0.0425
…walk or move around in your home when you receive help or personal assistance−0.2490−0.2340−0.4678
…walk or move outside your home−0.1833−0.1970−0.4468
…walk or move outside your home when you receive help or personal assistance−0.1430−0.2428−0.0778
…move using means of transport as a passenger−0.09880.35020.7660 *
…move using means of transport as a passenger when receiving personal help or assistance−0.09960.28100.6847
…driving vehicles without adaptations0.0091..
…driving vehicles when receiving personal help or assistance...
…manipulate and move objects, using hands and arms−0.06130.04000.3208
…manipulate and move objects, using hands and arms when receiving personal help or assistance−0.2310−0.2037−0.4082
…manipulate small objects with hands and fingers−0.3429−0.6375 *−0.1715
…manipulate small objects with hands and fingers when receiving personal help or assistance−0.3015−0.3338−0.1741
SELF-CARE…wash and dry the different parts of the body−0.05060.09700.0000
…wash and dry the different parts of the body when receiving help or personal assistance−0.0418−0.02510.0000
…perform basic body care0.08740.0424−0.1291
…perform basic body care when receiving personal help or assistance−0.0639−0.0807−0.1768
…go to the toilet and relieve yourself or take care of your intimate hygiene−0.2954 *−0.1874−0.6625
…go to the toilet and relieve yourself or take care of your intimate hygiene when you receive help or personal assistance−0.2593−0.1423−0.3151
…dress or undress−0.17400.17550.0000
…dressing or undressing when receiving personal help or assistance−0.16210.09870.1291
…eat and drink−0.3267 *−0.4105−0.5571
…eat and drink when receiving personal help or assistance−0.2102−0.7172 *−0.9191 *
…comply with medical prescriptions−0.0128−0.2002−0.5130
…fulfill medical prescriptions when receiving personal help or assistance−0.1544−0.1881−0.6198
…avoid dangerous situations−0.1513−0.1015−0.6355
…avoid dangerous situations when receiving personal help or assistance−0.1316−0.0248−0.3151
DOMESTIC LIFE…manage the household budget, plan expenses or organize purchases−0.1831−0.2202−0.4348
…manage the household budget, plan expenses or organize purchases when you receive personal help or assistance0.08860.0696−0.2140
…prepare meals−0.2307 *−0.4367 *−0.5433
…prepare meals when receiving personal help or assistance−0.0543−0.0896−0.2895
…take care of other chores around the house−0.1795−0.3359−0.5333
…take care of other chores around the house when you receive personal help or assistance−0.1544−0.0791−0.3481
INDIVIDUAL RELATIONSHIPS…show affection, respect or feelings−0.09180.0262−0.1959
…associating with unknown people−0.1795 *−0.01670.0669
…create and maintain relationships with friends, neighbors, acquaintances, subordinates, superiors or colleagues−0.1587−0.15180.0176
…form a family or maintain family relationships−0.10940.21600.1066
…create and maintain sentimental, partner or sexual relationships−0.06750.12590.0449
* p < 0.05.
Table 5. Average inter-item correlation and Cronbach’s α for ASD, ASD and CA and ASD and CD.
ALL VARIABLES (n = 241)SELECTED VARIABLES ASD + CA (n = 61)SELECTED VARIABLES ASD + CD (n = 29)
Domain Average Interitem CorrelationCronbach’s α Average Interitem CorrelationCronbach’s α UniquenessKMOAverage Interitem CorrelationCronbach’s α
Difficulty Level for…
COMMUNICATION…speak in an understandable way or say sentences that make sense0.31140.8326−0.02850.1051 −0.1626
…speak in an understandable way or say meaningful sentences when using the assistive device0.32580.8417
…understand the meaning of what others say0.32880.8435
…understand the meaning of what others say to you when you receive help0.31240.8333−0.0104 −0.1587
…understand and express themselves through written language0.30280.8269−0.2226 *0.53390.0827 *0.47730.08880.2804
…understand and express themselves through gestures, symbols, drawings or sounds0.32130.8389−0.0003 −0.03800.1910
…hold a dialogue and exchange ideas with one or more people0.29050.8183
…use the telephone (landline or mobile) or other communication devices or techniques0.29970.8248
…use the telephone or other communication devices or techniques when receiving help0.30980.8316
…use remote written communication systems0.31980.8380
…use remote written communication systems when receiving help0.31530.8351
Do you believe that the use of new technologies has improved aspects of your daily life?0.45970.9035−0.0590 0.05570.1910
0.32430.85210.03280.1451 −0.0505
LEARNING…pay attention with your eyes or keep your attention with your ears0.40790.82830.3401 **0.72040.58820.36790.4839 **0.7895
…learn to do simple things0.38830.81630.22500.5921 0.30570.6378
…learn to do simple things when receiving personal help or assistance0.41070.82990.3294 **0.71070.2864 *0.3047
…carry out simple tasks0.38250.8126
…carry out simple tasks when receiving personal help or assistance0.40870.8287
…carry out complex tasks0.39610.82110.2498 *0.6247 0.3161 **0.6496
…carry out complex tasks when receiving personal help or assistance0.40640.82730.3585 **0.73640.1763 *0.6243 *0.5467 **0.8283
Do you believe that the use of new technologies has improved aspects of your daily life?0.47190.86220.41380.7792 0.46300.7752
0.40830.84660.31730.7361 0.41730.7817
SELF-CARE…wash and dry the different parts of the body0.41270.9077
…wash and dry the different parts of the body when receiving help or personal assistance0.40110.9036
…perform basic body care0.42260.9111
…perform basic body care when receiving personal help or assistance0.39750.9023
…go to the toilet and relieve yourself or take care of your intimate hygiene0.40210.90400.4105 **0.5921 0.5571 **0.7155
…go to the toilet and relieve yourself or take care of your intimate hygiene when you receive help or personal assistance0.39600.9018
…dress or undress0.40310.9044
…dressing or undressing when receiving personal help or assistance0.39220.9003
…eat and drink0.41010.90680.1874 *0.3157 0.6625 **0.7970
…eat and drink when receiving personal help or assistance0.40550.9052
…comply with medical prescriptions0.42290.9112
…fulfill medical prescriptions when receiving personal help or assistance0.40360.9045
…avoid dangerous situations0.40430.9048
…avoid dangerous situations when receiving personal help or assistance0.40330.9044
Do you believe that the use of new technologies has improved aspects of your daily life?0.46050.92280.59260.7442 0.44720.6180
0.40900.91210.36190.6299 0.56630.7596
DOMESTIC LIFE…manage the household budget, plan expenses or organize purchases0.45120.8315
…manage the household budget, plan expenses or organize purchases when you receive personal help or assistance0.47600.8450
…prepare meals0.44880.83010.4367 **0.6079 0.5433 **0.7040
…prepare meals when receiving personal help or assistance0.44530.8281
…take care of other chores around the house0.41690.8110
…take care of other chores around the house when you receive personal help or assistance0.42950.8187
Do you believe that the use of new technologies has improved aspects of your daily life?0.62580.9094
0.46970.8611
INDIVIDUAL RELATIONSHIPS…show affection, respect or feelings0.32520.7067
…associating with unknown people0.32260.70430.01670.0328 0.06990.1254
…create and maintain relationships with friends, neighbors, acquaintances, subordinates, superiors or colleagues0.31300.6950
…form a family or maintain family relationships0.32320.7048
…create and maintain sentimental, partner or sexual relationships0.31990.7016
Do you believe that the use of new technologies has improved aspects of your daily life?0.51110.8394
0.34820.7622
Note: * Cronbach’s alpha > 0.7. * Average iteritem correlation with moderate interrelatedness: 0.15 to 0.3. ** Strong 0.3–0.5. Uniqueness * with values <0.5 indicates the variable is well represented by the factors. KMO * for values >0.6 indicates the sample is adequate for the analysis. I_170.20720.5593
Overall KMO0.4838
Disclaimer/Publisher’s Note: The statements, opinions and data contained in all publications are solely those of the individual author(s) and contributor(s) and not of MDPI and/or the editor(s). MDPI and/or the editor(s) disclaim responsibility for any injury to people or property resulting from any ideas, methods, instructions or products referred to in the content.

