Abstract
This study employs the panel vector autoregressive (PVAR) model to examine the spillover effect of US unconventional monetary policy on inflation and non-inflation targeting emerging markets post credit crunch and during COVID-19 from 2000Q1 to 2020Q4. Unlike other analyses, this paper adds to the existing body of knowledge by employing a dummy variable to represent the United States’ quantitative easing. Other included control variables are equity prices, the federal reserve rate, the exchange rate, central bank assets and the short-term interest rate. This paper estimated two-panel VARs, Model one and Model two, for inflation and non-inflation targeting emerging markets, respectively. Model one consists of eight inflation-targeting markets, and Model two consists of four non-inflation-targeting countries. Other included control variables are equity prices, the federal reserve rate, the nominal effective exchange rate, and the central bank policy rate. According to the empirical results, the US unconventional monetary policy induces a surge in the exchange rate and a decrease in the central bank policy rate for both inflation and non-inflation targeting emerging markets. However, there was no significant impact on the equity prices. The empirical results are statistically significant, robust, and consistent with previous studies except for the response of equity prices. Unconventional monetary policy is effective in steering macroeconomic variables in developed economies. The monetary policymakers in emerging markets must also use the currency reserve to stabilise the macroeconomic variables in response to US unconventional monetary policy shocks.
1. Introduction
The credit crisis of 2007–2009 and the COVID-19 pandemic induced the Federal Reserve Bank of the United States to pursue unconventional monetary policy, as the policy rate was at the zero lower bounds, in order to encourage economic development and maintain financial stability. As policy rates in the United States of America (US), Figure 1, approached and eventually became locked at their effective lower bounds, central bank balance sheets essentially took over as the primary policy instrument (Fadejeva et al. 2017). As a result, conventional monetary policy was unsuitable for steering macroeconomic variables and assessing the post-crisis spillover effect of the United States of America’s (US) unconventional monetary policy on inflation and non-inflation-targeting countries (Papadamou et al. 2019). This study compares the US spillover effects of the unconventional monetary policy during COVID-19 and after the credit crunch on inflation and non-inflation targeting emerging countries.
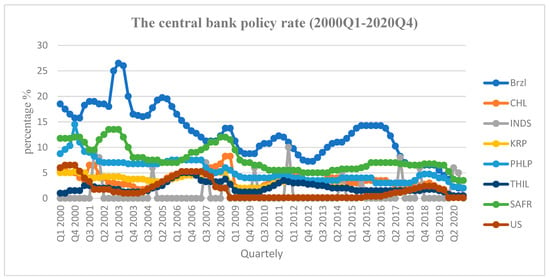
Figure 1.
The central bank policy rate (source: International Financial Statistics). BRZL = Brazil; CHL = Chile; INDS = Indonesia; KRB = South Korea; PHLP = Philippines; THIL = Thailand; SAFR = South Africa; US = United States of America.
In a similar vein, the unconventional monetary policies pursued by the central banks of the advanced economies to reduce financial instability can have significant spillover effects in the rest of the world. In response to the financial turmoil and collapsing demand during the global crisis, the US Federal Reserve embarked upon a massive purchase of US government and corporate bonds in a desperate bid to stabilize the financial system and support economic growth. Quantitative easing (QE) is the process through which money is printed to purchase bonds from the public (Matousek et al. 2019). This policy, known as QE, occurred at various intervals between 2008 and 2014, contributing to an expansion of global liquidity, some of which flowed into emerging markets. Several studies have examined the US spillover effects of unconventional monetary policy (Hadood and Gokmenoglu 2023; Rebucci et al. 2022; Fratto et al. 2021).
The recent COVID-19 outbreak had a detrimental effect on the economy of emerging and advanced economies in March 2020. A marked increase in global investors’ risk aversion combined with lower commodity prices translated into a rise in local currency bond yields, capital outflows, and sharp currency depreciations. The Federal Reserve responded to the COVID-19 crisis with a combination of conventional and unconventional measures. The Federal Reserve introduced unconventional monetary policy (UMP) measures at the end of the post credit crunch in 2014Q4 in the form of large asset purchase programs (LAPPs).
So far, the gathered evidence has primarily focused on the post credit crises of 2007–2009 and the impact of unconventional monetary policy measures, utilizing high-frequency data (Lubys and Panda 2021; Peersman 2011; Giannone et al. 2011). Recent studies that investigated the US unconventional spillover effects of the COVID-19 pandemic have employed high-frequency data in an event study (Arslan et al. 2020; Fratto et al. 2021). Moreover, there are few studies that conducted unconventional monetary spillover effects during COVID-19 and the post credit crises (Ijiri and Jinushi 2022; Inoue and Okimoto 2022; Fratto et al. 2021).
This study contributes to the body of knowledge by investigating both the post credit crunch crises and the COVID-19 US spillover effects of large asset purchase programs on the selected emerging markets. However, no research has been conducted to evaluate and compare the consequences of US unconventional monetary policy spillover on non-inflation-targeting nations and inflation-targeting emerging countries post-financial crises and during COVID-19. This is the only study that uses a dummy variable in a panel vector autoregressive model as a proxy variable for the unconventional monetary policy post credit crunch and during COVID-19. The following section will discuss the theoretical literature, followed by the empirical literature, the methodology, the results and, lastly, the conclusion and policy recommendations.
2. Theoretical Framework
The transmission channels of the unconventional monetary policy are derived from the Mundell-Fleming (MF) model propounded by Mundell (1963) and Fleming (1962), and Tran and Pham (2020). According to the MF model, an expansionary monetary policy weakens the domestic currency and worsens its terms of trade, lowering the price of domestic goods (Frenkel and Razin 1987). The competitive advantage of lower domestic prices results in an appreciation of exports and a decline in the output of foreign nations.
The transmission channels of unconventional monetary policy derived from the MF model are portfolio rebalancing, policy signaling, money, market liquidity and confidence, as depicted in Figure 2. However, for the purposes of this study, the three key unconventional monetary policy channels are signaling, portfolio rebalancing, and liquidity channels, as defined by Krishnamurthy and Vissing-Jorgensen (2011), and Neely (2015).
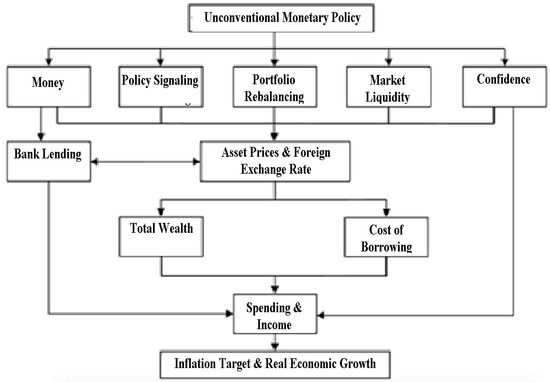
Figure 2.
Transmission channels of unconventional monetary policy. Source: Krishnamurthy and Vissing-Jorgensen (2011).
In terms of the signaling channel, non-conventional expansionary monetary policy pronouncements attempt to communicate that the future path of short-term interest rates will continue to decline. The Federal Reserve intends to maintain an expansionary monetary policy for a longer period of time than previously anticipated by introducing LSAPs. The signaling effect refers to central banks’ expectations of future economic conditions. For example, an expectation of worsening conditions will increase investor demand for T-bills, and such a signal will immediately lower the average predicted short-term return, which is an important component of a bond yield over longer time periods.
In terms of the liquidity channel, when the policy rate is at the zero lower limit, the central bank’s intervention in the marketplace is anticipated to induce market efficiency and shrink the needed liquidity premium (Joyce et al. 2011). Furthermore, rising liquidity flows as a result of the United States’ unorthodox monetary policy would support rising equity and property prices in emerging markets. The QE program is intended to drive additional investment in riskier assets through this channel. As a result, through increasing wealth and expenditure, the expansionary policy will greatly contribute to increased consumption, production, and employment.
The portfolio balance channel is critical for investors to understand the ‘preferred habitat theory’, which has greatly influenced the yields of acquired securities and their substitutes. In general, investors would put their money into long-term safe investments (Krishnamurthy and Vissing-Jorgensen 2011). However, once the Federal Reserve purchases securities, the portfolio rebalancing channel has an effect, reducing the amount of assets held by the private sector. As a result, investors are more likely to invest in international securities that closely resemble the US assets being purchased (Hausman and Wongswan 2011). As a further result, the purchase program induces a surge of asset prices purchased through the unconventional monetary policy and their substitutes, cutting yields until the new steady state is reached.
These transmission channels suggest that UMP shocks will cause interest rates to fall and stock prices to rise. Moreover, commodity prices tend to fall in response to LSAP announcements. Nevertheless, according to Glick and Leduc (2012), LSAPs may enhance security yields and commodity prices in the future due to lower risk assumptions since the theoretical points of view and empirical evidence have not delivered clear-cut arguments on whether an unconventional monetary policy exerts positive or negative effects on emerging countries. Indeed, the conclusion is determined by the relative strength of each channel, which awaits more empirical studies.
3. Literature Review
The unconventional monetary policy operates through the balance sheet channel. During the zero lower bound interest rate, advanced economies induced macroeconomic variables through changes in the central bank assets, which was achieved by large asset purchases. The large asset purchases triggered a surge in aggregate demand by lowering the borrowing rate (Fratzscher et al. 2018). The balance sheet channel assumes that the interest rate charged to a borrower is determined by the borrower’s financial position. A borrower with fewer liquid assets and less profitable security to safeguard the loan is charged more. Changes in the borrower’s financial position influence the status of the debtor’s balance sheet. Hence, changes in the financial position of debtors are translated into their investment and spending decisions.
Before the COVID-19 pandemic, there were many studies that were conducted to examine the spillover effects of the US unconventional monetary policy on emerging economies (Sugimoto and Matsuki 2019; Kenourgios and Ntaikou 2021; Kolasa and Wesołowski 2020). There are a number of research papers assessing the impact of a large assets purchasing program on the domestic macroeconomy and financial markets (Curdia and Woodford 2011; Ihrig et al. 2018; Papadamou et al. 2019; Lyonnet and Werner 2012; Swanson 2021).
There seems to be consensus in the empirical literature on the spillover effect of QE from developed economies to emerging markets, post the credit crunch of 2007–2009. According to Lavigne et al. (2014), QE spillover effects resulted in currency appreciation, increases in equity prices, an increase in output, a rise in capital inflows and a surge in temporary inflation. Investors were attracted by the high rate of returns in emerging markets. Ganelli and Tawk (2016) employed the GVAR model to systematically examine the spillovers from Japanese QE on emerging Asia. The study also found that implementing QE in Japan caused a hike in equity prices and an appreciation of the currency in emerging Asian markets. Moreover, there was an increase in capital inflows, economic activity and a temporal increase in inflation.
The spillover effects of the US, Europe and Japan’s QE have the same effect on emerging markets (Papadamou et al. 2019). QE in the US and Europe resulted in the depreciation of the domestic currency and an outflow of capital. Hence, QE was a gain to emerging markets as their capital inflows increased, their currency appreciated, output rose, and their equity prices increased. Chen et al. (2016) in the US employed the GVAR model to examine the impact of QE shocks on emerging markets and obtain similar results. According to Chen et al. (2016), US QE shocks to emerging markets increased capital inflows and currency appreciation in emerging markets. In another study on US and Europe, QE spillover resulted in the depreciation of both the US and British currencies, as well as a decrease in long-term interest rates (Glick and Leduc 2012).
Bhattarai et al. (2021) employed the Bayesian panel VAR to investigate the effects of US quantitative easing on emerging market economies. The study found that an expansionary US QE shock has significant effects on financial variables in EMEs (Chile, Colombia, Brazil, India, Indonesia, Malaysia, Mexico, Peru, South Africa, the Republic of Korea, Taipei, China, Thailand, and Turkey). It leads to an exchange rate appreciation, a reduction in long-term bond yields, a stock market boom, and an increase in capital inflows to these countries. These effects on financial variables are stronger for the “Fragile Five” (Brazil, India, Indonesia, Turkey, and South Africa) countries compared to other EMEs. Tillmann (2016) employed the Qual VAR to investigate the impact of QE in the US on emerging economies. He also found the spillover effects of QE to have a significant effect on capital inflows, the exchange rate and equity prices in emerging markets.
Existing research on the drivers of financial spillovers, such as the studies of Aizenman et al. (2014), Chen et al. (2016), Rai and Suchanek (2014), Neely (2015), Estrada et al. (2016), and Fratzscher et al. (2018), have used the event study approach to examine the effect of the announcement of both QE and tapering. Bauer and Neely (2014) also used the event study approach and Gaussian dynamic term structure models to investigate the relative importance of signalling and portfolio balance channels for international effects originating from the large-scale asset purchases in 2008 and 2009 by the US Federal Reserve (Fed). However, only a few researchers, such as Chen et al. (2016) and Fratzscher et al. (2018), have explored the direct relationship between the magnitudes of financial spillovers and quantitative degrees of changes in QE and tapering.
Our study builds on the work of Rebucci by including a dummy variable that represents the unconventional period before COVID-19 and during COVID-19. Rebucci et al. (2022) employed an event study and a Global Vector Autoregressive (GVAR) model to examine the unconventional monetary spillover effects of advanced economies on daily yields and bilateral US dollar exchange rates during the financial crises triggered by the COVID-19 pandemic. This study found that QE has a significant effectiveness in advanced economies, that its international transmission is consistent with the operation of long-run uncovered interest rate parity and that there was a significant dollar shortage shock during the COVID-19 period. The impact of QE on bond yields is much stronger in emerging markets, and its transmission to exchange rates is qualitatively different from that in advanced economies. The GVAR evidence presented by the authors shows the Fed’s pivotal role in the global transmission of long-term interest rate shocks, as well as the ample scope for country-specific interventions to affect local financial market conditions, even after controlling for common factors and spillovers from other countries. The GVAR evidence also shows that QE interventions can have significant real effects on output, owing to a long-term impact on interest rates.
In another event study during COVID-19, Fratto et al. (2021) examined unconventional monetary policy in emerging and developing countries. The study employed recent data on unconventional monetary statements and their execution for 27 emerging markets and eight small, advanced economies from March to August 2020. Various approaches are used to estimate the balance sheet implications for bond yields, currency rates, equities, and debt spreads. The findings demonstrate that asset purchase programs (APPs) were successful in considerably lowering bond yields in emerging economies and that these impacts were stronger than policy rate cuts, implying that such UMPs could be useful instruments for emerging markets amid financial market stress.
4. Data and Methodology
This section discusses the estimation techniques constituting the panel VAR model. The first panel VAR model (Model one) is estimated for the spillover effects of US unconventional monetary policy on inflation targeting emerging economies; the second panel VAR model (Model two) is for non-targeting emerging markets over a period from 2000Q1 to 2020Q4.
4.1. Data
Model one and Model two consist of eight (Brazil, Chile, Indonesia, Philippines, South Korea, South Africa, Thailand, and Turkey) and four (Algeria, Morocco, Tunisia, and Malaysia) inflation-targeting and non-targeting emerging markets, respectively. This study would have preferred to investigate less developed countries and emerging economies; however, it was constrained by the availability of data. The control variables for both Model one and Model two are the central bank policy rate (SR), the federal reserve rate (FDR), the equity prices (BA), the nominal exchange rate (EXC) and the dummy variable for US unconventional monetary policy (UNCOV). The UNCOV is created by using one during the US unconventional monetary policy period 2008Q1–2014Q1 and 2020Q1–2020Q4 and zero during the conventional monetary policy period 2000Q1–2004Q4. Data is retrieved from the International Financial Statistics (IFS), compiled by the International Monetary Fund and Haver Analytics. All the variables are retrieved from the IFS except for the equity prices which are obtained from the Haver Analytics. The natural logs of the nominal exchange rate are taken in order to interpret coefficients as elasticity. STATA software is employed for the estimation of both models. The variables for Model one and Model two are I(1) and I(0), respectively. Hence, the panel VAR is appropriate as an estimation technique.
4.2. The Panel VAR Model
A panel VAR Model consists of endogenous and interdependent variables, both in a static and a dynamic manner, while in some relevant cases, exogenous variables could be included, adding a cross-sectional heterogeneity to the framework (Canova et al. 2013). Most studies that have been conducted in emerging and developed countries to investigate the spillover effect of the US unconventional monetary policy have used the VAR model (Obafemi and Ifere 2015; Ciccarelli et al. 2015). The VAR model treats all variables as endogenous and interdependent both in a static and dynamic manner (Ramey and Shapiro 1998). The panel VAR model is one of the latest models, which combines both the characteristics of panel data and the VAR model. The panel VAR model is suitable for ascertaining the US unconventional monetary policy shocks since it (i) captures both dynamic and static interdependencies, (ii) easily incorporates time variations in the coefficients and, in the variance of the shocks, (iii) treats the links across units in an unrestricted fashion, and (iv) accounts for cross-sectional dynamic heterogeneities (Canova et al. 2013).
A panel VAR model is regarded as superior to the VAR model since it does not waste degrees of freedom (Seleteng and Motelle 2016). Similar to the VAR model, a panel VAR also does not have a theoretical background. Following the work of Dajcman (2013), the control variables used in this analysis include the central bank policy rate (SR), equity prices (BA), the nominal exchange rate (EXC), the federal reserve rate (FDR) and the dummy for the US unconventional monetary policy (UNCOV). The PVAR model is specified as follows:
where represents a (5 × 1) vector of system variables (SR, BA, EXC, FDR, and UNCOV), is a (5 × 1) vector of constants, (1, 2, …, s) is a (5 × 5) matrix of coefficient estimates, and ε is a (5 × 1) vector of the white noise error term, while is a cross-sectional identifier and s is the maximum lag length of each variable selected in accordance with the Schwarz Bayesian Criterion (SBC) and the Akaike Information Criterion (ABC). The impulse response function is computed from the estimated panel VAR model to examine the response of macroeconomic variables to US unconventional monetary policy. The impulse response is the dynamic change in for a unit change in .
5. Estimation Results
This section begins by discussing the estimation results of the inflation targeting panel VAR model, followed by the results of the non-inflation targeting emerging markets panel VAR model since it is a comparative study. Lastly, the conclusion and policy recommendations are discussed. In the following two subsections, the impulse response functions (IRFs) of the non-inflation targeting (Model two) and the inflation targeting (Model one) model are presented.
5.1. Model one: Inflation Targeting EMEs Panel VAR Estimation Results
The panel VAR is estimated for inflation targeting emerging markets (Brazil, Chile, Indonesia, Philippines, South Korea, South Africa, Thailand, and Turkey) over a period of 2000Q1 to 2020Q4. Prior to the estimation, we have undertaken a preliminary analysis. Descriptive statistics were performed. The degree of correlation was tested among the variables, and it is below 50% among all variables.
5.1.1. Descriptive Statistics
The data in Table A1 consists of 256 observations from four non-inflation-targeting emerging markets of quarterly data spanning from 2008 to 2016. The estimation of the numerous summary statistics, like the median, mean, probability, skewness, Jarque-Bera and kurtosis tests, are presented in Table A1 in Appendix A. The mean for the central bank policy rate (SR) for the emerging markets, federal reserve policy rate, exchange rate and equity prices in Table A1 are 9.521, 2.068, 1493.654 and 4.948, respectively. The probability for all the variables is less than 10%, which indicates that the variables may not be normally distributed. Non-normality is a result of the structural break in the data. The main cause of the structural break in data was caused by the global recession of 2007–2008. Moreover, most of the emerging markets were hindered by credit rating agencies as most were downgraded to junk status due to corruption, poor policies and political uncertainty.
5.1.2. The Stationarity Tests
The study applies the first-generation Fisher-type Philips-Perron and the second-generation Im Pesaran and shin panel unit root tests. The null hypothesis of the present panel unit root is accepted at the level form for all variables. However, the first difference is that all the variables are stationary; hence, a panel VAR is estimated, as shown in Table 1.

Table 1.
Panel unit roots tests.
5.1.3. Lag Selection Criterion
After testing the data for stationarity, the lag selection criterion was determined by the Akaike Information Criterion. According to the Bayesian Information Criteria, the Akaike Information Criterion and the Hannan-Quinn Information Criterion (Andrews and Lu 2001), the selected minimum lag is one. All three lag length selection criteria (MBIC, MAIC, and MQIC) suggest that a first-order panel VAR is preferred. The MBIC, MIC, and MQIC minimize the lag order at −369.279, −58.787, and −181.008, respectively, as shown in Table 2.
Table 2.
Panel VAR lag order selection criteria.
5.1.4. The Stability Tests
The panel VAR model satisfied the stability condition as all moduli lie inside the unit root circle and the eigenvalue is less than one, as shown in Table A3 in Appendix A. Model one comprises of I(1) variables DSR, DFDR, DBA, DEXC, and UNCOV (which is a dummy variable for the period from 2000Q1 to 2020Q4). The lag order of one is utilized, as suggested by the lag selection criterion. The study continues to estimate a panel VAR model comprising of I(0) variables, and it passes the diagnostic tests. The coefficients and signs of the variables conform to theory and are statistically significant.
5.1.5. The Impulse Response Function
The study’s main objective is to employ the impulse response function to examine the response of the policy rate and other macroeconomic variables to the US unconventional monetary policy shocks. This section begins by discussing the response of the selected macroeconomic variables to a one standard deviation shock of the US unconventional monetary policy (UNCOV). According to Gambacorta et al. (2014) and Glick and Leduc (2013) a one standard deviation from the US unconventional monetary policy results in a decline of the policy rate for emerging markets. The first row of Figure 3 shows the response of other variables to the US unconventional monetary shocks. The impulse response function derived from the panel VAR is shown in Figure 3 below.
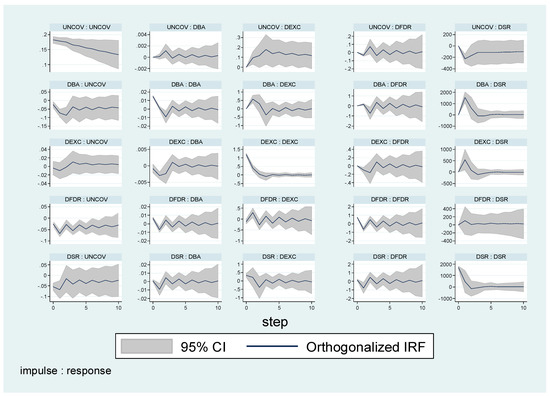
Figure 3.
The Impulse Response Function. Source: Estimated by researcher.
According to Figure 3, a positive shock to the US unconventional monetary policy results in a significant appreciation of the nominal exchange rate, according to theory and other empirical literature (Vermeulen 2019). This was caused by the surge in capital inflows from developed economies to emerging markets in search of higher yields. Investors were attracted by the high rate of returns in inflation targeting emerging markets, as the interest rates in developed markets were at zero lower bounds (Rogers et al. 2014). In the long run, the nominal exchange rate decreases and reverts to its equilibrium. This was caused by the reversal of quantitative easing by the developed economies (Kim and Yang 2011). A standard deviation shock of one in the UNCOV induced a dampening of the central policy rate of inflation targeting emerging markets. The response of the SR to the shock of the UNCOV is in line with the findings of Meinusch and Tillmann (2016).
There is an insignificant surge in the equity prices in response to the shocks of the US unconventional monetary policy, as the upper confidence interval is above the steady and the lower interval is below the steady state. These results are not in line with other studies that found a surge in equity prices because of the US unconventional monetary spillover effects on emerging economies (Bhattarai et al. 2021; Sugimoto and Matsuki 2019; Tillmann 2016; Tran and Pham 2020). Most studies found a surge in equity prices in response to a one standard deviation shock to the US unconventional monetary policy shocks.
5.2. Model Two: Non-Inflation Targeting EMEs Panel VAR Estimation Results
Firstly, descriptive statistics of the variables were obtained. Before the stationarity test, the variables were tested for their degree of stationarity. According to the correlation matrix, the coefficients of all the variables are less than 60%; hence, the variables are not correlated and can be employed in the panel VAR without producing biased estimates (Gujarati et al. 2012). UNCOV and FDR coefficients have the highest negative correlation of 60%, which is highly possible since both represent the unconventional and traditional monetary policy of the US, respectively.
5.2.1. Descriptive Statistics
It is vital to commence with a discussion of the empirical results by examining the properties of the time series data to be applied in the econometric models. The data consist of 256 observations from four non-inflation targeting emerging markets of quarterly data, spanning from 2000Q1 to 2020Q4. The estimation of the numerous summary statistics, like the median, mean, probability, skewness, Jarque-Bera and kurtosis tests, are presented in Table 1 below. The mean of the central bank policy rate for the emerging markets, federal reserve policy rate, exchange rate and equity prices in Table A2 are 6.563, 0.889, 1.983 and 6.008, respectively. The probability for all the variables is less than 10%, which indicates that the variables may not be normally distributed. Non-normality is a result of the structural break in the data. Moreover, most of the emerging markets were hindered by credit rating agencies as most were downgraded to junk status due to corruption, poor policies, and political uncertainty. The skewness of equity prices and the nominal exchange rate is zero or less, which is accepted by the literature (Gujarati and Porter 2004). The Jarque-Bera test of normality is an asymptotic test based on the OLS residuals. It is a test of the joint hypothesis that skewness and kurtosis are zero and three, respectively (Gujarati and Porter 2004). The JB test follows the Chi-square distribution with two degrees of freedom with the null hypothesis that the residuals are normally distributed. If the JB statistic is greater than the value of the Chi-square of 5.99 at the five percent level, we reject the null hypothesis that the residuals are normally distributed.
5.2.2. Stationarity Tests
One of the essential assumptions in time-series analysis is stationarity. To avoid biased coefficient estimated results, we evaluate all variables for stationarity before performing panel VAR analysis. SR, FDR, BA, and the nominal exchange rate reject the null hypothesis at 1%. According to Table 3, all variables are stationary at the level form; thus, a panel VAR may be estimated.
Table 3.
Summary of panel unit root tests.
5.2.3. Lag Selection Criterion
According to Table 4, the Bayesian Information Criteria, the Akaike Information Criterion and the Hannan-Quinn Information Criterion, the selected minimum lag is one (Andrews and Lu 2001). All the lag length selection criteria (MBIC, MAIC, and MQIC) suggest that a first-order panel VAR is preferred. The study uses the panel VAR lag order one, automatically selected by all three tests (Akaike Information Criterion (AIC), Hannan–Quinn Criterion (HQC) and the Bayesian Information Criterion (BIC)), as the minimum lag.
Table 4.
Panel VAR lag order selection criteria.
The panel VAR was estimated, and it passed the diagnosis test as all the moduli were less than one and lay within the circle.
5.2.4. The Stability Tests
Before the computation of the impulse response function, the panel VAR model must satisfy the stability conditions. An unstable panel VAR model results in a biased impulse response and variance decomposition. Table A4 in Appendix A shows the results of the stability of the estimated panel VAR. The panel VAR model satisfies the stability condition, as all the eigenvalues lie inside the unit circle. Hence, the impulse response and variance decomposition will be significant and robust. The modulus in Table A4 is all less than one and hence satisfies the stability of the panel VAR model. In addition, the eigenvalues lie within the circle, which confirms the stability of the model (Abrigo and Love 2016).
5.2.5. The Impulse Response Function
This section begins by discussing the response of the selected macroeconomic variables to a one standard deviation shock of the US unconventional monetary policy (UNCOV). According to Gambacorta et al. (2014) and Glick and Leduc (2013) a one standard deviation shock to the US unconventional monetary policy shock results in the decline of the policy rate for emerging markets. The first row of Figure 4 shows the response of other variables to the US unconventional monetary shocks. A positive shock to the US unconventional monetary policy shock results in the appreciation of the nominal exchange rate, which is in line with the theory and other empirical literature.
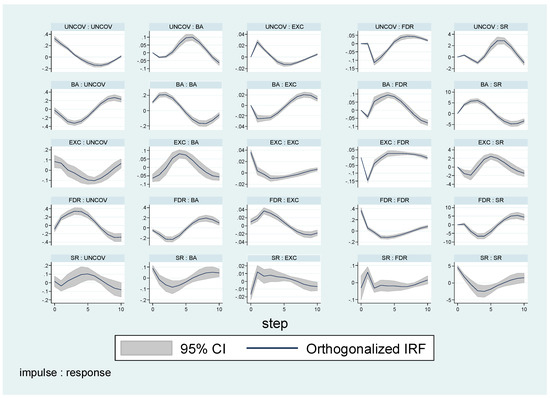
Figure 4.
The Impulse Response Function. Source: Estimated by author.
In the long run, the nominal exchange rate decreases and reverts to its equilibrium, as was caused by the reversal of quantitative easing by the developed economies. A one standard deviation shock to the US unconventional monetary policy resulted in a decline in the policy rate of non-inflation targeting emerging markets. The decline of the policy rate of the non-inflation emerging markets is consistent with the existing literature (Meinusch and Tillmann 2016).
The equity prices decrease in the short run and increase in the long run in response to the shocks of the US unconventional monetary policy. These results are in contrast to other studies that found a surge in equity prices as a result of the US unconventional monetary spillover effects on emerging economies (Bhattarai et al. 2021; Sugimoto and Matsuki 2019; Tillmann 2016). More studies with high-frequency data must be conducted in order to determine the real effectiveness of the US unconventional monetary policy on equity prices in exchange rate targeting emerging markets. Most studies found a surge in equity prices in response to a one standard deviation shock to US unconventional monetary policy shocks. The decline in equity prices may be a result of the spiralling of inflation and stagnant economic growth in the selected exchange rate targeters.
6. Conclusions and Policy Recommendations
The empirical results suggest that there is a significant positive spillover effect of the US unconventional monetary policy on the domestic currency of both the inflation targeters and non-targeters of the selected emerging markets. Unexpectedly there was an insignificant surge in the equity prices (DBA) of inflation targeters in response to a one percent increase in the US unconventional monetary policy (Abdullah and Hassanien 2022; Hofman and Kamber 2020; Ahmed et al. 2020). However, there was a temporary decline in the equity prices of non-targeters and a surge in the long run. This may be due to the fact that all the non-targeters use the exchange rate regime, which results in minimum confidence amongst international investors.
The equity prices responded with a slump to the federal reserve rate during the credit crunch in both inflation and non-targeting emerging markets. This is consistent with the existing literature, as the US tightening monetary policy shocks decreased the equity prices of emerging economies (Ono 2020; Fratto et al. 2021; Yildirim and Ivrendi 2021). The federal reserve rate did not have a significant impact on the policy rate of emerging economies. This is due to the fact that the federal reserve rate was at its lower zero lower bound. Future studies must attempt to employ low-frequency data through the global vector autoregressive model, which has the advantage of linking countries through financial or trade weights and it also accommodates regions
Based on the findings of this research, emerging nations can use a variety of strategies to lessen the negative effects of the US monetary policy. The oversight of global capital flows should be strengthened when targeting emerging nations without inflation. Changes to the federal balance sheet will fundamentally alter international capital flows and create uncertainty in developing economies in the context of the adjustment in the US monetary policy. The BRICS nations should use their foreign exchange reserves wisely to control exchange rates and enhance macroeconomic fundamentals, like economic growth, to lessen exchange rate volatility.
Author Contributions
Conceptualization, L.S.N., S.Z. and I.K.; methodology, L.S.N.; software, L.S.N.; validation, L.S.N.; formal analysis, L.S.N.; writing original draft preparation, L.S.N.; writing review and editing, L.S.N.; visualization, L.S.N.; supervision, S.Z. and I.K. All authors have read and agreed to the published version of the manuscript.
Funding
This research was funded by NRF bursary scheme, unique grant no: 122953. We also wish to express our gratitude to the entire staff at the University of Zululand’s Department of Economics for language editing funding.
Informed Consent Statement
We thank everyone who attended the Management of Business and Legal Initiatives (MBALI) (2022) conference in Richards Bay for their invaluable input during the early stages of this research. Also, we thank the University of Zululand’s Department of Economics staff, for their constructive criticism and helpful suggestions on this research.
Data Availability Statement
Publicly datasets were analyzed in this study. This data can be found here: [https://data.imf.org/ and https://www.haver.com/our-data (accessed on 23 February 2021)], Specifically, the data can be assessable from the International Monetary Fund (IMF) data base. Further inquiries can be directed to the corresponding author.
Conflicts of Interest
The authors declare no conflict of interest. Also, the funders had no role in the design of the study; in the collection, analyses, or interpretation of data; in the writing of the manuscript, or in the decision to publish the results.
Appendix A. Estimation Results
Table A1.
Descriptive statistics.
Table A1.
Descriptive statistics.
| SR | FDR | EXC | BA | |
|---|---|---|---|---|
| Mean | 9.521768 | 2.068437 | 1493.654 | 4.948166 |
| Median | 5.750000 | 1.000000 | 43.07580 | 4.955578 |
| Maximum | 60.00000 | 6.250000 | 14657.00 | 5.456676 |
| Minimum | 0.481057 | 0.500000 | 1.023021 | 4.495893 |
| Std. Dev. | 10.27675 | 1.843905 | 3344.804 | 0.200439 |
| Skewness | 2.576114 | 1.193827 | 2.352875 | 0.131209 |
| Kurtosis | 11.13295 | 3.018237 | 6.981064 | 2.473567 |
| Jarque-Bera | 1977.394 | 121.6261 | 810.5162 | 7.381236 |
| Probability | 0.000000 | 0.000000 | 0.000000 | 0.024957 |
| Sum | 4875.145 | 1059.040 | 764751.1 | 2533.461 |
| Sum Sq. Dev. | 53967.53 | 1737.392 | 5.72 × 10⁹ | 20.52981 |
Table A2.
Descriptive statistics.
Table A2.
Descriptive statistics.
| SR | FDR | EXC | BA | |
|---|---|---|---|---|
| Mean | 6.563097 | 0.888889 | 1.982550 | 6.008487 |
| Median | 3.500000 | 0.750000 | 1.996421 | 5.674225 |
| Maximum | 34.66677 | 2.500000 | 2.079700 | 7.232552 |
| Minimum | 2.000000 | 0.500000 | 1.831912 | 5.329150 |
| Std. Dev. | 7.170145 | 0.463509 | 0.042366 | 0.695852 |
| Skewness | 2.419306 | 2.514941 | −1.373482 | 0.838595 |
| Kurtosis | 7.960177 | 8.386548 | 5.110055 | 2.029130 |
| Jarque-Bera | 288.0932 | 325.8877 | 71.98887 | 22.53334 |
| Sum | 945.0860 | 128.0000 | 285.4871 | 865.2221 |
| Sum Sq. Dev. | 7351.771 | 30.72222 | 0.256663 | 69.24204 |
Table A3.
Model 1: The stability tests.
Table A3.
Model 1: The stability tests.
| Eigenvalue Modulus | Roots of Companion Matrix |
|---|---|
| +----------------------------------+ | Eigenvalue | | | Real Imaginary | Modulus | |----------------------+-----------| | 0.9688422 0 | 0.9688422 | | −0.8128709 0 | 0.8128709 | | 0.133365 −0.4038111 | 0.4252642 | | 0.133365 0.4038111 | 0.4252642 | | 0.1842444 0 | 0.1842444 | +---------------------------------+ |  |
Table A4.
Module 2: The stability tests.
Table A4.
Module 2: The stability tests.
| Modulus | Roots of the Companion Matrix |
|---|---|
| +----------------------------------+ | Eigenvalue | | | Real Imaginary | Modulus | |----------------------+-----------| | 0.8345989 −0.4845198 | 0.9650465 | | 0.8345989 0.4845198 | 0.9650465 | | 0.3681874 0.553842 | 0.6650586 | | 0.3681874 −0.553842 | 0.6650586 | | −0.3488169 0 | 0.3488169 | +----------------------------------+ |  |
References
- Abdullah, Ahmed Ashour, and Ahmed Mohamed Hassanien. 2022. Spillovers of US Unconventional Monetary Policy to Emerging Markets: Evidence from Egypt. International Journal of Economics and Finance 14: 1. [Google Scholar] [CrossRef]
- Abrigo, Michael, and Inessa Love. 2016. Estimation of panel vector autoregression in Stata. The Stata Journal 16: 778–804. [Google Scholar] [CrossRef]
- Ahmed, Irfan, Claudio Socci, Francesca Severini, Rosita Pretaroli, and Hassan Kasady Al Mahdi. 2020. Unconventional monetary policy and real estate sector: A financial dynamic computable general equilibrium model for Italy. Economic Systems Research 32: 221–38. [Google Scholar] [CrossRef]
- Aizenman, Joshuan, Mahir Binici, and Michael Hutchison. 2014. The Transmission of Federal Reserve Tapering News to Emerging Financial Markets (No. w19980). Cambridge: National Bureau of Economic Research. [Google Scholar]
- Andrews, Donald W. K., and Biao Lu. 2001. Consistent model and moment selection procedures for GMM estimation with application to dynamic panel data models. Journal of Econometrics 101: 123–64. [Google Scholar] [CrossRef]
- Arslan, Yavuz, Mathias Drehmann, and Boris Hofmann. 2020. Central Bank Bond Purchases in Emerging Market Economies. Basel: Bank for International Settlement, pp. 1–7. [Google Scholar] [CrossRef]
- Bauer, Michael D., and Christopher J. Neely. 2014. International channels of the Fed’s unconventional monetary policy. Journal of International Money and Finance 44: 24–46. [Google Scholar] [CrossRef]
- Bhattarai, Saroj, Arpita Chatterjee, and Woong Yong Park. 2021. Effects of US quantitative easing on emerging market economies. Journal of Economic Dynamics and Control 122: 104031. [Google Scholar] [CrossRef]
- Canova, Fabio, Matteo Ciccarelli, and Pietro Dallari. 2013. Spillover of Fiscal Shocks in the Euro Area. Frankfurt: European Central Bank. [Google Scholar]
- Chen, Qianying, Andrew Filardo, Dong He, and Feng Zhu. 2016. Financial crisis, US unconventional monetary policy and international spillovers. Journal of International Money and Finance 67: 62–81. [Google Scholar] [CrossRef]
- Ciccarelli, Matteo, Angela Maddaloni, and Jose Luis Peydró. 2015. Trusting the bankers: A new look at the credit channel of monetary policy. Review of Economic Dynamics 18: 979–1002. [Google Scholar] [CrossRef]
- Curdia, Vasco, and Michael Woodford. 2011. The central-bank balance sheet as an instrument of monetarypolicy. Journal of Monetary Economics 58: 54–79. [Google Scholar] [CrossRef]
- Dajcman, Silvo. 2013. Interdependence between some major European stock markets-a wavelet lead/lag analysis. Prague Economic Papers 22: 28–49. [Google Scholar] [CrossRef]
- Estrada, Gemmap, Donghyun Park, and Arief Ramayandi. 2016. Taper tantrum and emerging equity market slumps. Emerging Markets Finance and Trade 52: 1060–71. [Google Scholar] [CrossRef]
- Fadejeva, Ludmila, Martin Feldkircher, and Thomas Reininger. 2017. International spillover from Euro area and US credit and demand shocks: A focus on emerging Europe. Journal of International Money and Finance 70: 1–25. [Google Scholar] [CrossRef]
- Fleming, J. Marcus. 1962. Domestic Financial Policies under Fixed and under Floating Exchange Rates. Staff Papers-International Monetary Fund 9: 369–80. [Google Scholar] [CrossRef]
- Fratto, Chiara, Brendan Harnoys Vannier, Borislava Mircheva, David de Padua, and Helene Poirson. 2021. Unconventional Monetary Policies in Emerging Markets and Frontier Countries. Washington, DC: International Monetary Fund. [Google Scholar]
- Fratzscher, Marcel, Marco Lo Duca, and Roland Straub. 2018. On the international spillovers of US quantitative easing. The Economic Journal 128: 330–77. [Google Scholar] [CrossRef]
- Frenkel, Jacob Aharon, and Assaf Razin. 1987. Fiscal Policies and the World Economy; An Intertemporal Approach (Cambridge, Mass.: MIT Press, 1987) (No. 20438). Munich: University Library of Munich. [Google Scholar]
- Gambacorta, Leonardo, Boris Hofmann, and Gert Peersman. 2014. The effectiveness of unconventional monetary policy at the zero lower bound: A cross-country analysis. Journal of Money, Credit and Banking 46: 615–42. [Google Scholar] [CrossRef]
- Ganelli, Giovanni, and Nour Tawk. 2016. Spillovers from Japan’s Unconventional Monetary Policy to Emerging Asia: A Global VAR Approach. Washington, DC: International Monetary Fund. [Google Scholar]
- Giannone, Domenico, Michele Lenza, Huw Pill, and Lucrezia Reichlin. 2011. Non-standard monetary policy measures and monetary developments. In Interest Rates, Prices and Liquidity. Cambridge: Cambridge University Press, pp. 195–221. [Google Scholar]
- Glick, Reuven, and Sylvain Leduc. 2012. Central bank announcements of asset purchases and the impact on global financial and commodity markets. Journal of International Money and Finance 31: 2078–101. [Google Scholar] [CrossRef]
- Glick, Reuven, and Sylvain Leduc. 2013. Unconventional monetary policy and the dollar. FRBSF Economic Letter 9: 1–4. [Google Scholar]
- Gujarati, Damondar, and Down Porter. 2004. Basic Econometrics. New York: McGraw-Hill. [Google Scholar]
- Gujarati, Damondar, Dawn Porter, and Sangeetha Gunasekar. 2012. Basic Econometrics. New Delhi: Tata McGrawhill. [Google Scholar]
- Hadood, Abobaker, and Korhan Gokmenoglu. 2023. Spillover impact of the US unconventional monetary policy and uncertainties on stock-bond correlations. Panoeconomicus 17. [Google Scholar] [CrossRef]
- Hausman, Joshua, and Jon Wongswan. 2011. Global asset prices and FOMC announcements. Journal of International Money and Finance 30: 547–71. [Google Scholar] [CrossRef]
- Hofman, David, and Gunes Kamber. 2020. Unconventional Monetary Policy in Emerging Market and Developing Economies. IMF MCM Special Series on COVID-19; Washington, DC: International Monetary Fund. [Google Scholar]
- Ihrig, Jane, Elizabeth Klee, Canlin Li, Min Wei, and Joe Kachovec. 2018. Expectations about the federal reserve’s balance sheet and the term structure of interest rates. International Journal of Central Banking 53. [Google Scholar] [CrossRef]
- Ijiri, Hiroyuki, and Toshiki Jinushi. 2022. International spillover effects of quantitative easing policy: A case study on the US and Japan. Applied Economics Letters 29: 1042–46. [Google Scholar] [CrossRef]
- Inoue, Tomoo, and Tatsuyoshi Okimoto. 2022. International spillover effects of unconventional monetary policies of major central banks. International Review of Financial Analysis 79: 101968. [Google Scholar] [CrossRef]
- Joyce, Michael, Matthew Tong, and Robert Woods. 2011. The United Kingdom’s quantitative easing policy: Design, operation and impact. Bank of England Quarterly Bulletin 6: 200–12. [Google Scholar]
- Kenourgios, Dimitris, and Despoina Ntaikou. 2021. ECB’s unconventional monetary policy and bank lending supply and performance in the euro area. Journal of Economics and Finance 45: 211–24. [Google Scholar] [CrossRef]
- Kim, Soyoung, and Doo Yong Yang. 2011. The impact of capital inflows on asset prices in emerging Asian economies: Is too much money chasing too little good? Open Economies Review 22: 293–315. [Google Scholar] [CrossRef]
- Kolasa, Marcin, and Grzegorz Wesołowski. 2020. International spillovers of quantitative easing. Journal of International Economics 126: 103330. [Google Scholar] [CrossRef]
- Krishnamurthy, Arvind, and Annette Vissing-Jorgensen. 2011. The Effects of Quantitative Easing on Interest Rates: Channels and Implications for Policy (No. w17555). Cambridge: National Bureau of Economic Research. [Google Scholar]
- Lavigne, Robert, Subrata Sarker, and Garima Vasishtha. 2014. Spillover effects of quantitative easing on emerging-market economies. Bank of Canada Review 201: 23–33. [Google Scholar]
- Lubys, Justinas, and Pradiptarathi Panda. 2021. US and EU unconventional monetary policy spillover on BRICS financial markets: An event study. Empirica 48: 353–71. [Google Scholar] [CrossRef]
- Lyonnet, Victor, and Richard Werner. 2012. Lessons from the Bank of England on ‘quantitative easing’and other ‘unconventional’monetary policies. International Review of Financial Analysis 25: 94–105. [Google Scholar] [CrossRef]
- Matousek, Roman, Stephanos Theodoros Papadamou, Aleksander Šević, and Nickolaos G. Tzeremes. 2019. The effectiveness of quantitative easing: Evidence from Japan. Journal of International Money and Finance 99: 102068. [Google Scholar] [CrossRef]
- Meinusch, Annette, and Peter Tillmann. 2016. The macroeconomic impact of unconventional monetary policy shocks. Journal of Macroeconomics 47: 58–67. [Google Scholar] [CrossRef]
- Mundell, Robert Alexarnder. 1963. Capital mobility and stabilization policy under fixed and flexible exchange rates. Canadian Journal of Economics and Political Science 29: 475–85. [Google Scholar] [CrossRef]
- Neely, Christopher J. 2015. Unconventional monetary policy had large international effects. Journal of Banking & Finance 52: 101–11. [Google Scholar]
- Obafemi, Ngozi Frances, and Eugen Okoi Ifere. 2015. Monetary policy transmission mechanism in Nigeria: A comparative analysis. Research in World Economy 6: 93–103. [Google Scholar] [CrossRef]
- Ono, Shigeki. 2020. Impacts of conventional and unconventional US monetary policies on global financial markets. International Economics and Economic Policy 17: 1–24. [Google Scholar] [CrossRef]
- Papadamou, Stephanos, Nikolaos Antonis Kyriazis, and Panayiotis G. Tzeremes. 2019. Unconventional monetary policy effects on output and inflation: A meta-analysis. International Review of Financial Analysis 61: 295–305. [Google Scholar] [CrossRef]
- Peersman, Gert. 2011. Macroeconomic Effects of Unconventional Monetary Policy in the Euro Area. ECB Working Paper, No. 1397. Frankfurt: European Central Bank (ECB). [Google Scholar]
- Rai, Vikram, and Lena Suchanek. 2014. The EFFEct of the Federal Reserve’s Tapering Announcements on Emerging Markets. Working Paper, No. 2014-50. Toronto: Bank of Canada. [Google Scholar]
- Ramey, Valerie A., and Mathew D. Shapiro. 1998. Costly capital reallocation and the effects of government spending. In Carnegie-Rochester Conference Series on Public Policy. Amsterdam: North-Holland, vol. 48, pp. 145–94. [Google Scholar]
- Rebucci, Alessandro, Jonathan S. Hartley, and Daniel Jiménez. 2022. An event study of COVID-19 central bank quantitative easing in advanced and emerging economies. In Essays in Honor of M. Hashem Pesaran: Prediction and Macro Modeling. Bingley: Emerald Publishing Limited. [Google Scholar]
- Rogers, John Harold, Chiara Scotti, and Jonathan H. Wright. 2014. Evaluating asset-market effects of unconventional monetary policy: A multi-country review. Economic Policy 29: 749–99. [Google Scholar] [CrossRef]
- Seleteng, Monaheng, and Sephooko Motelle. 2016. Sources of Economic Growth in the Southern African Development Community: Its Likely Impact on Povery and Employment. Review of Economic and Business Studies 9: 211–49. [Google Scholar] [CrossRef]
- Sugimoto, Kimiko, and Takashi Matsuki. 2019. International spillovers into Asian stock markets under the unconventional monetary policies of advanced countries. Journal of the Japanese and International Economies 52: 171–88. [Google Scholar] [CrossRef]
- Swanson, Eric T. 2021. Reprint: Discussion of “monetary policy uncertainty and monetary policy surprises”. Journal of International Money and Finance 114: 102402. [Google Scholar] [CrossRef]
- Tillmann, Peter. 2016. Unconventional monetary policy and the spillovers to emerging markets. Journal of International Money and Finance 66: 136–56. [Google Scholar] [CrossRef]
- Tran, Thi Bich Ngoc, and Hoang Cam Huong Pham. 2020. The spillover effects of the us unconventional monetary policy: New evidence from asian developing countries. Journal of Risk and Financial Management 13: 165. [Google Scholar] [CrossRef]
- Vermeulen, Cobus Cornelis. 2019. Essays on Unconventional Monetary Policy. Doctoral thesis, University of Pretoria, Pretoria, South Africa. [Google Scholar]
- Yildirim, Zekeriya, and Mehmet Ivrendi. 2021. Spillovers of US unconventional monetary policy: Quantitative easing, spreads, and international financial markets. Financial Innovation 7: 1–38. [Google Scholar] [CrossRef]


Disclaimer/Publisher’s Note: The statements, opinions and data contained in all publications are solely those of the individual author(s) and contributor(s) and not of MDPI and/or the editor(s). MDPI and/or the editor(s) disclaim responsibility for any injury to people or property resulting from any ideas, methods, instructions or products referred to in the content. |
© 2023 by the authors. Licensee MDPI, Basel, Switzerland. This article is an open access article distributed under the terms and conditions of the Creative Commons Attribution (CC BY) license (https://creativecommons.org/licenses/by/4.0/).