Article

Can ESG Stocks Be a Safe Haven during Global Crises? Evidence from the COVID-19 Pandemic and the Russia-Ukraine War with Time-Frequency Wavelet Analysis

by
Ioannis Katsampoxakis
1,*,
Stylianos Xanthopoulos
1,
Charalampos Basdekis
2 and
Apostolos G. Christopoulos
3,*
1
Department of Statistics and Actuarial Financial Mathematics, University of the Aegean, 83200 Samos, Greece
2
Department of Tourism Management, Hellenic Open University, 26335 Patras, Greece
3
Department of Business Administration, University of the Aegean, 82132 Chios, Greece
*
Authors to whom correspondence should be addressed.
Economies 2024, 12(4), 89; https://doi.org/10.3390/economies12040089
Submission received: 7 March 2024 / Revised: 3 April 2024 / Accepted: 8 April 2024 / Published: 12 April 2024
(This article belongs to the Collection International Financial Markets and Monetary Policy)

Abstract

:
In times of intense economic variability and social turbulence worldwide, this paper aims to examine the existence of transient correlations and interdependencies between the most important MSCI ESG indices worldwide and the most important commodities’ index, economic uncertainty, natural gas, gold, and VIX, in a geographical and social context during two recent crises: the COVID-19 pandemic and the energy crisis due to the Ukrainian war. Using daily data from 3 January 2020 and extending until 23 August 2022, this study applies a wavelet coherence approach to analyze time series co-movements, in order to emphasize all possible combinations’ correlations and achieve more accurate outcomes at any given time and frequency band simultaneously and spontaneously. The results show robust coherence between different geographical areas, time, and frequency bands, indicating both positive and negative correlations with most of the combined ESG indices and other economic indicators. The study suggests that stock indices of leading ESG companies in North America and Europe constitute a safe investment haven during major upheavals and crises, providing a way for investors to manage risk and generate positive returns while contributing to economic sustainability.

1. Introduction

Sustainability is a notion widely used by all official agencies, institutions, governments, and political parties worldwide during the last decade and centers around the need to consider the environmental, economic, and social dimensions in development. More specifically, sustainability refers to the ability to maintain or support a process continuously over time. In business and policy contexts, sustainability seeks to prevent the depletion of natural or physical resources, so that they will remain available for the long term. This awareness has been intensively promoted and communicated, and it was the trigger for firms and investors to follow more eco- and socially friendly policies, as being corroborated by the soar of investing in ESG indices. The dimensions of ESG practices encompass a wide range of notions, including environmental factors such as renewable energy and waste management, social factors such as community participation and human resources management, and governance factors such as business ethics and risk management (Brzeszczyński and McIntosh 2014). However, traditional energy sources, such as charcoal, still constitute a dominant energy source, for which any hovering in retail prices affects social cohesion and leads to social unrest (Alinaitwe and Bergland 2024).
To perceive and measure the implications of investments on the environment, society, and governance, sustainable investment tends to use specific indicators called environmental, social, and governance during the process of making a financial investment decision (Jain et al. 2019). More specifically, ESG criteria are considered as directly interconnected aspects of sustainable business practices. Economic development, on the one side, focuses on improving the economic well-being and quality of life for a community through job creation, infrastructure development, and wealth generation. ESG, on the other hand, refers to the environmental, social, and governance factors that companies consider in their operations, decision-making, and interactions with stakeholders.
So far, ESG factors are one of the most discussed and interesting issues in all economies and can be considered as the basis for taking sustainable investment decisions (Vives and Wadhwa 2012) since they imprint firms’ transparency and accountability (Jain et al. 2019), in favor of economies, societies, and firms. So far, this comes in full alignment with the outcome that countries with stronger information disclosure and institutional frameworks tend to promote these types of investments, even unconsciously (Bauer and Smeets 2015; Riedl and Smeets 2017; Giglio et al. 2021).
In recent years, investors tend to turn to companies that maintain high ESG indicators, implying that these firms follow policies and practices that are friendly to the environment, society, and corporate governance (Vives and Wadhwa 2012). Although these indicators are not financial indicators, they provide detailed information about the purpose of each firm, the formulation of its strategy, and the way it is managed. ESG is changing the traditional way firms operate, and studies have proven the positive influence of ESG indicators on firms’ financial performance (Dhaliwal et al. 2011; Ioannou and Serafeim 2015).
Over time, the growing global attention towards sustainability has led to the development of ESG indices, sustainability reports by international institutions, large companies, and states, and the implementation of sustainable strategies in business practices. While ESG and sustainability are related, they are not identical concepts. ESG criteria specifically aim to address environmental, social, and governance issues, while sustainability in business practices focuses on applying profitable techniques, policies, and strategies that contribute to the common good. It is of major importance to clarify that firms that prioritize ESG factors are more likely to contribute to sustainable economic development in the long run in a sustainable and socially responsible manner. In turn, sustainable economic development can support ESG goals by fostering long-term prosperity, reducing inequality, and preserving natural resources.
So far, it is of great interest to numerically perceive that boost of investing in ESG indices. In 2020, the first year of the COVID-19 outbreak, the investment in ESG assets surpassed USD 35 trillion. This soar was continued in 2022, the first year of intense energy crisis due to the war in Ukraine (more USD 41 trillion investments in ESG assets worldwide), and is expected to break the USD 50 million barrier in 2025 (Bloomberg Intelligence 2023). According to the Global Sustainability Investment Alliance (2018), in the years preceding the outbreak of the pandemic and energy crises, the level of investing in ESG was about the half of the current situation (USD 22.8 and USD 30.5 trillion in 2016 and 2018, respectively). As is apparent, the years of subsequent crises contributed to the awakening of businesses and investors worldwide.
Many ESG companies have demonstrated a commitment to social responsibility, which may have helped them navigate the challenges posed by the pandemic and energy crises. So far, enhanced investments in corporate social responsibility mitigate operating-specific risks (Aevoae et al. 2023). In the issue of social contribution, the positive impact of gender equality on firms’ performance based on ESG criteria and the undertaking of females in positions of responsibility has to be added (Basdekis et al. 2023).
However, ESG investments are not guaranteed to perform well at all times. As with any investment, there are risks involved and there is no certainty of returns. Investors interested in ESG stocks should carefully research individual companies and funds, assess their financial viability, and consider their long-term potential for growth and stability before making any investment decisions. The risk–return features of ESG stocks and their direct relationship could not be missing from the current literature, especially after the soar of ESG investments, during the pandemic outbreak (Broadstock et al. 2020). More specifically, companies with higher ESG ranking tend to bear lower risk and remain more stable during turbulent times (Ferriani and Natoli 2020; Singh 2020). Constant ESG stocks supervision and monitoring by competent authorities contributes to higher returns and lower volatility (Díaz et al. 2021). However, there are elder studies concluding that ESG monitoring may result in lower portfolio performance of ESG assets compared to traditional ones (Leite and Cortez 2015; Auer 2016).
Moreover, the tendency to invest in ESG stocks as an alternative investment of conventional ways of safe havens—gold (Baur and Hoang 2021; Yousaf et al. 2021), or traditional methods of investment such as bonds (Yarovaya et al. 2021; Hassan et al. 2021; Gehricke et al. 2023), cryptocurrencies (Goodell and Goutte 2020; Rehman and Vo 2020; Rubbaniy et al. 2021; Dwita Mariana et al. 2021), commodities (Bouri et al. 2020; Rehman and Vo 2020; Ji et al. 2020), foreign exchange currencies (Urquhart and Zhang 2019), and stocks (Ashraf et al. 2020; Hassan et al. 2021)—is of special interest. However, investors should be prudent while selecting their investing portfolio, as whatever shines is not gold, and it is not given that all firms participating in the ESG market follow the appropriate practices.
For the purposes of this study, we examine the behavior of regional stock performance ESG indices during periods of crisis, such as the COVID-19 pandemic and energy crises and the existence of any interdependence between some of the most important proxy indices related with investments in commodities and energy products, economic uncertainty, and investors’ fear. More specifically, it is of great importance to investigate the kind, the range, and the time extent and period of which the under-investigation indices can serve as a safe investment haven for portfolio managers and provide a basis for policymakers’ decisions.
The Section 2 of our study provides a comprehensive literature review, while the Section 3 outlines the data variables and methodology used. The Section 4 presents an in-depth analysis of the empirical results from an economic perspective. In the Section 5, we highlight the most important outcomes and discuss practical implications, as well as suggest future research directions.

2. Literature Review

I.
Do investments in ESG promote a superiority related to other investment choices? A theoretical approach
Individuals who prioritize environmentally friendly practices are more likely to invest in green projects, such as purchasing stocks in eco and socially responsible companies. This behavior is often driven by a mental process rather than the expectation of higher returns.
Recent research stresses the critical role of banks in the development of green financing and achieving sustainable development goals in developing economies (Zheng et al. 2021). Similarly, La Torre et al. (2019) found that investing in social impact bonds can promote social coherence and sustainable development more effectively than current financial systems.
Given the importance of green investments for financial performance, numerous studies have explored this topic in various ways. ESG indices can provide insight into the impact of sustainable practices on standard business operations and their potential to drive sustainable economic development in the long run, as sustainability is considered as a durable process.
In a study by Gao et al. (2021), a connectedness methodology was used to determine whether there are spillover effects between traditional and green bonds. They employed a multidimensional DCC-GJRGARCH model and discovered the existence of contagion for both types of bonds in China. Moreover, in advanced economies in Asia, a bidirectional relationship between green bonds and several microeconomic, investments governance, and human resources variables is observed as a result of the implemented state policy that all variables are interlinked between each other, as opposed to the case of lower income countries, where a unidirectional correlation is recorded (Phung Thanh 2022).
Studies have shown the existence of a significant impact on capital markets, international economies, and firms’ performance. In terms of capital markets, the demand for ESG investments has grown rapidly in recent years, with investors increasingly seeking to align their investments with their values and beliefs (Basdekis 2023). Krüger (2015) investigated the reaction of ESG indices to stock market performance and found that the reaction is strongly negative in the case of negative events and less negative in positive ones. Similarly, Morea et al. (2022) demonstrated that ESG indices have a positive impact on stock market performance. Charlo et al. (2015) focused their research on ESG indices in Spain and found that firms following ESG criteria earn higher profits for the corresponding level of systematic risk, and their performance seems to be more sensitive to market information.
There have been numerous studies investigating the impact of firms’ sustainability practices on their performance, with many finding a statistically significant positive relationship (Pilar Marti et al. 2015; Rajnoha et al. 2016, 2017; Alshehhi et al. 2018). However, some studies have yielded controversial findings, such as Lassala et al. (2017), whose results did not lead to a clear conclusion regarding the relationship between corporate social responsibility and financial performance. Similarly, Liket and Maas (2016) focused on the sustainability index of the New York Stock Exchange and found that social corporate performance did not appear to significantly affect firms’ size, profitability, or financial performance.
Studies have also shown that positive ESG announcements have a positive impact on firms’ stock prices (Naughton et al. 2019; Capelle-Blancard and Petit 2019) and that information related to ESG, accompanied by transparency and accountability, enhances firms’ values and investment returns (Li et al. 2018; Fatemi et al. 2018).
Another issue arising from recent literature is the existence of spillover effects between ESG indices and traditional ones. Jain et al. (2019) found that these types of indices are closely linked, and there is no essential differentiation in outcome regardless of the type of indices used. Their empirical analysis included unit root tests, Granger causality, and ARCH family models to test for linkages between the two types of indices and error correction models and Johansen cointegration tests to find contagion of volatility. This research approach is relevant to many other interesting studies being conducted (Kenourgios and Dimitriou 2015; Gong et al. 2019; Wang et al. 2020; Zhang et al. 2020; Katsampoxakis 2021).
The use of multivariate ARCH family models has limitations in sorting out the problem arising from both possible and intense risk spillover effects and their movement over time. To address this issue, various VAR models have been used, including time-varying autoregressive models, which deduct variances and prevent any loss of information related to time-varying features (Fassas 2020; Papathanasiou et al. 2021; Samitas et al. 2021).
Furthermore, Gao et al. (2022) explored the risk diffusion features of global ESG stock markets in both frequency and time areas. They found that the North American markets are the focal point of risk contagion in ESG stock markets worldwide. Similarly, Umar et al. (2020) investigated ten major economies globally (including North American economies) and found that the ESG market of the most developed economies indicates the highest contagion risk in global markets.
According to Cagli et al. (2023) findings, all ESG indices are net volatility transmitters and all commodity indices other than crude oil and copper are net volatility receivers. Moreover, bilateral intercorrelations between ESG indices are higher among US, Latin America, and Europe region group pairs and weaker in relation to Middle East Africa and Asia Pacific region group pairs, indicating the presence of contagion within developed and/or emerging regions, which has relevance for portfolio and risk management (Shaik and Rehman 2023).
II.
ESG investments in times of crises
Over the past two decades, the international scientific literature on ESG has become a significant topic in economic literature, particularly after the 2007 global financial crisis.
International bibliography does not clarify whether investing in ESG indices can be considered as a safe haven for investors during times of turbulence. Like any other investments, ESG stocks can be affected by market conditions and economic factors. However, ESG investments have shown resilience during times of market volatility in recent years, as ESG funds in U.S. and Europe outperformed non-ESG funds during the first quarter of 2020, when the COVID-19 pandemic began to spread globally (Morning Star 2023). This outperformance of ESG investment to the detriment to the traditional ones, during hard times, is specialized even more according to the type of ESG investments, i.e., investments in responsible investment funds, green funds, and ESG stocks (Cunha et al. 2020; Alessandrini and Jondeau 2020; Zhu et al. 2021). This resilience is mainly subject to the fact that ESG stocks tend to be well managed, focusing on sustainability and long-term growth potential.
Investors, academics, firms, and policymakers have shown a keen interest in understanding whether ESG indices can serve as a bulwark against contagion risk, a hedging tool for assets, or a safe investment haven (Gubareva and Borges 2016; Umar and Suleman 2017; Riaz et al. 2019; Kenourgios et al. 2020; Katsampoxakis et al. 2022). It also has to be stressed that an intermediary volatility channel is observed, which gradually reinforces the effect of ESG on credit risk. To be more accurate, a one-standard-deviation improvement in ESG ratings is estimated to reduce CDS spreads in ESG firms by approximately between 3% and 8% according to the size and the quality of ESG firm (Barth et al. 2022).
Investing in ESG indices during the global financial crisis has been shown to be less risky, less volatile, and more profitable than investing in traditional stock market indices, according to Ortas et al. (2015), De la Torre et al. (2016), Del Mar Miralles-Quiros et al. (2017), and Batista and Francisco (2018).
The COVID-19 pandemic (Christopoulos et al. 2021) and the energy crisis due to the war in Ukraine have intensified, both academically and in terms of risk and return, the issue of investment safety, and the increased possibilities offered by investing in ESG.
According to Lööf et al. (2022), ESG indices have helped investors to mitigate their risk exposure to the market because of the pandemic. Similarly, Chen and Yang (2020) studied the Taiwanese market during the pandemic period and found similar results. In China, portfolios that indicate high ESG values have outperformed those with low values and reduced financial risks during the COVID-19 pandemic (Broadstock et al. 2020), while during the energy crisis period due to the war in Ukraine, the RTSI significantly affects both the European and American stock markets and determines the evolution of the Russian currency (Basdekis et al. 2022).
Filbeck et al. (2022) observed that firms with low or missing scores in ESG indices tend to experience the strongest stock market reactions. Meanwhile, Engelhardt et al. (2021) demonstrated that European companies with high ESG scores were more likely to achieve abnormal returns and lower stock volatility during the COVID-19 pandemic.
As a result of the pandemic, investors sought to minimize risk by diversifying their portfolios. This led to a surge in the capitalization of ESG stocks, which now make up a larger portion of investors’ portfolios compared to traditional stocks (Rubbaniy et al. 2022). Diversifying into ESG stocks has also been shown to yield better returns and lower risk (Albuquerque et al. 2020; Broadstock et al. 2020).
Umar et al. (2021) and Umar and Gubareva (2021) used a wavelet coherence approach to investigate whether the COVID-19 pandemic and related media coverage affected the volatility of important ESG indices worldwide. They found that there were clear patterns of low, medium, and high coherence between the Coronavirus Panic Index and price movements of the examined ESG indices, as well as between the Media Coverage Index and the price movements of those ESG indices. Moreover, they found differences in patterns related to geographical areas for both hypotheses examined.
According to Rubbaniy et al. (2022), ESG stock indices and the COVID-19 fear index tend to move in the same direction at low frequencies, indicating the potential for safe investments in ESG during the pandemic. However, at low frequencies, the results are inconclusive and do not lead to a clear conclusion on direction.
III.
Hypothesis Testing
This study focuses on the two most important and intense crises of the last decade, which affected the world economy. For the purposes of this research, a variety of apparently different types of indicators have been used, whose impact and ramifications on international economy is undoubtful.
More specifically, there has been use of specific worldwide appeal of MSCI ESG indices in order to capture the whole investment interest and investors’ choices on ESG stocks, commodities indices, and economic indices.
For a clearer and more robust picture of our study, it has to be mentioned that the MSCI ESG indices being examined cover the whole of geographical area worldwide, including both the economic performance of listed firms and economic potential of their economies.
The choice of the aforementioned indices was made in order to resort to the process of seeking robust answers in our research questions set. So far, the most essential research questions seeking answers can be classified as follows:
  • Is any kind of interdependence observed between each MSCI ESG index examined and all specific individual commodities indices and fear index?
  • In case of interrelation between the variables being examined, which variable seems to affect the other more and in which direction (in-phase or out of phase)?
  • Which is the band width and the time period extension during which this impact is more intense and robust in case of interdependencies between variables?
  • Are any differences observed in the outcome related to the two periods of crises being examined (health vs. energy crisis)?
  • Which can be considered as the most important safe heaven investment spots for potential investors?
Inclusively, while many studies have focused on using ESG indices as investment tools to hedge against risk and ensure returns during periods of crisis, this study aims to investigate the relationship between traditional investments in commodities and energy products, economic uncertainty, and fear, and specific ESG indices during the recent global crises since 2020, namely the COVID-19 pandemic and the energy crisis due to the war in Ukraine. More specifically, this study seeks to determine whether there are differences in the dependency relationship between these two intense crises, and to provide important conclusions and suggestions for investors and policymakers alike.

3. Data and Methodology

3.1. Data and Variables

We conducted an empirical analysis using daily data from five ESG indices, namely the MSCI ACWI ESG Leaders Index, MSCI Emerging Market ESG, MSCI Europe ESG Leaders Index, MSCI KLD 400, and MSCI North America ESG Leaders Index. These indices have been widely used in previous studies on sustainable finance, as noted by Rubbaniy et al. (2022) and Umar et al. (2021). In addition, we also included Natural gas, Crude oil, and Commodities to explore potential interdependencies with the aforementioned ESG indices. We also tested for interdependencies between the ESG indices and the U.S. Economic Policy Uncertainty Index, which serves as a proxy for global economic uncertainty. Furthermore, we used information from the S&P CBOE VIX volatility index to ensure the accuracy of our results.
To provide more clarity on the variables used, we provide their definitions below:
  • MSCI Emerging Markets ESG Leaders Index (MSCI ESG EM): This index is a capitalization-weighted index that includes specific large and mid-capitalization stocks from 24 emerging markets that meet ESG criteria compared to their industry peers.
  • MSCI ACWI ESG Leaders Index (MSCI ESG ACWI): This index is a capitalization-weighted index that includes specific large and mid-capitalization stocks from 23 developed and 24 emerging markets that meet ESG criteria compared to their industry peers.
  • MSCI Europe ESG Leaders Index (MSCI ESG Europe): This index is a capitalization-weighted index that includes specific large and mid-capitalization stocks from 15 developed markets that meet high ESG criteria compared to their industry peers.
  • MSCI KLD 400 Social Index (MSCI KLD): This index is a capitalization-weighted index that includes specific large and mid-capitalization stocks from 400 U.S. companies that have the highest ESG ratings in the stock market.
  • MSCI North America ESG Leaders Index (MSCI ESG NA): This index includes large and mid-cap stocks from the U.S. and Canada, reflecting an investment strategy with a strong ESG profile.
  • Chicago Board Options Exchange Volatility Index (VIX): This index represents the market’s expectations for upcoming price fluctuations of the S&P 500 Index.
  • U.S. Economic Policy Uncertainty Index (EPU): This index quantifies media coverage of policy-related economic uncertainty.
  • S&P GSCI Crude Oil Index (S&P Crude Oil): This index is a reliable benchmark for investment performance in the crude oil market.
  • Refinitiv/Core Commodity CRB(R) Index (Commodity Index): This pricing index serves as a benchmark for investment in commodities.
  • Natural Gas Futures (Natural Gas): This continuous contract includes front-month futures of Natural Gas futures listed on the New York Mercantile Exchange.
The data used in our study were obtained from Bloomberg and covers the period from 3 January 2020 to 23 August 2022. The starting point of our analysis coincides with the time, markets started to perceive the problem of the appearance of the pandemic and reacted (2 months before the first lockdown), while the end point of our research coincides with the period markets started to discount the impact of the war in Ukraine and its long-term duration (six months after the war’s start).
In line with previous research by Rubbaniy et al. (2022) and Umar et al. (2021), we utilized the wavelet coherence method to analyze the extent to which the returns of ESG stock indices move in conjunction with the returns of Natural gas, Crude oil, Commodities, Economic policy uncertainty, and VIX. In the methodology section, we provide a thorough analysis of the wavelet coherence approach employed in our study. Both the opening and closing date of our sample were chosen based on two milestones that coincided with the two historical events of our study (i.e., health crisis and energy crisis). More specifically, the start day of our sample is two months before the first lockdown took place, where the markets have already started to indicate signs of turmoil, while our sample extends six (6) months after the start of Russia–Ukraine war, where markets have shown the first obvious signs of overcoming the intense disrupted conditions and coming back to a new state of normal conditions, in which investors have discounted the new era’s state.

3.2. Methodology

We utilized the continuous wavelet transformations (CWTs) developed by Torrence and Compo (1998) and Rubbaniy et al. (2022) to analyze the time series of x(t) and y(t) using Equation (1),
W x , y ( t , f ) = W x ( t , f ) W y * ( t , f )
where W x ( t , f ) and W y   ( t , f ) represent the CWTs of x(t) and y(t), respectively. The variables “t” and “f” denote time and scale, respectively, and the complex conjugation is declared by “∗”. The cross-wavelet power spectrum, denoted by | W x   ( t , f ) | , highlights the areas in the time–frequency domain where the two time-series have significant mutual power, revealing the restricted covariance between the two series across all metrics.
To detect synchronous shifts in the co-movement between the two time-series, we used Torrence and Compo’s (1998) wavelet coherence approach. This approach identifies locations in the time-frequency area where there is a significant and synchronous shift in the co-movement of two time series, despite the absence of significant mutual wavelet power. The squared wavelet coherence coefficient, R 2 ( t , f ) , is calculated according to Torrence and Webster (1999), as shown in Equation (2)
R 2 ( t , f ) =   |   S ( s 1 W x , y ( u , s ) )   | 2   S ( s 1 | W x ( u , s ) | 2 )   S ( s 1 | W y ( u , s ) | 2 )
The time–frequency smoothing operator is represented by “s”, and the range of the squared wavelet coefficient is between 0 and 1. Values closer to 1 indicate a stronger relationship between the two series, whereas values closer to 0 indicate a weaker relationship.
However, the wavelet squared coherence has a limitation in that it can only accept positive values, making it challenging to distinguish time series movements and directions. To overcome this problem, we utilized the “phase difference” (Grinsted et al. 2004), as represented by the next equation:
φ x , y ( t , f ) = tan 1 ( lm { S ( s 1 W xy ( u , s ) ) } Re { S ( s 1 W xy ( u , s ) ) } )
This method uses the smoothed CWT’s real and imaginary elements, denoted by “Re” and “Im”, respectively, to calculate the phase difference between the two time-series.
The continuous wavelet transformation is used for the computation of the cross-wavelet power. Moreover, the cross-wavelet power spectrum stresses the locations in the time–frequency domain that have considerable mutual power, thus revealing the restricted covariance between the two-time series across all metrics.
So far, wavelet analysis is a useful tool for analyzing time series with many different timescales or changes in variance and imprints all interdependency relationships between the time series examined and their different directions, shifts, and robustness of the correlation across different time and frequencies.
The cross-wavelet coherence method provides a graphical presentation with several important elements, including black arrows pointing in eight directions (←, →, ↑, ↓, ↘, ↗, ↙, ↖), warm and cool colors, black contours, two axes, and a cone. The → arrow corresponds to a positive and in-phase correlation, while the ← arrow implies a negative and out-of-phase correlation. The (↗, ↙) indicate the leading impact of the first series, while the (↖, ↘) arrows imply the lagging role of the first one. The sections in the plots that have coherence significance at a level of 5% are represented by the black contours, and the cone of effect is shown by the bell-shaped line in the wavelet coherence plots.
We conducted a unique study that diverges significantly from other studies that employ similar methodologies. Recent research has mainly concentrated on investigating the correlation between specific ESG indices and indices directly associated with panic stemming exclusively from the COVID-19 pandemic and its cases and fatalities (e.g., Rubbaniy et al. 2022; Umar and Gubareva 2021; Umar et al. 2021; Karamti and Belhassine 2022). In contrast, our study investigates the entire period during which the global economy was impacted, encompassing the outbreak of the COVID-19 pandemic, the onset of the war in Ukraine, and the energy crisis. Moreover, our study examines indices that are more closely linked to essential energy products, commodities, economic uncertainty, and market variability, rather than focusing solely on the panic triggered by the COVID-19 pandemic.

4. Empirical Results

4.1. Descriptive Statistics

Table 1 presents the descriptive statistics of our data. The average values of the EPU, Natural Gas, and VIX suggest a moderate level of anxiety and equity market volatility. On the other hand, the ESG indices exhibit high average values, indicating the presence of high volatility. This result is reasonable since our study covers a highly volatile period, marked by the COVID-19 pandemic and the energy crisis. Moreover, the descriptive statistics reveal that all economic uncertainty and commodities indices are positively skewed, while ESG Indices (MSCI ESG ACWI, MSCI ESG EM, MSCI ESG Europe, MSCI KLD, and MSCI ESG NA) are negatively skewed, indicating negative asymmetry. All variables are also leptokurtic, characterized by high peaks and values concentrated around the mean. The Jarque–Bera values confirm the non-normal distribution of all indices tested.

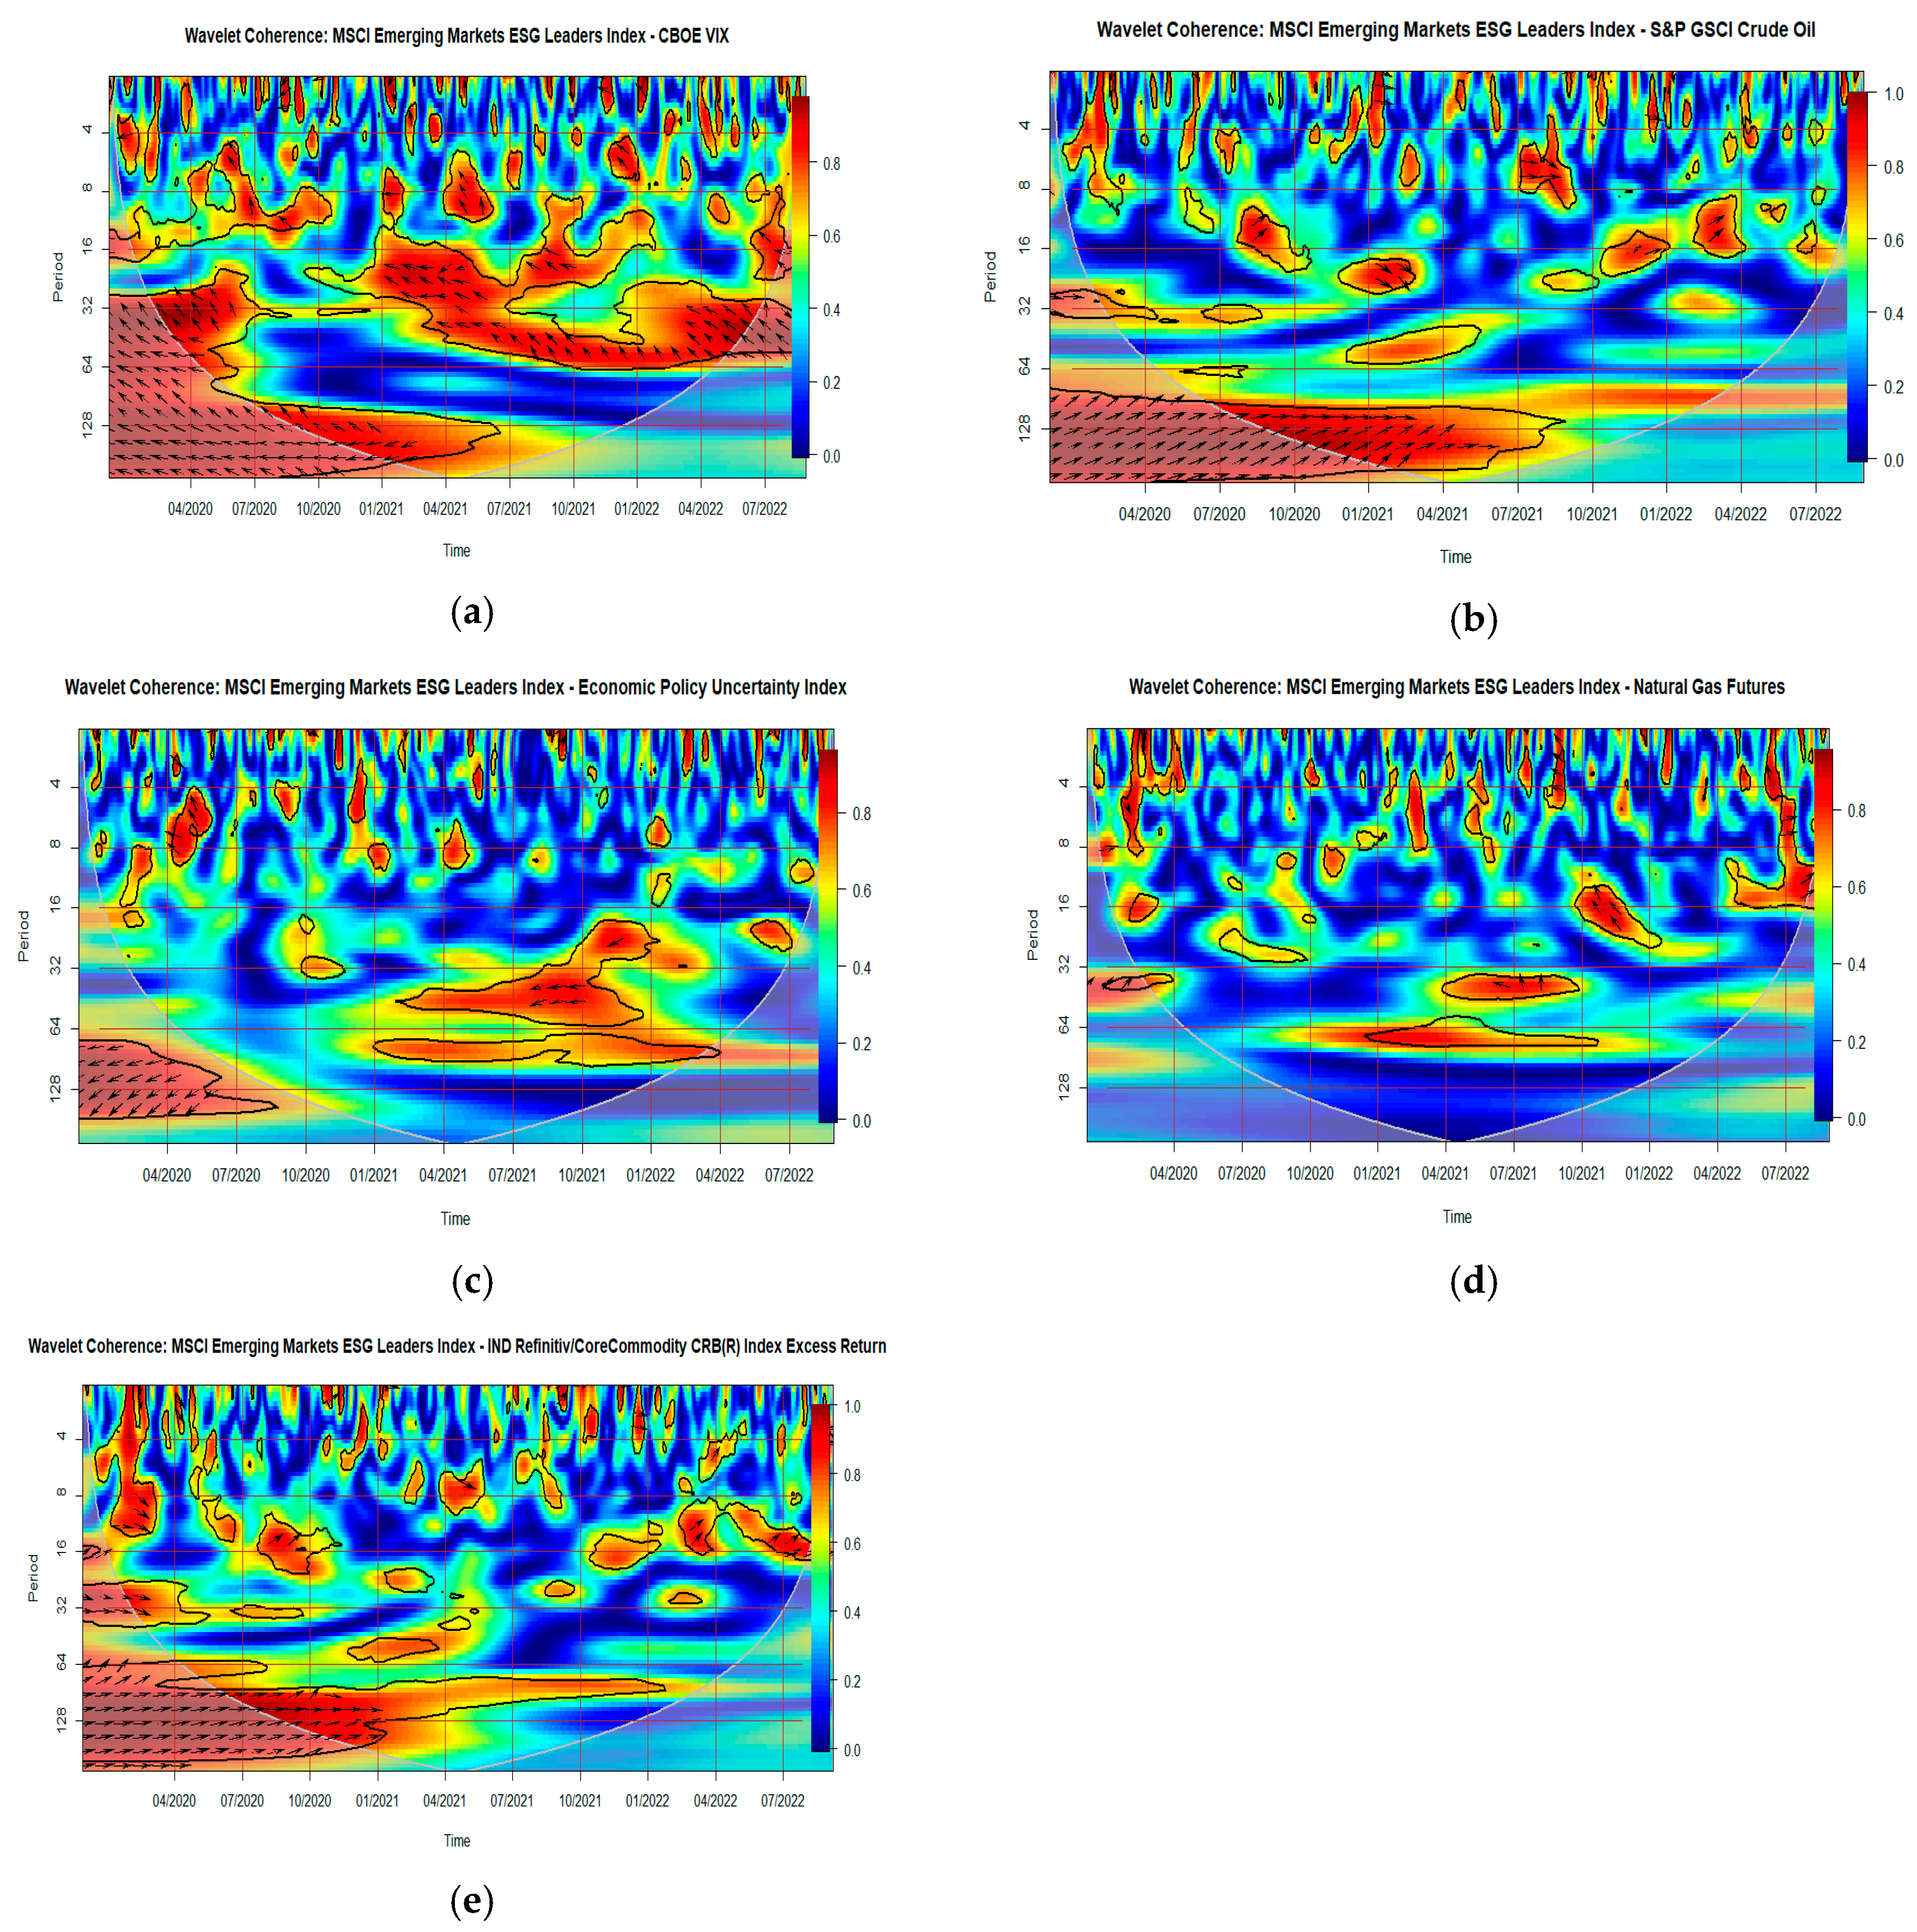
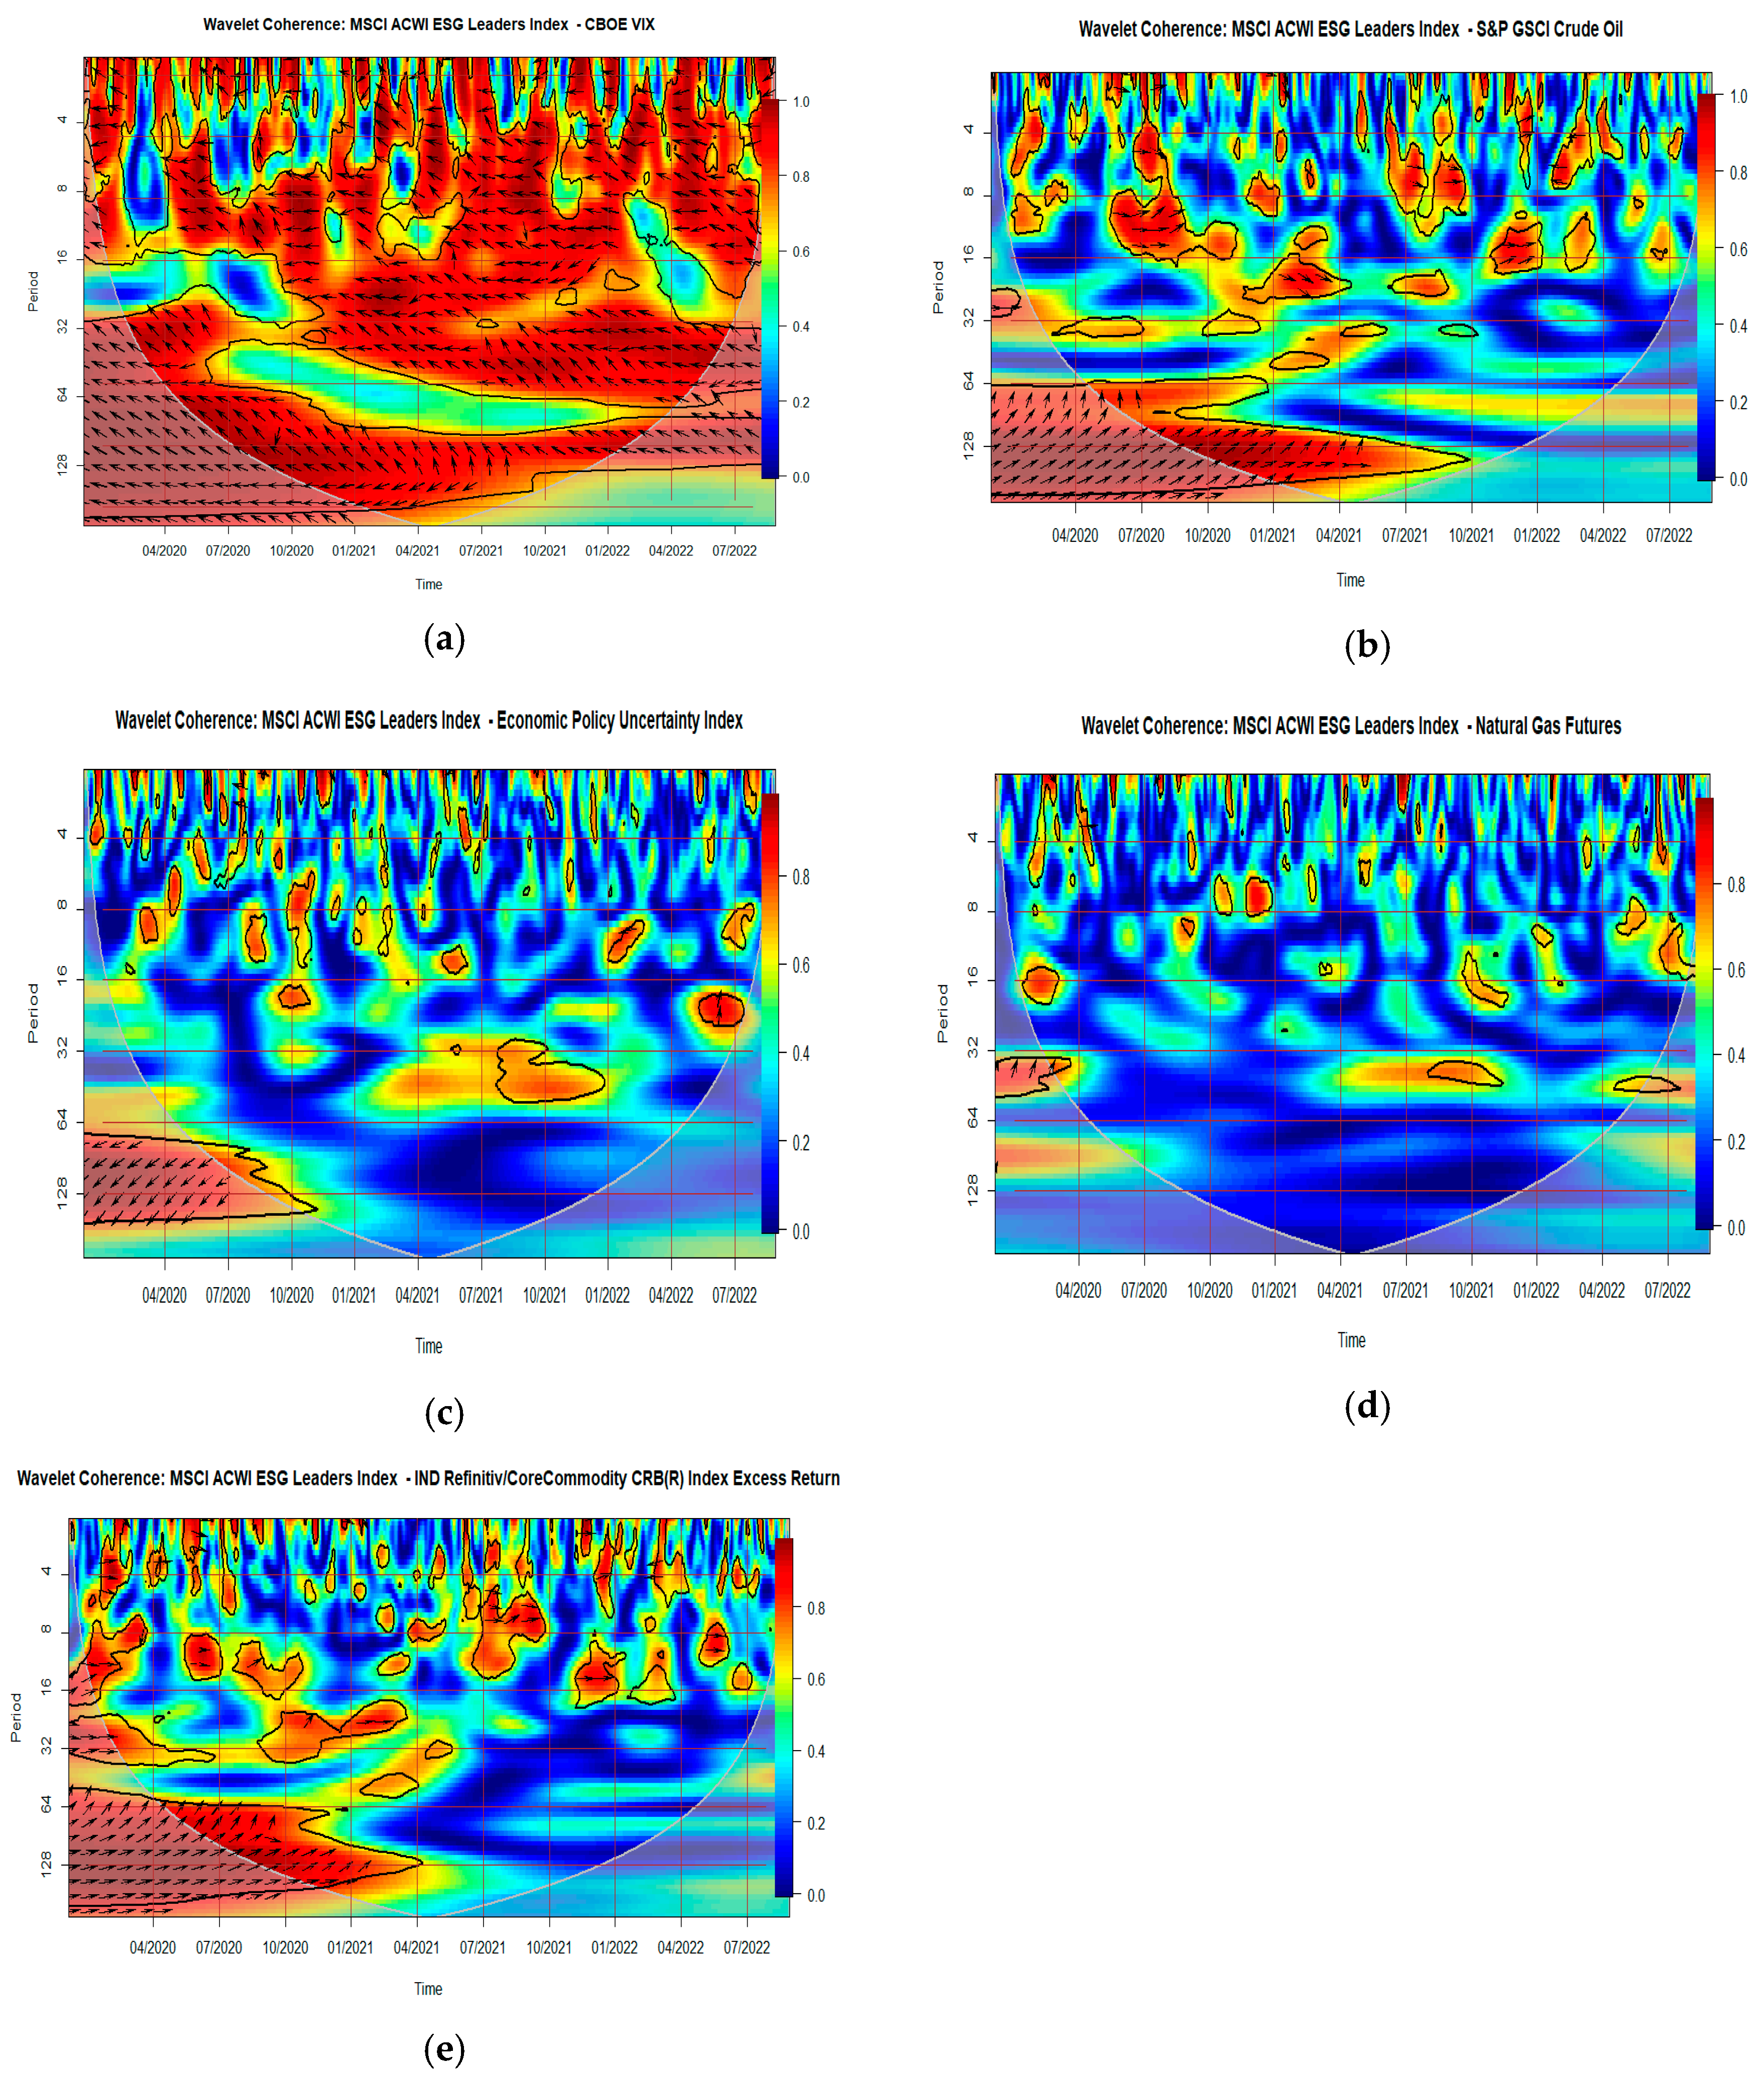
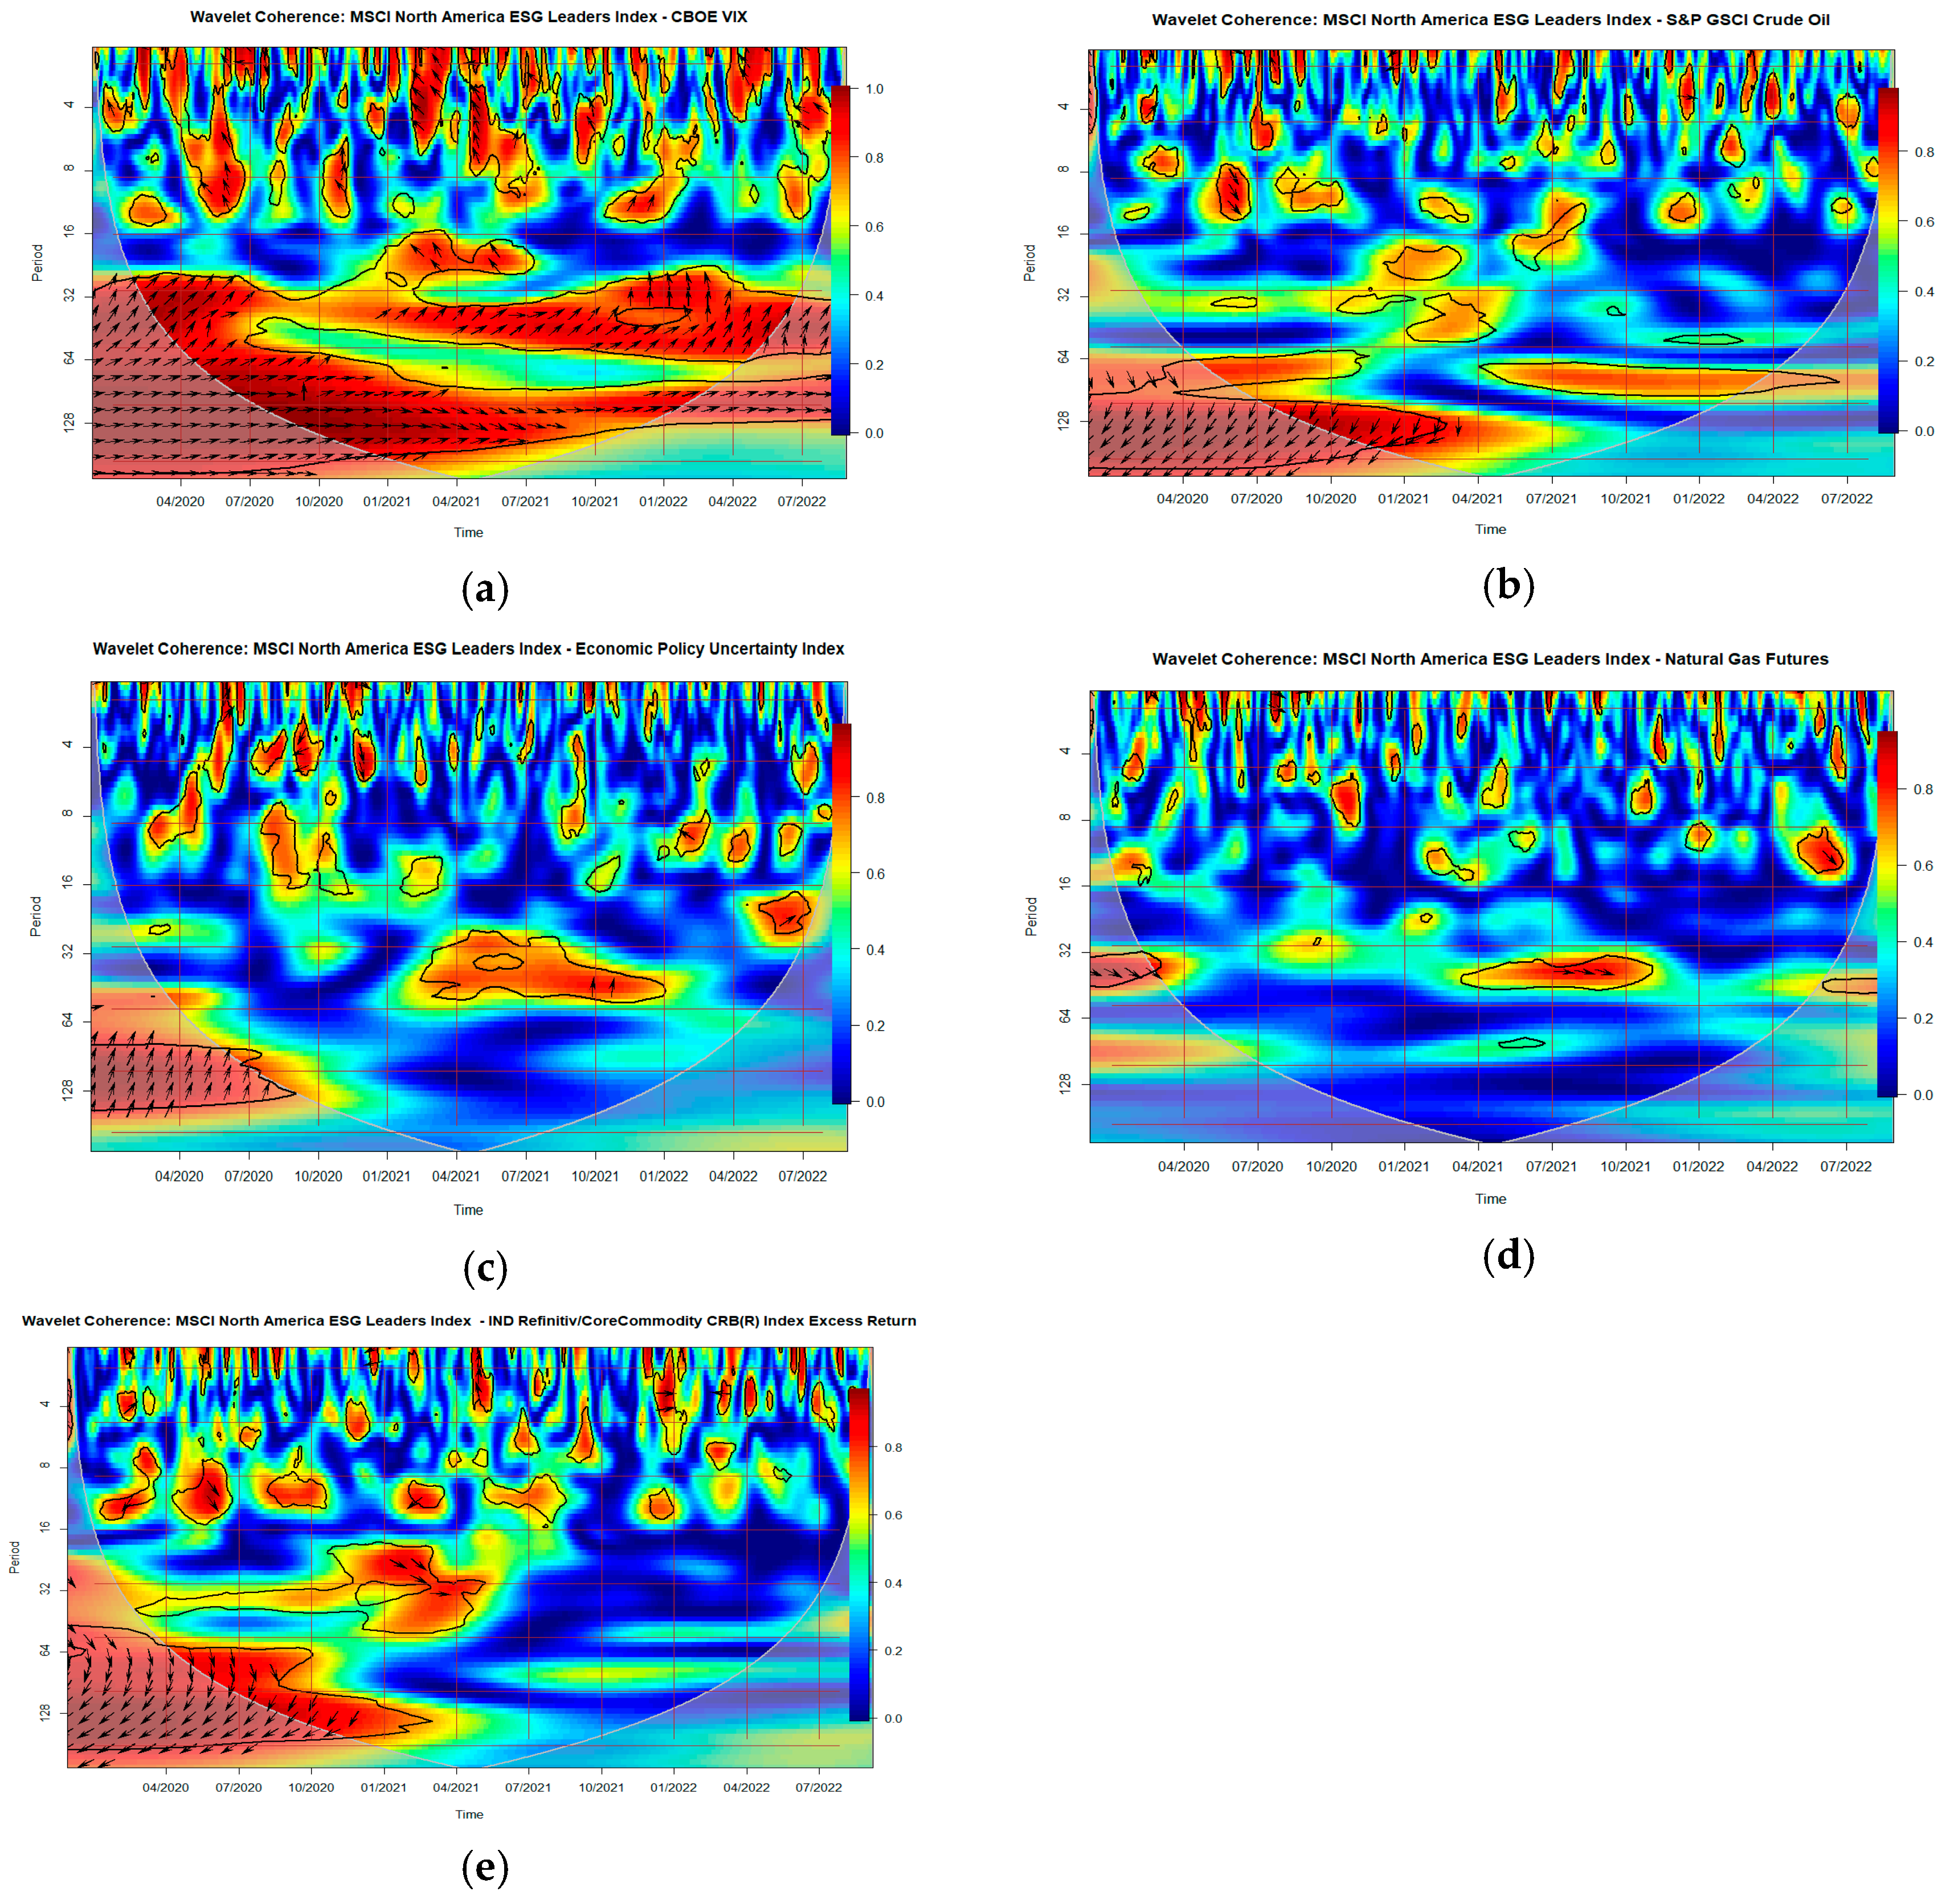
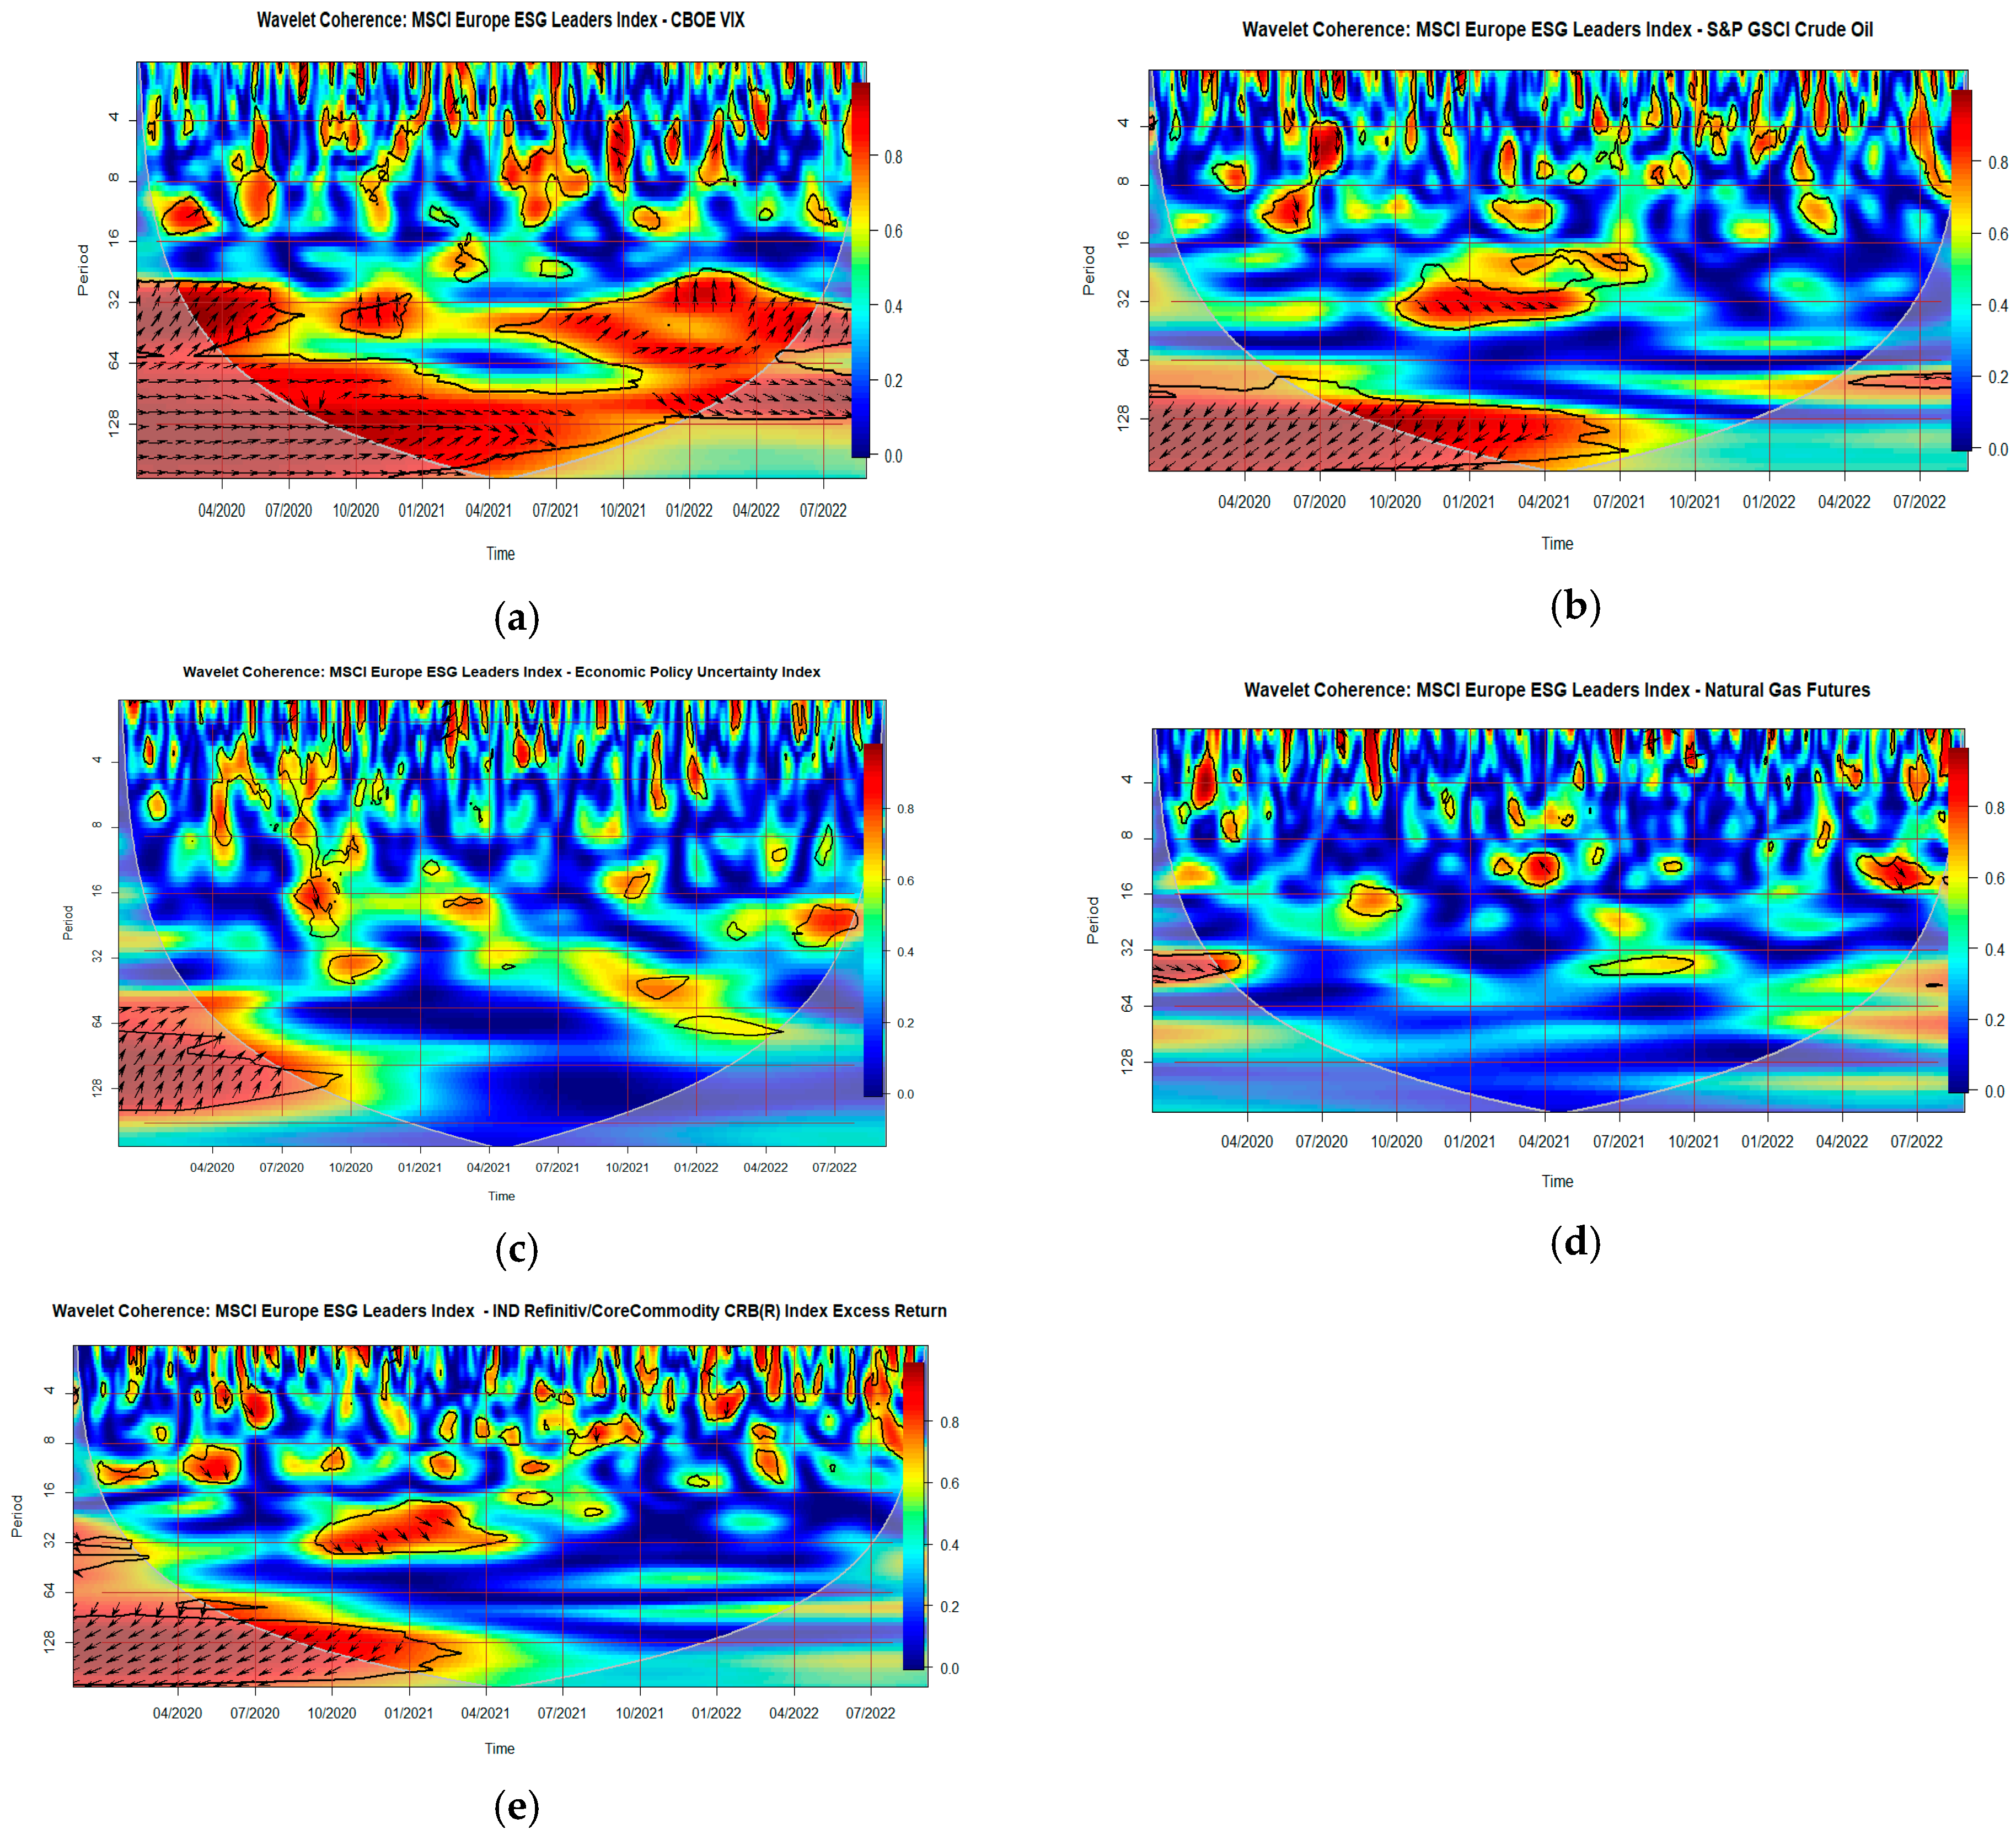
4.2. Empirical Results

We investigated interdependencies between specific MSCI ESG indices worldwide and some of the most important indices affecting the daily routines of investors and citizens across the planet using a wavelet coherence approach. Specifically, we focused on finding any dependency relationships between the MSCI Emerging Markets ESG Leaders Index (Figure 1), MSCI ACWI ESG Leaders Index (Figure 2), MSCI North America ESG Leaders Index (Figure 3), MSCI Europe ESG Leaders Index (Figure 4), and MSCI KLD 400 Social Index (Figure 5) with VIX, S&P Crude Oil, EPU, Natural Gas, and Commodity index.
In Figure 1, the left upward-directed arrow indicates a negative and out-of-phase correlation between the emerging markets ESG index and VIX, with the ESG Index leading effect during the entire period under examination. This interrelation is stronger in medium and long-term intervals since the outbreak of coronavirus (32–128 days) and medium-term intervals (16–64 days) after the beginning of the vaccination process, including the war in Ukraine (Figure 1a).
For low frequencies (around 128 days), there is a strong positive and in-phase correlation between the emerging markets’ ESG index and crude oil (Figure 1b), with the ESG index leading, during both the first and second wave of the coronavirus outbreak. On the other hand, the EPU index leads to an antiphase negative dependency with the ESG emerging markets index in the medium-term (32–64 days) after the end of the second quarantine period (Figure 1c).
Regarding natural gas and ESG emerging markets, there is a negative short- to medium-term (16–32 days) dependency during the period just before the beginning of the war in Ukraine, with natural gas lagging (Figure 1d). Furthermore, we can observe a clear and robust co-movement between the ESG emerging index and the commodities index, enriched with in-phase positive features in the long run from the end of the second quarantine period until the beginning of the vaccination period (Figure 1e).
Figure 2 reveals the degree of co-movements between the world ESG index and individual international social, economic, and trade indicators. The analysis demonstrates that this coupling differs across time and frequency domains. Notably, the MSCI ESG ACWI and VIX exhibit a robust negative anti-phase correlation for all periods and frequencies examined, with the ESG index leading to this relationship dependency (Figure 2a). This dynamic relationship has remained valid from the COVID-19 outbreak through the war in Ukraine and the energy crisis.
Additionally, the analysis shows a positive in-phase correlation between the ESG index and crude oil index in certain long-term intervals, with the ESG index leading from the beginning of the examined period until the end of the second quarantine period. This relationship is also observable in the short- to medium-term period following the end of the first quarantine and during the beginning of the war (Figure 2b).
Furthermore, there is a strong positive in-phase dependency in low-frequency intervals (more than 64 days) between the ESG leaders’ index and commodities until the beginning of vaccination, with the ESG index leading (Figure 2e). There is also a short-term impact during the end of the second quarantine and the beginning of the war. In summary, the co-movements between the ESG index and various social, economic, and trade indicators are dynamic and vary across different time and frequency domains.
The wavelet coherence plot in Figure 3a shows a positive and in-phase correlation between the MSCI North America leaders ESG index and VIX, with medium- and long-run right-directed upward arrows indicating the leading effect of the ESG index throughout the entire period under consideration. Regarding the dependency relationship between the North America ESG index and crude oil, there is a negative correlation observed in the long run until the period preceding the end of the second quarantine, with the ESG index lagging (Figure 3b).
In the medium to low frequencies (32–64 days), the ESG index has a positive effect on EPU just before the beginning of the war, while natural gas affects the North America ESG index at the same frequency from the summer of 2021 until the period of war preparation (Figure 3c). Furthermore, in low frequencies (more than 64 days), the left-directed downward arrows indicate a negative and out-of-phase correlation between the North America ESG index and commodities, from summer 2020 and the beginning of the vaccination program, with the ESG index lagging. However, during the second quarantine period, commodities affect the ESG index positively, indicating a reversal of this trend in the medium term.
Figure 4 presents the wavelet coherence measure and phase-difference results between the MSCI Europe ESG Leaders index and the other indices examined. Throughout the period analyzed, there is a predominant positive robustness of the ESG index on VIX, particularly in the medium term, including the period of war in Ukraine and the energy crisis (Figure 4a).
In the medium term, a positive in-phase correlation is observed between the Europe ESG index and crude oil, with the ESG index lagging from the outbreak of the second pandemic wave until the end of the second quarantine period. However, in very low frequencies (more than 128 days), a negative anti-phase correlation is observed until the end of the second quarantine period, with crude oil leading (Figure 4b).
Furthermore, in high- to medium-frequency bands after the outbreak of the energy crisis, a positive impact of natural gas on the Europe ESG index is observed (Figure 4d). Additionally, in the short and medium term, there is a positive in-phase dependency relationship leading the commodities index, right after the end of the first quarantine and from the beginning of the second one until its end. However, in low-frequency intervals (around 128 days), commodities lead in an anti-phase situation to the Europe ESG index until the beginning of the vaccination period (Figure 4e).
In Figure 5a, we observe varying levels of coherence between the MSCI KLD 400 Social index and VIX, ranging from low to medium to high coherence over the entire time scale. The relationship indicates a robust negative out-of-phase correlation, with ESG leading.
In the long run, the right up-directed arrow from the end of the first quarantine until the end of the second quarantine, and in the short term from the end of the first quarantine until the beginning of the second one, indicate a positive in-phase correlation between the Social ESG index and crude oil, with the ESG index being led. However, after the outbreak of the war in Ukraine, a negative out-of-phase correlation with crude oil leading is observed in high frequencies (4–8 days) (Figure 5b).
Regarding the dependency relationship between the Social ESG index and commodities, we observe a robust positive in-phase relationship in low-frequency bands (64–128 days) until the beginning of the vaccination program and in high and medium frequencies, with the ESG index leading (Figure 5e). Notably, this dependency relationship mainly exists during the quarantine periods, after the second quarantine period, and during the energy crisis period.
Our study provides evidence of a strong and robust correlation between VIX and all ESG indices examined, with varying levels of coherence over the entire time scale. The negative correlation observed between VIX and MSCI Emerging Markets ESG Leaders Index, MSCI ACWI ESG Leaders Index, and MSCI KLD 400 Social Index suggests that these indices may not be reliable safe haven investment options during times of crisis, as they are highly susceptible to market volatility. On the other hand, the positive correlation observed between VIX and MSCI North America ESG Leaders Index and MSCI Europe ESG Leaders Index in the medium and long term indicates that these indices may be considered as relatively safer investment options during periods of intense crises such as the COVID-19 pandemic and the energy crisis. So far, investors, while seeking their comfort investment zone and in order to feel safer with their investments, prefer to drive their capital resources to the aforementioned indices both in the medium and long-run during the period of crises examined. This occurs as the investors consider that such investments placements ward off their fear and may increase their investments returns.
Our findings highlight the significance of seeking alternative investments to hedge against market volatility during times of crisis. Additionally, the high coherence between VIX and ESG indices suggests a robust dependency relationship, further emphasizing the need to consider the impact of global events on financial markets. Our results are in line with previous studies that used similar wavelet methods, such as Rubbaniy et al. (2022), Karamti and Belhassine (2022), Umar et al. (2021), and Umar and Gubareva (2021), although our study provides insights beyond the pandemic period and includes a broader range of ESG indices.

5. Conclusions and Further Implications

This study contributes to rationally constructing a portfolio of alternative investments, especially in times of crisis, aiming at mitigating investors’ risk. Safe haven investments, by definition, are preferable as they may offer more investment security in times of crisis. Therefore, since ESG investments could be a safe haven in times of crisis, then there will be a relative push to create new ESG investments and develop the existing ones. This, in the long run, will assist in the improvement of economic sustainability worldwide.
Our study aimed to examine the interdependencies between specific MSCI ESG indices worldwide and a range of indices related to social, economic, and energy activities. Our research covers the period from January 2020, marking the appearance of the first coronavirus cases in China, to August 2022, when the energy crisis reached its peak after the beginning of the war in Ukraine in February 2022. To capture the co-movements between time series in both time and frequency domains, we employed a wavelet coherence approach.
Our empirical analysis reveals diversifications in coherence patterns across geographical areas, indicators, periods, robustness, and frequency. Notably, we observed robust coherence between most MSCI indices and the examined variables, especially between MSCI ESG indices and VIX for the entire study period and between ESG indices, crude oil, and commodities during the pandemic.
However, due to the fear and uncertainty caused by the COVID-19 pandemic and energy crisis, investors have considered sustainable investments as safe havens, leading to increased funding in the MSCI North America ESG Leaders Index and MSCI Europe ESG Leaders Index, mainly in the medium and long run. These findings could be a support of sustainable development and indicate that investors prefer and lead funding towards investments that meet ESG criteria during periods of extreme conditions.
Our results suggest a strategy of holding diversifiable investment portfolios, with market segmentation based on geographical area, risk, and type of investment, to mitigate risk. The practical implications of our findings extend to policymakers, portfolio managers, and investors, who can use our results to plan and prepare a strategy to mitigate their risk exposure during hard times. Our outcomes can also contribute to the detection and implementation of appropriate cross-border hedging strategies, particularly in periods of global crises, pandemics, or energy crises. Alternatively, this study provides valuable insights for investors and policymakers, suggesting the importance of considering the impact of global events on financial markets and seeking alternative investment options to mitigate market volatility during times of crisis.
Future research could explore alternate methodological approaches and combine different ESG indices (i.e., potential interdependencies between ESG MSCI stock indices and traditional stock market indices and other non-ESG indices) and investment products to enhance our understanding of interdependencies between various variables.

Author Contributions

Conceptualization, C.B. and I.K.; Data curation, C.B. and S.X.; Formal analysis, C.B. and I.K.; Investigation, C.B. and I.K.; Methodology, I.K. and S.X.; Project administration, I.K. and A.G.C.; Software, S.X.; Supervision, I.K. and C.B.; Visualization, C.B. and I.K.; Writing—original draft, C.B. and I.K.; Writing—review & editing, C.B., I.K., A.G.C. and S.X. All authors have read and agreed to the published version of the manuscript.

Funding

This research received no external funding.

Informed Consent Statement

Not applicable.

Data Availability Statement

The data that support the findings of this study are available from the corresponding author upon reasonable request.

Conflicts of Interest

The authors declare no conflict of interest.

References

  1. Aevoae, George Marian, Alin Marius Andrieș, Steven Ongena, and Nicu Sprincean. 2023. ESG and systemic risk. Applied Economics 55: 3085–109. [Google Scholar] [CrossRef]
  2. Albuquerque, Rui, Yrjo Koskinen, Shuai Yang, and Chendi Zhang. 2020. Resiliency of Environmental and Social Stocks: An Analysis of the Exogenous COVID-19 Market Crash. The Review of Corporate Finance Studies 9: 593–621. [Google Scholar] [CrossRef]
  3. Alessandrini, Fabio, and Eric Jondeau. 2020. ESG investing: From sin stocks to smart beta. The Journal of Portfolio Management 46: 75–94. [Google Scholar] [CrossRef]
  4. Alinaitwe, Grace, and Olvar Bergland. 2024. Assessing the Relationship between Fuel and Charcoal Prices in Uganda. Economies 12: 46. [Google Scholar] [CrossRef]
  5. Alshehhi, Ali, Haitham Nobanee, and Nilesh Khare. 2018. The Impact of Sustainability Practices on Corporate Financial Performance: Literature Trends and Future Research Potential. Sustainability 10: 494. [Google Scholar] [CrossRef]
  6. Ashraf, Dawood, Muhammad Suhail Rizwan, and Ghufran Ahmad. 2020. Islamic equity investments and the COVID-19 pandemic. Pacific-Basin Finance Journal 73: 101765. [Google Scholar] [CrossRef]
  7. Auer, Benjamin R. 2016. Do Socially Responsible Investment Policies Add or Destroy European Stock Portfolio Value? Journal of Business Ethics 135: 381–97. [Google Scholar] [CrossRef]
  8. Barth, Florian, Benjamin Hübel, and Hendrik Scholz. 2022. ESG and corporate credit spreads. The Journal of Risk Finance 23: 169–90. [Google Scholar] [CrossRef]
  9. Basdekis, Charalampos. 2023. The Impact of ESG Investments on Capital Markets, Economies and Firms’ Performance. New York: Crimson Publishers, vol. 14. [Google Scholar] [CrossRef]
  10. Basdekis, Charalampos, Apostolos Christopoulos, Ioannis Katsampoxakis, and Vasileios Nastas. 2022. The Impact of the Ukrainian War on Stock and Energy Markets: A Wavelet Coherence Analysis. Energies 15: 8174. [Google Scholar] [CrossRef]
  11. Basdekis, Charalampos, Ioannis Katsampoxakis, and Konstantinos Anathreptakis. 2023. Women’s Participation in Firms’ Management and Their Impact on Financial Performance: Pre-COVID-19 and COVID-19 Period Evidence. Sustainability 15: 8686. [Google Scholar] [CrossRef]
  12. Batista, Alamo Alexandre da Silva, and Antonio Carlos de Francisco. 2018. Organizational Sustainability Practices: A Study of the Firms Listed by the Corporate Sustainability Index. Sustainability 10: 226. [Google Scholar] [CrossRef]
  13. Bauer, Rob, and Paul Smeets. 2015. Social identification and investment decisions. Journal of Economic Behavior & Organization 117: 121–34. [Google Scholar] [CrossRef]
  14. Baur, Dirk G., and Lai T. Hoang. 2021. A crypto safe haven against Bitcoin. Finance Research Letters 38: 101431. [Google Scholar] [CrossRef]
  15. Bloomberg Intelligence: “ESG May Surpass $41 Trillion Assets in 2022, But Not Without Challenges, Finds Bloomberg Intelligence”. 2023. Available online: https://www.bloomberg.com/company/press/esg-may-surpass-41-trillion-assets-in-2022-but-not-without-challenges-finds-bloomberg-intelligence/ (accessed on 5 September 2023).
  16. Bouri, Elie, Syed Jawad Hussain Shahzad, David Roubaud, Ladislav Kristoufek, and Brian Lucey. 2020. Bitcoin, gold, and commodities as safe havens for stocks: New insight through wavelet analysis. The Quarterly Review of Economics and Finance 77: 156–64. [Google Scholar] [CrossRef]
  17. Broadstock, David C., Kalok Chan, Louis T. W. Cheng, and Xiaowei Wang. 2020. The role of ESG performance during times of financial crisis: Evidence from COVID-19 in China. Finance Research Letters 38: 101716. [Google Scholar] [CrossRef] [PubMed]
  18. Brzeszczyński, Janusz, and Graham McIntosh. 2014. Performance of Portfolios Composed of British SRI Stocks. Journal of Business Ethics 120: 335–62. [Google Scholar] [CrossRef]
  19. Cagli, Efe C. Caglar, Pinar Evrim Mandaci, and Dilvin Taşkın. 2023. Environmental, social, and governance (ESG) investing and commodities: Dynamic connectedness and risk management strategies. Sustainability Accounting, Management and Policy Journal 14: 1052–74. [Google Scholar] [CrossRef]
  20. Capelle-Blancard, Gunther, and Aurélien Petit. 2019. Every Little Helps? ESG News and Stock Market Reaction. Journal of Business Ethics 157: 543–65. [Google Scholar] [CrossRef]
  21. Charlo, Maria J., Ismael Moya, and Ana M. Muñoz. 2015. Sustainable Development and Corporate Financial Performance: A Study Based on the FTSE4Good IBEX Index. Business Strategy and the Environment 24: 277–88. [Google Scholar] [CrossRef]
  22. Chen, Hong-Yi, and Sharon S. Yang. 2020. Do Investors exaggerate corporate ESG information? Evidence of the ESG momentum effect in the Taiwanese market. Pacific-Basin Finance Journal 63: 101407. [Google Scholar] [CrossRef]
  23. Christopoulos, Apostolos G., Petros Kalantonis, Ioannis Katsampoxakis, and Konstantinos Vergos. 2021. COVID-19 and the Energy Price Volatility. Energies 14: 6496. [Google Scholar] [CrossRef]
  24. Cunha, Felipe Arias Fogliano de Souza, Erick Meira de Oliveira, Renato J. Orsato, Marcelo Cabus Klotzle, Fernando Luiz Cyrino Oliveira, and Rodrigo Goyannes Gusmão Caiado. 2020. Can sustainable investments outperform traditional benchmarks? Evidence from global stock markets. Business Strategy and the Environment 29: 682–97. [Google Scholar] [CrossRef]
  25. De la Torre, Oscar, Evaristo Galeana, and Dora Aguilasocho. 2016. The use of the sustainable investment against the broad market one. A first test in the Mexican stock market. European Research on Management and Business Economics 22: 117–23. [Google Scholar] [CrossRef]
  26. Dhaliwal, Dan S., Oliver Zhen Li, Albert Tsang, and Yong George Yang. 2011. Voluntary Nonfinancial Disclosure and the Cost of Equity Capital: The Initiation of Corporate Social Responsibility Reporting. The Accounting Review 86: 59–100. [Google Scholar] [CrossRef]
  27. Díaz, Violeta, Denada Ibrushi, and Jialin Zhao. 2021. Reconsidering systematic factors during the COVID-19 pandemic—The rising importance of ESG. Finance Research Letters 38: 101870. [Google Scholar] [CrossRef]
  28. Engelhardt, Nils, Jens Ekkenga, and Peter Posch. 2021. ESG Ratings and Stock Performance during the COVID-19 Crisis. Sustainability 13: 7133. [Google Scholar] [CrossRef]
  29. Fassas, Athanasios P. 2020. Risk aversion connectedness in developed and emerging equity markets before and after the COVID-19 pandemic. Heliyon 6: e05715. [Google Scholar] [CrossRef]
  30. Fatemi, Ali, Martin Glaum, and Stefanie Kaiser. 2018. ESG performance and firm value: The moderating role of disclosure. Global Finance Journal 38: 45–64. [Google Scholar] [CrossRef]
  31. Ferriani, Fabrizio, and Filippo Natoli. 2020. ESG risks in times of COVID-19. Applied Economics Letters 28: 1537–41. [Google Scholar] [CrossRef]
  32. Filbeck, Greg, Eric Robbins, and Xin Zhao. 2022. Social capital during the coronavirus pandemic: The value of corporate benevolence. Applied Economics 54: 1460–72. [Google Scholar] [CrossRef]
  33. Gao, Yang, Yangyang Li, and Yaojun Wang. 2021. Risk spillover and network connectedness analysis of China’s green bond and financial markets: Evidence from financial events of 2015–20. The North American Journal of Economics and Finance 57: 101386. [Google Scholar] [CrossRef]
  34. Gao, Yang, Yangyang Li, Chengjie Zhao, and Yaojun Wang. 2022. Risk spillover analysis across worldwide ESG stock markets: New evidence from the frequency-domain. The North American Journal of Economics and Finance 59: 101619. [Google Scholar] [CrossRef]
  35. Gehricke, Sebastian A., Xinfeng Ruan, and Jin E. Zhang. 2023. Doing well while doing good: ESG ratings and corporate bond returns. Applied Economics 56: 1916–34. [Google Scholar] [CrossRef]
  36. Giglio, Stefano, Matteo Maggiori, Johannes Stroebel, and Stephen Utkus. 2021. Five Facts about Beliefs and Portfolios. American Economic Review 111: 1481–522. [Google Scholar] [CrossRef]
  37. Global Sustainability Investment Alliance. 2018. Available online: https://www.gsi-alliance.org/wp-content/uploads/2019/03/GSIR_Review2018.3.28.pdf (accessed on 24 July 2023).
  38. Gong, Xiao-Li, Xi-Hua Liu, Xiong Xiong, and Wei Zhang. 2019. Financial systemic risk measurement based on causal network connectedness analysis. International Review of Economics & Finance 64: 290–307. [Google Scholar] [CrossRef]
  39. Goodell, John W., and Stephane Goutte. 2020. Co-movement of COVID-19 and Bitcoin: Evidence from wavelet coherence analysis. Finance Research Letters 38: 101625. [Google Scholar] [CrossRef] [PubMed]
  40. Grinsted, Aslak, John C. Moore, and Svetlana Jevrejeva. 2004. Application of the cross wavelet transform and wavelet coherence to geophysical time series. Nonlinear Processes in Geophysics 11: 561–66. [Google Scholar] [CrossRef]
  41. Gubareva, Mariya, and Maria Rosa Borges. 2016. Typology for Flight-toquality Episodes and Downside Risk Measurement. Applied Economics 48: 835–53. [Google Scholar] [CrossRef]
  42. Hassan, M. Kabir, Hadrian Geri Djajadikerta, Tonmoy Choudhury, and Muhammad Kamran. 2021. Safe havens in Islamic financial markets: COVID-19 versus GFC. Global Finance Journal 54: 100643. [Google Scholar] [CrossRef]
  43. Ioannou, Ioannis, and George Serafeim. 2015. The impact of corporate social responsibility on investment recommendations: Analysts’ perceptions and shifting institutional logics. Strategic Management Journal 36: 1053–81. [Google Scholar] [CrossRef]
  44. Jain, Mansi, Gagan Deep Sharma, and Mrinalini Srivastava. 2019. Can Sustainable Investment Yield Better Financial Returns: A Comparative Study of ESG Indices and MSCI Indices. Risks 7: 15. [Google Scholar] [CrossRef]
  45. Ji, Qiang, Dayong Zhang, and Yuqian Zhao. 2020. Searching for safe-haven assets during the COVID-19 pandemic. International Review of Financial Analysis 71: 101526. [Google Scholar] [CrossRef]
  46. Karamti, Chiraz, and Olfa Belhassine. 2022. COVID-19 pandemic waves and global financial markets: Evidence from wavelet coherence analysis. Finance Research Letters 45: 102136. [Google Scholar] [CrossRef] [PubMed]
  47. Katsampoxakis, Ioannis. 2021. ECB’s unconventional monetary policy and spillover effects between sovereign and bank credit risk. EuroMed Journal of Business 17: 218–45. [Google Scholar] [CrossRef]
  48. Katsampoxakis, Ioannis, Apostolos Christopoulos, Petros Kalantonis, and Vasileios Nastas. 2022. Crude Oil Price Shocks and European Stock Markets during the COVID-19 Period. Energies 15: 4090. [Google Scholar] [CrossRef]
  49. Kenourgios, Dimitris, and Dimitrios Dimitriou. 2015. Contagion of the Global Financial Crisis and the real economy: A regional analysis. Economic Modelling 44: 283–93. [Google Scholar] [CrossRef]
  50. Kenourgios, Dimitrios, Zaghum Umar, and Paraskevi Lemonidi. 2020. On the effect of credit rating announcements on sovereign bonds: International evidence. International Economics 163: 58–71. [Google Scholar] [CrossRef]
  51. Krüger, Philipp. 2015. Corporate goodness and shareholder wealth. Journal of Financial Economics 115: 304–29. [Google Scholar] [CrossRef]
  52. La Torre, Mario, Annarita Trotta, Helen Chiappini, and Alessandro Rizzello. 2019. Business Models for Sustainable Finance: The Case Study of Social Impact Bonds. Sustainability 11: 1887. [Google Scholar] [CrossRef]
  53. Lassala, Carlos, Andreea Apetrei, and Juan Sapena. 2017. Sustainability Matter and Financial Performance of Companies. Sustainability 9: 1498. [Google Scholar] [CrossRef]
  54. Leite, Paulo, and Maria Céu Cortez. 2015. Performance of European socially responsible funds during market crises: Evidence from France. International Review of Financial Analysis 40: 132–41. [Google Scholar] [CrossRef]
  55. Li, Yiwei, Mengfeng Gong, Xiu-Ye Zhang, and Lenny Koh. 2018. The impact of environmental, social, and governance disclosure on firm value: The role of CEO power. The British Accounting Review 50: 60–75. [Google Scholar] [CrossRef]
  56. Liket, Kellie, and Karen Maas. 2016. Strategic Philanthropy: Corporate Measurement of Philanthropic Impacts as a Requirement for a “Happy Marriage” of Business and Society. Business & Society 55: 889–921. [Google Scholar] [CrossRef]
  57. Lööf, Hans, Maziar Sahamkhadam, and Andreas Stephan. 2022. Is Corporate Social Responsibility investing a free lunch? The relationship between ESG, tail risk, and upside potential of stocks before and during the COVID-19 crisis. Finance Research Letters 46: 102499. [Google Scholar] [CrossRef] [PubMed]
  58. Mariana, Christy Dwita, Irwan Adi Ekaputra, and Zaäfri Ananto Husodo. 2021. Are Bitcoin and Ethereum safe-havens for stocks during the COVID-19 pandemic? Finance Research Letters 38: 101798. [Google Scholar] [CrossRef]
  59. Marti, Carmen Pilar, M. Rosa Rovira-Val, and Lisa G. J. Drescher. 2015. Are Firms that Contribute to Sustainable Development Better Financially? Corporate Social Responsibility and Environmental Management 22: 305–19. [Google Scholar] [CrossRef]
  60. Miralles-Quiros, Maria del Mar, Jose Luis Miralles-Quiros, and Irene Guia Arraiano. 2017. Sustainable Development, Sustainability Leadership and Firm Valuation: Differences across Europe. Business Strategy and the Environment 26: 1014–28. [Google Scholar] [CrossRef]
  61. Morea, Donato, Fabiomassimo Mango, Mavie Cardi, Cosimo Paccione, and Lucilla Bittucci. 2022. Circular Economy Impact Analysis on Stock Performances: An Empirical Comparison with the Euro Stoxx 50® ESG Index. Sustainability 14: 843. [Google Scholar] [CrossRef]
  62. Morning Star: “Can ESG Investments Outperform the Market?”. 2023. Available online: https://www.morningstar.com/views/blog/esg/esg-performance-morningstar-indexes (accessed on 10 August 2023).
  63. Naughton, James P., Clare Wang, and Ira Yeung. 2019. Investor Sentiment for Corporate Social Performance. The Accounting Review 94: 401–20. [Google Scholar] [CrossRef]
  64. Ortas, Eduardo, Isabel Gallego-Alvarez, and Igor Álvarez Etxeberria. 2015. Financial Factors Influencing the Quality of Corporate Social Responsibility and Environmental Management Disclosure: A Quantile Regression Approach. Corporate Social Responsibility and Environmental Management 22: 362–80. [Google Scholar] [CrossRef]
  65. Papathanasiou, Spyros, Dimitrios Vasiliou, Anastasios Magoutas, and Drosos Koutsokostas. 2021. Do hedge and merger arbitrage funds actually hedge? A time-varying volatility spillover approach. Finance Research Letters 44: 102088. [Google Scholar] [CrossRef]
  66. Rajnoha, Rastislav, Petra Lesníková, and Antonín Korauš. 2016. From Financial Measures to Strategic Performance Measurement System and Corporate Sustainability: Empirical Evidence from Slovakia. Economics & Sociology 9: 134–52. [Google Scholar] [CrossRef]
  67. Rajnoha, Rastislav, Petra Lesníková, and Vladimír Krajčík. 2017. Influence of business performance measurement systems and corporate sustainability concept to overal business performance: “save the planet and keep your performance”. E+M Ekonomie a Management 20: 111–28. [Google Scholar] [CrossRef]
  68. Rehman, Mobeen Ur, and Xuan Vinh Vo. 2020. Cryptocurrencies and precious metals: A closer look from diversification perspective. Resources Policy 66: 101652. [Google Scholar] [CrossRef]
  69. Riaz, Yasir, Choudhry Tanveer Shehzad, and Zaghum Umar. 2019. Pro-cyclical effect of sovereign rating changes on stock returns: A fact or factoid? Applied Economics 51: 1588–601. [Google Scholar] [CrossRef]
  70. Riedl, Arno, and Paul Smeets. 2017. Why Do Investors Hold Socially Responsible Mutual Funds? The Journal of Finance 72: 2505–50. [Google Scholar] [CrossRef]
  71. Rubbaniy, Ghulame, Ali Awais Khalid, and Aristeidis Samitas. 2021. Are Cryptos Safe-Haven Assets during COVID-19? Evidence from Wavelet Coherence Analysis. Emerging Markets Finance and Trade 57: 1741–56. [Google Scholar] [CrossRef]
  72. Rubbaniy, Ghulame, Ali Awais Khalid, Muhammad Faisal Rizwan, and Shoaib Ali. 2022. Are ESG stocks safe-haven during COVID-19? Studies in Economics and Finance 39: 239–55. [Google Scholar] [CrossRef]
  73. Samitas, Aristeidis, Spyros Papathanasiou, and Drosos Koutsokostas. 2021. The connectedness between Sukuk and conventional bond markets and the implications for investors. International Journal of Islamic and Middle Eastern Finance and Management 14: 928–49. [Google Scholar] [CrossRef]
  74. Shaik, Muneer, and Mohd Ziaur Rehman. 2023. The Dynamic Volatility Connectedness of Major Environmental, Social, and Governance (ESG) Stock Indices: Evidence Based on DCC-GARCH Model. Asia-Pacific Financial Markets 30: 231–46. [Google Scholar] [CrossRef]
  75. Singh, Amanjot. 2020. COVID-19 and safer investment bets. Finance Research Letters 36: 101729. [Google Scholar] [CrossRef] [PubMed]
  76. Thanh, Quang Phung. 2022. Economic effects of green bond market development in Asian economies. The Journal of Risk Finance 23: 480–97. [Google Scholar] [CrossRef]
  77. Torrence, Christopher, and Gilbert P. Compo. 1998. A practical guide to wavelet analysis. Bulletin of the American Meteorological Society 79: 61–78. [Google Scholar] [CrossRef]
  78. Torrence, Christopher, and Peter J. Webster. 1999. Interdecadal changes in the ENSO–monsoon system. Journal of Climate 12: 2679–90. [Google Scholar] [CrossRef]
  79. Umar, Zaghum, and Mariya Gubareva. 2021. The relationship between the COVID-19 media coverage and the Environmental, Social and Governance leaders equity volatility: A time-frequency wavelet analysis. Applied Economics 53: 3193–206. [Google Scholar] [CrossRef]
  80. Umar, Zaghum, and Tahir Suleman. 2017. Asymmetric Return and Volatility Transmission in Conventional and Islamic Equities. Risks 5: 22. [Google Scholar] [CrossRef]
  81. Umar, Zaghum, Dimitris Kenourgios, and Sypros Papathanasiou. 2020. The static and dynamic connectedness of environmental, social, and governance investments: International evidence. Economic Modelling 93: 112–24. [Google Scholar] [CrossRef] [PubMed]
  82. Umar, Zaghum, Mariya Gubareva, Dang Khoa Tran, and Tamara Teplova. 2021. Impact of the COVID-19 induced panic on the Environmental, Social and Governance leaders equity volatility: A time-frequency analysis. Research in International Business and Finance 58: 101493. [Google Scholar] [CrossRef] [PubMed]
  83. Urquhart, Andrew, and Hanxiong Zhang. 2019. Is Bitcoin a hedge or safe haven for currencies? An intraday analysis. International Review of Financial Analysis 63: 49–57. [Google Scholar] [CrossRef]
  84. Vives, Antonio, and Baljit Wadhwa. 2012. Sustainability indices in emerging markets: Impact on responsible practices and financial market de-velopment. Journal of Sustainable Finance and Investment 2: 318–37. [Google Scholar] [CrossRef]
  85. Wang, Ze, Xiangyun Gao, Haizhong An, Renwu Tang, and Qingru Sun. 2020. Identifying influential energy stocks based on spillover network. International Review of Financial Analysis 68: 101277. [Google Scholar] [CrossRef]
  86. Yarovaya, Larisa, Ahmed H. Elsayed, and Shawkat Hammoudeh. 2021. Determinants of Spillovers between Islamic and Conventional Financial Markets: Exploring the Safe Haven Assets during the COVID-19 Pandemic. Finance Research Letters 43: 101979. [Google Scholar] [CrossRef]
  87. Yousaf, Imran, Elie Bouri, Shoaib Ali, and Nehme Azoury. 2021. Gold against Asian Stock Markets during the COVID-19 Outbreak. Journal of Risk and Financial Management 14: 186. [Google Scholar] [CrossRef]
  88. Zhang, Weiping, Xintian Zhuang, Jian Wang, and Yang Lu. 2020. Connectedness and systemic risk spillovers analysis of Chinese sectors based on tail risk network. The North American Journal of Economics and Finance 54: 101248. [Google Scholar] [CrossRef]
  89. Zheng, Guang-Wen, Abu Bakkar Siddik, Mohammad Masukujjaman, and Nazneen Fatema. 2021. Factors Affecting the Sustainability Performance of Financial Institutions in Bangladesh: The Role of Green Finance. Sustainability 13: 10165. [Google Scholar] [CrossRef]
  90. Zhu, Wenzhong, Jiajia Yang, Han Lv, and Meier Zhuang. 2021. Pandemic Uncertainty and Socially Responsible Investments. Frontiers in Public Health 9: 661482. [Google Scholar] [CrossRef]
Figure 1. MSCI Emerging Markets ESG Leaders Index vs. VIX (a), S&P Crude Oil (b), EPU (c), Natural Gas (d), Commodity Index (e).
Economies 12 00089 g001
Figure 2. MSCI ACWI ESG Leaders Index vs. VIX (a), S&P Crude Oil (b), EPU (c), Natural Gas (d), Commodity Index (e).
Economies 12 00089 g002
Figure 3. MSCI North America ESG Leaders Index vs. VIX (a), S&P Crude Oil (b), EPU (c), Natural Gas (d), Commodity Index (e).
Economies 12 00089 g003
Figure 4. MSCI Europe ESG Leaders Index vs. VIX (a), S&P Crude Oil (b), EPU (c), Natural Gas (d), Commodity Index (e).
Economies 12 00089 g004
Figure 5. MSCI KLD 400 Social Index vs. VIX (a), S&P Crude Oil (b), EPU (c), Natural Gas (d), Commodity Index (e).
Economies 12 00089 g005
Table 1. Descriptive statistics.
MSCI ESG ACWIMSCI ESG EMMSCI ESG EuropeMSCI KLDMSCI ESG NAVIXNatural GasCommodity IndexS&P Crude OilEPU
Mean2231.022064.7791.541476.00383.8624.743.78205.09309.38192.42
Median2290.432078.8091.841498.35392.6122.922.97200.04292.98147.99
Maximum2709.682600.34108.181868.09485.0482.699.68329.59581.80807.66
Minimum1323.341302.8358.58841.54217.0012.101.48106.2976.7022.25
Std. Dev.315.88287.4311.15236.1162.309.221.9957.62123.59124.52
Skewness−0.51−0.34−0.47−0.35−0.352.491.090.480.391.66
Kurtosis2.382.182.552.192.1112.493.342.112.025.89
Jarque-Bera40.2531.7030.1832.1836.143195.50136.7641.8643.39539.39
p-value0.000.000.000.000.000.000.000.000.000.00
Disclaimer/Publisher’s Note: The statements, opinions and data contained in all publications are solely those of the individual author(s) and contributor(s) and not of MDPI and/or the editor(s). MDPI and/or the editor(s) disclaim responsibility for any injury to people or property resulting from any ideas, methods, instructions or products referred to in the content.

