Abstract
This article describes a new approach to determining the optimal amount of state financial support provided to business entities. It is shown that there are three available methods to support economic agents. The most cost-effective option is subsidizing business entities to expand their current assets. It has been revealed that there are not just optimal amounts of government financial support but also optimal not-to-exceed amounts that make it possible to identify the boundaries of the so-called highly productive state of the economy. In this case, when the economy is highly productive, the prices of goods (services) fall, workers spend their savings, and the volume of production increases. This ultimately leads to an increase in the well-being of the population. The differential equations are the basis for the model, which is similar to the model of a simple two-sector single-product economy. The Monte Carlo method is used to determine the optimal not-to-exceed amount for government financial support. The identification of such intervals allows us to determine the amount of state financial support that will lead to a highly productive state and will not contribute to an unreasonable expansion of the budget expenditure. This study’s results can be utilized by government authorities for the development of a comprehensive system of state financial support for entrepreneurship. Business entities can use the results of this research concerning the calculation of the optimal not-to-exceed amount of financial support.
1. Introduction
One of the common problems in the functioning of companies is the lack of financial resources for their further development. Business entities strive to minimize operating expenses and turn to tax planning and optimization of expenses to overcome this obstacle (Rowse 1985; Assidi et al. 2016). Receiving financial support from the government is considered to be an alternative option. Types of state financial support for business entities vary depending on the legal framework and characteristics of national economies. Subsidies, guarantees, concessional financing on a refundable basis, grants, and tax support are the most prevalent and common types of business support in most countries.
The scientific community and public administration recognize the importance of public financial support due to different reasons. On the one hand, the key tasks of the state’s financial support for economic entities at the macro level include stimulating business development, increasing gross output, creating additional jobs, improving the welfare of the population, and increasing tax contributions to the budget. On the other hand, one of the purposes of public financial support is to stimulate the creation of organizations, especially in crisis situations (for example, business support during the COVID-19 pandemic (Honda et al. 2023; Nguyen et al. 2023)). The financial condition and sustainability of the entity can be positively impacted by governmental financial support at the micro level.
Determining the optimal not-to-exceed amount of state financial support and its impact on the company’s key indicators is a challenge in providing state financial support to economic entities. Firstly, the expenditure portion of the consolidated state budget should not be unreasonably increased by providing public financial support. Secondly, the economic impact of public financial support should be assessed. The distribution of financial resources should be balanced among economic agents.
In this study, we developed a mathematical model for a simple two-sector (private closed) economy that includes the amount of state financial support given to entrepreneurs. The aim of this study is to develop a method for determining the optimal not-to-exceed amount of state financial support given to economic entities, which will enable the verification of the efficiency and effectiveness of support measures for different sectors of the economy. The following tasks will be carried out to achieve this objective:
- Describe the required tools used for mathematical modeling of complex state financial support of business entities.
- Construct a comprehensive model of state financial support for economic entities under conditions of uncertainty and risk, allowing the determination of the socio-economic development of regions and the consideration of the interests of the state and business entities.
- Assess the adequacy of the built model for the complex financial support of business entities.
The results of this study will contribute to the methodology for providing state financial support to business entities and be used both by government bodies and economic agents to calculate the optimal not-to-exceed amount of financial support planned to be received. The difference between the developed approach and the existing studies lies in the comprehensiveness of the presented mathematical model, i.e., its applicability for different sectors of the economy, taking into account one criterion. The novelty of the approach is determined through the calculation of not just some optimal amount of state financial support but through the identification of intervals of amounts within which there is a simultaneous satisfaction of the interests of the state and business entities.
2. Literature Review
At present, there is no single unified theoretical approach to calculating the optimal not-to-exceed amount level of government financial support for enterprises. On the one hand, this is due to different legal frameworks for providing government support in different countries. On the other hand, this is due to the heterogeneity of the support measures provided. The analysis of the scientific publications related to the research topic made it possible to identify two approaches to embedding governmental financial support to firms in economic–mathematical models. First, the amount of financial support can be considered to be explained variable in the model. According to researchers, this approach distinguishes a few factors that determine support levels with some certainty (Yu et al. 2023; Fan et al. 2024).
The second approach is the most common one. It analyzes the impact of providing state financial support to business entities on certain economic variables.
Most of the literature that deals with the impact of public subsidies focuses on grants for research and development. There are some notable national impact analyses of grants to young companies (Czarnitzki and Delanote 2015; Pfeiffer and Reize 2000; Decramer and Vanormelingen 2016; Colombo et al. 2014). Liu et al. (2016) and Caloffi et al. (2018) examined how the provision of R&D subsidies influences business actors who invest in R&D. Some papers (Butler et al. 2010; Crepon and Duguet 2003; Pfeiffer and Reize 2000) assessed the impact on firm outcomes, such as survival and firm performance, while others assessed the probability of receiving a subsidy (González and Pazó 2008). Most of the evidence shows positive effects on survival and/or performance. Even though periods of economic downturn are recognized as being particularly dangerous for young firms, there is little empirical evidence on the impact of grants during recessions. Burger and Rojec (2018), Aristei et al. (2016) and Hud and Hussinger (2015) assessed the impact of R&D grants on R&D spending during the last recession and found a positive effect.
The study by Sha et al. (2024) evaluated the impact of agricultural subsidies on the overall welfare of farmers. Kállay and Takács (2023) investigated the impact of the provision of government subsidies on the economic growth of firms.
Several studies have been devoted to the analysis of the impact of providing state financial support to business entities on employment and unemployment levels in the economy and on the labor market in general (Cingano et al. 2023; Branstetter et al. 2023; Tübbicke 2024). Job growth rates for small firms after assistance are higher than in large firms; however, large firms provide many more jobs at a lower cost. Huber et al. (2017) claimed that young firms contribute most to net job creation despite high relative exit rates. This is due to the high growth rates of young surviving firms. The job creation rates of small firms are similar to those of large firms, conditional on their survival. However, smaller companies contribute less to job creation due to higher exit rates (Huber et al. 2017).
McKenzie et al. (2016) argued that government intervention is potentially justified because small firms underinvest in learning for reasons such as underestimating benefits, spillovers to competitors, or credit market imperfections. To facilitate learning, business development grants often include funding for training and purchasing consultancy services. The resulting increase in business skills and managerial capital is a possible mechanism through which these business development grants can generate additionality. Higher managerial capital can lead to better strategic and operational decisions and to more efficient use of other factors such as physical capital and labor (Bruhn et al. 2012). There is also evidence that higher levels of human capital have an impact on the survival of young firms through the effect on their initial size (Colombo and Grilli 2005). For example, specific business skills acquired through development grants have a particularly high value, affecting both survival and growth and business performance (Backman et al. 2016).
Other studies have attempted to assess the impact of providing direct financial support to firms on the factor productivity (Lin and Zhang 2024), while others reported a limited role and thus an impact that is difficult to identify (Branstetter et al. 2023). Studies analyzing the impact of state financial support to economic entities on population welfare attract attention. It is a well-known fact that the economic category of “the welfare of the population” is a complex one, and it can be considered as various economic indicators (Walker et al. 2024). However, it is important for some research to assess the influence of government financial support on people’s welfare and, at per capita income levels, social inequality (Vigani et al. 2024; Sha et al. 2024; Okorie and Wesseh 2024).
Some scientists are interested in examining the provision of government financial support to business entities at the meso level (Sha et al. 2024; Bernini and Galli 2024; Soeparna and Taofiqurohman 2024; Zhao et al. 2024; Lin and Zhang 2024; Guo et al. 2024; Rajput and Venkataraman 2024). Recently, there has been an increased publication activity regarding the impact of government financial support to enterprises on the sustainable development of individual regions or sectors related to the development of the “green” economy (Guo et al. 2024; Zhao et al. 2024; Bernini and Galli 2024).
The impact of providing certain types of financial support has been assessed by several researchers. For example, studies by Berger and Hottenrott (2021), Charfeddine and Zaouali (2022), Mueller (2023), and Tübbicke (2024) examined the impact of government subsidies on firms in the early phases of their life cycles.
The study by Srhoj et al. (2020) presented new microeconometric evidence on the impact of business development grants on output and input additionality. Previous research by the authors has mainly focused on the impact of R&D grants, while there is little empirical evidence on the impact of business development grants despite the policy interest of this type of grant (Dvouletý et al. 2021; Cadil et al. 2020).
The role of business development grants was examined by Srhoj et al. (2020). Business development grants are smaller grants. Therefore, they may contribute to the risk of substituting public money for private money rather than creating an additional benefit. As a result, a number of researchers have questioned the effectiveness of such subsidies, i.e., the wisdom of using public funds, particularly in developing countries (OECD et al. 2016).
The results of Srhoj et al. (2020) showed, on average, strong positive effects of business development grants on capital stock, bank loans, intermediate inputs, and value added, but no empirical evidence of a positive effect on productivity measures, sales, employment, average wage, and inventories. However, the significant results were based on the positive effects on smaller firms. The positive effect on the growth of small firms is in line with the studies of Bia and Mattei (2012), Munch and Schaur (2018), Bertoni et al. (2019), and Criscuolo et al. (2019).
More favorable effects of business development grants on capital, bank loans, employment, value added, sales, and labor productivity of smaller firms are theoretically justified. This is because the specific grant amount is better designed to ease the capital constraints of smaller firms compared to larger firms.
Looking at the mechanism of the effects suggests that the main effect of the subsidy has been to enable firms to raise more capital. The strong certification effect also means that, on average, subsidized firms receive an even larger bank loan than the amount considered when granting the subsidy. Overall, public funding for smaller firms increases capital stock by almost twice the grant amount, unlocks bank loans of 1.5 times that amount, saves jobs, and creates economic value above the grant amount (Skrinjaric et al. 2021; Pellegrini and Muccigrosso 2016; Ogujiuba et al. 2022, 2023). To further explore the question of what level of subsidy might be too low or where the turning point from substitution to additionality lies, we calculate it. As in Biagi et al. (2015), increasing the amount of grants induces larger effects on small firm performance measures.
The researchers found that subsidies at this stage in the development of a business have a positive effect on the subsequent development of the business units. It should be noted that the researchers most often used an econometric approach and less game theory and mathematical models when modeling government financial support to business units.
Thus, in the reviewed studies, the mechanism of state financial support was analyzed in a fragmented manner depending on the direction of support, the sector of the economy, the stage of the life cycle of the object of support, and other criteria. We have been given a new challenge. This is the construction of a complex model of state financial support to substantiate the conditions and effectiveness of support measures for different spheres of economic activity when deciding on their provision to business entities.
3. Methodology
In addition to the previous studies, we developed a model of three options for government financial support and assessed their impact on workers’ savings, the price of the product (service), and the volume of output.
For this purpose, we use numerical mathematical modeling of economic processes and the Monte Carlo method. The developed approach allows the identification of such amounts or ranges of amounts of state financial support to business entities that will achieve a simultaneous increase in the savings of employees and the volume of products produced in the economy and a decrease in the price of goods (services).
In this research, we considered a model of a simple two-sector (private closed) economy. The model is a single product:
The assumptions of the presented mathematical model are as follows: This model characterizes a society composed of two groups such as the owners of enterprises and the employees. Entrepreneurs are economic agents. They receive income from the sale of goods produced in their enterprises and pay wages Pn to their employees. The number of employees includes not only the direct producers of goods but also service workers and workers employed in the structural divisions of the firm.
The savings of the employers and employees are different. However, for the sake of the law of conservation of money, we assume that they are the same in each group:
where n′ is the population size of workers, m′ is the population size of business owners, is the average savings, and M is the money supply.
The saving dynamics of the entrepreneurs Um is determined by the balance of income and expenditure, which in a single-product model is reduced to the wages of the workers Pn. The wages of workers in the model are piecework wages.
The dynamics of workers’ savings Un is not an independent variable, and it is determined by the law of conservation of money:
The price of a product (service) p is based on the supply and the demand and the speed of its introduction to the market γ. The demand (consumption) of employers and employees is described by the Törnqvist function. The activity of the enterprise is described by a production function F, which depends on the current assets V, the population size of producers (employees) n′, the price of goods (services) p, and the duration of the inventory turnover (turnover time) τ, calculated according to Wilson’s formula. The production function has an upper limit, Fmax, which is determined by the level of technology, the organization of production, and the physical abilities of the workers.
The methodology for calculating the coefficient h is not explicitly presented in the scientific literature. Based on the semantic content of the indicator related to the presented model, we understand it as a coefficient characterizing the additional product of an economic unit. The system of equations can be solved using the fourth-order Runge–Kutta method (Wilkie 2004). This method is characterized by a higher accuracy compared to other numerical modeling methods. We use the financial and management reporting data of the business unit to determine the input parameters of the model. A mathematical model specified by a system of equations is a basic model. Its purpose is to clarify the nature of the described phenomenon or process.
4. Data Analysis and Results
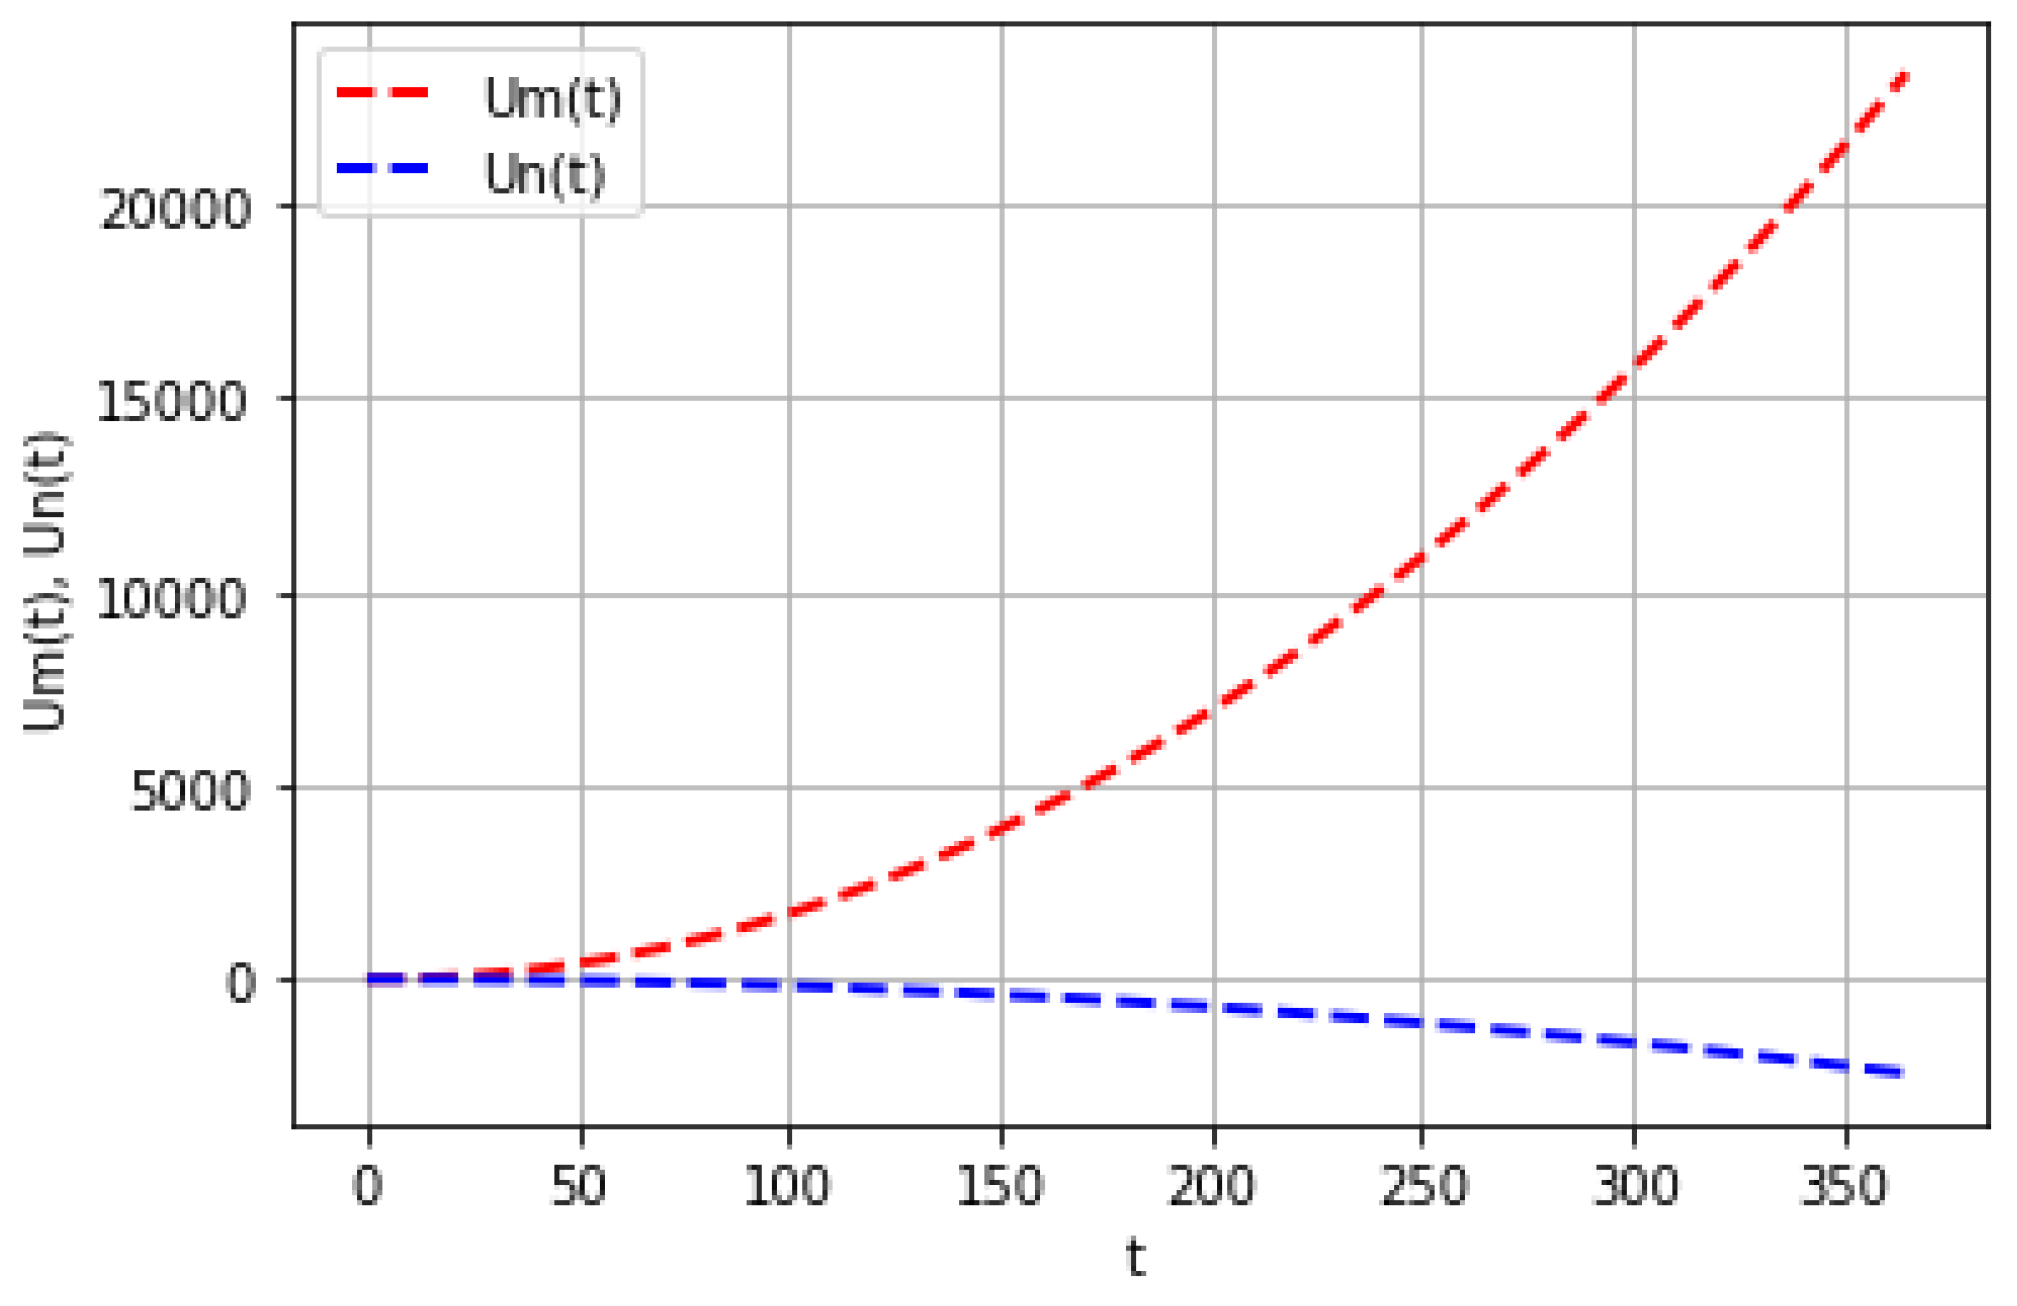
In the first stage of this study, we analyze the time dependence of savings of entrepreneurs and employees without including them in the model of state financial support. Figure 1 shows the time dependence of the savings made by entrepreneurs and employees of an economic unit that operates under conditions of uncertainty and risk. The sampling step is 10−1. If the step is halved, the simulation results change by less than 10%.
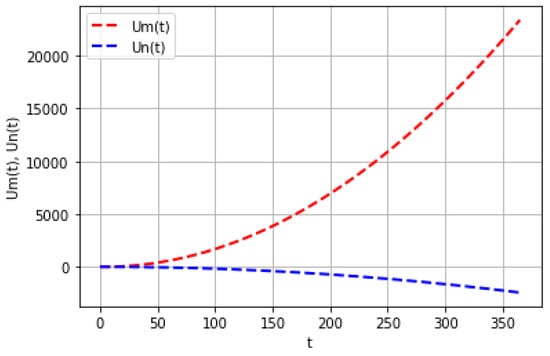
Figure 1.
Time dependence of savings of business owners Um(t) and workers Un(t). Note: n = 0.9056, m = 0.0944, γ = 7.94, QI.0 = 13,919, g = 0.8 (marginal propensity of business owners to consume), V = 2,816,137,000, Fmax = 500,033, τ = 33, h = 0.8, M = 34,141,693,993.05, n′ = 240, m′ = 25, = 32,400.19, = 107.28.
The savings of business owners hereinafter are calibrated by 10−10 times, and the price of goods (services) is calibrated by 10−5 times.
A more detailed analysis shows that savings are positively time-dependent. This is because the owners of an economic unit tend to save throughout the year. In other words, owners tend to save throughout the financial year.
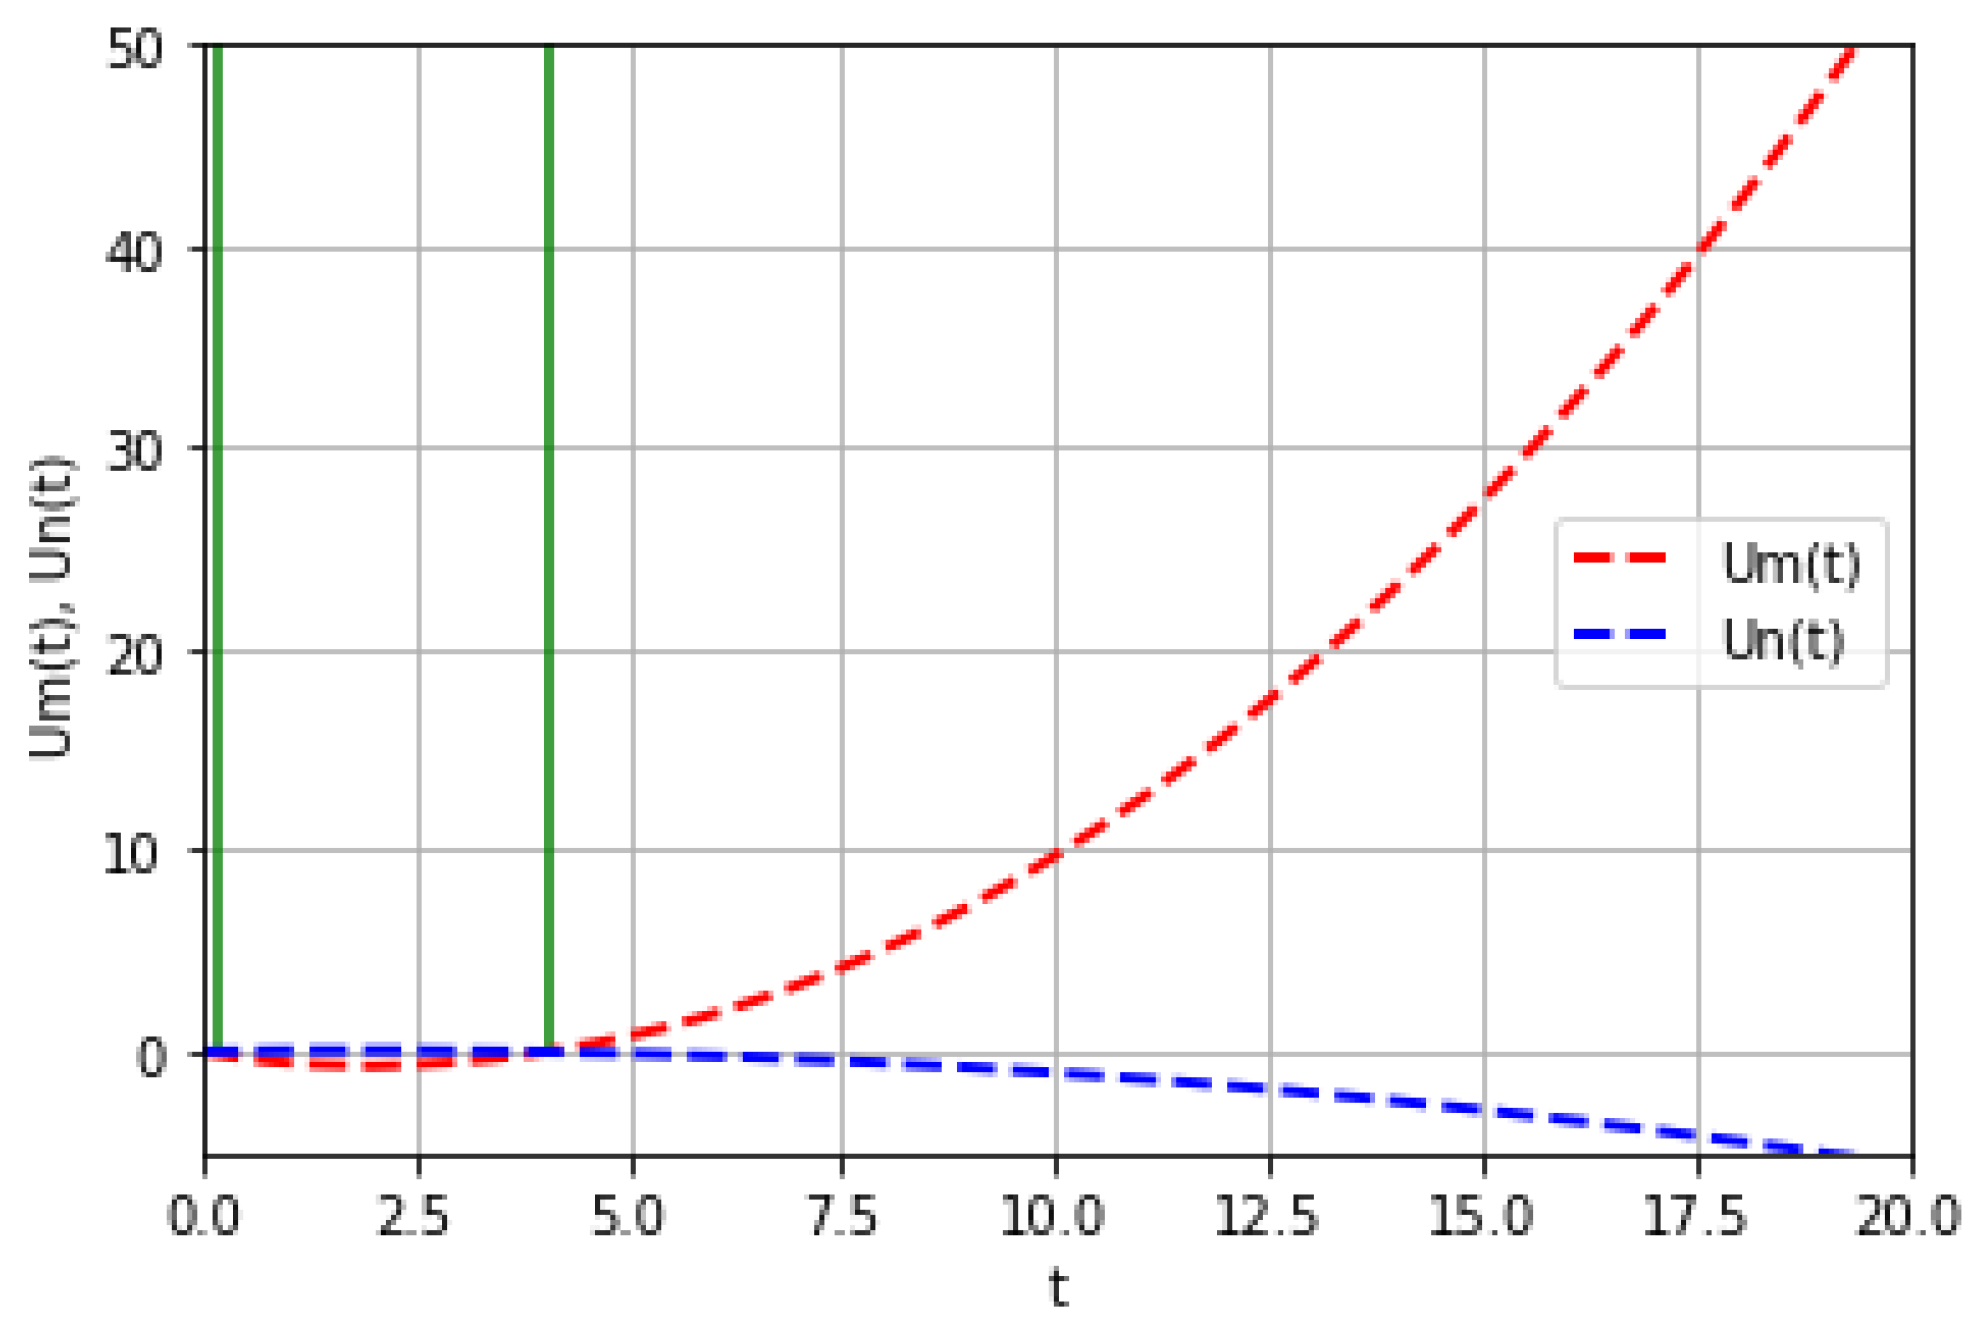
However, a more detailed analysis shows that, in the first segment of the modeling, the savings curve of the owners is located below the abscissa curve (Figure 2, between the two green parallel lines). Only later does it move into the first quadrant of the coordinate plane (at the 42nd time unit).
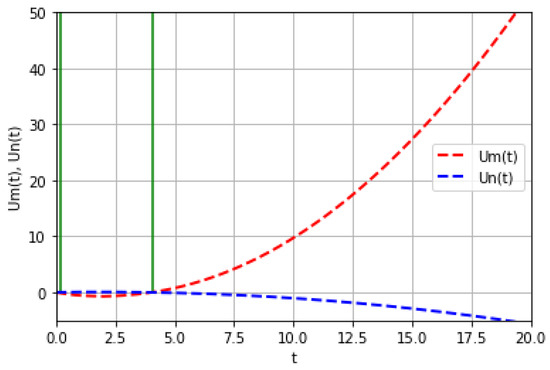
Figure 2.
Time dependence of savings of owners Um(t) and workers Un(t) at the initial segment of the simulation. Note: n = 0.9056, m = 0.0944, γ = 7.94, QI.0 = 13,919, g = 0.8, V = 2,816,137,000, Fmax = 500,033, τ = 33, h = 0.8, M = 34,141,693,993.05, n′ = 240, m′ = 25, = 32,400.19, = 107.28.
From the point of view of macroeconomic theory, especially Keynesian, it is observed that at the beginning of the financial year, the owners of a given economic unit spend their savings to satisfy consumer demand. Further, with the growth of disposable income, the savings curve in the specified time unit crosses the abscissa axis. At the intersection point, there is equality of disposable income multiplied by the marginal propensity to save, autonomous consumer spending.
According to equation Un (the sixth equation in the system of equations in Equation (1)), the savings made by employees are inversely related to those made by entrepreneurs. From the point of view of economic physics, this is explained by the law of conservation of money. According to corporate finance theory, it is explained by the agency conflict. Thus, employees accumulate savings in the initial phase of the simulation and spend them in the final phase (at the end of the financial year), as shown in Figure 1 and Figure 2; while entrepreneurs spend their savings within a short period, employees spend for a financial year.
To assess the impact of governmental financial support on the model variables, we add the indicator Sub to the model, which characterizes the amount of support provided in monetary terms. In this case, there are three options for the distribution of the financial resources: (1) providing state financial support to both groups of economic agents (undirected expenditure); (2) giving state financial support to employees (stimulation of employee demand); (3) providing state financial support to entrepreneurs (stimulation of supply) (options (2) and (3)—directed expenditure). Then, we explored each of these options.
If financial support is provided by the government to both groups of economic agents (business owners and employees), the money supply in the economy will increase by the amount Sub, so that M′ = M + Sub. In this case, the final savings of entrepreneurs and employees will not change or will change slightly (less than 0.001%) only if a significant amount of funds is provided (with Sub > 11,000,000,000). This is not comparable to the concept of “financial support”. This allows us to conclude that the provision of government financial support in the form of a non-addressed issue does not have the expected economic effect in a model of a simple two-sector closed economy (based on current model data).
Conversely, if government financial support is provided to workers in order to stimulate demand and the subsequent expected increase in supply, the equation for workers’ savings (6) is modified:
However, this type of support does not have the necessary effect on the economy. The final values of the savings of entrepreneurs and employees change only in the case of significant volumes of financial resources provided (with Sub > 43,000,000). Obviously, the limited budget does not allow such financial support to entrepreneurs.
Providing government financial support to business owners can be carried out in two directions. Firstly, financial support can be provided through direct support to owners in order to stimulate the demand of business owners. However, this option is considered socially unacceptable. It increases social tensions and imbalances and, therefore, does not contribute to the expected economic effect. Secondly, financial support can be provided through investments (subsidies, subventions, and other similar formulations, depending on the legal and regulatory framework of government financial support in a given country) in the company’s current assets so that V′ = V + Sub. In this case, it is foremost necessary to determine the level of governmental financial support that will allow sustainable social and economic effects to be achieved, such as reducing the savings made by employees, reducing the price of the product (service), and increasing the volume of production in comparison with the initial situation, i.e., in the absence of government financial support for economic entities.
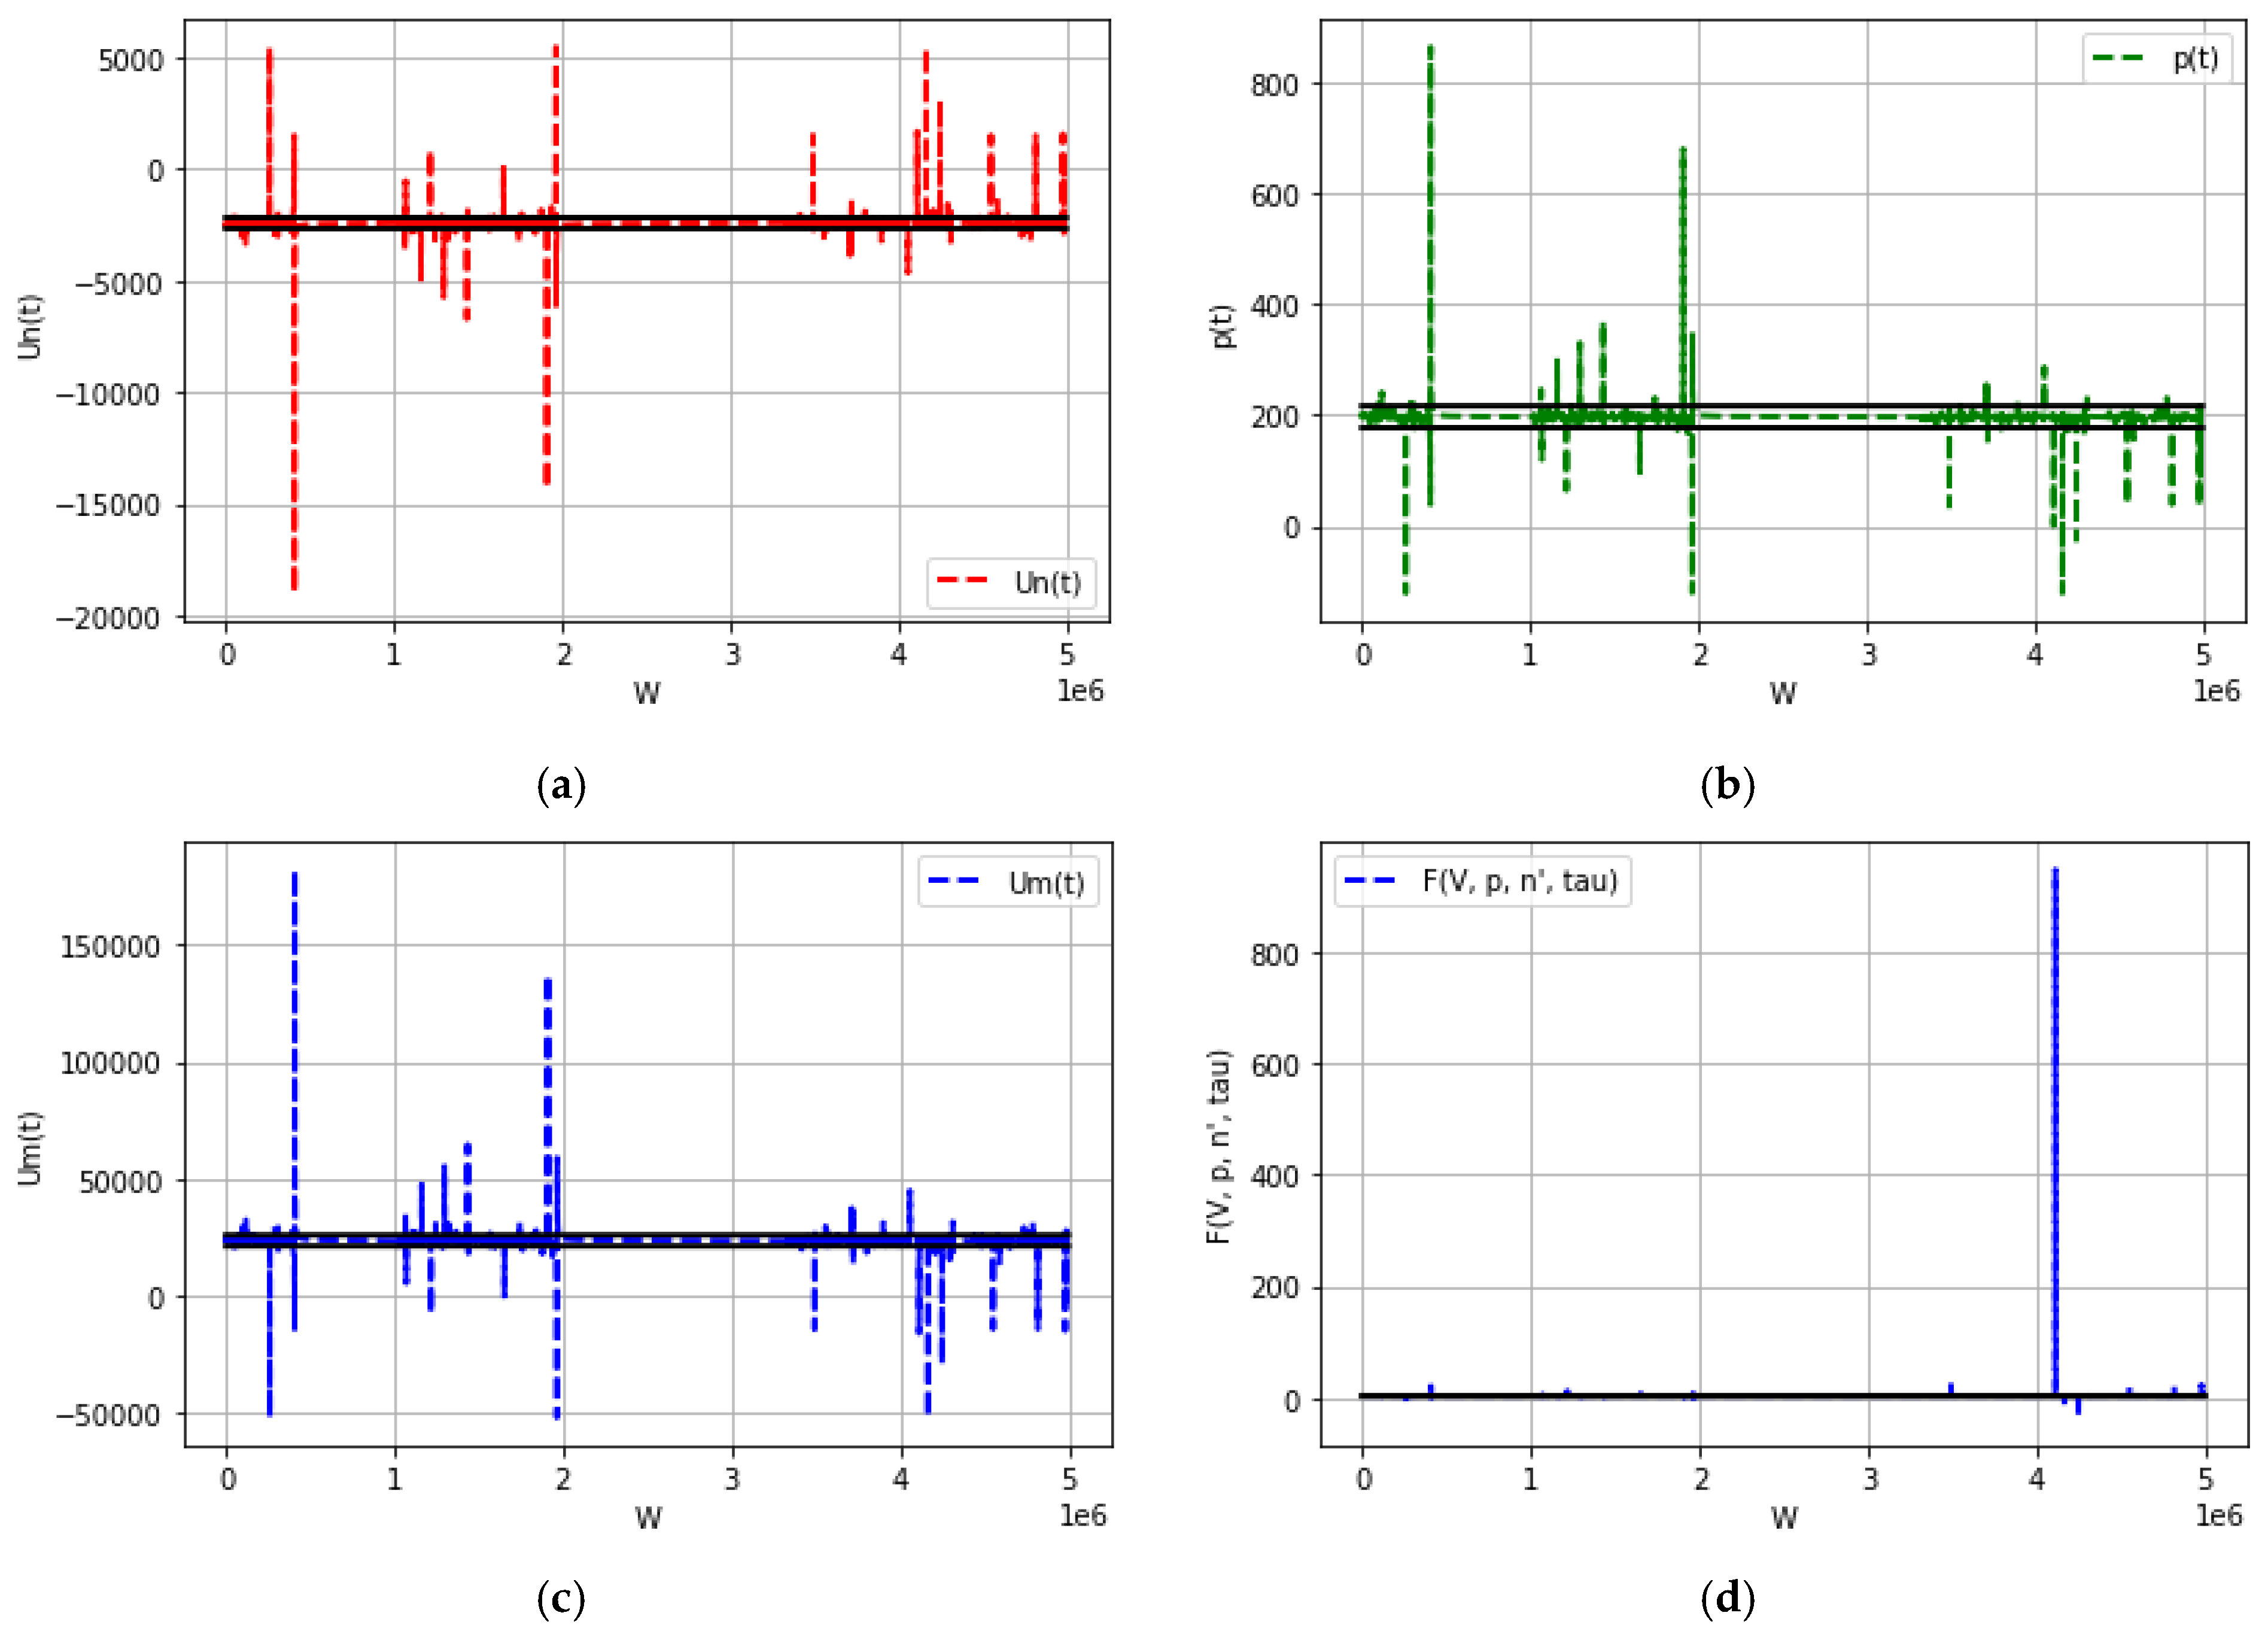
To determine the optimal amount of governmental financial support, we will use the Monte Carlo method. The Monte Carlo method allows, by changing one or a number of input parameters (iterations), the values of the dependent variable to be obtained under other equal conditions. The results of the simulation of the final savings of business owners and employees, the price of goods (services), and the Monte Carlo output are presented in Figure 3.
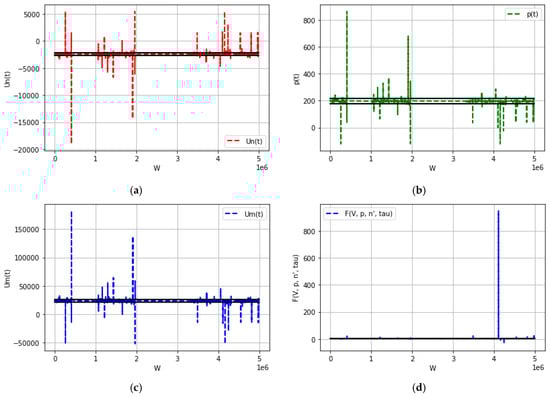
Figure 3.
Simulation modeling of savings of business owners (panel (c)) and employees (panel (a)), prices of goods (services) (panel (b)), and volume of output (panel (d)). Note (1): n = 0.9056, m = 0.0944, γ = 7.94, QI.0 = 13,919, g = 0.8, V = 2,816,137,000, Fmax = 500,033, τ = 33, h = 0.8, M = 34,141,693,993.05, n′ = 240, m′ = 25, = 32,400.19, = 107.28; (2): le6 is equivalent to 10 to the sixth power.
The amount of governmental financial support varies from 0 to 5∙106 conventional monetary units. The discretization step is 103 conventional monetary units. Black lines correspond to the boundaries of the 90% confidence interval. The values of the model variables that are outside the confidence interval are the result of the hysteresis property of the model. In particular, there are amounts of government support at which the values of modeled parameters change sharply. Moreover, with a slight increase in the amount of government support, the economy returns to the confidence interval zone.
Looking at the dynamics of savings by proprietors and employees, we find that in a simple two-sector (private closed) economy, due to the law of conservation of money, an increase in the level of savings by proprietors reduces the level of savings by employees and vice versa. The effect of this law is shown in Figure 3 as a mirror image of the savings of owners and employees.
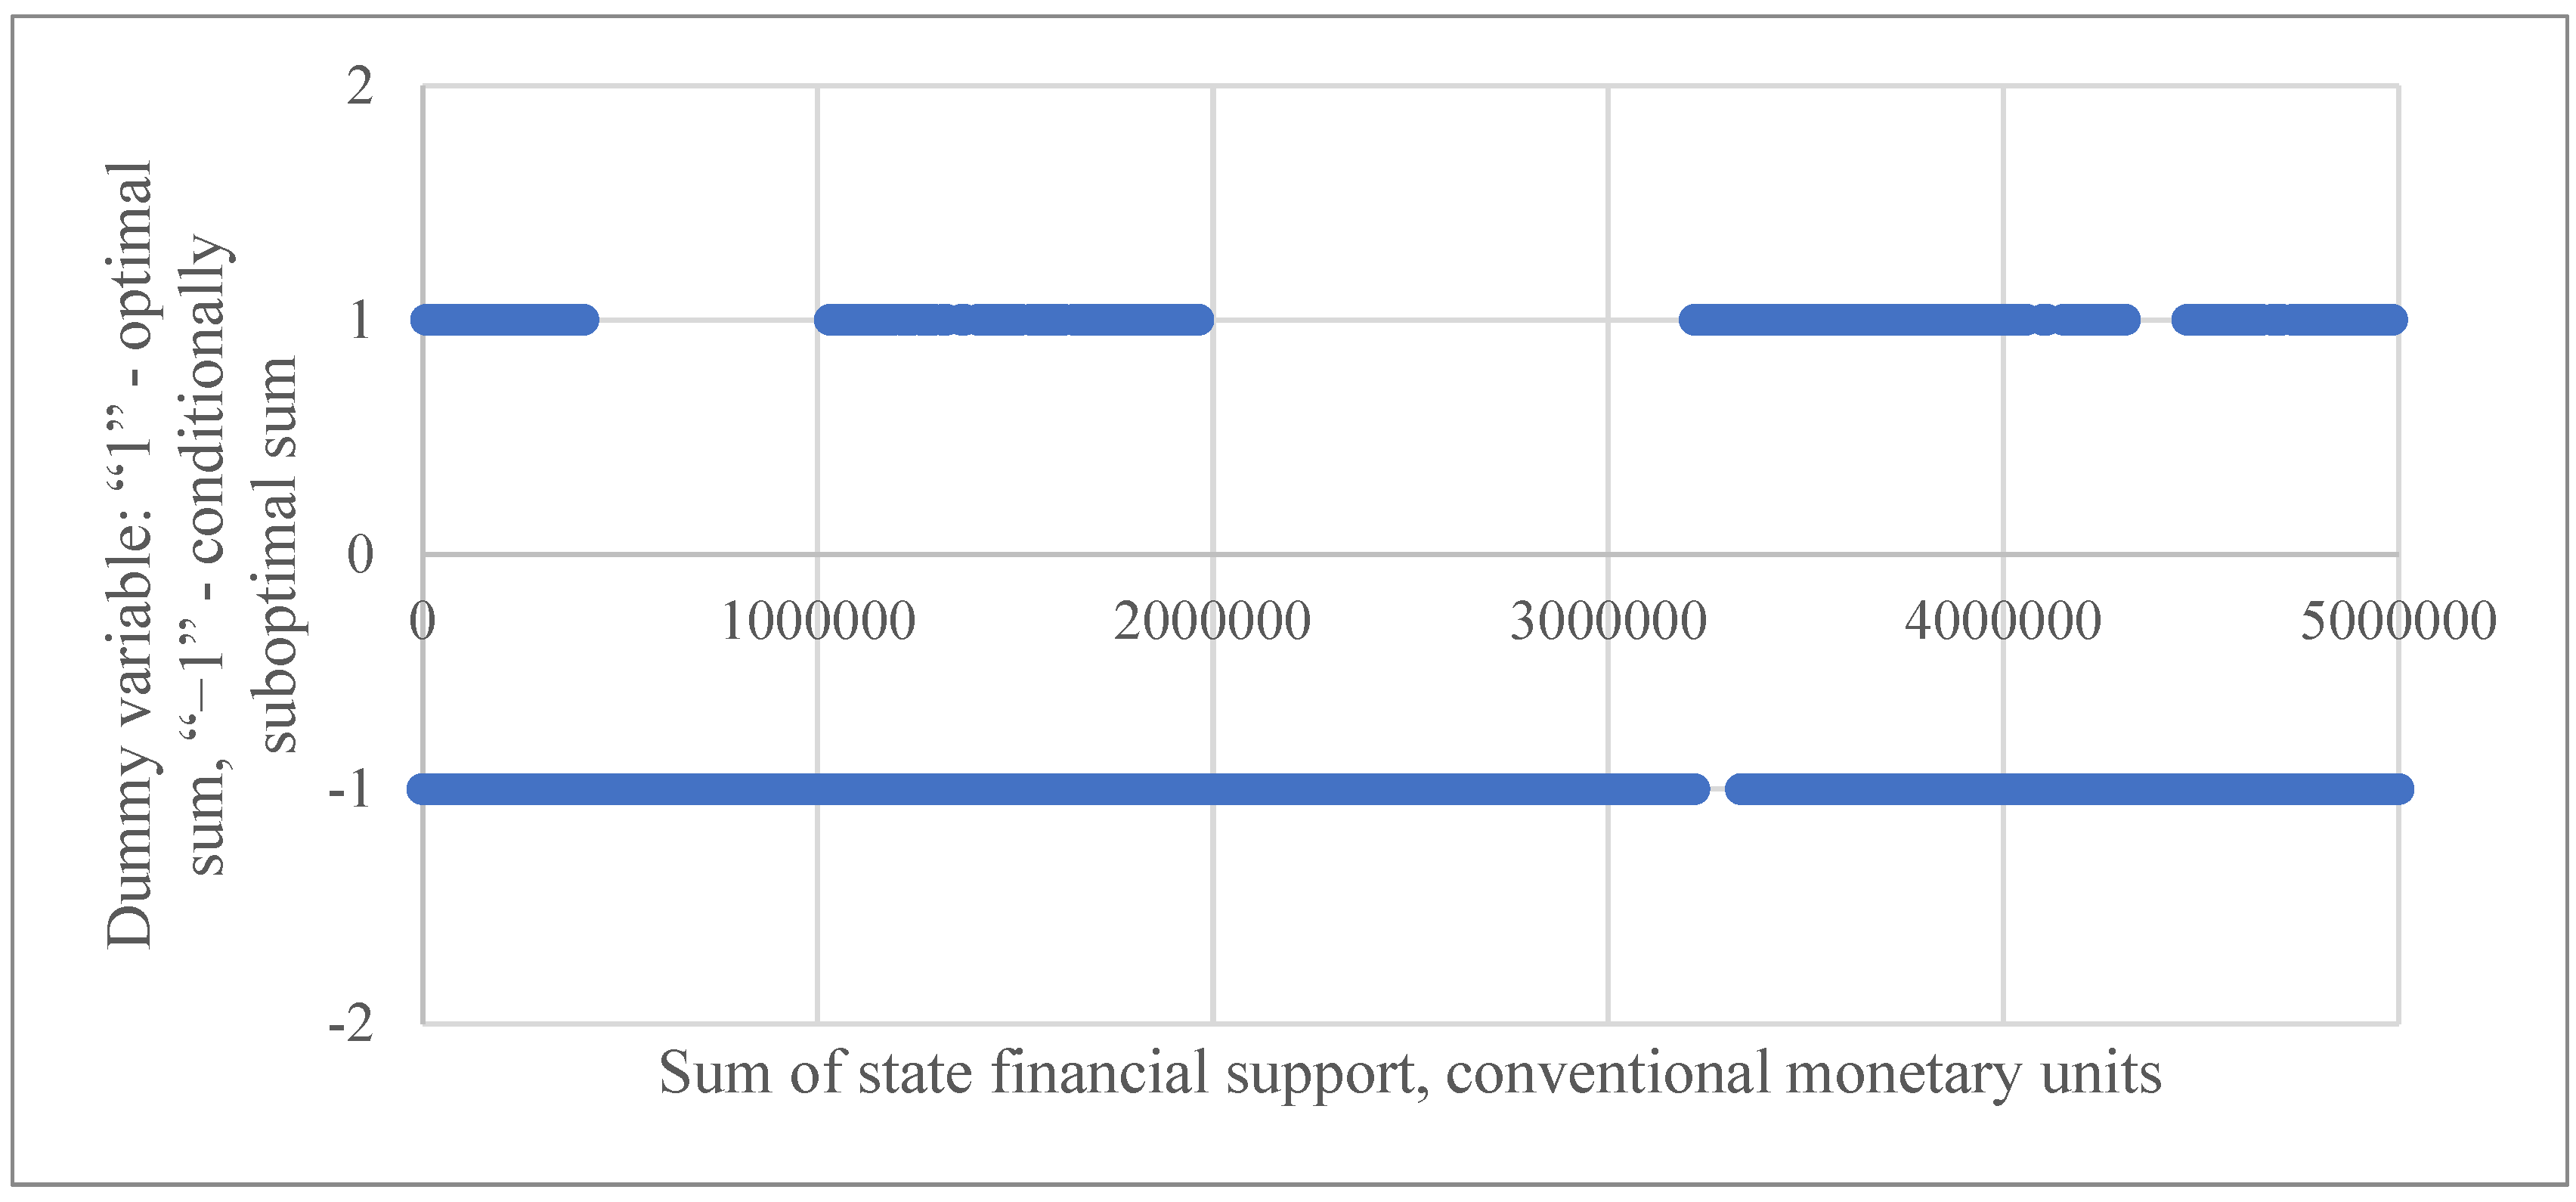
To assess the social and economic impact, we compare workers’ savings, the price of goods (services), and the volume of production with the ‘reference’ value. By default, we take the values of these variables in the absence of any financial support from the state to the economic entities in the economy. The results of this comparison are shown in Figure 4.
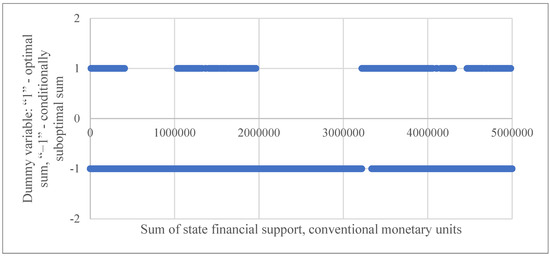
Figure 4.
Intervals of amounts of governmental financial support for business entities. Note: n = 0.9056, m = 0.0944, γ = 7.94, QI.0 = 13,919, g = 0.8, V = 2,816,137,000, Fmax = 500,033, τ = 33, h = 0.8, M = 34,141,693,993.05, n′ = 240, m′ = 25, = 32,400.19, = 107.28.
We introduce a dummy variable where ‘1’ is the optimal level of government financial support and ‘−1’ is a conditionally sub-optimal level of government financial support to firms (Figure 4). The value of the dummy variable equal to “1” corresponds to a situation where the amount of employee savings and the price of goods (services) are lower than the “reference” value, and the volume of production is higher than the “reference” value. Social and economic impacts are therefore achieved. Consequently, the value of a dummy variable equal to “−1” represents a situation in which at least one of the conditions of the system of inequalities (8) is violated:
The number of points in Figure 4 is 5000. This means that the intervals are quasi-continuous. This is the reason for the conditional continuity of the interval for the value of a dummy variable equal to “−1”. Therefore, the analysis and interpretation of the achievement of social and economic effects at each point corresponding to a given amount of government financial support seems to be more correct at a qualitative level. However, due to its size, it does not seem possible to include this dataset in this article. In this context, we present an interpretation of Figure 4. We show its advantages.
Firstly, the presence of such amounts or intervals of amounts of governmental financial support at which full social and economic effects are achieved is positive. By complete social and economic effects, we mean a situation in which each of the conditions of the system of inequalities (8) is met. The identified amounts or intervals of support amounts correspond to the so-called highly productive state of the economy, in which, on the one hand, there is an increase in the standard of living of workers (a decrease in the amount of savings spent by employees and a decrease in the price level in the economy), and, on the other hand, an increase in the volume of output.
In the case of a transition to a three-sector economic model, it is possible that increasing the tax rate will not lead to a significant decrease in the financial stability of the company. This means that in the future, additional tax revenues will help to increase the budget.
Secondly, there are amounts of government financial support where the interval corresponding to the value of the dummy variable equal to “1” is interrupted. In economic terms, this situation is due to behavioral effects. When relatively “small” amounts of government financial support are provided, entrepreneurs channel them directly into the production process. Moreover, as the amount of government support rises and a certain level of production sales is reached, a so-called opportunism effect occurs. The opportunistic effect, in this case, consists of the appropriation by the entrepreneurs of the governmental financial support provided to satisfy their own needs (especially in the case of non-targeted financial support). Indeed, in this case (according to the results of the modeling), the savings made by the entrepreneurs are higher than the “reference” values.
Then, as the level of financial support rises, we can again identify the interval in which the full social and economic impact is realized. We believe that this interval is caused by the need to expand the business and attract cheap financial resources to make this possible. When the next interval is reached, governmental financial support does not lead to full social and economic effects because economic entities test the introduced production capacities.
Finally, the next prolonged interval of governmental financial support will be due to the fraudulent criminal liability of the “owners” of companies that continue to use public financial resources to satisfy private needs instead of channeling them into the production process. As a result, the provision of governmental financial support to businesses has a positive social and economic impact.
These results are also in line with the conclusions of H. Simon, J. March, and R. Heiner’s behavioral theory of the firm (Simon [1947] 1976; Heiner 1990; Simon et al. 2017). In particular, the limited rationality of agents is one of the factors behind the emergence of opportunism. The choice of agents in entrepreneurial activities is usually not optimal but satisfactory, and their choice of goals is less than their maximum capabilities. Only when the stimulus (losses, criminal liability, etc.) exceeds the threshold (the beginning of the limits of the intervals of the amounts of governmental financial support corresponding to the value “1” of the entered dummy variable) does the agent react to the information on the optimal choice of solution. Then, when a given stimulus exceeds the threshold, selective perception occurs. In other words, up to a certain level of changes in the usual picture of the world, actors do not react to deviations.
It should be noted that the limits of the intervals will be different due to the different input parameters of the model of different economic entities. As a result, the state, as an economic actor whose main objective is to improve the well-being of the population, must design a system of governmental financial support. The provision of this support must consider the interests of both the state and economic entities in a comprehensive manner. Moreover, the implementation of the interests of the latter should not be opportunistic in nature.
From the point of view of describing a different basic approach to calculating the amount of provided governmental financial support, the approach to designing a system of state financial support proposed in this article is new. The sequential implementation of the following steps is the general scheme for the implementation of this approach:
- Implementation of a mathematical model, without considering the provision of financial support by the state, for the determination of the “reference values” of savings of entrepreneurs and employees, the price of goods (services), and the production function.
- Inclusion in the proposed mathematical model of governmental financial support in the context of three main forms: unaddressed problem, provision of government financial support to employees to stimulate demand (relevant for economies with oversupply of goods), investment in current assets.
- Determining such an amount or such a range of amounts of state financial support in the chosen direction, which corresponds to the interests of the state from the point of view of increasing the welfare of the population by increasing the savings of employees and also leads to decreasing prices and increasing the volume of products produced in the economy.
It is also possible to determine a level of support that does not lead to a significant increase in budgetary expenditure but which also satisfies the interests of the company concerned. As in the example presented, with Sub less than 408,000. In addition, we do not deny that with other input parameters of the model corresponding to a specific economic entity, a situation is possible in which, for example, a different option for targeting governmental financial support will be the most effective in terms of its influence on achieving full social and economic effects.
Moreover, we do not deny that different input parameters of the model corresponding to a specific business unit may create a situation where another option for handling governmental financial support will be the most effective from the point of view of its impact on achieving social and economic impacts. It is important to note that using this methodology does not cancel the procedure of preliminary assessment of economic entities for compliance with the criteria of a beneficiary of a specific state support measure. The existing approach is only a new method for calculating the optimal amount of governmental financial support.
The advantages of this approach are the following:
First, the presented mathematical model is easily implemented in programming languages and can, therefore, be implemented in existing intelligent systems for the provision of governmental financial support to business entities. This allows only the input parameters of the model to be entered via the user interface.
Second, the input parameters of the model are standard, and their content can be extracted from financial and management reporting data and government statistics in accordance with the accounting standards of the country in which the business entity is the recipient of governmental financial support.
Third, the model presented is universal and can be applied to different sectors of the economy and to different sizes of enterprises (micro, small, medium, and large).
Fourth, the presented mathematical model is generally applicable in conditions of turbulence in the political and economic situation since the input parameters of the model characterize the activities of specific economic entities, as well as the situation in the regional and national economy.
The limitations of this study are as follows: First, access to company management reporting data, which are often closed, is required to obtain primary data on input parameters. In this study, the closed data have been replaced by relevant open secondary data from government statistics. Second, the mathematical model at hand is a two-sector economy. Taxes as a deduction from the total income stream are, therefore, not included in the model. Third, the multiplier effect of state financial support is not directly considered in the model. However, we show how the economy changes and how it moves to a highly productive position.
5. Robustness Check
One of the obligatory parts of research involving constructing one or another economic and mathematical model is to assess its adequacy. This makes it possible to check whether the model corresponds to a real system. It can be carried out using theoretical, probabilistic, and statistical methods. To confirm the appropriateness of the model not just for one year but for several years, we have added data for 2018–2021 in addition to the input data for 2022 (Table 1).

Table 1.
Final savings of business owners and employees for 2018–2022.
The probabilistic–theoretical approach compares the results of modeling the savings of business owners and employee savings in the original version and when the initial savings of entrepreneurs are set to zero (Table 2).
Table 2.
A probabilistic–theoretical approach to assessing the adequacy of a model.
Initial savings in Table 2, as in the construction of Table 1 and Figure 1, Figure 2, Figure 3 and Figure 4, are calculated using the following formula:
where Utot is the total increase in household savings for the year, calculated according to state statistics; TR is the revenue of an economic entity; TRtot is the annual turnover of organizations (for the full range of organizations) according to state statistics; and m′(n′) is the average number of business owners (workers). If appropriate data are available in management accounting, initial savings can be withdrawn from management reporting.
The initial price condition may also be the actual output price of the product (service) of the subsidized recipient. If this is not available to the researcher, data from statistical agencies can be used as a basis.
A comparison of the data in Table 1 and Table 2 shows that the results of the mathematical modeling did not change in 2018, 2019, and 2022. In 2020, when the initial savings of the owners are assumed to be zero, their final savings correspond to the level obtained with a 1% increase in revenue or a 1% decrease in costs for the purpose of calculating the coefficient characterizing the additional product. Conversely, in 2021, the final savings of entrepreneurs correspond to the level calculated for a 1% decrease in money supply. The model considered is therefore appropriate. When the initial conditions for the savings of business owners and employees are changed, the results of the mathematical modeling correspond to those previously obtained.
The statistical approach is based on comparing modeling results with actual (statistical) data to assess the appropriateness of a model.
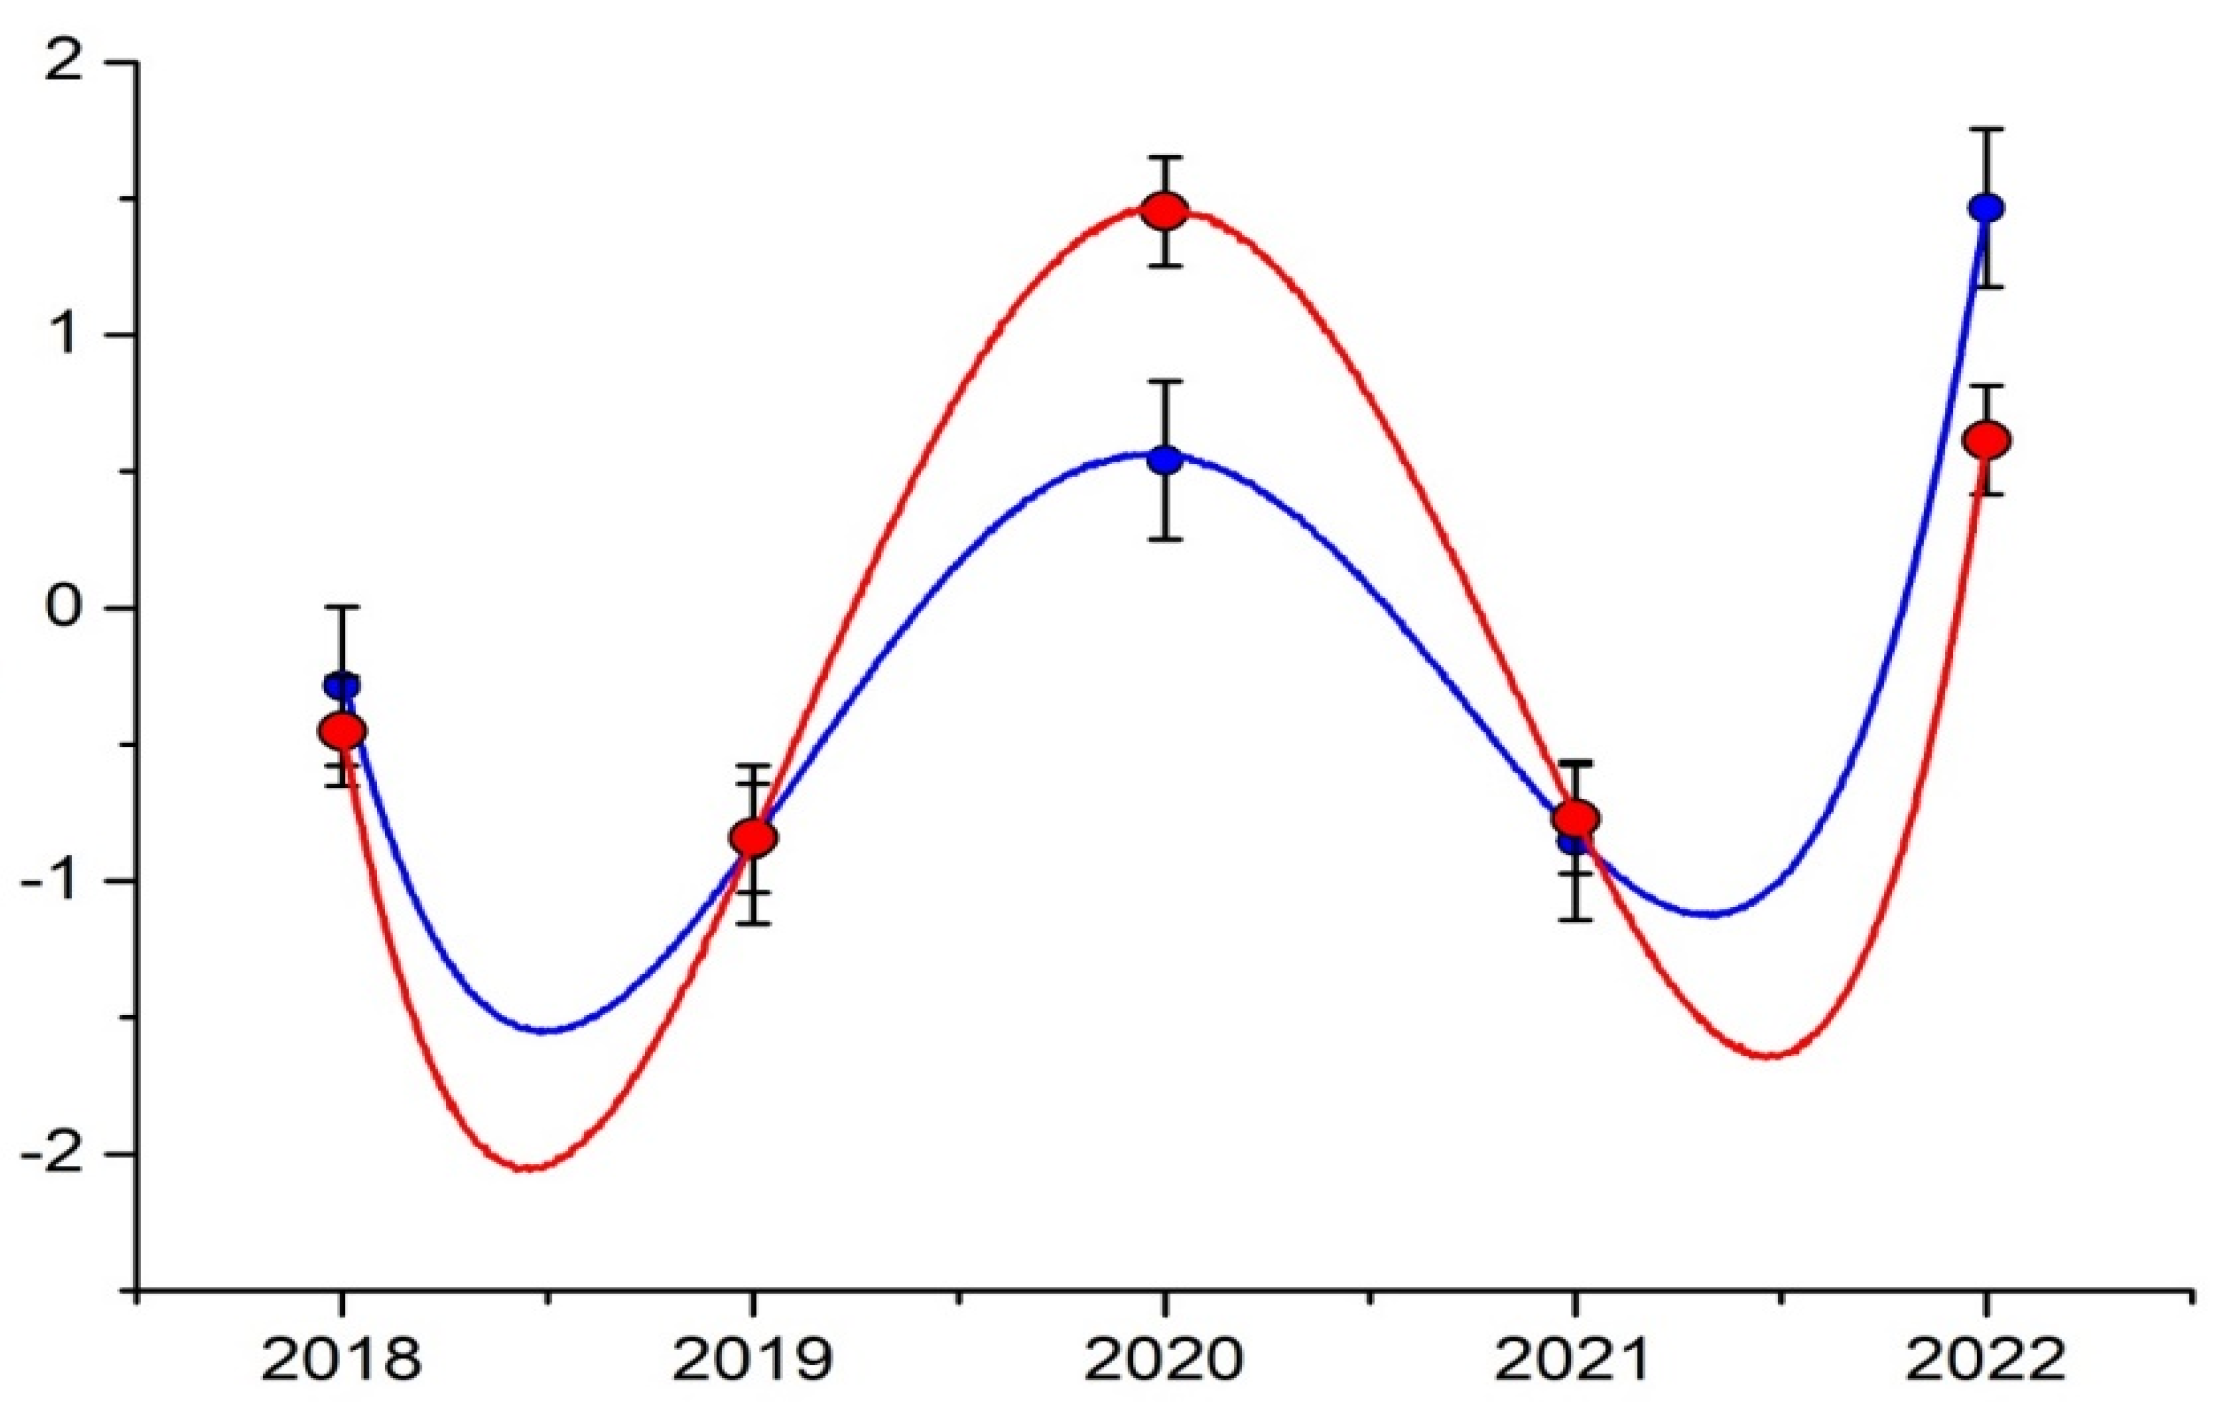
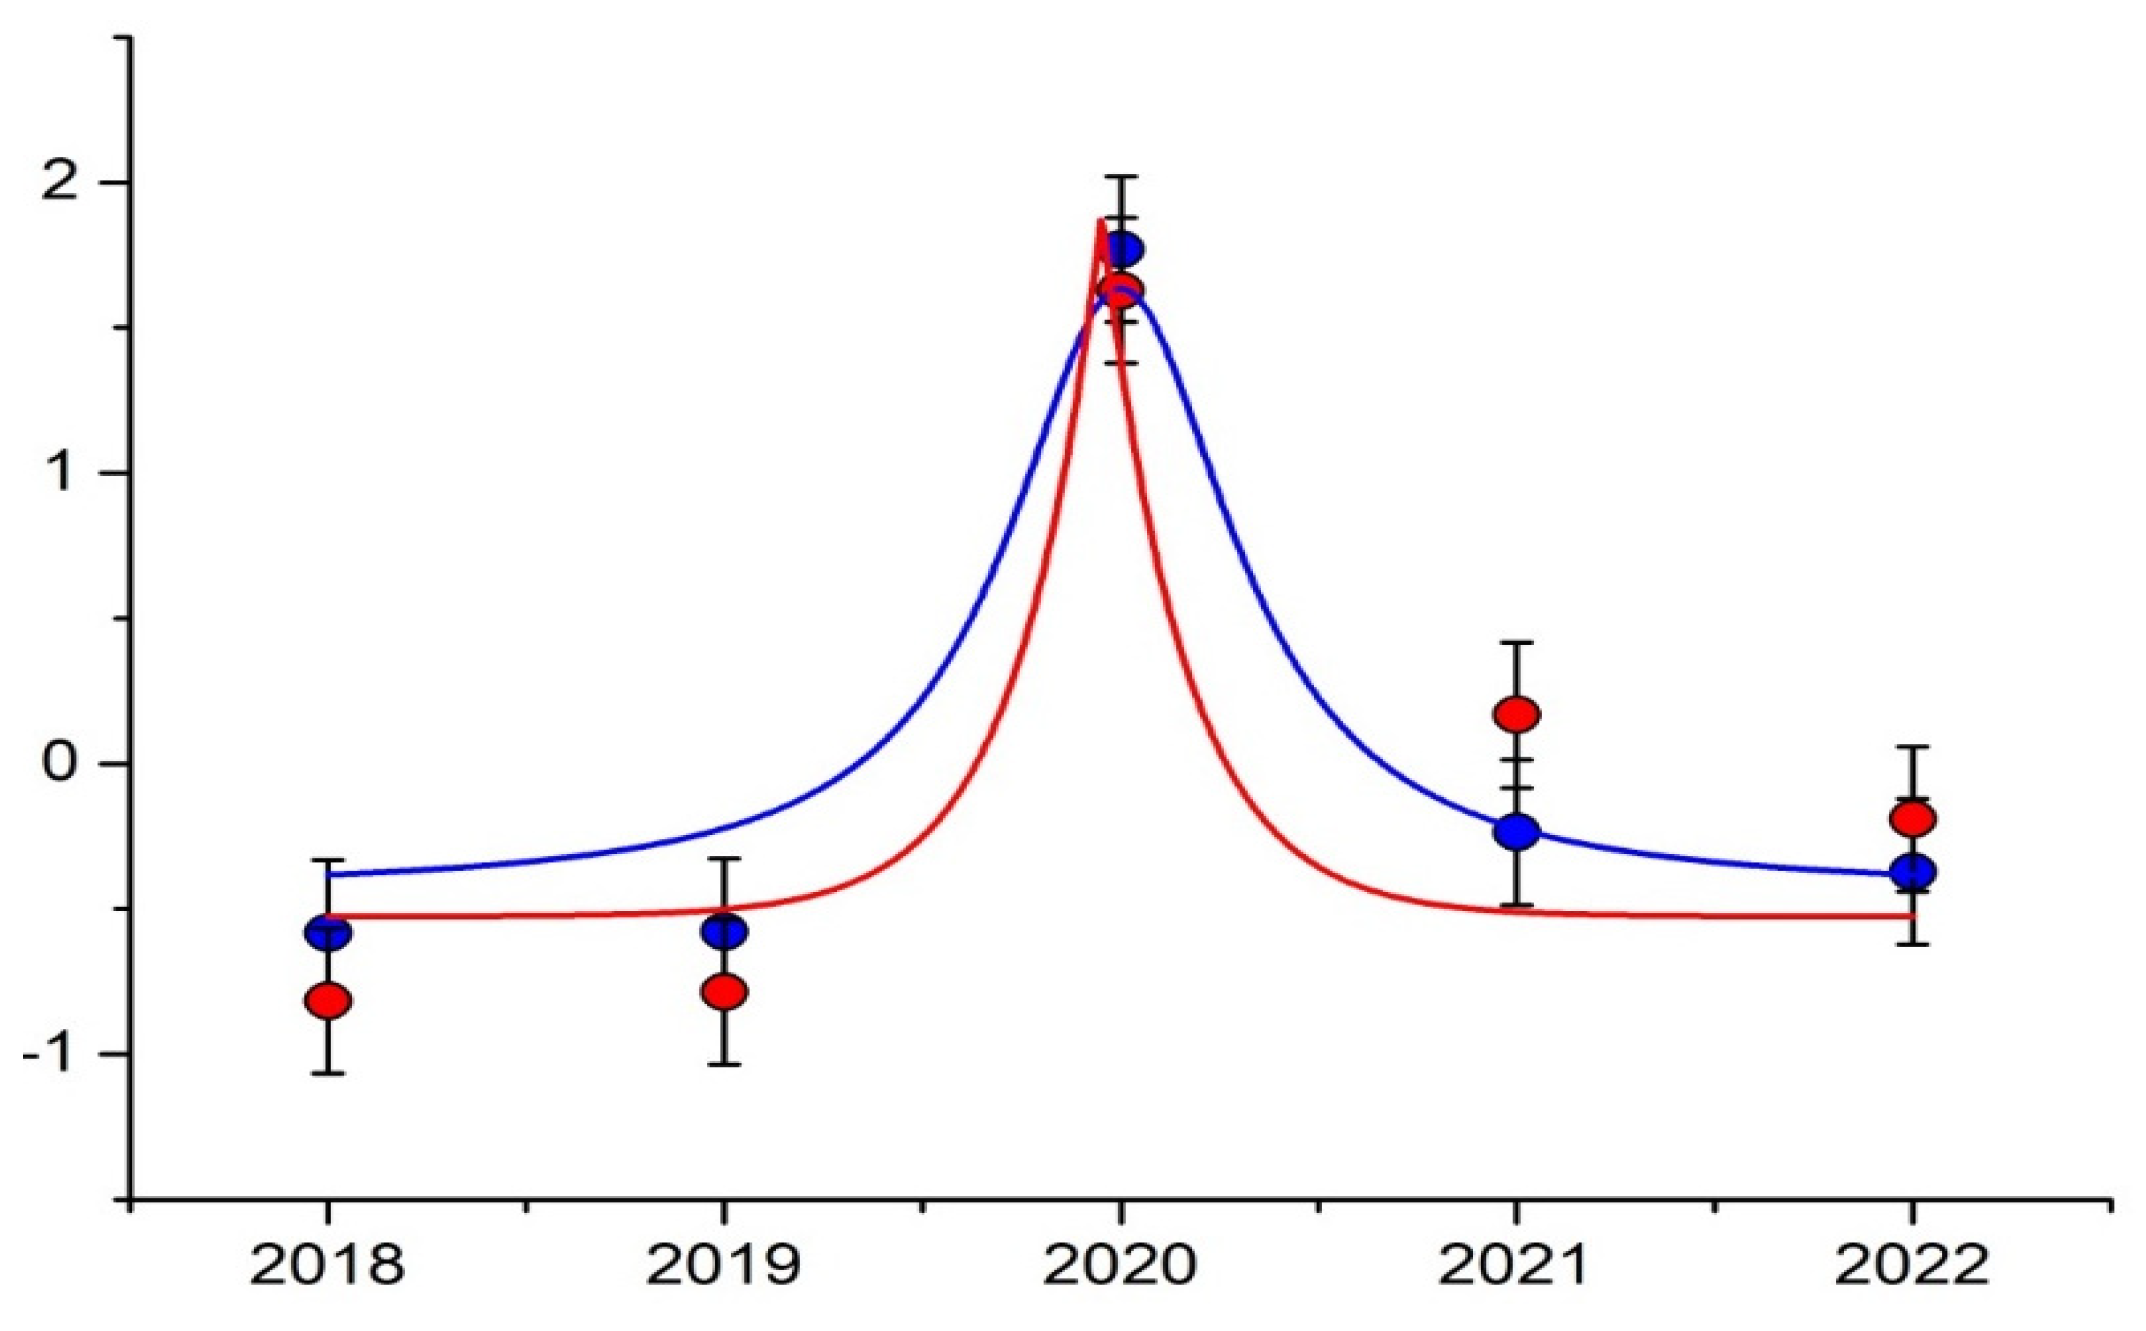
For the savings of owners, we take the normalized net profit of the enterprise multiplied by the marginal propensity of ‘owners’ to save. We take the normalized expenditure of the unit on compensation of employees, adjusted for the marginal propensity to save, as the savings of employees. The dynamics of the normalized savings of business owners and employees in 2018–2022 are presented in Figure 5 and Figure 6.
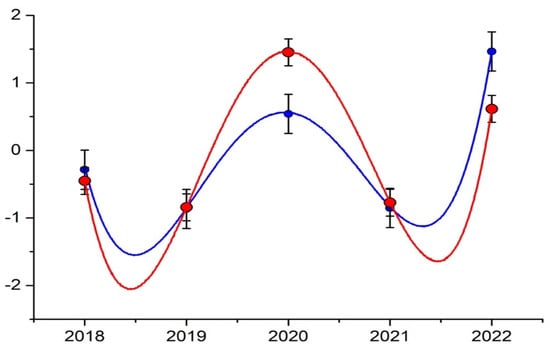
Figure 5.
Dynamics of normalized savings of owners of a business entity in 2018–2022 (blue curve—theoretical savings, red curve—actual savings).
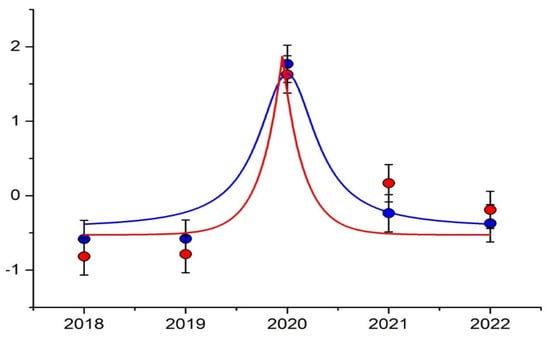
Figure 6.
Dynamics of normalized savings of employees of an economic entity in 2018–2022 (blue curve—theoretical savings, red curve—actual savings).
Figure 5 and Figure 6 show that the dynamics of the standardized savings of entrepreneurs and workers calculated by the mathematical model replicate the dynamics of the standardized actual savings. Therefore, the nature of the convergence of the curves allows us to declare the appropriateness of the model of a simple two-sector (private closed) economy.
6. Discussion
This study included the development of a methodology for calculating the amount of state financial support to small- and medium-sized enterprises. So far, only a few studies have been devoted to this problem. Comparing the results with other studies, the following conclusions can be drawn. Previous research efforts have mainly focused on assessing the impact of R&D grants (Butler et al. 2010; Crepon and Duguet 2003; Pfeiffer and Reize 2000), employment (Cingano et al. 2023; Branstetter et al. 2023; Tübbicke 2024), and the effectiveness of supporting SMEs in their development stage (Lin and Zhang 2024; Branstetter et al. 2023; Walker et al. 2024). We agree with the study (Dvouletý et al. 2021) that empirical data on the impact of financial support on business development are still insufficient.
Some studies (Bloom et al. 2020; Bennedsen et al. 2020; Tonetto et al. 2024) examined the effectiveness of different policies and instruments of state financial support during the COVID-19 pandemic and in the post-pandemic period for large and small firms. Zhemkova found that government support tended to target more productive and growing firms rather than declining or ‘zombie’ firms. Such state support should not lead to distortionary effects and a reduction in the efficiency of resource allocation between more- and less-productive firms.
However, questions about the effectiveness and appropriateness of various support measures are raised by the significant amounts of public funds allocated to support the economy and the potential negative consequences of support related to its distortionary effects (Zhemkova 2023).
Transparency and accessibility of the methodology for assessing the amount of financial support to all potential recipients is a prerequisite for an effective system of state financial support. We agree with the findings (Srhoj et al. 2020) that in the formation of an effective system of state financial support, not only the amount of support but also the characteristics of the enterprises that receive support are important (Srhoj et al. 2020; Zhemkova 2023).
We also agree with a number of researchers who argue that the subsidies provided do not always have the expected impact (OECD et al. 2016) and risk crowding out private investment (Dvouletý et al. 2021).
Our research has shown that the effectiveness of state financial support for entrepreneurs is enhanced up to a certain point. Biagi et al. (2015) showed that an increase in the amount of subsidies has a greater impact on firm performance indicators. In our study, on the other hand, we emphasize that there are intervals of state financial support amounts in which support is effective. Outside these intervals, financial support is ineffective and results in an inappropriate increase in government spending on support for small- and medium-sized enterprises without an adequate economic return. In addition, at the micro level, there is no reduction in the amount of savings spent by employees, no reduction in the prices of goods, and no increase in the volume of production.
The main difference in our study is that, in the proposed model, we can calculate the amount of financial support that will prevent inefficient spending of budget funds and the crowding-out effect of private investment. At the theoretical level, the developed model makes a significant contribution to the development of the methodological apparatus of state financial support to business entities. It complements existing approaches to determining the optimal amount of state financial support.
7. Conclusions
In this study, a mathematical model of a simple two-sector economy (private closed economy) has been constructed in a single-product approximation for the cases in which there is no governmental financial support to business units and for the cases in which it is provided. It is shown that governmental financial support can be provided in three directions: unpaid expenditure, governmental financial support to employees, and investment in current assets.
It is shown that in the case of unaddressed issues or governmental financial support to employees to stimulate demand for qualitative changes in the economic structure of society, significant injections of financial resources are required, which cannot be compared with the economic nature of financial support. On the other hand, when providing governmental financial support in the form of investments in current assets, it is possible to determine such intervals of the amount of governmental financial support within which the so-called highly productive state is achieved. Employee savings and prices of goods (services) decrease; on a qualitative level, the welfare of the population improves. On the other hand, it means that more is produced. Conversely, there is a level of support beyond which the economy leaves a highly productive state: price inflation begins, business owners are enriched, and an inappropriate expansion of budgetary expenditure is observed.
Theoretical, probabilistic, and statistical approaches to its evaluation confirm the appropriateness of the model presented. The constructed mathematical model also has several competitive applied advantages. The model can be used to justify the feasibility and effectiveness of using support measures for different areas of activity of business units. The proposed mathematical model allows us to identify the industries where the specified supporting measures will be most effective and where they will fail to produce results.
The results of this study permit the formulation of a number of recommendations for both government bodies and business entities. The optimal amount of state financial support for a given beneficiary can be determined by mathematical modeling of state financial support for business entities. This makes it possible to fully implement the principles of the efficient use of budget funds, targeting, and the targeted nature of budget funds as principles of the construction of the state budget system.
However, we do not claim that using a mathematical model of state financial support should replace checking its effectiveness. In addition, the introduction of the developed mathematical model should not cancel the prescoring of economic entities for the right to receive state financial support. If the country has high institutional barriers to receiving state financial support, no model for calculating the amount of state financial support for business entities will work and help ensure a multiplier effect.
Such institutional barriers include the large number of documents required to obtain state financial support, the long time it takes to consider a company’s application for support, which leads to a delay in the growth of economic activity, and the lack of electronic document flow between the state and business entities. These institutional barriers can be eliminated by a unified intelligent information system that, on the one hand, provides information on the conditions and procedures for obtaining all measures of state financial support in the country.
On the other hand, a personal account of the business entity is established. The ability to directly submit an application and track its status should be among the features of the personal account. It is difficult for business entities to use a mathematical model without access to the appropriate software or an intelligent information system without integrated program code. We understand that the probability of hiring a programmer or entering into a separate contract for the numerical implementation of a mathematical model is reduced to zero. As a result, we emphasize the need for integration of the presented mathematical model into the state intelligent information system. In this case, an enterprise can easily calculate the available amount of state financial support after entering the input data from financial and management reporting.
A modification and complication of the intelligent information system can also be the integration of machine learning algorithms into it. These algorithms make it possible to generate management recommendations for each specific business entity in order to increase the possible amount of support it can receive. In general, the transparency of economic policy and confidence in it can be increased by using a single methodology for calculating the amount of state financial support for all organizations.
As a result, the model allows the determination of the optimal not-to-exceed amount of support for business entities, the identification of the effectiveness of the measures that were used in the past, and the possibility of their use in the future (in the case of the forecast of input parameters).
Thus, the proposed algorithm is a new approach to the calculation of the optimal not-to-exceed amount of governmental financial support for business entities. The principles of this approach include practical feasibility, considering external and internal environmental factors, universality, and transparency. The results obtained during this study are bidirectional. Firstly, they can be used by government authorities in the development of methods for the calculation of the optimal not-to-exceed amount of governmental financial support and their subsequent implementation in intelligent digital information platforms for the support of business entities. Secondly, when determining the maximum optimal not-to-exceed amount of governmental financial support, the results of mathematical modeling can also be used by business entities. Based on the conclusions drawn, it is possible to formulate appropriate organizational and managerial recommendations on the mechanism of optimal distribution of governmental financial support in the country in conditions of an unstable external environment.
The prospects for further research are seen in the extension of the model to a model of a three-sector economy through the inclusion of the tax rate. Furthermore, the model can consider not only direct taxes (on profit or income) but also indirect taxes (VAT, excise, and others, depending on the composition of a country’s tax system). This transformation of the model will allow the assessment of the effectiveness of the provision of not only direct financial support measures but also a range of tax support measures to business units.
Moreover, within the framework of the presented model, it is possible to divide society not only into entrepreneurs and employees but also into pensioners, employees of state and municipal enterprises, employees of budgetary organizations (kindergartens, schools, hospitals), government machinery, etc. On the one hand, a separate area of the model is devoted to the assessment of the effectiveness of the provision of direct financial support measures, as well as a range of tax support measures.
On the other hand, the identification of methods for calculating the multiplier effect of state financial support and its calculation through the example of specific business entities using the developed model can be a separate area of research.
Author Contributions
Conceptualization, K.A.Z. and D.A.M.; methodology, K.A.Z.; software, D.A.M.; validation, K.A.Z., D.A.M. and E.A.K.; formal analysis, E.A.K.; investigation, K.A.Z., D.A.M. and E.A.K.; resources, K.A.Z. and D.A.M.; data curation, D.A.M.; writing—original draft preparation, K.A.Z., D.A.M. and E.A.K.; writing—review and editing, K.A.Z., D.A.M. and E.A.K.; visualization, K.A.Z. and D.A.M.; supervision, K.A.Z.; project administration, K.A.Z.; funding acquisition, K.A.Z. All authors have read and agreed to the published version of the manuscript.
Funding
This research was funded by Russian Science Foundation, grant number 23-28-01690, https://rscf.ru/project/23-28-01690/ (accessed on 16 July 2024), University of Tyumen.
Institutional Review Board Statement
Not applicable.
Informed Consent Statement
Not applicable.
Data Availability Statement
The data used to support the findings of this study are available from the corresponding author upon request.
Conflicts of Interest
The authors declare no conflicts of interest. The funders had no role in the design of the study; in the collection, analyses, or interpretation of data; in the writing of the manuscript; or in the decision to publish the results.
References
- Aristei, David, Alessandro Sterlacchini, and Francesco Venturini. 2016. Effectiveness of R&D Subsidies During the Crisis: Firm-Level Evidence Across EU countries. Economics of Innovation and New Technology 26: 554–73. [Google Scholar] [CrossRef]
- Assidi, Soufiene, Khaoula Aliani, and Mohamed Ali Omri. 2016. Tax Optimization and the Firm’s Value: Evidence from the Tunisian Context. Borsa Istanbul Review 16: 177–84. [Google Scholar] [CrossRef]
- Backman, Mikaela, Todd Gabe, and Charlotta Mellander. 2016. T Effects of Human Capital on the Growth and Survival of Swedish Businesses. Journal of Regional Analysis and Policy 46: 22–38. [Google Scholar]
- Bennedsen, Morten, Birthe Larsen, Ian Schmutte, and Daniela Scur. 2020. Preserving Job Matches During the COVID-19 Pandemic: Firm-Level Evidence on the Role of Government Aid. Working Paper. Essen: Global Labor Organization. [Google Scholar]
- Berger, Marius, and Hanna Hottenrott. 2021. Start-Up Subsidies and the Sources of Venture Capital. Journal of Business Venturing Insights 16: e00272. [Google Scholar] [CrossRef]
- Bernini, Cristina, and Federica Galli. 2024. Economic and Environmental Efficiency, Subsidies and Spatio-Temporal Effects in Agriculture. Ecological Economics 218: 108120. [Google Scholar] [CrossRef]
- Bertoni, Fabio, Jose Martí, and Carmelo Reverte. 2019. The Impact of Government-Supported Participative Loans on the Growth of Entrepreneurial Ventures. Research Policy 48: 371–84. [Google Scholar] [CrossRef]
- Bia, Michela, and Alessandra Mattei. 2012. Assessing the Effect of the Amount of Financial Aids to Piedmont firms Using the Generalized Propensity Score. Statistical Methods & Applications 21: 485–516. [Google Scholar] [CrossRef]
- Biagi, Federico, Daniele Bondonio, and Alberto Martini. 2015. Counterfactual Impact Evaluation of Enterprise Support Programmes. Evidence from a Decade of Subsidies to Italian Firm. Paper presented at the 55th Congress of the European Regional Science Association: “World Renaissance: Changing Roles for People and Places”, Lisbon, Portugal, August 25–28. [Google Scholar]
- Bloom, Nicholas, Philip Bunn, Paul Mizen, Pawel Smietanka, and Gregory Thwaites. 2020. The Impact of COVID-19 on Productivity. NBER Working Paper No. w28233. Cambridge: National Bureau of Economic Research, pp. 1–45. [Google Scholar]
- Branstetter, Lee G., Guangwei Li, and Mengjia Ren. 2023. Picking Winners? Government Subsidies and Firm Productivity in China. Journal of Comparative Economics 51: 1189–99. [Google Scholar] [CrossRef]
- Bruhn, Miriam, Dean Karlan, and Antoinette Schoar. 2012. The Impact of Consulting Services on Small and Medium Enterprises: Evidence from a Randomized Trial in Mexico. Journal of Political Economy 126: 635–87. [Google Scholar] [CrossRef]
- Burger, Anže, and Matija Rojec. 2018. Impotence of Crisis-Motivated Subsidization of Firms: The Case of Slovenia. Eastern European Economics 56: 1–27. [Google Scholar] [CrossRef]
- Butler, Johnnella E., Robert Doktor, and Frederick A. Lins. 2010. Linking International Entrepreneurship to Uncertainty, Opportunity Discovery and Cognition. Journal of International Entrepreneurship 8: 121–34. [Google Scholar] [CrossRef]
- Cadil, Vladislav, Tomas Ratinger, and Sylvester Agyemang. 2020. Are There Any Economic Impacts of Business R&D Support? The Case of the Czech Republic. Central European Business Review 9: 45–62. [Google Scholar] [CrossRef]
- Caloffi, Annalisa, Marco Mariani, Federica Rossi, and Margherita Russo. 2018. A Comparative Evaluation of Regional Subsidies for Collaborative and Individual R&D in Small and Medium-Sized Enterprises. Research Policy 47: 1437–47. [Google Scholar] [CrossRef]
- Charfeddine, Lanouar, and Sana Zaouali. 2022. The Effects of Financial Inclusion and the Business Environment in Spurring the Creation of Early-Stage Firms and Supporting Established Firms. Journal of Business Research 143: 1–15. [Google Scholar] [CrossRef]
- Cingano, Federico, Filippo Palomba, Paolo Pinotti, and Enrico Rettore. 2023. Granting More Bang for the Buck: The Heterogeneous Effects of Firm Subsidies. Labour Economics 83: 102403. [Google Scholar] [CrossRef]
- Colombo, Massimo G., and Luca Grilli. 2005. Founders’ Human Capital and the Growth of New Technology-Based Firms: A Competence-Based View. Research Policy 34: 795–816. [Google Scholar] [CrossRef]
- Colombo, Massimo G., Evila Piva, and Cristina Rossi. 2014. Open Innovation and Within-Industry Diversification in Small and Medium Enterprises: The Case of Open Source Software Firms. Research Policy 43: 891–902. [Google Scholar] [CrossRef]
- Crepon, Bruno, and Emmanuel Duguet. 2003. Bank Loans, Start-Up Subsidies and the Survival of the New Firms: An Econometric Analysis at the Entrepreneur Level. Working Paper. Paris: University of Paris. [Google Scholar] [CrossRef]
- Criscuolo, Chiara, Ralf Martin, Henry G. Overman, and John V. Reenen. 2019. The Causal Effects of An Industrial Policy. American Economic Review 109: 48–85. [Google Scholar] [CrossRef]
- Czarnitzki, Dirk, and Julie Delanote. 2015. R&D Policies for Young SMEs: Input and Output Effects. Working Paper. Mannheim: ZEW—Leibniz Centre for European Economic Research. [Google Scholar]
- Decramer, Stefaan, and Stijn Vanormelingen. 2016. The Effectiveness of Investment Subsidies: Evidence from a Regression Discontinuity Design. Small Business Economics 47: 1007–32. [Google Scholar] [CrossRef]
- Dvouletý, Ondrej, Stjepan Srhoj, and Smaranda Pantea. 2021. Public SME Grants and Firm Performance in European Union: A Systematic Review of Empirical Evidence. Small Business Economics 57: 243–63. [Google Scholar] [CrossRef]
- Fan, Xueyuan, Shukuan Zhao, Dong Shao, Shuang Wang, and Bochen Zhang. 2024. Talking and Walking: Corporate Digital Transformation and Government Subsidies. Finance Research Letters 64: 105444. [Google Scholar] [CrossRef]
- González, Xulia, and Consuelo Pazó. 2008. Do Public Subsidies Stimulate Private R&D Spending? Research Policy 37: 371–89. [Google Scholar] [CrossRef]
- Guo, Libin, Qianqian Zhang, Jun Wu, and Ernesto D. R. Santibanez Gonzalez. 2024. An Evolutionary Game Model of Manufacturers and Consumers’ Behavior Strategies for Green Technology and Government Subsidy in Supply Chain Platform. Computers & Industrial Engineering 189: 109918. [Google Scholar] [CrossRef]
- Heiner, Ronald. 1990. Rule-Governed Behavior in Evolution and Human Society. Constitutional Political Economy 1: 19–46. [Google Scholar] [CrossRef]
- Honda, Tomohito, Kaoru Hosono, Daisuke Miyakawa, Arito Ono, and Iichiro Uesugi. 2023. Determinants and Effects of the Use of COVID-19 Business Support Programs in Japan. Journal of the Japanese and International Economies 67: 101239. [Google Scholar] [CrossRef]
- Huber, Peter, Harald Oberhofer, and Michael Pfaffermayr. 2017. Who creates jobs? Econometric modeling and evidence for Austrian firm level data. European Economic Review 91: 57–71. [Google Scholar] [CrossRef]
- Hud, Martin, and Katrin Hussinger. 2015. The impact of R&D subsidies during the crisis. Research Policy 44: 1844–55. [Google Scholar] [CrossRef]
- Kállay, László, and Tibor Takács. 2023. The Impact of Public Subsidies on Investment and Growth: Policy About Evaluation, Selection and Monitoring. Journal of Policy Modeling 45: 895–909. [Google Scholar] [CrossRef]
- Lin, Boqiang, and Aoxiang Zhang. 2024. Impact of Government Subsidies on Total Factor Productivity of Energy Storage Enterprises Under Dual-Carbon Targets. Energy Policy 187: 114046. [Google Scholar] [CrossRef]
- Liu, Xiaolu, Xiaoyu Li, and Honglin Li. 2016. R&D Subsidies and Business R&D: Evidence from High-Tech Manufacturing Firms in Jiangsu. China Economic Review 41: 1–22. [Google Scholar] [CrossRef]
- McKenzie, David, Nabila Assaf, and Ana Cusolito. 2016. The Additionality Impact of a Matching Grant Programme for Small Firms: Experimental Evidence from Yemen. Journal of Development Effectiveness 9: 1–14. [Google Scholar] [CrossRef]
- Mueller, Christoph E. 2023. Startup Grants and the Development of Academic Startup Projects During Funding: Quasi-Experimental Evidence from the German ‘EXIST–Business Startup Grant’. Journal of Business Venturing Insights 20: e00408. [Google Scholar] [CrossRef]
- Munch, Jakob R., and Georg Schaur. 2018. The Effect of Export Promotion on Firm-Level Performance. American Economic Journal: Economic Policy 10: 357–87. [Google Scholar] [CrossRef]
- Nguyen, Harvey, Anh Viet Pham, Man Duy (Marty) Pham, and Mia Hang Pham. 2023. Business Resilience: Lessons from Government Responses to the Global COVID-19 Crisis. International Business Review 32: 102166. [Google Scholar] [CrossRef]
- OECD, EU, EBRD, ETF, and SEECEL. 2016. SME Policy Index: Western Balkans and Turkey 2016: Assessing the Implementation of the Small Business Act for Europe. SME Policy Index. Paris: OECD Publishing. [Google Scholar] [CrossRef]
- Ogujiuba, Kanayo K., Ebenezer Olamide, Azikiwe I. Agholor, Estelle Boshoff, and Phetole Semosa. 2022. Impact of Government Support, Business Style, and Entrepreneurial Sustainability on Business Location of SMEs in South Africa’s Mpumalanga Province. Administrative Sciences 12: 117. [Google Scholar] [CrossRef]
- Ogujiuba, Kanayo K., Maria Eggink, and Ebenezer Olamide. 2023. Impact of Elements of Finance and Business Support on the SME Business Ecosystem in South Africa: An Econometric Analysis. Sustainability 15: 8461. [Google Scholar] [CrossRef]
- Okorie, David I., and Presley K. Wesseh, Jr. 2024. Fossil Fuel Subsidy Removal, Economic Welfare, and Environmental Quality under Alternative Policy Schemes. Journal of Cleaner Production 450: 141991. [Google Scholar] [CrossRef]
- Pellegrini, Guido, and Teo Muccigrosso. 2016. Do Subsidized New Firms Survive Longer? Evidence from a Counterfactual Approach. Regional Studies 51: 1483–93. [Google Scholar] [CrossRef]
- Pfeiffer, Friedhelm, and Frank Reize. 2000. From Unemployment to Self-Employment–Public Promotion and Selectivity. International Journal of Sociology 30: 71–99. [Google Scholar] [CrossRef]
- Rajput, Ranjeet, and Sri V. Venkataraman. 2024. Revenue-Sharing Contract with Government Subsidy: A Case of the Indian Sugar Supply Chain. Computers & Industrial Engineering 191: 110159. [Google Scholar] [CrossRef]
- Rowse, John. 1985. On the Solution of Optimal Tax Models and Other Optimization Models in Economics. Economics Letters 18: 217–22. [Google Scholar] [CrossRef]
- Sha, Zhouhao, Dong Ren, Chengyou Li, and Zeru Wang. 2024. Agricultural Subsidies on Common Prosperity: Evidence from the Chinese Social Survey. International Review of Economics & Finance 91: 1–18. [Google Scholar] [CrossRef]
- Simon, Herbert. 1976. Administrative Behavior. New York: The Free Press. First published 1947. [Google Scholar]
- Simon, Herbert, Donald W. Smithburg, and Victor A. Thompson. 2017. How Governmental Organizations Originate. In Public Administration, 1st ed. New York: Routledge. [Google Scholar] [CrossRef]
- Skrinjaric, Bruno, Sonja Radas, and Stjepan Srhoj. 2021. Bidding Against the Odds? The Impact Evaluation of Grants for New Firms During the Recession. Small Business Economics 56: 83–103. [Google Scholar] [CrossRef]
- Soeparna, Intan I., and Ankiq Taofiqurohman. 2024. Transversal Policy Between the Protection of Marine Fishery Resources and Fisheries Subsidies to Address Overfishing in Indonesia. Marine Policy 163: 106112. [Google Scholar] [CrossRef]
- Srhoj, Stjepan, Michal Lapinski, and Janette Walde. 2020. Impact Evaluation of Business Development Grants on SME Performance. Small Business Economics 57: 1285–301. [Google Scholar] [CrossRef]
- Tonetto, Jorge L., Josep M. Pique, Adelar Fochezatto, and Carina Rapetti. 2024. Survival Analysis of Small Business during COVID-19 Pandemic, a Brazilian Case Study. Economies 12: 184. [Google Scholar] [CrossRef]
- Tübbicke, Stefan. 2024. Money for Nothing? Evidence on the Effects of Start-Up Subsidies on Transitions from Unemployment to Self-Employment. Economics Letters 235: 111539. [Google Scholar] [CrossRef]
- Vigani, Mauro, Amr Khafagy, and Robert Berry. 2024. Public Spending for Agricultural Risk Management: Land Use, Regional Welfare and Intra-Subsidy Substitution. Food Policy 123: 102603. [Google Scholar] [CrossRef]
- Walker, Christine C., Angela Druckman, and Tim Jackson. 2024. Growth Dependency in the Welfare State–an Analysis of Drivers in the UK’s Adult Social Care Sector and Proposals for Change. Ecological Economics 220: 108159. [Google Scholar] [CrossRef]
- Wilkie, Joshua. 2004. Numerical Methods for Stochastic Differential Equations. American Physical Society 70: 017701. [Google Scholar] [CrossRef] [PubMed]
- Yu, Feifei, Hongyan Du, Xiaotong Li, and Jiayu Cao. 2023. Enterprise Digitalization, Business Strategy and Subsidy Allocation: Evidence of the Signaling Effect. Technological Forecasting and Social Change 190: 122472. [Google Scholar] [CrossRef]
- Zhao, Lin, Kim M. Chong, Leong-Mow Gooi, and Luqing Yan. 2024. Research on the Impact of Government Fiscal Subsidies and Tax Incentive Mechanism on the Output of Green Patents in Enterprises. Finance Research Letters 61: 104997. [Google Scholar] [CrossRef]
- Zhemkova, Aleksandra. 2023. The Impact of Government Support on Firms’ Productivity during COVID-19. HSE Economic Journal 27: 481–505. [Google Scholar] [CrossRef]
Disclaimer/Publisher’s Note: The statements, opinions and data contained in all publications are solely those of the individual author(s) and contributor(s) and not of MDPI and/or the editor(s). MDPI and/or the editor(s) disclaim responsibility for any injury to people or property resulting from any ideas, methods, instructions or products referred to in the content. |
© 2024 by the authors. Licensee MDPI, Basel, Switzerland. This article is an open access article distributed under the terms and conditions of the Creative Commons Attribution (CC BY) license (https://creativecommons.org/licenses/by/4.0/).