Abstract
The minimum wage has become a standard measure in the economic and social policies of countries all over the world. The primary objective of this measure is to guarantee that workers receive a minimum wage that allows them to lead a decent life, thereby reducing inequality and poverty. However, studies on the minimum wage have not focused on assessing the effects on these dimensions but only on employment. The objective of this study is to address this research gap by analysing the effects of minimum wage increases on income inequality and poverty. To this end, firstly, a systematic review of the empirical analyses was conducted using the PRISMA methodology, with a view to ensuring that all empirical evidence was available. Secondly, the Spanish case was examined. The significant increase in minimum wage in Spain in 2019 (21.3% in real terms) presents an invaluable opportunity to utilise this event as a natural experiment to generate new evidence. A difference-in-differences approach was employed to assess the impact of this phenomenon in the period 2018–2019 with microdata from European Statistics on Income and Living Conditions (EU-SILC for Spain). In doing so, two basic scientific contributions were made. The first one, a systematic, exhaustive, and up-to-date literature review (up to June 2024), as there is, to our knowledge, no recent systematic review of this relationship (minimum wage vs. inequality). The available evidence indicates a clear inverse relationship between the minimum wage and inequalities and poverty. The second one, regarding the Spanish case, there has been a dearth of scientific studies on this subject. Thus, this paper provides new scientific evidence demonstrating that a significant increase in the minimum wage can significantly improve the income of low-wage earners, thereby reducing income inequality and in-work poverty. Furthermore, there is evidence of a spillover effect towards income groups closer to the treatment group.
Keywords:
minimum wage; MW; inequality; poverty; systematic review; PRISMA; difference-in-differences; Spain 1. Introduction
The minimum wage (MW) has been a subject of interest to researchers, politicians, trade unions, and the general public since the beginning of the 20th century. Indeed, there were significant protests and strikes from the late 19th and early 20th century against the low wages paid to workers and in favour of guaranteeing by law a fair wage that would at least allow a minimally decent life for workers and their families. Since that time, governments in countries across the globe have implemented MW regulations.1 Indeed, the MW has become a standard measure in the economic and social policy of every country in the world (according to the International Labour Organization (ILO), at least 90% of ILO member countries have a national minimum wage and the rest, at least, a regional or local minimum wage). The proportion of the labour force directly or indirectly affected by the MW is estimated to be between 20% and 30% (Belman and Wolfson 2014). This encompasses not only those who earn the MW but also those who earn more through the so-called “spillover effect” and even workers in the informal sector through the so-called “lighthouse effect”. The resurgence of this measure in recent decades is also related to the growing concern of governments about rising inequality and poverty in both rich and developing countries. The consequences of this effect are significant, with social and political instability being notable. Inequality and poverty are arguably the most important economic and social problems in the world, in addition to environmental concerns.
The minimum wage is defined as “the minimum sum payable to a worker for work performed or services rendered, within a given period, whether calculated on the basis of time or output, which may not be reduced either by individual or collective agreement, which is guaranteed by law and which may be fixed in such a way as to cover the minimum needs of the worker and his or her family, in the light of national economic and social condition” (ILO 2014). The aims and objectives of the minimum wage are typically described in the regulations that govern the measure. The overarching objective is social justice, which is determined by each individual receiving fair economic compensation for their work. This compensation should, at a minimum, allow the individual to live in dignity. The mere existence of workers who are paid less than a decent living wage (in-work poverty) is an undesirable situation, not only because it leads to social injustice but also because the dumping effect in turn impacts the companies that do pay a fair wage. The amount of the MW has been the subject of intense debate. The question of defining what is meant by “a decent standard of living” is therefore of great importance. In Europe, the concept of a “decent standard of living” is defined in the European Social Charter (ESC) article 4, with the interpretation of the Committee of Social Rights (ECSR) serving to guarantee its fulfilment. This threshold was established in 1998 at 60% of the average net salary of each country, with non-compliance being defined as occurring at 50% of the net salary.2
Despite these clear objectives, the scientific discussion in Economics focused on the controversy throughout the 20th century as to whether a rise in minimum wages could distort the so-called “competitive labour market” and lead to a reduction in employment that would cause the disappearance of any improvement for workers, according to the model of perfect competition elaborated by (Stigler 1946). It should be noted that this theory is based on theoretical assumptions that are far detached from reality.
The existing literature on the effects of MW increase on inequality and poverty is limited, particularly in terms of empirical analyses. Thus, the present contribution aims to address this gap in the literature. To this end, two objectives were set: firstly, to carry out a systematic, exhaustive, and unbiased review of the empirical analyses on this issue; and secondly, to analyse a specific case that provides new evidence on the subject (the Spanish case), given that from 2019 onwards there has been an important change in the minimum wage policy in Spain, which includes a very significant increase in its amount (21.3% in real terms). At the same time, empirical studies on the impact of the MW on inequality and poverty in Spain are almost non-existent; to date, there have been only a few institutional technical reports on the subject.
For this purpose, the methodology applied was twofold. First, a systematic literature review was conducted using the PRISMA methodology (already used in previous studies (De Paz-Báñez et al. 2020) to enable the collection of all empirical studies on the effect of the MW on inequality and poverty in an exhaustive and unbiased manner. Given the existence of other reviews on the subject, although not systematic or up to date, the results of these reviews were collected and complemented with an exhaustive analysis of the latest years (2020–2024), for which there is no literature review to our knowledge (for a summary of the application specifications for this case, see Appendix A). Secondly, the Spanish case in 2019 was treated as a natural experiment using the difference-in-differences methodology, applying an OLS regression analysis, in the period 2018–2019 with microdata from European Statistics on Income and Living Conditions (EU-SILC for Spain). The aim of this study was to see whether a substantial increase in the MW, as occurred in Spain in 2019, would have a significant effect on income inequality, especially in the bottom tail of the distribution, as indicated in some of the literature, or whether, on the contrary, this effect would be masked by other undesirable effects, as indicated in other studies on the subject (see point 2). Such an effect was clearly in favour of the first option.
Thus, in this article, two new basic scientific contributions are made: an exhaustive, current, unbiased literature review, given that there is to our knowledge no comprehensive review of this relationship—MW vs. inequality—up to 2024, which allowed us to establish the state of the art so far; and, secondly, new empirical evidence is provided to show that a large increase in MW can greatly improve the lives of low-wage workers without side effects that interfere with this positive effect, the negative effects on employment being small or non-existent.
In what follows, first, the systematic review of the effect of the MW changes on inequality and poverty is presented, focusing on the empirical analyses (Section 2), followed by a summary of the specificities of the Spanish case (Section 3). Then, the empirical analysis is carried out to determine the effects of the large increase in 2019 on the income inequality of the affected workers (Section 4). In Section 5, the results are discussed, followed by an analysis of their practical implications (Section 6) and by the conclusions.
2. Systematic Review of Empirical Studies on the Effects of MW on Inequality and Poverty
Until the end of the 1980s, there was a scarcity of empirical studies in the field of economics, and they played a marginal role, dependent on theoretical studies. They served only to confirm some predictions of the theories or to estimate parameters of a theoretical model that was taken as true.
The most commonly used method was time series regression. From the beginning of the 1990s, the number of empirical analyses began to increase, and the role of these studies changed, taking on a more prominent character and a different objective: to check whether the theories in use were correct or not, whether there was sufficient empirical evidence to support them, or, on the contrary, whether they should be refuted and a new theory or model be sought or the existing one modified. Empirical studies ceased to be a mere adjunct to theory and became an essential part of scientific work, based on the assumption that a theory is scientific only because of empirical evidence (according to Popperian approaches). Since then, the methodology applied to these studies has become more sophisticated, with the predominance of natural and laboratory experiments with a control group, in order to be able to rule out the possibility that the changes are caused by any of the many other variables involved, which may have varied in the process and go beyond the mere correlation between variables. In fact, most of the empirical studies carried out in the field of economic sciences in recent decades have totally or partially refuted some of those theories.
In the specific case of MW, an important change occurred with the work by Card and Krueger at the beginning of the 1990s, giving rise to what has been called the New Minimum Wage Research (NMWR) (Belman and Wolfson 2014). The change in MW research since then, particularly in methodological terms, has meant that everything that was previously known, or thought to be known, about the subject had to be reconsidered. This major change has occurred not only in the promotion and greater weight given to empirical work, but especially in the strategies and designs of empirical research (Card and Krueger 2016). Thus, in recent decades, a large number of theoretical and empirical studies have been produced with varying results. See, for example, the literature reviews and meta-analyses by (Allegretto et al. 2017; Belman and Wolfson 2014; Brown et al. 1982; Brown 1999; Dube 2019a; Neumark and Wascher 2008; Neumark et al. 2014; Neumark and Shirley 2022). However, the vast majority of these studies have focused on the effect of the minimum wage on employment.
2.1. Systematic Review Up to 2019
Studies on the impact of the MW on inequality and poverty are scarce, despite this effect being the main objective of the measure. The work that is usually considered to be the first to have carried out an empirical analysis of the impact of the MW on household income is that by (Gramlich et al. 1976), which reflects a major controversy between economists and politicians and between traditional economists and what he calls “radicals”. However, it was not until the early 1990s that more systematic studies were developed. The book by Card and Krueger (1995) provided a comprehensive review of previous studies on the subject and concluded that increases in the minimum wage had led to a reduction in wage inequality and an increase in the earnings of low-income workers and families. Despite the controversial nature of this claim, given that the opposite was believed at the time, subsequent studies have since confirmed this conclusion.
Indeed, since then, the impact of minimum wages on the wage distribution has been the subject of a number of empirical studies, focusing mainly on the US. Perhaps the most cited one is the study by DiNardo et al. (1996) who, for the period 1973–1988, concluded that the real decline in the MW was the source of a quarter of the increase in inequality in the US during that period. Freeman (1996) conducted a comprehensive review of the effects on wage distribution and concluded that minimum wages could help to improve the welfare of the lowest paid and to limit wage inequality. Lee (1999) concluded that minimum wages had relatively large effects on the distribution of wages, due in part to the “spillover effect” on workers paid above the MW. Autor et al. (2016) assessed the impact of federal minimum wages on the US wage distribution over the period 1979–2012 and found that the minimum wage did indeed reduce inequality at the bottom of the distribution, although the effects are smaller today than in the 1980s. They argued that Lee (1999)’s findings overstated the effect of the minimum wage, but still found evidence of spillover effects and considered them to have a significant impact on wage inequality. Both studies attributed the increased inequality in the United States to the depreciation of the value of the minimum wage. In the UK, Dickens et al. (2012) concluded that the introduction of the national minimum wage had had a strong effect at the bottom tail of UK wages, raising workers’ wages to the 35th percentile of the overall wage distribution.
There has also been research on the impact of minimum wages on family income and poverty. Dube (2019b) found thirteen studies relating minimum wages to poverty rates and also provided his own estimates. The average elasticity poverty rates of each group analysed in these studies with respect to the minimum wage was −0.18. Although the poverty rate is arguably a “fuzzy” criterion for assessing the distributional effects of minimum wages, these studies confirm that minimum wages have a poverty-reducing effect.
But perhaps the most comprehensive review on MW is provided by Belman and Wolfson (2014), with an analysis of more than 200 articles, mainly from the period 2000–2014, focusing on the most developed Western countries. They found few studies measuring the impact of the MW on inequality and poverty (specifically, 8 studies on the impact on the wage distribution and 19 on poverty). If anything, they found evidence of a reduction in inequality at the bottom of the distribution, although the evidence on poverty was less clear.
In developing countries, on the other hand, the evidence is similar, despite the weight of the informal sector and greater non-compliance with MW regulations. Studies have been carried out both when the minimum wage has risen and when it has fallen. For instance, in Mexico, (Bosch and Manacorda 2010) analysed the impact of the minimum wage on inequality between 1989 and 2001, when the Mexican minimum wage fell by around 50 per cent in relation to median earnings. Their analysis suggests that “a decrease in the real minimum wage leads to an increase in the 50/10 percentile gap of 1.4 p.p. a year and a rise in the 90–50 percentile gap of 1.8 p.p.” (p. 146). The erosion of the real value of minimum wages is “fully responsible for the observed increase in inequality at the bottom of the distribution” (pp. 143–44).
2.2. Systematic Review from 2020 to 2024
With the studies outlined above, especially those by (Belman and Wolfson 2014; Dube 2019a, 2019b), there are sufficient literature reviews to provide insight into the evidence on the influence of changes in the MW on inequality and poverty up to 2019. However, to the best of our knowledge, no further reviews exist, hence the need to conduct a comprehensive review from that date onwards.3 The PRISMA method was used as described in Appendix A. A large number of databases were searched, in particular ProQuest (47) and Columbus-UHU (140). The first search yielded more than 1600 documents, which were screened to include only peer-reviewed empirical scientific analyses from any country in the world, published at least in abstract form in English or Spanish. After screening, a total of 31 articles published between 2020 and 2024 (June) were selected and reviewed in summary form (Appendix B, Table A1).
All studies focused on changes in the MW in the years up to 2020. The countries studied were mainly the USA (6), Germany (5), Turkey (4), and Brazil (3). The remaining articles involved 8 other countries, and 4 other articles covered wider regions. It is noteworthy that no articles were found for Spain, which increases the importance of this article.4
Most research analysed the general impact of the minimum wage on wage and/or income inequality (14). However, some studies focused on more specific aspects such as: the indirect effects of the MW; the relationship between income inequality and social variables; effects on higher incomes; on the middle class; impact on gender inequality; on racial inequality; effects on formal and informal wages; on negotiated wages; and general effects on the labour market. Most of them sourced data from official agency surveys (19), either labour (6) or household living conditions surveys (9). Another 5 used administrative data.
The methodology of analysis varied widely. Some of them were descriptive (3) or applied time series regression (12). The problem encountered in these studies was that the results were prospective or defined as mere correlations between variables. Others applied simulation (5) or modelling (2), which are exploratory exercises based on sometimes unrealistic models. Only nine of them employed causal methodology with clear differentiation between treatment and control groups. Specifically, they applied the difference-in-differences methodology.
The results of more descriptive research comparing wage distributions (3) suggest that there is an inverse relationship between MW and wage and/or income inequality, especially for certain disadvantaged groups. (Cho and Yang 2021), for Korea over the period 2010 to 2020, found that MW reduced the gender pay gap.5 Also, Laporšek et al. (2021), in Slovenia, where the minimum wage increased by 22.9% in 2010, showed that the effect was greater for women, young people, and workers with lower educational attainment or low employment status.6 Beccaria et al. (2020), comparing the evolution of MW levels with those agreed in collective bargaining in Argentina, concluded that MW did not have a differential impact on the remuneration of the lower categories of each agreement.
Through simulation (5), (Long 2022), using a synthetic control approach in the absence of a direct control group, obtained different results for the US state of Seattle. Estimating the impact on the Gini and Atkinson indices for different values of the minimum wage, the results suggest that the ability of firms to replace low-skilled workers can offset wage gains, leaving income inequality unchanged. Backhaus and Müller (2023) found that neither in-work poverty nor overall disposable income inequality decreased after the introduction of the minimum wage in Germany, despite the fact that the minimum wage reform had a significant impact on the lower tail of the wage distribution. Although non-compliance affected, the main reason cited by the authors was that minimum wage earners were spread across the income distribution and not concentrated in low-income households. In the same vein, Alinaghi et al. (2020), for the New Zealand case, suggested that minimum wage policy did not appear to be particularly targeted, largely because many low-wage workers were secondary wage earners in higher-income households, while many low-income households had no wage earners at all. Grünberger et al. (2021) applying EUROMOD for 21 EU countries suggested that MW increases could significantly reduce in-work poverty, wage inequality, and the wage gap between men and women. (Engbom and Moser 2022), using an equilibrium model of the Brazilian labour market, found that the increase in MW accounted for 45 per cent of the large decrease in income inequality between 1996 and 2012. The model would predict significant spillover effects in higher incomes. At the same time, the impact of the minimum wage on employment and production was mitigated by the reallocation of workers to more productive firms.
Using time series regression (Cho and Yang 2021; Tamkoç and Torul 2020) estimate a correlation coefficient of 0.54 between the time evolution of the MW and that of the Gini index in Turkey, where estimates of wage, income, and consumption inequality show declining time trends over the 2002–2016 period, coinciding with the rapid growth of the minimum wage during this period. Engelhardt and Purcell 2021 found that the MW reduces inequality in the bottom quartile of the income distribution, and especially in the bottom decile; Sefil-Tansever and Yılmaz (2024) and Bakis and Polat (2023) also found reduction income disparities and a spillover effect in the case of Turkey. In the latter article, they found that the MW significantly reduced income disparities, especially among formal workers at the lower and upper ends of the wage distribution, and they also found evidence of a certain lighthouse effect: the minimum wage seemed to have an equalising influence on the wage structure of workers in the informal sector. Herrero-Olarte and Sosa (2020) found a correlation in Latin American countries, but with a small impact on the relationship between the increase in the MW and the increase in the lowest wages. Saboia et al. (2021), for the case of Brazil, estimated a significant effect of the MW on low and middle levels of labour income, with the largest effect between the third and seventh decile, thus improving the country’s income distribution. However, other studies found no effect of the MW on earnings in the first two deciles of the distribution, an effect attributed to labour in-formality concentrated at the bottom of the wage distribution. Herrero-Olarte (2022) estimated an insignificant impact on the poorest decile in Ecuador and a larger positive impact on the lower-middle deciles. This result is confirmed in Herrero-Olarte (2023), who deepened the analysis of the lighthouse effect, which he considers to be the main factor in reducing in-work poverty and inequality.
Joe and Moon (2020), using data from OECD countries, confirmed the existence of a correlation between minimum wage increases and a reduction in wage inequality at the bottom of the wage distribution, while having little effect at the top of the wage distribution. The estimated effect is larger for women than for men, which is consistent with the fact that the proportion of workers who are directly affected by changes in the minimum wage is higher among women than among men. They also found that the minimum wage had little effect on wage inequality at the upper end of the wage distribution.
As regards indirect effects, Chao et al. (2022) found that a 1% increase in the minimum wage led to a reduction in the Gini coefficient of about 0.025 in the short run (without a business exit effect) and 0.031 in the long run (with a business exit effect). In other words, about one-third of the reduction in the Gini coefficient in the long run is due to the indirect effect of minimum wages through the business exit channel. Fortin et al. (2021) also found correlations between the decrease in the MW and the increase in inequality. Indirect (spillover) effects substantially increased the impact of decreased real minimum wage on increased inequality in the US over the period 1979–1988.
Finally, in South Africa, following a sharp 52% increase in the minimum wage in 2013, in an economy where 90% of agricultural workers were paid below the new minimum wage level prior to the implementation date, Bassier and Ranchhod (2024) suggest that compliance decreased as the gap between the minimum wage and the pre-implementation wage increased. They estimated that agricultural workers experienced an average wage increase of 9% as a result of the MW policy.
Some studies used statistical modelling to analyse causal relationships (DiNardo et al. 1996). Sari and Purwono (2021) applied cointegration and long-run structural vector autoregression (SVAR) in the Indonesian context. While focusing on modelling the relationship between income inequality and social variables, they concluded that increasing the minimum wage can reduce income inequality and morbidity, and increase education and per capita income. (Bükey 2022) used the ARDL (Autoregressive Distributed Lag) method in the Turkish case and found that a 1% increase in the minimum wage reduced the Gini coefficient by 0.061%, while a 1% increase in private sector wages increased the Gini coefficient by 0.051%. This finding suggests that minimum wage policies play an important role in reducing inequality, even though wage increases in the private sector may increase inequality. They find a bidirectional causal relationship both from the minimum wage to private sector wages and from private sector wages to the minimum wage. It can therefore be said that there is a spiral effect between the minimum wage and the overall wage level in the private sector.
Only nine articles (see Table 1) provided empirical evidence on the causal relationship between MW and its effects found using the difference-in-differences approach with a control group. Only one of them used treatment and control groups with wage thresholds: Burauel et al. (2020) assigned workers with wages below the MW (EUR 8.5/h) to the treatment group, while the control group had wages between EUR 8.5 and EUR 10/h. Derenoncourt and Montialoux (2021) used treatment intensity before and after 1967, which is their reference year. The rest used the identification strategy proposed by Card and Krueger (1992) based on regional differences in relative treatment intensity.

Table 1.
Synthesis of results of the systematic review: articles with treatment and control groups (DiD).
As regards the results observed through causal analyses, the most studied case is that of Germany, following the introduction of the MW in 2015 (see Dütsch et al. 2024). A total of four studies were found in the German context: (Bossler and Schank 2023; Burauel et al. 2020; Caliendo et al. 2023; Ohlert 2023).
All these studies confirm significant increases in hourly wages in almost all contexts, ranging from 3.9% to 6.7% for employees earning less than EUR 8.50 per hour before the introduction of the minimum wage. Caliendo et al. (2023) estimated a treatment effect for the first quintile of around 9% in 2015 and 21% between 2016 and 2018. The causal analysis by Burauel et al. (2020) found an MW-induced wage increase of 6.5%, which resulted in a 6.6 percentage point increase in the wage situation of low-paid workers in terms of gross monthly earnings, despite the high level of non-compliance found across the study. The positive impact is more pronounced for marginal workers’ wages, with an increase of 15.5% compared to 7.8% for regular full-time jobs. With regard to territorial disparities, Bossler and Schank (2023) confirmed that the minimum wage reduced wage inequality in East and West Germany and also led to a convergence of the wage differential between East and West. The results demonstrated that monthly wages increased significantly at the lower end of the wage distribution and up to the median. The results indicated that a minimum wage increase led to a 12% increase in monthly wages at the 5th percentile, a 21% increase at the 20th percentile, and a 2% increase at the 50th percentile of the unconditional wage distribution. Conversely, the effect was zero beyond the median. Ohlert (2023) employed a difference-in-differences analysis at the firm level to investigate the impact of the statutory minimum wage on gender inequalities, specifically the wage gap, working time gap, and income gap. The results show a reduction of up to 3.6 percentage points in the average wage gap between men and women. In terms of gross earnings, in firms affected by the minimum wage, the gap was reduced by up to 6.1 percentage points for all employees and by up to 4.6 percentage points more for low-paid employees. Finally, they identified adjustments in the working hours of women and men in the low-wage sector, which resulted in a reduction in the working hours gap between the genders. In Brazil, Sotomayor (2021) revealed a significant reduction in poverty levels across successive increments of the MW. On average, poverty and income inequality decreased by 2.8% and 2.4%, respectively. Yet, the effects of the MW on poverty levels appear to diminish over time. However, the authors highlighted that some standard errors were considerable and cautioned against the potential risk of bias due to the presence of autocorrelation and heteroskedasticity in the majority of the time series. In the case of Colombia, Pérez (2020) employed city-industry blocks with high and low MW incidence as treatment and control groups to analyse the difference in impact on the formal and informal sectors. The study revealed that the wage increase induced in the formal sector amounted to 3%, a figure that was higher than that observed in the informal sector.
M. Frank (2021) aimed to identify the possible causal relationship between the sustained decline in real US minimum wage over the three decades preceding the Great Recession of 2007 and the real increase in the incomes of the richest. During these years, the income shares of the richest 1% in the US increased by more than 150% (from 9.3% to 23.5%). Over the same period, the real federal minimum wage fell by around 35% (from $8.92 to $5.76 in 2011). An inverse relationship between minimum wage laws and top income shares is found, but the results are not robust against small changes in the specification of the econometric model or in the inequality indicators used. Derenoncourt and Montialoux (2021) also in the case of the US, concluded that the expansion of the MW in 1967 could explain more than 20% of the reduction in the racial income gap during the civil rights era. Finally, they estimated the effect of the minimum wage increases implemented by 10 states in 2014 and 2015 at the business level. Using the control group states where the MW increase had not occurred versus those that had substantially increased minimum wages, Forsythe found results that indicated a decline in wage inequality at the business level. This spillover effect was observed to spread the wage increase upwards, with no evidence of changes in occupational organisation.
As a summary of the analysis of the studies so far, it can be stated that the MW is an effective measure to reduce inequality in the lower tail of the income distribution. The empirical evidence over the last five years is clear on the existence of this causal relationship, adding to the evidence accumulated in previous years. Specifically, the nine articles in this review show how the MW induces a rise in wages in the lower tail of the distribution, thus reducing wage inequality, with spillover effects to higher wages (Bossler and Schank 2023; Forsythe 2023) and also to marginal workers (Burauel et al. 2020), an effect that in more informal economies can spill over into informal employment (Pérez 2020). There is also causal evidence that this decline in inequality contributes to the reduction in the gender (Ohlert 2023) and race (Derenoncourt and Montialoux 2021) gap, as these workers are at the lower tail of the wage distribution. Reduced inequality is also detected by pre-2020 work and by recently published descriptive and regression studies (Autor et al. 2016; Backhaus and Müller 2023; Bakis and Polat 2023; Belman and Wolfson 2014; Dickens et al. 2012; Card and Krueger 1995; Chao et al. 2022; Engelhardt and Purcell 2021; Freeman 1996; Grünberger et al. 2021; Joe and Moon 2020; Lee 1999; Saboia et al. 2021; Sari and Purwono 2021; Sefil-Tansever and Yılmaz 2024; Tamkoç and Torul 2020). Moreover, the decrease in real MW is a cause of increased inequality as shown by Frank, M. in the case of the US (Frank 2021), thereby confirming previous results (Autor et al. 2016; DiNardo et al. 1996; Lee 1999) and for Mexico and recent results showing the existence of correlation (Fortin et al. 2021).
The evidence is therefore quite compelling, only contradicted by a simulation exercise in the US state of Seattle (Long 2022).
The MW also shows, at least in the German case with a nationwide MW, potential to contribute to the reduction in territorial disparities, as shown in (Bossler and Schank 2023), or to contribute to increasing the allocation efficiency of workers (Dustmann et al. 2022). These effects identified through the causal analysis, which are not directly related to the main objective of the measure, represent an interesting element to be further explored.
The impact of the minimum wage on poverty remains much less explored. We rely primarily on the evidence already cited above (Belman and Wolfson 2014; Dube 2019b), and more recently there is clear evidence for the case of Brazil (Sotomayor 2021), where the minimum wage contributed significantly to poverty reduction, and for the case of South Africa (Bassier and Ranchhod 2024).
From the empirical literature reviewed, it is possible to derive some important elements that condition the intensity and duration of the impact of the MW on inequality, as well as its effectiveness as a poverty reduction measure.
Firstly, it is important to consider the level of MW in relative terms. Minimum wages well below median or average wages have little or no impact on the wage distribution and hence on inequality, and vice versa. In (Bassier and Ranchhod 2024; Laporšek et al. 2021; Tamkoç and Torul 2020), there is evidence of the effectiveness of large increases in the MW in economies where the MW was well below the median or average wage. Also related to the amount, but in this case relative to the wage distribution as a whole, is the percentage of workers affected by the increase or decrease in the MW—also considering spillover and lighthouse effects. Depending on the quantile in the wage distribution, a greater number of workers will be affected.
Secondly, the degree of compliance with regulations and the size of the informal economy are assessed. In the EU, (Eurofound 2024) estimates an average non-compliance in 2018 of 1.3% or 6.93% depending on the data source used (for Spain: 0.98% or 11.6%, respectively); in the same line, Burauel et al. (2020) also indicate a high level of non-compliance in Germany. A high degree of non-compliance and/or a high degree of informality means that the influence of the MW is not concentrated in the first deciles, if it is in the first deciles that both phenomena are concentrated. Several recent studies have found negative correlations with respect to the impact on inequality, that is, the MW reduces inequality, in Turkey, Brazil, Ecuador, and South Africa (Bakis and Polat 2023; Saboia et al. 2021; Herrero-Olarte 2022, 2023; Bassier and Ranchhod 2024), and in a group of South American countries (Herrero-Olarte and Sosa 2020).
Thirdly, the institutional architecture of the labour market should be considered. The collective bargaining model, the existence of national or territorial MW, or different amounts per category or collective, etc. condition both the degree of coverage of the group directly affected and the extension to groups with wages close to the MW (spillover and lighthouse effects) and even to higher wages.
Finally, the effectiveness of the measure in meeting the challenge of poverty reduction is conditioned, in addition to the above circumstances, by the following: the MW threshold in relation to the poverty rate; the percentage of people living in poverty or at risk of poverty who are economically active, either working or in search of employment; the extent to which the MW is complemented by other measures with the same objective of reducing inequality and eradicating poverty, e.g., social transfers; the distributional position of the workers concerned in the income and wealth distribution, i.e., whether or not they are concentrated in low-income households; and the company’s response, which has been little studied in the literature, but which will also determine the profile of the workers affected, as a possible reallocation of workers to more productive activities or substitution of workers may alter the composition of the group of workers affected by the measure.
3. The Spanish Case
In Spain, the national minimum wage is applicable to all workers regardless of age, branch of activity, type of working day, type of contract, or territory. Article 35 of the Spanish Constitution of 1978 establishes the right of everyone to receive remuneration for their productive work sufficient to satisfy their needs and those of their families. The basic norm that regulates labour relations in Spain, the Workers’ Statute of 1980, establishes and defines the characteristics of the interprofessional minimum wage in its article 27.
Despite the objectives set out in this regulation, from 1980 to 2004, the MW continued to fall in constant terms and in relation to the average and median wage (see Figure 1 and Figure 2). In addition, the minimum wage set was far below the real wages paid by firms, so that it affected a very limited, almost non-existent, group of workers (Llopis et al. 2011). Inflation control was the priority objective at this stage, which meant that the MW lost even more purchasing power. It was not until 2004 that the adaptation of the regulations to the European Social Charter began to be taken seriously. In fact, in 2004, the government set the target of reaching 60% of the average wage and drew up a plan to achieve it gradually by 2012. To this end, a growth path of the MW above the expected inflation rate was initiated, only to be interrupted by the 2008 crisis. In fact, from 2009 onwards, the minimum wage policy was clearly abandoned until 2017, when it began to grow again, allowing for the recovery of part of the purchasing power lost over the previous decade. However, the MW remained far from the wages actually paid, so it was more useful for calculating social benefits than as a wage floor. But even this ceased to be true, given that in 2004 the MW was no longer used as the basis for these social benefits, and the public indicator of multiple effects income (IPREM, for its acronym in Spanish) was created for this purpose, which from then on grew considerably less than the MW (see Figure 3).

Figure 1.
Evolution of monthly minimum wage (14 payments) (in euros, as of 2015) INE. Source: self-elaborated with data from the INE and the OECD.
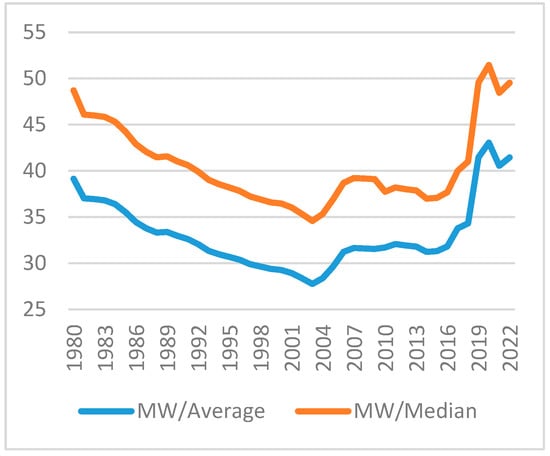
Figure 2.
MW in relation to average and median gross wage equivalent to full-time (OECD). Source: self-elaborated with data from the INE and the OECD. Source: self-elaborated with data from the INE and the OECD.
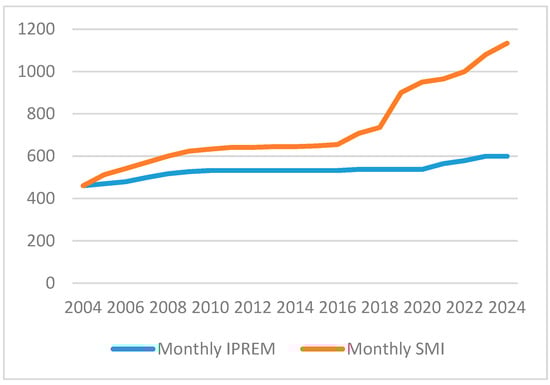
Figure 3.
SMI vs. IPREM (in euros). Source: self-elaborated with data from the INE.
The big change occurred from 2019 onwards, when the government resumed its objective of reaching an MW representing 60% of the average wage through a determined policy with a continuous increase path. This began with a strong increase in 2019 (22.3%) and was followed by other more modest increases once the COVID-19 crisis was overcome. This substantial increase in the MW led to its application to a significant proportion of the population. Thus, the change in the minimum wage policy in Spain has allowed for an analysis of the case as a natural experiment, with the objective of accumulating empirical evidence on the effects of large MW increases that could be useful for other similar interventions in other countries.
As can be seen in Figure 4 and Figure 5, the relationship of this MW evolution with inequality and employment seems clear in aggregate terms. It seems that the increase in MW in 2019 did not reduce employment, but it did reduce inequality,7 even in the long run once the 2020 pandemic crisis had been overcome.
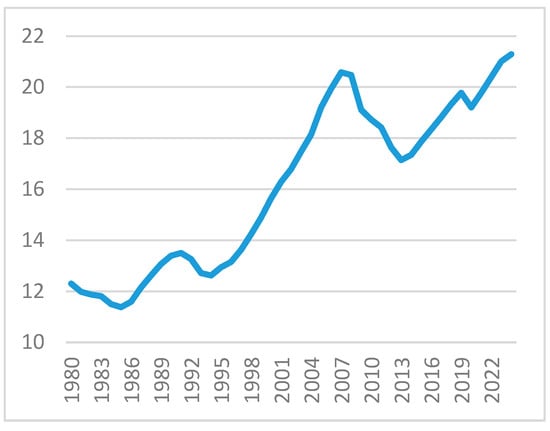
Figure 4.
Number of employees (in millions). Source: self-elaborated with data from the INE.
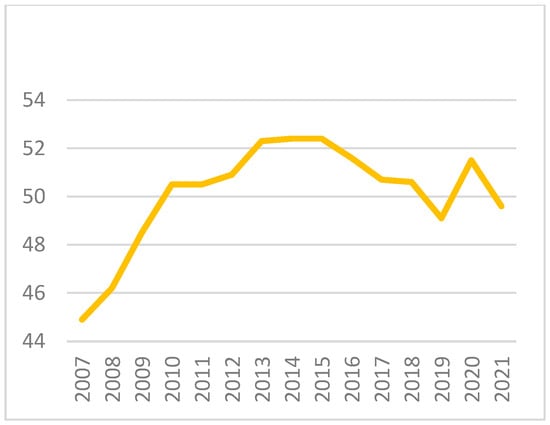
Figure 5.
Gini index (market income) %, Spain, 2007–2021. Source: self-elaborated with data from the INE and the OECD.
Despite the great opportunity that this change represents for Spain, there are few scientific studies on the case. This contrasts with the large number of studies that have been carried out in the German context (see the review by Dütsch et al. (2024)), in addition to dozens of studies for the US. Moreover, almost all empirical studies focus, at the international level, on the effect on employment and only a few deal with the effect on inequality and poverty; moreover, they are all grey literature.8 So, as far as is known, this is the first scientific article on the effect of the large MW increase on inequality and poverty in Spain from 2019 onwards.
As an illustrative example, Figure 6 shows the evolution of average wages by quintile based on the Eurofound Technical Survey. Research on the impact of the 22.3% increase in the minimum wage in Spain in 2019, conducted for this report (Eurofound 2022), found that Spain recorded the largest reduction in wage inequality among EU27 Member States in 2019. Moreover, the lowest-paid workers (Q1) experienced a greater increase in wages in 2019, and those in the quintiles just above them (Q2 and Q3) also experienced growth, exceeding that of the highest earners (Q4 and Q5). This suggests that the large MW increase in 2019 may have contributed to a reduction in inequality at the bottom of the distribution. However, as previously stated, these results are merely exploratory and require further analysis to transition from correlation to causation, as will be demonstrated in the following section.
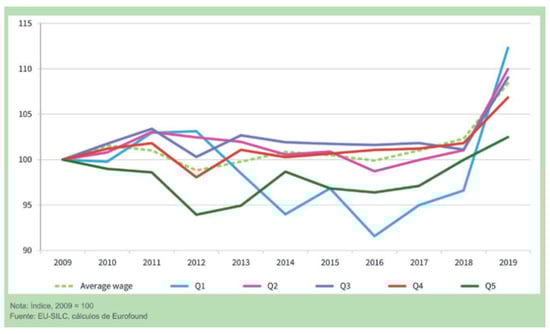
Figure 6.
Evolution of average wages by wage quintile. Spain, 2009–2019 (Eurofound 2022).
4. An Analysis of the Impact of the MW on Income Inequality: In Spain, for the 2019 Increase
The 2019 minimum wage increase in Spain represented a unique event in the country’s democratic history. According to estimates by the National Statistics Institute (INE, for its acronym in Spanish), in 2018, 14.1% of the Spanish population had an annual income equal to or below the minimum wage, while in 2019 this percentage increased to 18.18%. This meant that more than 2 million people were directly affected by this wage increase. This historic milestone offers a unique opportunity to explore, through a quasi-experiment, the causal impact of the minimum wage increase on the income of the population, which is essential to better understand the economic and social implications of this measure.
Thus, the aim of this section is to study the causal effect of the increase in the minimum wage on the distribution of gross annual income in Spain in the most recent period. In particular, this section aims to analyse the effects of the large increase in the MW in 2019, an increase of 22.3%. The objective is to study not only the effect that the MW increase may have had on the group of people with a gross annual income equal to or lower than the 2019 MW, but also the spillover effect, as the minimum wage may act as a benchmark that guides other wage increases in the rest of the income distribution.
To carry out this analysis, data from the microdata files of the annual Living Conditions Survey (SILC) carried out by the Spanish National Statistics Institute were used. This survey belongs to the set of harmonised statistics for the countries of the European Union. Its main purpose is to collect statistical information, comparable at the European level, on income and social exclusion (European Statistics on Income and Living Conditions, EU-SILC). Although the SILC is targeted at households, it also provides information at the individual level. Indeed, a distinctive feature of this study is that the effect of the increase in the minimum wage is analysed at the individual level rather than at the household level, in contrast to most previous studies that have focused on household income. This is due to the fact that household income is influenced by a multitude of factors, including household composition and sources of additional income, which may obscure the specific impact of wages. In contrast, an analysis at the individual level allows for a more precise identification of the groups that have been most affected by the increase in the minimum wage, such as women, young people, and immigrants. Moreover, the availability and reliability of individual income data in the Living Conditions Survey facilitates this type of analysis.
The microdata files (both longitudinal and cross-sectional) offer information on personal characteristics such as age, gender, marital status, mode of cohabitation, or level of studies, as well as on work activity: type of working day, number of hours worked in a regular week, type of occupation, or economic activity of the company for which the person works, among other variables. The data are gathered through questionnaires, although in the case of certain variables, such as income, the final data are constructed by combining the information provided by the informant with information from administrative records (mainly from tax or social security sources). This method provides detailed information on the majority of income components, which are compulsory sources of recording. Furthermore, it indirectly contributes to reducing the non-response rate for this type of variable, which is typically very high. As for the reference period used for data collection in the survey, although most of the data refer to the year in which the survey was carried out, the data relating to income and its components refer to the calendar year prior to the date of the survey.
The Living Conditions Survey (SILC-Spain) is an annual survey covering approximately 13,000 households and 35,000 individuals. Starting in 2019, a process of sampling expansion was initiated, which was consolidated in 2022. This significant increase in the sample will allow for greater precision and generalisability of the results in the long term. Currently, the latest available longitudinal data needed to carry out this study refer to the period 2019–2022. However, as the sample is renewed by one quarter each year and the process of sampling expansion started in 2019, the sample could not be sufficiently representative over the whole period of analysis, and therefore the quasi-experiment is restricted to the years 2019–2020 (referring to income relative to the years 2018–2019). In any case, the 2019–2020 two-year period is sufficiently distinctive, given the significant increase in the minimum wage in Spain during this period and the absence of academic studies that have empirically analysed this increase in the minimum wage in the most recent phase. We analysed only the short term, not including data from 2021 due to the distortion caused by the COVID-19 pandemic in that data.
The target population focuses on the active workforce, aged 16–64 years, employed and full-time, i.e., those who have worked, in a regular week, 35 or more hours per week. By selecting this population group, the variability that may exist in the sample owing to people with low incomes due to part-time or sporadic work is excluded. This target population, full-time employees without self-employment, is widely used in the literature (Bossler and Schank 2023; Ohlert 2023; Pérez 2020) and allows for a more accurate and representative analysis of the impact that the increase in the minimum wage may have had.
To assess the causal impact of the minimum wage (MW) increase on income among the target population, an ordinary least squares multiple linear regression model following a difference-in-differences (DiD) approach is used. This method is particularly suitable for this study because of its ability to exclude, under the parallel trends assumption, the effect that possible confounding variables may have on the causal effect of the treatment (in this case, MW increase). In addition, DiD allows controlling for parallel trends in population income before 2019, which in turn enables identifying the causal effect of the MW increase more precisely. In the systematic review of the academic literature provided above, since 2020 only nine studies have carried out an empirical analysis based on DiD for the relationship between MW and inequality and poverty (Bossler and Schank 2023; Burauel et al. 2020; Caliendo et al. 2023; Derenoncourt and Montialoux 2021; Forsythe 2023; Frank 2021; Ohlert 2023; Pérez 2020; Sotomayor 2021), none in the case of Spain.
As a quasi-experiment, treatment and control groups can be identified using criteria other than randomisation, such as an eligibility cut-off. The reference income intervals used to construct the treatment and control groups are shown in the table below (Table 2).9
Table 2.
Gross income limits for the composition of treatment and control groups.
This study involves three treatment groups and one control group. Treatment group 1 consists of all employed persons, belonging to the target population, who in the year 2019 had a gross income equal to or below the minimum wage of the year 2019 (12,600 euros). Treatment group 2 consists of those persons who in 2019 had a gross annual income above the annual minimum wage but whose gross annual income was two-thirds lower than the median income of the total population in 2019. Treatment group 3 is made up of those persons who in 2019 had a gross annual income between two-thirds and 1.5 times the median income in 2019. The control group consists of all persons who in 2019 had a gross annual income of more than 1.5 times the median income in the same year.
In addition, to minimise the impact of atypical values on the accuracy and reliability of the model, the sample was refined. Persons with null or missing annual gross income and 3% of persons with very low or very high gross income were removed. This percentage has been set at around 50% of the average income for treatment group 1 in each year of analysis, which is a common value in the literature (Caliendo et al. 2023). This filtering has been done to ensure that the sample is representative and not influenced by biased values. The final sample for analysis consists of persons with gross annual income between 3% and 97% of the gross income distribution of the total population. The table below summarises the size of each group involved in the DiD analysis (Table 3).
Table 3.
Basic data of the sample.
Compliance with assumptions and reliability analysis. The validity and reliability of DiD results depend on several key assumptions, including parallel trends, absence of confounders, and stability of the treatment and control groups (Vicens Otero 2008). These assumptions are critical to ensuring that treatment effect estimates are accurate and not influenced by external factors.
Notably, the parallel trends assumption implies that, in the absence of treatment, the difference between the treatment and control groups would have remained constant over time. Figure 7 reflects the trends for the three treatment groups and the control group in the three years prior to the 2019 MW increase.
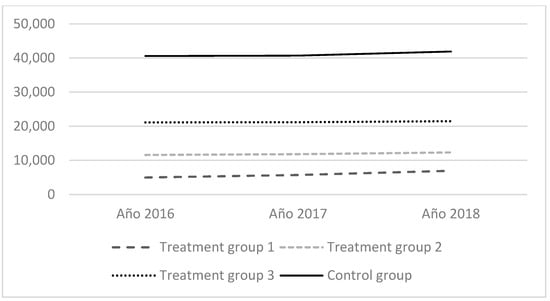
Figure 7.
Parallel trends assumption. Change in gross income for treatment and control groups, 2016–2018. Source. Self-elaborated based on microdata from the Living Conditions Survey (SILC). Cross-sectional database.
The assumption of the absence of confounding factors implies the absence of variables that affect both the treatment and the outcome variable. To test this assumption, additional explanatory variables have been included in the modelling, and the results remain robust. The results do not change significantly when new variables are included, indicating that the model is not influenced by external factors. Furthermore, the standard error hardly changes, the standardised coefficients do not change significantly, and the R2 increases slightly, suggesting that the model is influenced by the treatment variable and not by other variables.
The assumption of group stability implies that the composition of the treatment and control groups does not change over time. If the treatment and control groups change, it is possible that the observed differences between the groups could be caused by other factors unrelated to the increase in MW. For instance, if the demographic composition of the treatment group changes during the analysed time period, this could influence the dependent variable and make the differences between the groups larger than they actually are as a result of the increase in MW. In the present case, individuals were carefully selected based on their income situation in 2019 and were in the same situation in 2018, which reduces the possibility of significant changes in the treatment and control groups during the period analysed.
Equally important is to verify that the control group is significantly away from the descriptive values of the treatment groups in terms of the variable of analysis (income). The control group here is composed of full-time employed people with a significantly higher income level than the treatment groups, with incomes above 1.5 times the median income of the year 2019. To ensure that this assumption is met, several econometric tests were carried out using different control groups. First, the control group included all individuals who did not belong to treatment groups 1 or 2. Second, the control group included individuals with an income above two-thirds of the median income in 2019. In all cases, the results show a positive causal effect of the 2019 minimum wage increase on the gross income of individuals in treatment groups 1 and 2 in relation to the control group (see Table 4). Moreover, the relationships between the independent variables and the dependent variable did not change. However, a certain degree of autocorrelation was found in the residuals, with values for the Durbin–Watson indicator above 1 but below 1.5. To overcome this problem, the control group is the one furthest away from treatment groups 1, 2, and 3, i.e., those with high incomes of more than 1.5 times the median income in 2019. This guarantees that all assumptions are met and, more importantly, the R2 has increased significantly to values above 0.9, as shown in Table 4 and Table 5.
Finally, compliance with the assumptions of the regression analysis was verified using the SPSS version 25.0 statistical package. In particular, the linearity of the relationship between the variables and the independence of the errors were checked using the Durbin–Watson test that takes values between 1.5 and 2.5, which guarantees the independence of the errors (included in Table 4, Table 5 and Table 6), as well as the normality of the residuals, the homoscedasticity using the Breusch–Pagan test, and the absence of collinearity using the VIF test, which takes values below 3.3, which guarantees the absence of collinearity. No indicators have been observed to suggest the need to apply a different multiple linear regression model, such as the generalised linear model or a more robust corrector (in Appendix C, Figure A2, the normal p–p plots and scatter plots are included).
Multiple Regression Model
The impact of the MW increase on income was analysed using an ordinary least squares model following the DiD approach for the years 2018–2019. This model considers that in January 2019, there was an increase in the MW of 22.3%.
The following ordinary least squares income equation is estimated:
where Y is the logarithm of each individual’s gross annual income; X1 is a time variable that takes the value 1 in 2019 and 0 in 2018; X2 is also a dichotomous variable that takes the value 1 if the individual belongs to treatment group 1 (or treatment groups 2 or 3, respectively), and 0 if they belong to the control group; X3 is the year and treatment interaction variable that takes the value 1 when the observation belongs to an individual in treatment group 1 (or treatment groups 2 or 3, respectively) and to the year 2019, and 0 otherwise. represents other explanatory variables included in the model (gender, mode of cohabitation, and tertiary education). Different studies, as seen in Section 2, show that the effect of the wage increase is different among certain more disadvantaged groups and according to their level of education, as in the case of women (Cho and Yang 2021; Laporšek et al. 2021) or single-parent families (Alinaghi et al. 2020).
The parameter is the constant term of the model, and parameters , are the coefficients of the independent variables that measure the magnitude of the effect that each of the independent variables has on the dependent variable, i.e., annual income. The parameter represents the change in income between 2018 and 2019. The discriminates between two groups based on the income threshold set and the comparison with the control group defined by a certain income level listed in Table 2. The most interesting coefficients are the parameters that, in each model, record the difference between the income of the treatment group before and after the 2019 increase, i.e., the differential effect of the MW increase on the income of individuals in the treatment groups.
In a semilogarithmic model with dichotomous variables, such as the one we are concerned with here, the coefficients of the independent variables are not interpreted as continuous percentage changes but as changes in state. Dichotomous variables indicate the presence or absence of a specific characteristic, such as membership in a certain treatment group, a specific year, or the interaction between year and membership in the treatment group, represented, in our study, by the coefficients β1, β2, and β3, respectively. Consequently, the coefficients associated with these dichotomous independent variables reflect the change in the logarithm of annual income when the dichotomous variables change from 0 to 1.
To interpret the percentage effect, we mainly follow the conversions proposed by Halvorsen and Palmquist (1980), Kennedy (1981), and Giles (1982). Halvorsen and Palmquist (1980) provide a solid theoretical basis for the interpretation of coefficients of dichotomous variables in semilogarithmic models. The formula is as follows:
where β is the coefficient of the corresponding dichotomous variable.
Kennedy (1981) expands on Halvorsen and Palmquist’s interpretation by noting that this interpretation is correct only under certain conditions and proposes an additional adjustment that takes into account the variance of the coefficient estimator, improving the precision of the interpretation. Thus, Kennedy’s correction (1981) includes an additional term to account for this omission. The corrected formula (introducing the variance) is as follows:
where β is the coefficient of the corresponding dichotomous variable and σ2 is the variance of the β estimator.
Giles (1982) provides an unbiased estimation of the percentage effect of the dummy variables. He adjusts the formulation of Halvorsen and Palmquist (1980), but with a different approach to ensure that the estimation is unbiased. The validation is performed through Monte Carlo simulations. Although Kennedy and Giles address the same problem, Giles’ formula is distinguished by its focus on bias correction and validation through simulations, providing a more accurate and unbiased estimation of the effect of dummy variables in semilogarithmic models (Van Garderen and Shah 2002).
In our case, the variations between both approaches are minimal, as can be seen in Table A2 of Appendix C.
This regression model is then applied to three cases:
- Case 1: The variable X2 takes on a value of 1 when the person has a gross annual income equal to or below the 2019 minimum wage (i.e., belongs to treatment group 1) and a value of 0 when the person belongs to the control group (persons with a gross annual income equal to or above 1.5 times the median income in 2019).
- Case 2: The variable X2 takes on a value of 1 when the person has a gross annual income above the 2019 minimum wage but equal to or below two-thirds of the 2019 median income (treatment group 2), and a value of 0 when the person belongs to the control group, i.e., with an income equal to or above 1.5 times the 2019 median income.
- Case 3: The variable X2 takes on a value of 1 when the person has a gross annual income of more than two-thirds and less than 1.5 times the median income in 2019 (treatment group 3), and a value of 0 when the person belongs to the control group.
Case 1.
Effects of the MW increase on the income of individuals with gross annual incomes equal to or below the minimum wage (treatment group 1).
The results of the model using Equation (1) are shown in Table 4. The dependent variable is the logarithm of the individual’s annual income. The explanatory variables refer to the characteristics of the individuals in the sample. The “gender” variable takes on a value of 1 if the person is a woman and 0 if the person is a man. The “mode of cohabitation” variable takes on a value of 1 if the person lives alone and 0 if the person lives with a partner. The “level of education” variable is given a value of 1 if the person has tertiary education and 0 otherwise.
Table 4.
Results of the estimates of the effect of the MW increase on treatment group 1.
Table 4.
Results of the estimates of the effect of the MW increase on treatment group 1.
| Model (1) | Model (2) | |
|---|---|---|
| Year | 0.021 ** (0.014) | 0.020 ** (0.013) |
| Treatment 1 | −1.062 *** (0.016) | −1.024 *** (0.017) |
| Treatment 1 × year | 0.187 *** (0.022) | 0.188 *** (0.022) |
| Gender | −0.023 *** (0.011) | |
| Living as a couple | −0.035 *** (0.012) | |
| Level of education | 0.062 *** (0.012) | |
| Adjusted R2 (a) | 0.913 | 0.917 |
| Durbin–Watson | 1.854 | |
| Standard error | 0.20812 | 0.20349 |
Source. Self-elaborated based on longitudinal SILC data from the INE. Years 2018–2019. Note. Non-standardised errors in brackets. Significance level *** p < 0.01; ** p < 0.05. N treatment group 1: 316; N control: 473. (a): Adjusted R2 and R2 barely vary by a hundredth of a cent.
Model (1) includes as independent variables year (X1), treatment 1 (X2), and the interaction between the two (X3). In model (2), dichotomous explanatory variables have been added: gender, mode of cohabitation in the household, and having tertiary education or not. Despite adding these variables, the model remains significant at 99%, and the adjusted R2 increases by four hundredths. In addition, the standard error of the residuals decreases, indicating an improvement in the fit. Again, as in model (1), the adjusted R2 value is almost identical to the uncorrected value, reflecting the goodness of fit of the model.
The following results were observed:
- The income of individuals with a gross annual income equal to or below the MW was 64.1% to 65.5% lower than the income of the highest gross income group, the control group.
- The gross annual income of all individuals (regardless of whether they belong to treatment group 1 or the control group) increased by around 2% in real terms after the 2019 minimum wage increase.
- The increase in the minimum wage led to an increase of 20.5% to 20.7% in the income of those with an income at or below the minimum wage.
Similarly, model (2), in which explanatory variables are introduced, observes a differential in women’s income compared with men’s; women’s income is lower than men’s, just as the income of people living alone is lower than that of those usually living with a partner. The influence of educational level on wages is also evident in this study, with income being higher if the person has tertiary education (with a beta of 0.062).
Case 2.
Effects of the MW increase on the incomes of low-income individuals (treatment group 2).
In this second case, the model—Equation (1)—was applied by introducing treatment variable 2 as a treatment variable, which represents 11.1% of the total number of people in the target population (see Table 3).
In this case, the effect of the 2019 MW increase on the income of treatment group 2, which consists of those with an income below two-thirds of the median but above the 2019 minimum wage, is examined. The same model is applied as in the previous case (first case), with the difference that treatment 2 variable is added, which has a value of 1 if the person belongs to treatment group 2 and a value of 0 if the person belongs to the control group (with incomes above 1.5 times the median income).
The year and interaction variables are included in the model in a similar way to that explained in the previous section.
Table 5 reflects the results obtained.
Table 5.
Results of the estimates of the effect of the MW increase on treatment group 2.
Table 5.
Results of the estimates of the effect of the MW increase on treatment group 2.
| Model (1) | Model (2) | |
|---|---|---|
| Year | 0.031 *** (0.010) | 0.030 *** (0.010) |
| Treatment 2 | −0.982 *** (0.012) | −0.954 *** (0.012) |
| Treatment 2 × year | 0.036 ** (0.017) | 0.037 ** (0.016) |
| Gender | −0.019 ** (0.008) | |
| Living as a couple | −0.024 *** (0.009) | |
| Level of education | 0.052 *** (0.009) | |
| Adjusted R2 (a) | 0.926 | 0.928 |
| Standard error | 0.14959 | 0.14732 |
| Durbin–Watson | 1.937 | |
Source. Self-elaborated based on longitudinal SILC data from the INE. Years 2018–2019. Note. Non-standardised errors in brackets. Significance level *** p < 0.01; ** p < 0.05. N treatment group 2: 260; N control: 473. (a): Adjusted R2 and R2 barely vary by a hundredth of a cent.
The following results were observed:
- The income of individuals belonging to this treatment group was between 61.5% and 62.6%% lower than the income of the highest income group.
- The income of individuals (in both treatment and control groups) increased by around 3% between 2018 and 2019.
- The income of the group of people in treatment group 2 increased by between 3.7% and 3.8% between 2018 and 2019. This is a smaller increase than for the group of people with incomes below the minimum wage, but significant for such low-income levels (considering the income thresholds for the groups shown in Table 2).
Case 3.
Effects of the MW increase on the income of middle-income individuals (treatment group 3).
In this third case, the same model is applied, but using as the treatment population those individuals with average annual gross incomes, i.e., above two-thirds of the median income in 2019 but below those of the control group, which are above 1.5 times the median income in 2019.
The model remains significant, and the results are reflected in the Table 6.
Table 6.
Results of the estimates of the effect of the MW increase on treatment group 3.
Table 6.
Results of the estimates of the effect of the MW increase on treatment group 3.
| Model (1) | Model (2) | |
|---|---|---|
| Year | 0.041 ** (0.015) | 0.039 ** (0.014) |
| Treatment 3 | −0.786 *** (0.012) | −0.731 *** (0.012) |
| Treatment 3 × year | 0.019 (0.017) | 0.018 (0.016) |
| Gender | −0.063 ** (0.008) | |
| Living as a couple | −0.034 *** (0.009) | |
| Level of education | 0.182 *** (0.008) | |
| Adjusted R2 (a) | 0.607 | 0.636 |
| Standard error | 0.22425 | 0.21582 |
| Durbin–Watson | 1.969 | |
Source. Self-elaborated based on longitudinal SILC data from the INE. Years 2018–2019. Note. Non-standardised errors in brackets. Significance level *** p < 0.01; ** p <0.05. N treatment group 3: 1297; N control: 473. (a): Adjusted R2 and R2 barely vary by a hundredth of a cent.
The results in Table 6 indicate that, although the model remains significant, the interaction variable “treatment 3-year” is no longer significant in any of models (1) and (2). No collinearity or heteroskedasticity effects are observed, but changes in the partial and semi-partial correlations of the interaction variables “treatment 3 × year” and income have been detected. In particular, it is observed that the partial and semi-partial correlations of these variables decrease compared to the values obtained in the models applied in the first two case studies. This may indicate that other variables not included in the model are influencing the variations in gross annual income in this third case, something not observed in the other two cases.
Yet, there are certain important trends to note:
- The gross annual income of people with medium-high incomes stood at between 51.9% and 54.3% of the income of the control group. Thus, the analysis of β2 coefficients shows, in the different scenarios, the large difference in income between all groups and the high-income group.
- The income of individuals (in both treatment 3 group and control group) increased by around 4% between 2018 and 2019.
- The differences between the genders were more pronounced the higher the income level.
- Individuals living with a partner had higher incomes than those living alone.
- In higher income groups, tertiary education had a greater impact on income than in lower income groups.
5. Discussion of the Results
Firstly, it is important to note that all the necessary tests to check the robustness of the data and that the result has been very positive have been carried out. The model behaves robustly and is not very sensitive to variations in the definition of the treatment and control groups. Therefore, the results obtained can be considered solid and robust.
The results of this study suggest that the increase in the minimum wage in Spain in 2019 had a positive impact on the increase in gross annual incomes of the wage-earning population aged 16–64. In particular, it can be observed that the 22.3% increase in the MW in Spain in 2019 led to a significant reduction in inequality, not only for the population directly affected (treatment group 1) but also for the population not directly affected, especially the population group with wages just above the MW (treatment group 2). The effect in higher income groups (treatment group 3), although similar, is not significant.
Result 1: Using the difference-in-differences analysis based on longitudinal data from the Living Conditions Survey, the increase in income between 2018 and 2019 for the group of people with incomes equal to or below the MW was between 20.5% and 20.7% (Appendix C, Table A2). This suggests that the increase in the minimum wage in 2019 had a significant impact on the income of this population group. Compared to other studies, such as that by Burauel et al. (2020) in Germany, an increase in hourly wages of 6.47 percentage points was also found for the group of people earning less than the minimum wage before the reform. The impact in Spain even seems to be more substantial. However, it is important to consider that the economic and employment contexts vary significantly between the two countries, which may influence the results.
Result 2: The increase in income from 2018 to 2019 induced by the increase in the MW for the group of people with an income between the annual minimum wage and two thirds of the median income distribution (i.e., with a gross annual income between EUR 12,600 and EUR 16,444.80) was between 3.6% and 3.8%. In this sense, Bossler and Schank (2023) found that the implementation of the minimum wage in Germany had an impact on monthly wages up to the 50th percentile; on their part, Caliendo et al. (2023) observed this effect up to the second quintile. The evidence found in the present study therefore shows a spillover effect towards the income groups closest to the lowest group, indicating that the increase in the minimum wage has a positive impact on the income of workers earning just above the new minimum wage. These findings are consistent with the results of previous studies, such as that by Dickens et al. (2012) or the one by Joe and Moon (2020), who found more pronounced effects of the MW increase at the bottom of the income distribution. The empirical literature confirming positive minimum wage effects that reach all the way to the bottom half of the income distribution is extensive (see Dickens and Manning 2004; DiNardo et al. 1996; Lee 1999; Card and DiNardo 2002; Autor et al. 2008).
In addition to the significant income effects for individuals with annual incomes below the MW, another key finding of this study is that the impact is also felt, albeit to a lesser degree, by those with gross incomes above MW. This suggests that the increase in the minimum wage in 2019 did not only benefit those closest to the poverty line but also had a widespread impact on income distribution.
This result reflects the existence of a “contagion zone” around the minimum wage level, where wages close to the MW tend to adjust as well. This “spillover effect” has been extensively studied in the literature, as can be seen in (Bakis and Polat 2023; Belman and Wolfson 2014; Fortin et al. 2021; Sefil-Tansever and Yılmaz 2024). Studies such as the one by Autor et al. (2016) found evidence of this spillover effect, showing that increases in the minimum wage had a positive impact on the wages of workers earning slightly above the new minimum. This effect is also observed in Lee (1999), who also found that the impact of this increase on income diminished with increasing levels of the income distribution, as is the case in the present study with treatment group 3.
Result 3: There are no effects on middle and high incomes. Although these effects have not been explored in depth, as this was not the aim of this study, the results do not reflect effects beyond two-thirds of the median. There is not much empirical evidence on this issue, though. Autor et al. (2016) identified spillover effects on individuals in the top half of the income distribution.
Impact on Inequality
In Spain, the Gini Index (market income) has already shown an increase from 0.506 in 2018 to 0.491 in 2019, reflecting a significant fall in inequality this year. In the same period, the average income of the lowest income group (treatment group 1) increased by 29% compared to an increase in the average income of the highest income group (control group 1) of 7%.
In Germany, Bossler and Schank (2023) estimated a significant reduction in the variation of log wages, which fell by 14.7% after the introduction of the minimum wage and would have fallen by only 8.7% without such reform. According to Burauel et al. (2020), the impact of the MW was much smaller (6.7 points) than in Spain.
Regarding gender inequality, the differences in gross annual income between men and women are significant in all the income groups analysed. The differences are greater in the extreme groups, with low income and with medium-high income (as reflected in Table A3 of Appendix C). In this sense, and given that there are more women than men with incomes below the annual minimum wage, an increase in minimum wages can make a significant contribution to narrowing the gender gap. In this sense, the present study coincides with that by Autor et al. (2016) and Caliendo et al. (2023). The simulation model by Grünberger et al. (2021) also suggests that MW increases can reduce the gap between men and women. Ohlert (2023) clearly identified this causal relationship. The results from the Ohlert study suggest two main pathways of the impact of the minimum wage on gender inequalities: more women than men benefit from the minimum wage also (Caliendo et al. 2023) and there exist different adjustments in working hours for women and men in the low-wage sector. The results presented here are consistent with the limited accumulated evidence: given the strong income growth quantified at the tail of the distribution and the higher presence of women in this group, a significant impact on the distributional gap between women and men can be inferred.
In relation to the form of cohabitation, higher income levels are also observed when people live as a couple than when they live alone. In any case, this aspect would require a more specific study taking into account different groups.
The findings indicate that educational level also has an influential role to play. In fact, those with lower levels of education will be more affected by the MW increase. The income of people with a tertiary education level is higher than the income of people with other lower levels of education (as reflected in Table A3 of Appendix C). Finally, it seems that the lighthouse effect, i.e., the effect on the informal economy, is also intuited, at least in cases where, according to the SILC, the workers earn less than the minimum wage despite working full time, as can be seen in the figures in Appendix C. However, this aspect requires further analysis to be verified.
6. Practical Implications
It is first necessary to recall that this measure is justified on the grounds of social justice. It is inconceivable to accept that there are workers who, even when working full time, do not earn enough to live in dignity. This premise leads to the conclusion that the labour market alone is insufficient to guarantee social justice, both historically and in the present. Consequently, it is necessary for the state (and/or collective bargaining if it is sufficiently established) to act in order to ensure a minimum wage that guarantees a dignified life. Therefore, the justification (desirability) of the measure does not seem to be disputed, and, in fact, it is implemented at the state level in most of the countries of the world. Indeed, those countries that do not have this measure implemented at the state level have it at the regional level, or it is established in collective bargaining for each branch of activity or economic sector.
Once the justification or desirability of the existence of the MW has been established, it is necessary to consider the issue of feasibility. It is possible that, although the measure is beneficial and desirable, the associated negative effects make it unfeasible. Consequently, the majority of studies have focused on evaluating the impact of the measure. The initial step would be to ascertain whether the measure is effective in reducing in-work inequality and poverty. Subsequently, it would be necessary to assess whether the measure has any unintended adverse effects that would render it unfeasible, such as a significant negative impact on employment. The results of this study demonstrate that the measure is effective in achieving the desired outcomes; consequently, the measure is both desirable and feasible. However, it is important to consider the potential challenges associated with acceptance and implementation.
Acceptance of the measure, both at a general level (public opinion) and on the part of the different groups concerned and decision-makers, is dependent on the experience of the results of its implementation and the impact on each of the groups involved, but also on the narrative (“the story”) that partly determines public opinion. Fundamentally, the goodness of the measure and its acceptability need not go hand in hand. If the aim is to eradicate poverty and, more specifically, the unjust existence of the working poor, the minimum wage has proved to be an appropriate measure to achieve this, complementary to other measures. The fact that it may also have a negative, albeit small, effect on employment should not lead the government to abandon its objective but to work out the best implementation strategy so that this effect is not detrimental. This could be done, for example, through convergence or a smooth transition to the adequate MW. This would give firms time to adapt to the new circumstances by increasing productivity, improving their innovation, adjusting their profits, and/or passing on part of the cost increase to prices in a moderate way. In addition, there would be a smooth adjustment (transfer) from inefficient to more efficient businesses.
In terms of how it is told (the story, the narrative), Nobel laureate Robert J. Shiller is perhaps the foremost specialist on the matter (see Shiller 2019). In turn, Bartels (2016: p. 198 et seq.) looks specifically at this issue in relation to the MW and notes a major contradiction between general public opinion, which is very much in favour of increasing the MW, and the narrative that some highly ideological mainstream economists try to impose, talking about the alleged negative effects of increasing the MW in order to justify the opposing view of some of the businessmen involved.
What different groups or other interest groups think about the issue is crucial, especially in democratic political systems. How the government is able to communicate the importance and goodness of this measure will influence this opinion, especially the position of the so-called “public opinion”. Here we can take the example of the differences in the implementation of a significant MW increase in Japan and South Korea, analysed by Yun and Heo (2024), who attributed the failure of South Korean reform to the narrative of the “rhetoric of perversity” and how this narrative becomes powerful. Thus, to eradicate in-work poverty, an MW of sufficient magnitude must be implemented. This must be accompanied by the collective, social, and political bargaining necessary to ensure its long-lasting implementation and to prevent regression. But, at the same time, it must be implemented quickly enough so that excessive negotiations seeking consensus do not lead the state to lower the measure so much that it becomes ineffective.
In the Spanish case, public opinion was clear about the need to increase the minimum wage, which had become outdated.10 Some public and private institutions were reluctant, based on commissioned technical studies that showed negative consequences for employment. In fact, some think tanks and highly ideologised academics continue to defend these approaches, even though there is overwhelming scientific evidence that refutes them. Yet, despite the lack of full consensus, the favourable public opinion and the fact that it was negotiated with the social partners made the implementation a success, even though employers and right-wing parties were opposed to it. Also essential was the fact that it had the support of the EU, since the goal was the one reflected in its indications, subsequently taken up in the 2022 Directive. In fact, the debate on this issue was soon removed from the political battle, which has allowed for a somewhat peaceful implementation.
Conversely, the implementation of the minimum wage did not imply a significant challenge, as governments set the minimum wage level on an annual basis, so this is an already well-established process. If, as the EU Directive also proposes, an automatic mechanism of variation of the MW in relation to the evolution of the average or median wage were established, this would avoid the loss of purchasing power of this MW. In this way, it would be definitively removed from the political debate and would guarantee the fulfilment of the objective that all workers should receive a wage for their work that guarantees them, at the very least, a decent living.11
Nevertheless, the implementation has been met with significant criticism, which has led to the effects on poverty not being as great as expected. This is the decoupling of the MW from the public multi-purpose income indicator (IPREM, for its acronym in Spanish), which is the indicator used to grant benefits and subsidies in Spain. The MW was used as an indicator for these benefits in other countries until the creation of the IPREM in 2004. Since then, its evolution has increasingly deviated from the evolution of the national minimum wage, especially since 2017 (see Figure 3), which has had a very detrimental effect on the most disadvantaged families. Currently, the IPREM is less than half of the MW, when it should be similar to the MW.
7. Conclusions
This article has sought to analyse whether changes in the MW actually affect inequality and poverty. To this end, two objectives have been targeted. Firstly, to review the empirical evidence available on the subject through the PRISMA methodology, which is to some extent novel in economics, but which is very interesting in order to avoid biases in the literature search and in the analysis of the results. Secondly, an empirical study has been conducted on a specific case of great interest, given that it has been little studied despite the fact that it involves a large MW growth: the 2019 22.3% increase in Spain. To do so, the DiD methodology, which is becoming increasingly common in this type of study, has been used. In fact, nine other articles have been found that use this methodology to study the effects of the MW on inequality and poverty.
This article examines all the studies that adopt the empirical analysis methodology. Most of the literature focuses on employment effects, reflecting ambiguous results that are in any case small and insignificant. A limited number of studies have focused on the effects of minimum wage policies on inequality and poverty. We have carried out the search for all the works carried out from 1995 to 2024 (June). From 1995 to 2020, the analysis has been based on bibliographic reviews and the abstracts of the articles. For the most recent period (2020–2024), a more exhaustive analysis has been carried out. We have specifically found 31 papers. The majority of these studies have found an inverse relationship between MW and inequality and poverty. Only two of them do not share the same result, but these are works that apply a simulation methodology to theoretical models, i.e., they are not truly empirical studies.
The Spanish case study provides clear evidence that an increase in the minimum wage has a positive effect on poverty and inequality. This effect is not limited to the group of workers directly affected but also extends to those who receive more than the MW, a phenomenon known as the spillover effect.
It is also important to reiterate that the objective of the MW is to eliminate jobs that are paid at undignified wages because they are unjust, as well as to improve working conditions. It is evident that these jobs are paid below the cost of production, whatever indicator is employed. This is regardless of whether the cost is measured in terms of the workers’ ability to survive, or in terms of the possibility to lead a decent life, both for the worker and their family, while allowing for good productivity, training, and the reproduction of the workforce. It is therefore clear that these jobs should be prohibited, as it is prohibited to sell any product or service below cost (dumping).
The success of this measure also has to do with the favourable position of the majority of the population towards increases in the MW, the consensus in the EU on these approaches, and the negotiation with the social partners, although some may disagree. In order to implement a policy of this nature, it is essential that the measure in question is fit for purpose and feasible, and that it enjoys the consensus of public opinion and the support of the most influential interest groups, so as to prevent subsequent regression.
The limitations of this study relate to the need to analyse further effects arising from the MW. Other aspects, such as the effect on productivity, consumption, and thus economic growth, inflation, etc., need to be analysed. The comprehensive analysis of all effects will be very useful in determining the net, direct, and indirect effects of this measure.
Although it is not the specific object of this work, the inclusion of complementary explanatory variables in the models allows us to observe significant differences in terms of the impact in the case of gender, the form of cohabitation, or the level of tertiary education. The study shows that income is higher for men than for women, that it is lower when living alone than with a partner, and that it is higher in the case of having tertiary education. However, to study the impact on these groups, a more specific analysis is necessary, which will be addressed in future studies.
Practical Recommendations
For the implementation of a desirable and feasible measure to really work, it needs to be properly planned. Good design is what can transform a potentially powerful tool into an effective instrument whose benefits outweigh the costs and which can improve the lives of millions of low-paid workers at the lower end of the wage distribution. This must be done by considering that:
- Minimum wage coverage needs to be universal so that it does not leave out any vulnerable groups such as domestic services, the agricultural sector, or the hotel and catering industry.
- The level or amount of the minimum wage, i.e., too low is not enough to overcome poverty and too high can affect employment and fulfilment, must be just high enough to allow for a dignified life.
- The level of compliance must be adequate, although it will in any case affect if compliance is very low, when it will not have as much of a positive effect.
- There should be a mechanism for automatic updating of the minimum wage to avoid the progressive loss of its purchasing power, as recommended by the Directive EU 2022.
- For the Spanish case, it is proposed to re-link the IPREM to the minimum wage in order to really have a significant effect on transfers aimed at eliminating poverty.
- Finally, a permanent and independent minimum wage Monitoring Commission, along the lines of those that exist in Germany or the UK, should be set up.
This study is part of a research programme on different aspects of inequality and poverty and how to overcome both. Thus, different articles have been produced on universal basic income in relation to employment (De Paz-Báñez et al. 2020) and entrepreneurship (Aceytuno et al. 2020); on the relationship between inequality and neoliberal solutions at the global level (Sánchez-López and de Paz Báñez 2016); or relating MW to employment, inequality or consumption, economic growth, or inflation.
Author Contributions
Conceptualization, M.A.d.P.-B., C.S.-L. and M.J.A.-C.; methodology, M.A.d.P.-B., C.S.-L. and M.J.A.-C.; software, C.S.-L.; validation, M.A.d.P.-B., C.S.-L. and M.J.A.-C.; formal analysis, M.A.d.P.-B., C.S.-L. and M.J.A.-C.; investigation, M.A.d.P.-B., C.S.-L. and M.J.A.-C.; resources, M.A.d.P.-B., C.S.-L. and M.J.A.-C.; data curation, C.S.-L.; writing—original draft preparation, M.A.d.P.-B., C.S.-L. and M.J.A.-C.; writing—review and editing, M.A.d.P.-B., C.S.-L. and M.J.A.-C.; supervision, M.A.d.P.-B., C.S.-L. and M.J.A.-C. All authors have read and agreed to the published version of the manuscript.
Funding
This research received no external funding.
Institutional Review Board Statement
Not applicable.
Informed Consent Statement
Not applicable.
Data Availability Statement
The data comes from secondary sources, however, it is available to interested persons who request it.
Conflicts of Interest
The authors declare no conflict of interest.
Appendix A. Systematic Review of the Effects of the MW on Income Inequality and Poverty (Following the PRISMA 2020 Methodology): Summary Report
The PRISMA (Preferred Reporting Items for Systematic reviews and Meta-Analyses) methodology allows for systematic literature reviews that provide a high degree of assurance that they will be comprehensive and unbiased. In any case, it will be transparent, complete, and accurate, susceptible to evaluation by other interested parties as it is declared and available to anyone: what has been done, why, with what criteria, and what the results of the review are. The first version of the PRIMA methodology dates from 2009, the most recent, and the one used here dates from 2020.12
The following is the summary report of the systematic review carried out for this article, the corresponding flow diagram, and the summary table of results. The corresponding protocol was carried out and is available. All of this follows the criteria recommended by the PRISMA 2020 methodology.
Rationale. Research on the effects of the MW is mostly focused on employment, but not enough on the effect on inequality and poverty, which is the real objective of this measure. Furthermore, the focus is on work that has been carried out since the 1990s. In addition, since there are several literature reviews from then until 2019, the focus is on those two decades, with the existing reviews supplemented by articles that might not have been included. Furthermore, the emphasis is entirely on the last five years (2020–2024), as there is a lack of reviews in this period. Therefore, a systematic review of these studies is intended in order to continue to provide empirical evidence on this effect.
Objectives. To collect and evaluate empirical evidence on the effects of MW implementation on poverty and inequality reduction in the territories where it is implemented. The question is therefore: What does the empirical evidence say about the effects of minimum wage regulation on poverty and inequality?
Method. The PRISMA methodology is used, specifically the 2020 version. Given the scarcity of empirical evidence on the impact of the minimum wage on inequality, all methodologies and territories are considered in the selected studies in order to obtain all relevant information on the issue.
Eligibility criteria. All empirical studies related to the current research question, published in peer-reviewed journals that are indexed to define their scientific quality, are considered. Therefore, in the first screening, all studies that have not been peer-reviewed are discarded. Recent studies, carried out in the last decades (1995–2024), are especially targeted. English has been considered the reference language, although the initial search is conducted in both English and Spanish. Non-empirical, merely declarative, or opinion studies, or studies that do not use a scientific method of analysis that clearly identifies its specifications and results are not considered.
Sources of information. The 140 publication databases that the University of Huelva collects in its Columbus-UHU publications meta-database, which groups all the important ones (see the complete list at https://guiasbuh.uhu.es/az.php, accessed on 3 April 2024), are considered, as are the ProQuest database, which provides access to 47 databases. References of published systematic reviews on the topic are also reviewed. To ensure saturation of the literature, the reference lists of included studies are explored (“cascade search”). Finally, the publications made by the authors of the selected studies are reviewed to ensure that all relevant material has been captured. The selected papers are screened by the working group at all stages of the procedure outlined in the protocol to avoid the risk of bias.
Search strategy. The first exploratory search is conducted for individual keywords, specifically, “minimum wage”, “inequality”, and “poverty”. Secondly, combinations close to the systematic review question are used: “minimum wage”, “inequality”, and “poverty” are searched in the Columbus-UHU bibliographic database in English and Spanish and in the multidisciplinary ProQuest database. Possible systematic reviews are also searched for in different corresponding databases. Subsequently, these searches are carried out in Google Scholar following the same guidelines.
Once the keywords and final reference date have been clearly determined, the process is re-run in both the Columbus and ProQuest catalogues. The search is updated by the end of the review, after validation, to ensure that any indexed sources contain a high proportion of eligible studies and are up to date.
Summary of the Procedure Used in the Search and Systematic Screening: Bias Analysis
- Stage 1. General search
Selection of bibliographic databases. The resources offered by the University of Huelva, which, in collaboration with all Spanish universities, the EU, and, in general, all universities in the world, has a combined system of 140 databases containing all the key articles in the field, were used (Columbus-UHU: https://guiasbuh.uhu.es/az.php, accessed on 3 April 2024). The process was re-run using the ProQuest database, which provides access to 47 international databases, and on Google Scholar.
From here, the first searches were conducted in January 2024. The keyword searches were in English and Spanish. Keyword searches were performed on titles and abstracts so that work published in other languages with abstracts in English and/or Spanish has also been reviewed. The search was repeated in June 2024 to capture more recent publications.
In the first stage, publication dates were not considered. Then, following the protocol developed, studies since 1995 were selected. First, preliminary control searches were carried out using separately the keywords “minimum wage”, “inequality”, and “poverty”. In this preliminary search, the keyword “poverty” was not discriminated against and was therefore not considered in the following stages. This first search included not only publications in scientific journals but also doctoral theses, working papers, and grey literature such as reports from specific official bodies and other grey literature. Duplicates were subsequently removed. A total of 1609 papers were found, of which 734 were peer-reviewed articles.
- Stage 2. Screening and Selection of reference period
The final screening and selection were carried out in the following way: Keywords in abstracts: “minimum wage” and “inequality”, peer-reviewed, and with full text available. As a result, a total of 153 articles were found. In the analysis of the texts, the following screening criteria were applied: (a) a significant number of them did not carry out an empirical analysis (14) and another 103 did not address the topic under study; (b) comprehensive reviews up to the year 2020 were found. Therefore, the final selection was made from that date onwards, and the restriction of available full text was eliminated. The final search was therefore carried out using the aforementioned keywords, starting in 2020 and eliminating the restriction of text availability. With these criteria, an initial list of 133 articles was obtained. By applying these same exclusion criteria (non-empirical and not related to the topic), a total of 31 papers were selected, after including the articles rescued by other means and updating the search to June 2024 (see flow diagram below).
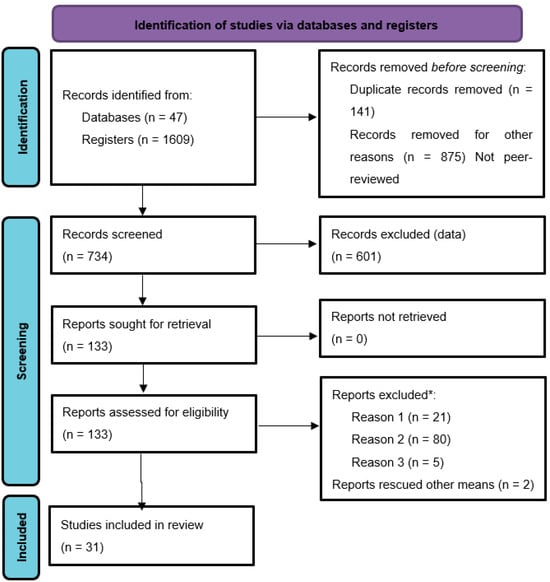
Figure A1.
PRISMA 2020 flow diagram. * 1: Not empirical nor review; 2: No topic-related; 3: Duplicates. From: Page et al. (2021).
Figure A1.
PRISMA 2020 flow diagram. * 1: Not empirical nor review; 2: No topic-related; 3: Duplicates. From: Page et al. (2021).

Appendix B
Table A1.
Summary Table of the Systematic Review Results.
Table A1.
Summary Table of the Systematic Review Results.
| Reference | Period | Objective | Treatment Group | Control Group | Place | Methodology | Data Sources Used | Results |
|---|---|---|---|---|---|---|---|---|
| (Bossler and Schank 2023) | 2011–2017 | Wage inequality | High impact regions | Low impact regions | Germany | DD. by quantile-Card 1992 | IEB-Administrative-Individual data | 12% MW-induced wage increase at the 5th percentile; 21% at the 20th percentile: 2% at the 50th percentile. Null effect beyond the median. |
| (Burauel et al. 2020) | 2010–2016 | Wages and income | Wage < MW (8.5) | 8.5 ≤ Wage < 10 | Germany | DTADD | SOEP-Survey-Individual data | MW induced wage increase 6.5%. Induced monthly income increase of 6.6%. |
| (Caliendo et al. 2023) | 2013–2018 | Wages | High impact regions | Low impact regions | Germany | DD. by quantile-Card 1992 | SOEP-Survey-Individual data | 9% in 2015 and 21% between 2016 and 2018 in the first quintile. |
| (Derenoncourt and Montialoux 2021) | 1967 | Racial inequality | Average annual earnings of workers covered in 1967 | Average annual earnings of workers covered before 1967 | USA | DD | Industry wage reports BLS-Survey-Wage distributions and individual data | The expansion of the minimum wage in 1967 can explain more than 20% of the reduction in the racial income gap during the civil rights era. |
| (Forsythe 2023) | 2011–2018 | Wage and occupational distribution | States that increased their MW in 2009–2016 | States that did not increase their MW in 2009–2016 | USA | DD | OEWSP- Surveys-Establishment level | Overall wage inequality decreases within establishments after minimum wage increases. |
| (Frank 2021) | 1977–2011 | Indirect effects high income | High impact states | Low impact states | USA | DD | IRS Tax-Administrative-Individual data | There is a causal relationship between declining real MW and rising inequality. |
| (Ohlert 2023) | 2014–2015 | Gender inequality | Companies with at least one employee earning less than MW. | Companies without employees with less than MW | Germany | DD | VSE 2014 and VE 2015-Surveys-Companies | Significant reduction in the gender pay gap |
| (Pérez 2020) | 1996–2000 | Formal and informal wages | High impact city-industry blocks | Low impact city-industry blocks | Colombia | DD-Card 1992 | ENH-Survey-Individual data | Formal wage growth > informal. Induced wage growth (formal) 3%. |
| (Sotomayor 2021) | 1995–2015 | Inequality and poverty | Treatment region Río de Janeiro | Control region São Paulo | Brazil | DD-Card 1992 | PMEs-Surveys-Household data | Poverty and income inequality fall, on average, by 2.8% and 2.4%. The effects fade over time. |
| (Beccaria et al. 2020) | 2002–2015 | Negotiated wages | No | No | Argentina | Descriptive | EPH-Survey-Individual data | Without significant effect on the process of reducing the gap between negotiated wage rates. |
| (Cho and Yang 2021) | 2010–2020 | Gender inequality | No | No | Korea | Descriptive | Sample in the Korean stock market | MW reduces the gender pay gap. |
| (Laporšek et al. 2021 ) | 2005–2015 | Wage inequality | No | No | Slovenia | Descriptive | SURS-Administra-tive-Individual data | MW reduces wage inequality. The effect was greater for women, young people, and workers with a lower level of education or low occupation. |
| (Alinaghi et al. 2020) | 2012–2013 | Inequality | No | No | N. Zealand | Microsimulation | HES-Survey-Individual data | Small effect. |
| (Backhaus and Müller 2023) | 2012–2016 | Inequality Household | No | No | Germany | Descriptive/simulation | SOEP-Survey-Individual and household data | Substantial impact on the lower end of the wage distribution, but not on poverty. |
| (Engbom and Moser 2022) | 1996–2012 | Infant mortality | No | No | Brazil | Labour market equilibrium model | The MW increase represents 45% of a large fall in income inequality during 1996 to 2012. | |
| (Grünberger et al. 2021) | 2017 | Inequality and poverty | No | No | European Union | Microsimulation-EUROMOD | EU-SILC-surveys-Individual data | MW increases can significantly reduce in-work poverty, wage inequality, and the pay gap between men and women. |
| (Long 2022) | 2014–2017 | Inequality and income | No | No | USA (Seatle) | Simulation-Synthetic control | SWESD-Administrative-Individual data | Local minimum wage laws are unlikely to substantially reduce income inequality. |
| (Fortin et al. 2021) | 1979 a 2017 | Indirect effects on wage inequality | No | No | USA | Regression | CPS-Survey-Individual data | Indirect effects increase the explanatory power of the decline in MW by up to two-thirds of the increase in inequality at the lower end of the female wage distribution. |
| (Sefil-Tansever and Yılmaz 2024 ) | 2004–2020 | Income inequality | No | No | Turkey | Regression | HLFS-Survey-Individual data | Significant reduction in Income inequality. |
| (Bakis and Polat 2023) | 2002–2019 | Wage inequality | No | No | Turkey | Regression (semiparametric decomposition analysis) | HLFS-Survey-Individual data | Significant reduction in wage inequality. |
| (Bassier and Ranchhod 2024) | 2010–2014 | Income and poverty. Agricultural | No | No | South Africa | Regression | QSWP-Survey-Individual data | Farmworkers were 7% less likely to have household income per person below the poverty line. |
| (Chao et al. 2022) | 2005–2015 | Wage inequality | No | No | 43 Countries | Regression | WDI and ILOSTAT-Aggregated data | An increase in the urban MW reduces the wage gap between skilled and unskilled workers. |
| (Engelhardt and Purcell 2021) | 1981–2015 | Wage inequality | No | No | USA | Regression | CWHS/LEED-Survey/administrative-Individual data | Minimum wage increases are associated with increases in annual earnings for men in the bottom quartile, and especially in the bottom decile. |
| (Herrero-Olarte and Sosa 2020) | 2002–2011 | Income inequality | No | No | South America | Regression (Random effects model) | CEDLAS-per capita income by decile-Aggregated data | MW increases the lowest wages and reduces inequality although it was minimal (due to informality). |
| (Herrero-Olarte 2023) | 2007–2017 | Work market | No | No | Ecuador | Regression (Double fixed effects model) | ENEMDU-Survey-Individual data | Significant indirect effect. |
| (Herrero-Olarte 2022) | 2007–2014 | Middle class | No | No | Ecuador | Regression (Double fixed effects model) | ENEMDU-Survey-Individual data | MW variations are especially related to the lower-intermediate deciles. |
| (Joe and Moon 2020) | 1990–2017 | Wage inequality | No | No | OECD | Regression | OECD dataset | An increase in the MW reduces wage inequality at the bottom of the wage distribution. |
| (Saboia et al. 2021) | 2012–2019 | Labor income | No | No | Brazil | Regression | PNAD-Survey-Individual data | MW increases the lowest and middle wage significant except on the income of the first two tenths of the distribution. |
| (Tamkoç and Torul 2020) | 2022–2016 | Wage inequality | No | No | Turkey | Regression + Hypothetical (counterfactual experiment) | HBS and SILC-surveys-Individual data | The rapid growth of the minimum wage coincides with a decrease in wage inequality (correlation coefficient 0.54). |
| (Bükey 2022) | 1987–2017 | Income inequality | No | No | Turkey | Autoregressive Distributed Lag (ARDL) | MLSS-Aggregated and individual data | A 1% increase in MW reduces the Gini coefficient by 0.061%. |
| (Sari and Purwono 2021) | 2005–2018 | Income inequality | No | No | Indonesia | Long-run structural vector autoregression (SVAR) | ICSO | MW reduces income inequality and poverty. |
Appendix C
Table A2.
Results from applying the difference-in-differences methodology.
Table A2.
Results from applying the difference-in-differences methodology.
| Test 1. Treatment group: people with incomes equal to or below the MW; control group: the rest of the target population. | ||||
| Non-Stand Coef. | Stand. Coef. | t | p | |
| Constant | 10.03 | 938.959 | 0.000 | |
| β1 | 0.052 | 0.050 | 4.501 | 0.000 |
| β2 | −1.23 | −0.641 | −43.578 | 0.000 |
| β3 | 0.302 | 0.110 | 7.382 | 0.000 |
| Adjusted R-Squared | 0.472 | |||
| Durbin–Watson | 0.938 | |||
| Test 2. Treatment group: people with incomes at or below the MW; control group: people in the target population with incomes above two-thirds of the median income in 2019. | ||||
| Non-Stand Coef. | Stand. Coef. | t | p | |
| Constant | 10.138 | 936.991 | 0.000 | |
| β1 | 0.020 | 0.019 | 1.709 | 0.000 |
| β2 | −1.151 | −0.784 | −52.805 | 0.000 |
| β3 | 0.441 | 0.222 | 14.481 | 0.000 |
| Adjusted R-Squared | 0.553 | |||
| Durbin–Watson | 1.218 | |||
| Dependent variable. Log of income.The same tests have been applied to treatment variables 2 and 3 and the results have been similar. coefficients of the independent variable year × treatment. | ||||
Table A3.
The coefficient (β) and the percentage change it represents, according to Halvorsen and Palmquist (1980) and Kennedy (1981).
Table A3.
The coefficient (β) and the percentage change it represents, according to Halvorsen and Palmquist (1980) and Kennedy (1981).
| Case 1 | Case 2 | Case 3 | |
|---|---|---|---|
| Variable “Year” | |||
| Model (1) | 0.021→2.12% (2.11%) | 0.031→3.15% (3.14%) | 0.041→4.19% (4.17%) |
| Model (2) | 0.020→2.01% (2.02%) | 0.03→3.05% (3.04%) | 0.039→3.98% (3.97%) |
| Variable “Treatment” | |||
| Model (1) | −1.062→−65.42% (-65.44%) | −0.982→−62.54% (−62.55%) | −0.786→−54.43% (−54.44%) |
| Model (2) | −1.024→−64.08% (−64.10%) | −0.954→−61.48% (−61.49%) | −0.731→−51.86% (−51.86) |
| Variable “Treatment xYear” | |||
| Model (1) | 0.187→20.56% (20.54%) | 0.036→3.67% (3.65%) | 0.019→1.92% (1.90%) |
| Model (2) | 0.188→20.68% (20.66%) | 0.037→3.77% (3.76) | 0.018→1.82% (1.80%) |
| Variable “Gender” | |||
| Model (2) | −0.023→−2.27% (−2.28%) | −0.019→−1.88% (−1.89%) | −0.063→−6.11% (−6.11%) |
| Var. “Living as a couple” | |||
| Model (2) | −0.035→−3.44% (−3.45%) | −0.024→−2.37% (−2.38%) | −0.034→−3.34% (−3.35%) |
| Variable “Education” | |||
| Model (2) | 0.062→6.40% (6.39%) | 0.052→5.34% (5.33%) | 0.182→19.96% (19.96%) |
Note: The value obtained by applying the Kennedy (1981) and Giles (1982) formula appears in parentheses.
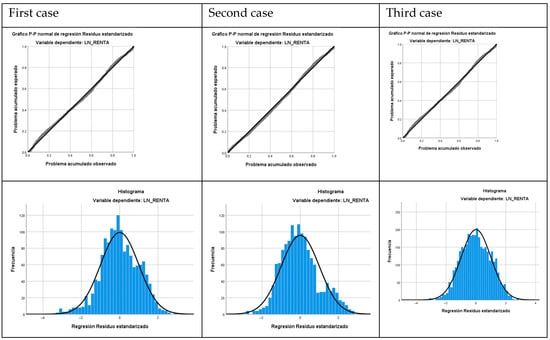
Figure A2.
Normal P–P plots and scatter plots.
Figure A2.
Normal P–P plots and scatter plots.
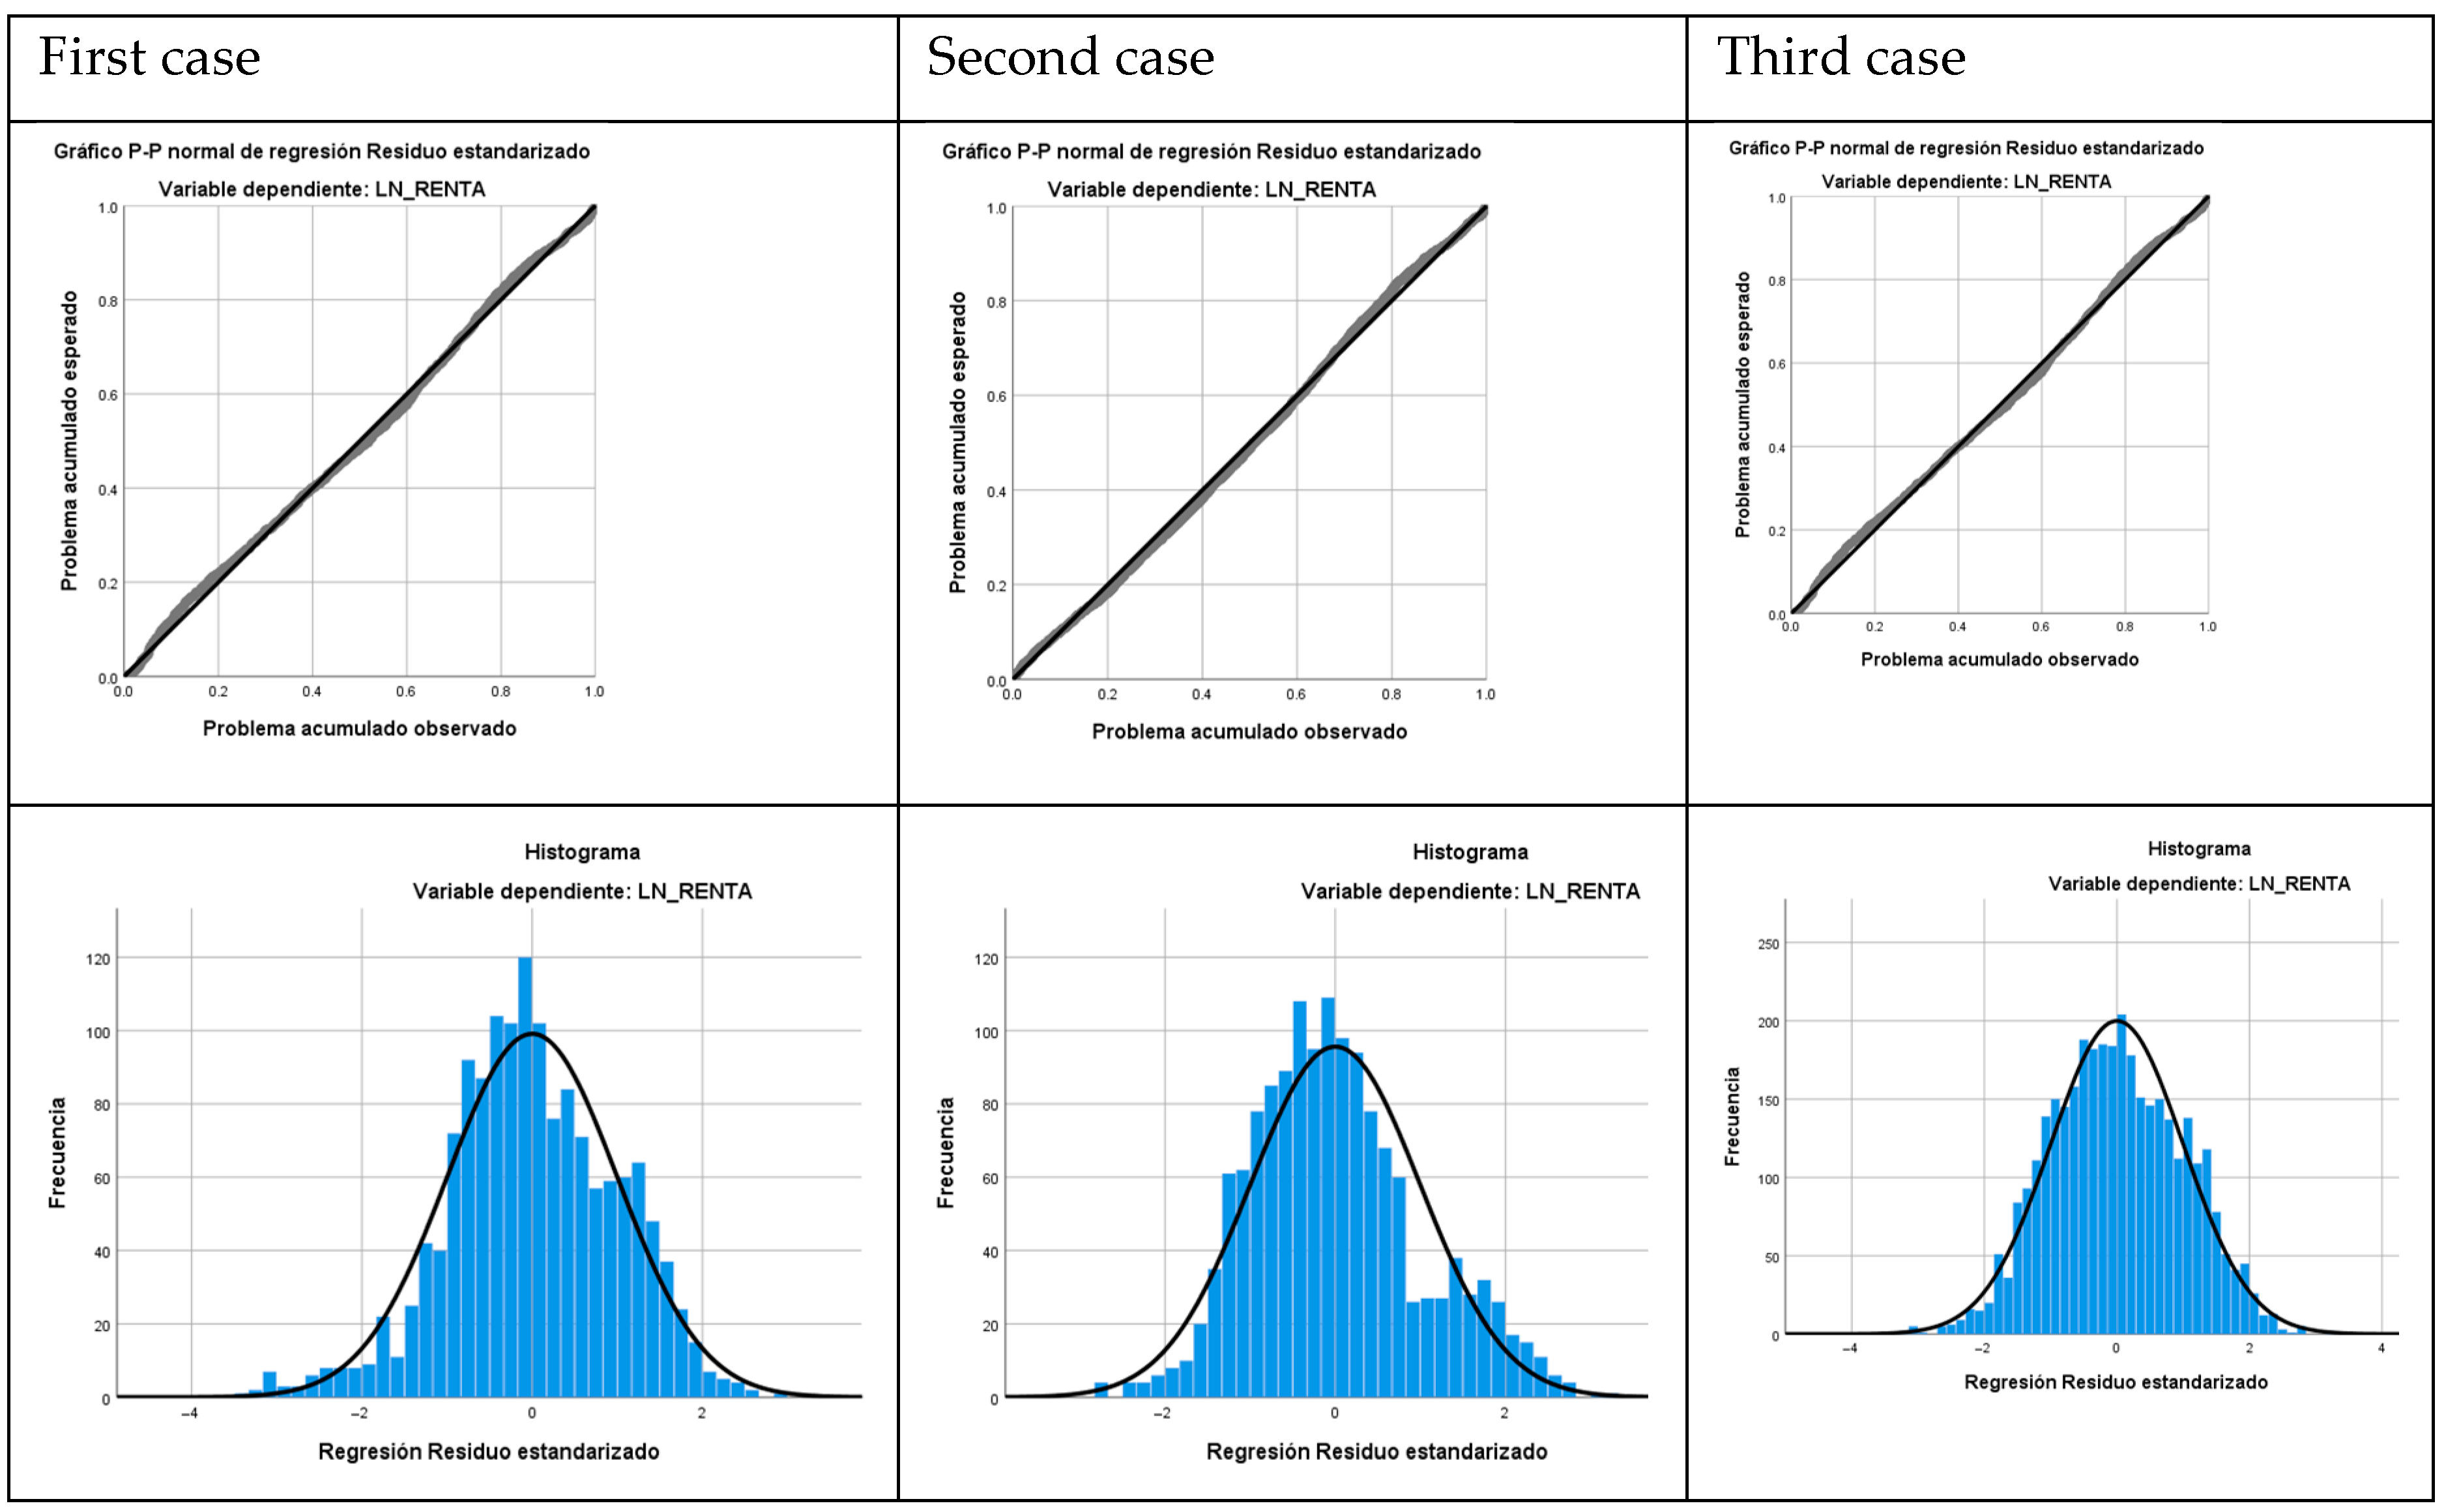
Notes
| 1 | The first minimum wage legislation was enacted in the Australian state of Victoria in 1890, following major workers’ demands and demonstrations, and at the national level, in New Zealand in 1894. The International Labour Office (ILO) has paid particular attention to this issue since its inception. Indeed, the preamble to its 1919 Constitution stressed the importance of the urgent improvement of working conditions and emphasised the need to ensure “an adequate living wage”. |
| 2 | Lowered from the previous version which set it at 68%. Directive 2022/2041 (Art. 5.4) lowers it again to 60% of the median gross wage or 50% of the average gross wage and transforms it into a mere recommendation. |
| 3 | In any case, the articles found for the pre-2020 stage were reviewed using the same procedure as for the 2020–2024 period, although only at abstract level in case there were any interesting results not referenced in the aforementioned reviews. A total of 153 empirical articles were found, of which 14 were rejected for not providing specific evidence and 57 for not being related to the topic under analysis, leaving a total of 34. The results of all these studies have been included in the previous reviews and are included in the present one. |
| 4 | Yet, four technical works have been found by other means, as discussed below. |
| 5 | As in (Grünberger et al. 2021) by applying simulation. |
| 6 | Alinaghi et al. (2020), using microsimulation methodology, found that an increase in the minimum wage may have a more substantial effect on some measures against poverty for single-parent employed families in New Zealand. |
| 7 | The “market” Gini index, i.e., before taking account of taxes and social transfers, has been used to better illustrate the relationship with the increase in MW, without affecting other measures of inequality reduction. |
| 8 | The problem with the so-called “grey literature” (institutional) is that they are commissioned technical works that do not usually address conceptual, theoretical, and methodological issues. Moreover, they do not usually undergo external evaluations that are able to verify the methodological robustness of the analysis, so that their results can hardly count as scientific evidence. In any case, the results are analysed in order to verify the results. The following is a list of the results found: Instituto de Estudios Fiscales (Arranz Muñoz and García-Serrano 2023; Eurofound 2022; CAASMI 2021, 2022). |
| 9 | The classification of the target population by income level is based on the definitions used by the OECD for the calculation of wage levels and the establishment of high and low wage incidence rates in the Employment Outlook report. Available at: https://data.oecd.org/earnwage/wage-levels.htm (accessed on 30 April 2024). |
| 10 | According to the Spanish CIS, the Centre for Sociological Research, 71% of Spaniards were in favour or very much in favour of the measure. |
| 11 | This is what has been recently done with pensions is Spain, which are almost automatically updated. |
| 12 | Here are the links to the most relevant documents for applying this methodology: Elaboration of the Protocol: https://www.bmj.com/content/349/bmj.G7647 (accessed on 3 April 2024); full checklist: https://prisma.shinyapps.io/checklist/ (accessed on 3 April 2024); flow diagram: https://www.prisma-statement.org/prisma-2020-flow-diagram (accessed on 3 April 2024); and explanatory guidance for conducting the systematic review: https://www.bmj.com/content/372/bmj.n160?ijkey=f8955c1394a4fda7939b8b197f23c8b4e3ef260e&keytype2=tf_ipsecsha (accessed on 3 April 2024). |
References
- Aceytuno, M. Teresa, Celia Sánchez-López, and Manuela A. de Paz-Báñez. 2020. Rising inequality and entrepreneurship during economic downturn: An analysis of opportunity and necessity entrepreneurship in spain. Sustainability 12: 4540. [Google Scholar] [CrossRef]
- Alinaghi, Nazila, John Creedy, and Norman Gemmell. 2020. The redistributive effects of a minimum wage increase in new zealand: A microsimulation analysis. Australian Economic Review 53: 517–38. [Google Scholar] [CrossRef]
- Allegretto, Sylvia, Arindrajit Dube, Michael Reich, and Ben Zipperer. 2017. Credible research designs for minimum wage studies. ILR Review 70: 559–92. [Google Scholar] [CrossRef]
- Arranz Muñoz, Jose M., and Carlos García-Serrano. 2023. Los efectos de una subida del salario mínimo sobre los ingresos familiares, la desigualdad y la pobreza. Papeles De Trabajo El Instituto De Estudios Fiscales. Serie Economía 10: 1–34. [Google Scholar]
- Autor, David H., Alan Manning, and Christopher L. Smith. 2016. The contribution of the minimum wage to US wage inequality over three decades: A reassessment. American Economic Journal: Applied Economics 8: 58–99. [Google Scholar] [CrossRef]
- Autor, David H., Lawrence F. Katz, and Melissa S. Kearney. 2008. Trends in US wage inequality: Revising the revisionists. The Review of Economics and Statistics 90: 300–23. [Google Scholar] [CrossRef]
- Backhaus, Teresa, and Kai-Uwe Müller. 2023. Can a federal minimum wage alleviate poverty and income inequality? Ex-Post and simulation evidence from germany. Journal of European Social Policy 33: 216–32. [Google Scholar] [CrossRef]
- Bakis, Ozan, and Sezgin Polat. 2023. Wage inequality dynamics in turkey. Empirica 50: 657–94. [Google Scholar] [CrossRef]
- Bartels, Larry M. 2016. Unequal Democracy: The Political Economy of the New Gilded Age. Princeton: Princeton University Press. [Google Scholar]
- Bassier, Ihsaan, and Vimal Ranchhod. 2024. Can minimum wages effectively reduce poverty under low compliance? A case study from the agricultural sector in south africa. Review of Political Economy 36: 398–419. [Google Scholar] [CrossRef]
- Beccaria, Luis, Ana Laura Fernández, and David Trajtemberg. 2020. Reducción de la desigualdad de las remuneraciones e instituciones en argentina (2002–2015). Cuadernos De Economía 39: 731–63. [Google Scholar] [CrossRef]
- Belman, Dale, and Paul J. Wolfson. 2014. What Does the Minimum Wage Do? Kalamazoo: WE Upjohn Institute. [Google Scholar]
- Bosch, Mariano, and Marco Manacorda. 2010. Minimum wages and earnings inequality in urban mexico. American Economic Journal: Applied Economics 2: 128–49. [Google Scholar] [CrossRef]
- Bossler, Mario, and Thorsten Schank. 2023. Wage inequality in germany after the minimum wage introduction. Journal of Labor Economics 41: 813–57. [Google Scholar] [CrossRef]
- Brown, Charles. 1999. Minimum wages, employment, and the distribution of income. In Handbook of Labor Economics. Edited by Orley Ashenfelter and David Card. Amsterdam: Elsevier, pp. 2101–63. Available online: https://EconPapers.repec.org/RePEc:eee:labchp:3-32 (accessed on 24 March 2024).
- Brown, Charles, Curtis Gilroy, and Andrew Kohen. 1982. The effect of the minimum wage on employment and unemployment. Journal of Economic Literature 20: 487–528. [Google Scholar] [CrossRef]
- Burauel, Patrick, Marco Caliendo, Markus M. Grabka, Cosima Obst, Malte Preuss, Carsten Schröder, and Cortnie Shupe. 2020. The impact of the german minimum wage on individual wages and monthly earnings. Jahrbücher Für Nationalökonomie Und Statistik 240: 201–31. [Google Scholar] [CrossRef]
- Bükey, Abdullah Miraç. 2022. Türkiye’de ücret politikaları ve gelir dağılımı eşitsizliği İlişkisi. Alanya Akademik Bakış 6: 3109–28. [Google Scholar] [CrossRef]
- CAASMI (Comisión asesora para el análisis del SMI). 2021. El impacto de la subida del salario mínimo interprofesional en la desigualdad y el empleo. Available online: https://shre.ink/DlzD (accessed on 24 March 2024).
- CAASMI (Comisión asesora para el análisis del SMI). 2022. II Informe de la comisión asesora para el análisis del SMI. ISEAK. Available online: https://www.tercerainformacion.es/wp-content/uploads/2022/12/SMIV5.pdf (accessed on 24 March 2024).
- Caliendo, Marco, Alexandra Fedorets, Malte Preuss, Carsten Schröder, and Linda Wittbrodt. 2023. The short- and medium-term distributional effects of the german minimum wage reform. Empirical Economics 64: 1149–75. [Google Scholar] [CrossRef]
- Card, David, and Alan B. Krueger. 1992. Does school quality matter? Returns to education and the characteristics of public schools in the united states. Journal of Political Economy 100: 1–40. [Google Scholar] [CrossRef]
- Card, David, and Alan B. Krueger. 1995. Myth and measurement: The new economics of the minimum wage. Industrial and Labor Relations Review 48: 827–49. [Google Scholar] [CrossRef]
- Card, David, and Alan B. Krueger. 2016. Myth and Measurement: The New Economics of the Minimum Wage. Princeton: Princeton University Press. [Google Scholar]
- Card, David, and John E. DiNardo. 2002. Skill-biased technological change and rising wage inequality: Some problems and puzzles. Journal of Labor Economics 20: 733–83. [Google Scholar] [CrossRef]
- Chao, Chi-Chur, Mong Shan Ee, Xuan Nguyen, and Eden S. H. Yu. 2022. Minimum wage, firm dynamics, and wage inequality: Theory and evidence. International Journal of Economic Theory 18: 247–71. [Google Scholar] [CrossRef]
- Cho, Jungho, and Daecheon Yang. 2021. Impact of minimum wage legislation on gender differentials in sticky wages: Evidence from korea. Applied Economics Letters 30: 855–58. [Google Scholar] [CrossRef]
- De Paz-Báñez, Manuela A., María José Asensio-Coto, Ceclia Sánchez-López, and María Teresa Aceytuno. 2020. Is there empirical evidence on how the implementation of a universal basic income (UBI) affects labour supply? A systematic review. Sustainability 12: 9459. [Google Scholar] [CrossRef]
- Derenoncourt, Ellora, and Claire Montialoux. 2021. Minimum wages and racial inequality. The Quarterly Journal of Economics 136: 169–228. [Google Scholar] [CrossRef]
- Dickens, Richard, and Alan Manning. 2004. Has the national minimum wage reduced UK wage inequality? Journal of the Royal Statistical Society Series A: Statistics in Society 167: 613–26. [Google Scholar] [CrossRef]
- Dickens, Richard, Alan Manning, and Tim Butcher. 2012. Minimum Wages and Wage Inequality: Some Theory and an Application to the UK. Falmer: University of Sussex Business School. [Google Scholar]
- DiNardo, John, Nicole M. Fortin, and Thomas Lemieux. 1996. Labor market institutions and the distribution of wages, 1973–1992: A semiparametric approach. Econometrica 64: 1001–44. [Google Scholar] [CrossRef]
- Dube, Arindrajit. 2019a. Impacts of Minimum Wages: Review of the International Evidence. Independent Report. UK Government Publication. Cambridge: National Bureau of Economic Research (NBER). [Google Scholar]
- Dube, Arindrajit. 2019b. Minimum wages and the distribution of family incomes. American Economic Journal: Applied Economics 11: 268–304. [Google Scholar] [CrossRef]
- Dustmann, Christian, Attila Lindner, Uta Schönberg, Matthias Umkehrer, and Philipp Vom Berge. 2022. Reallocation effects of the minimum wage. The Quarterly Journal of Economics 137: 267–328. [Google Scholar] [CrossRef]
- Dütsch, Matthias, Clemens Ohlert, and Ame Baumann. 2024. The Minimum Wage in Germany: Institutional Setting and a Systematic Review of Key Findings. Jahrbücher Für Nationalökonomie Und Statistik. Berlin: Walter de Gruyter GmbH. [Google Scholar] [CrossRef]
- Engbom, Niklas, and Christian Moser. 2022. Earnings inequality and the minimum wage: Evidence from brazil. American Economic Review 112: 3803–47. [Google Scholar] [CrossRef]
- Engelhardt, Gary V., and Patrick J. Purcell. 2021. The minimum wage and annual earnings inequality. Economics Letters 207: 110001. [Google Scholar] [CrossRef]
- Eurofound. 2022. Minimum Wages in 2022: Annual Review. Minimum Wages in the EU Series; Luxembourg: Publications Office of the European Union. [Google Scholar]
- Eurofound. 2024. Minimum Wages: Non-Compliance and Enforcement across EU Member States–Comparative Report. Luxembourg: Publications Office of the European Union. [Google Scholar]
- Forsythe, Eliza. 2023. The effect of minimum wage policies on the wage and occupational structure of establishments. Journal of Labor Economics 41: S291–S324. [Google Scholar] [CrossRef]
- Fortin, Nicole M., Thomas Lemieux, and Neil Lloyd. 2021. Labor market institutions and the distribution of wages: The role of spillover effects. Journal of Labor Economics 39: S369–S412. [Google Scholar] [CrossRef]
- Frank, Mark. 2021. Minimum wage laws and top income shares: Evidence from A large panel of states. Journal of Business Strategies 38: 25–37. [Google Scholar] [CrossRef]
- Freeman, Richard B. 1996. The minimum wage as a redistributive tool. The Economic Journal 106: 639–49. [Google Scholar] [CrossRef]
- Giles, David Evan Albert. 1982. The interpretation of dummy variables in semilogarithmic equations: Unbiased estimation. Economics Letters 10: 77–79. [Google Scholar] [CrossRef]
- Gramlich, Edward, Robert J. Flanagan, and Michael L. Wachter. 1976. Impact of minimum wages on other wages, employment, and family incomes. Brookings Papers on Economic Activity 7: 409–62. Available online: https://EconPapers.repec.org/RePEc:bin:bpeajo:v:7:y:1976:i:1976-2:p:409-462 (accessed on 2 May 2024). [CrossRef]
- Grünberger, Klaus, Edlira Narazani, Stefano Filauro, and Kiss Áron. 2021. Social and fiscal impacts of statutory minimum wages in EU countries: A microsimulation analysis with EUROMOD. IZA Journal of Labor Policy 12: 1–39. [Google Scholar] [CrossRef]
- Halvorsen, Robert, and Raymond Palmquist. 1980. The Interpretation of Dummy Variables in Semilogarithmic Equations. American Economic Review 70: 474–75. Available online: https://EconPapers.repec.org/RePEc:aea:aecrev:v:70:y:1980:i:3:p:474-75 (accessed on 24 March 2024).
- Herrero-Olarte, Ssusana. 2022. Salario mínimo, pobreza y clase media. el caso ecuatoriano. Regional and Sectoral Economic Studies 22: 95–106. [Google Scholar]
- Herrero-Olarte, Susana. 2023. The minimum wage in ecuador. Work Organisation, Labour & Globalisation 17: 105–27. [Google Scholar]
- Herrero-Olarte, Susana, and Fabián Villareal Sosa. 2020. ¿Influyen los salarios mínimos en los ingresos de los más pobres de sudamérica? Regional and Sectoral Economic Studies 20: 139–50. [Google Scholar]
- ILO. 2014. Report of the Committee of Experts on the Application of Conventions and Recommendations. ILC, 103rd Session, 2014, Report III (Part 1B). Geneva: International Labour Office. [Google Scholar]
- Joe, Dong Hee, and Seongman Moon. 2020. Minimum wages and wage inequality in the OECD countries. East Asian Economic Review 24: 253–73. [Google Scholar] [CrossRef]
- Kennedy, Peter. 1981. Estimation with Correctly Interpreted Dummy Variables in Semilogarithmic Equations. American Economic Review 71: 801. Available online: https://EconPapers.repec.org/RePEc:aea:aecrev:v:71:y:1981:i:4:p:801 (accessed on 15 April 2024).
- Laporšek, Suzana, Milan Vodopivec, and Matija Vodopivec. 2021. Lowering wage inequality with the minimum wage increase in slovenia. International Journal of Sustainable Economy 13: 306–21. [Google Scholar] [CrossRef]
- Lee, David S. 1999. Wage inequality in the united states during the 1980s: Rising dispersion or falling minimum wage? The Quarterly Journal of Economics 114: 977–1023. [Google Scholar] [CrossRef]
- Llopis, Josep Banyuls, Ernest Cano Cano, and Empar Aguado Bloise. 2011. La incidencia del salario mínimo interprofesional en sectores de bajos salarios. Cuadernos De Relaciones Laborales 29: 363–89. [Google Scholar]
- Long, Mark C. 2022. Seattle’s local minimum wage and earnings inequality. Economic Inquiry 60: 528–42. [Google Scholar] [CrossRef]
- Neumark, David, and Peter Shirley. 2022. Myth or measurement: What does the new minimum wage research say about minimum wages and job loss in the united states? Industrial Relations: A Journal of Economy and Society 61: 384–417. [Google Scholar] [CrossRef]
- Neumark, David, and William L. Wascher. 2008. Minimum Wages. Edited by David Neumark and William L. Wascher. Cambridge: The MIT Press. [Google Scholar] [CrossRef]
- Neumark, David, John Michael Ian Salas, and William Wascher. 2014. Revisiting the minimum Wage—Employment debate: Throwing out the baby with the bathwater? ILR Review 67: 608–48. Available online: https://EconPapers.repec.org/RePEc:sae:ilrrev:v:67:y:2014:i:3_suppl:p:608-648 (accessed on 15 April 2024). [CrossRef]
- Ohlert, Clemens. 2023. Auswirkungen des gesetzlichen mindestlohns auf geschlechterungleichheiten bei arbeitszeiten und verdiensten. Soziale Welt 74: 562–588. [Google Scholar] [CrossRef]
- Page, Matthew J., Joanne E. McKenzie, Patrick M. Bossuyt, Isabelle Boutron, Tammy C. Hoffmann, Cynthia D. Mulrow, Larissa Shamseer, Jennifer M. Tetzlaff, Elie A. Akl, Sue E. Brennan, and et al. 2021. The PRISMA 2020 statement: An updated guideline for reporting systematic reviews. BMJ 372: 71. [Google Scholar] [CrossRef]
- Pérez, Jorge Pérez. 2020. The minimum wage in formal and informal sectors: Evidence from an inflation shock. World Development 133: 104999. [Google Scholar] [CrossRef]
- Saboia, João, João Hallak, André Simões, and Paulo C. Dick. 2021. Mercado de trabalho, salário-mínimo e distribuição de renda no brasil no passado recente. Revista de Economia Contemporânea 25: e212521. [Google Scholar] [CrossRef]
- Sari, Dyah Wulan, and Rudi Purwono. 2021. Analysis of the relationship between income inequality and social variables: Evidence from indonesia. Economics and Sociology 14: 103–19. [Google Scholar]
- Sánchez-López, Celia, and Manuela A. de Paz Báñez. 2016. Desigualdad y pobreza en la gran recesión. diferencias entre los países de la UE. Revista de Economía Mundial 44: 93–124. [Google Scholar] [CrossRef]
- Sefil-Tansever, Sinem, and Ensar Yılmaz. 2024. Minimum wage and spillover effects in a minimum wage society. Labour 38: 150–76. [Google Scholar] [CrossRef]
- Shiller, Robert J. 2019. Narrative Economics. Princeton: Princeton University Press. [Google Scholar]
- Sotomayor, Orlando J. 2021. Can the minimum wage reduce poverty and inequality in the developing world? Evidence from brazil. World Development 138: 105182. [Google Scholar] [CrossRef]
- Stigler, George J. 1946. The economics of minimum wage legislation. The American Economic Review 36: 358–65. [Google Scholar]
- Tamkoç, Mehmet Nazim, and Orhan Torul. 2020. Cross-sectional facts for macroeconomists: Wage, income and consumption inequality in turkey. The Journal of Economic Inequality 18: 239–59. [Google Scholar] [CrossRef]
- Van Garderen, Kees Jan, and Chandra Shah Shah. 2002. Exact interpretation of dummy variables in semilogarithmic equations. The Econometrics Journal 5: 149–59. [Google Scholar] [CrossRef]
- Vicens Otero, José. 2008. Problemas econométricos de los modelos de diferencias en diferencias. Studies of Applied Economics 26: 363–84. [Google Scholar] [CrossRef]
- Yun, Ji Whan, and Inhye Heo. 2024. Legitimation and perversity: A comparison of the politics of minimum wage reforms in japan and south korea. Asian Studies Review 48: 159–78. [Google Scholar] [CrossRef]
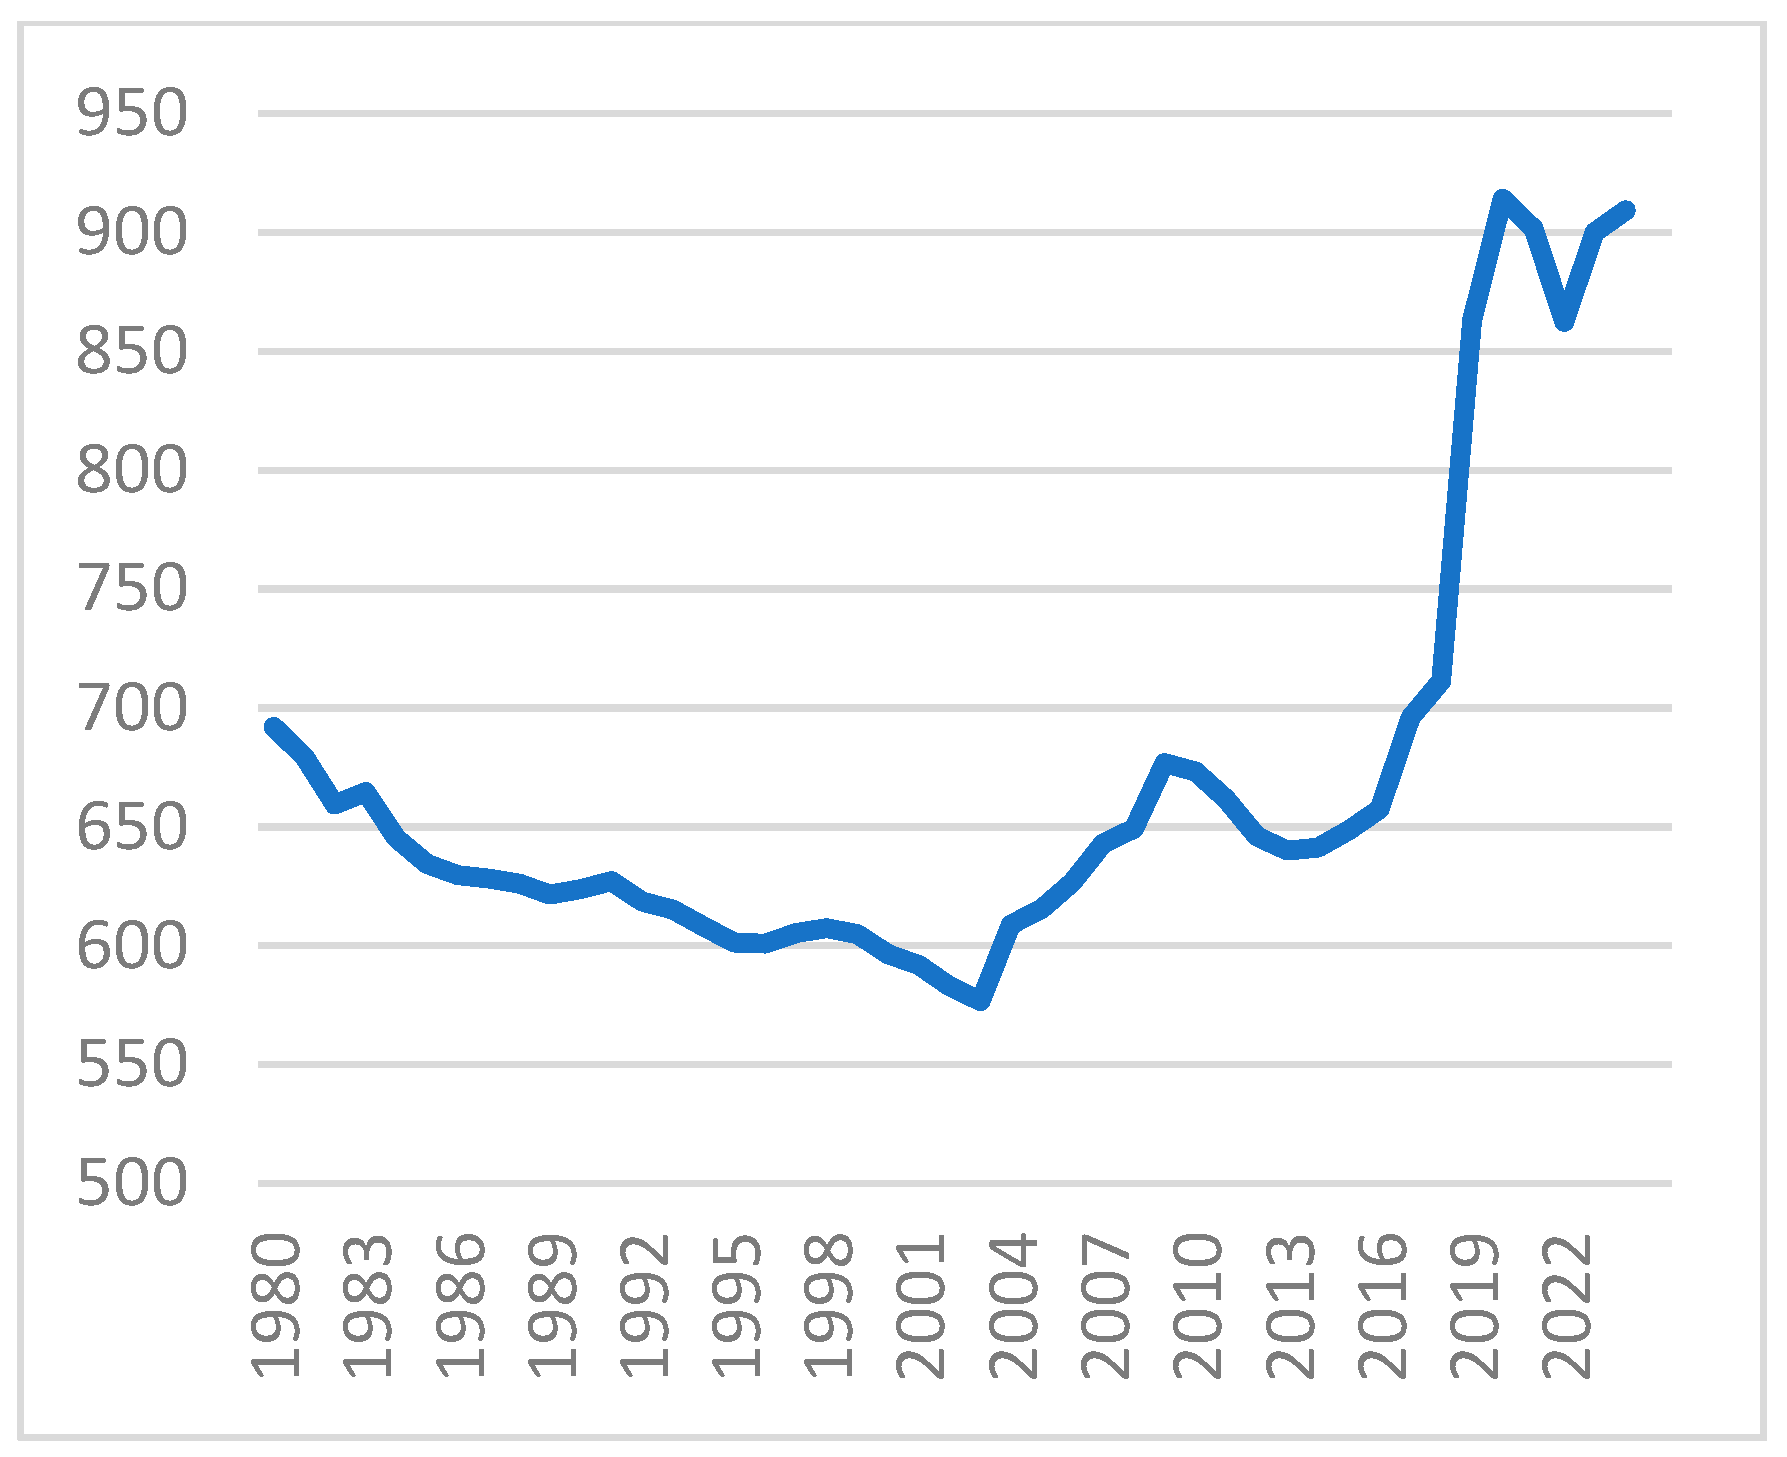
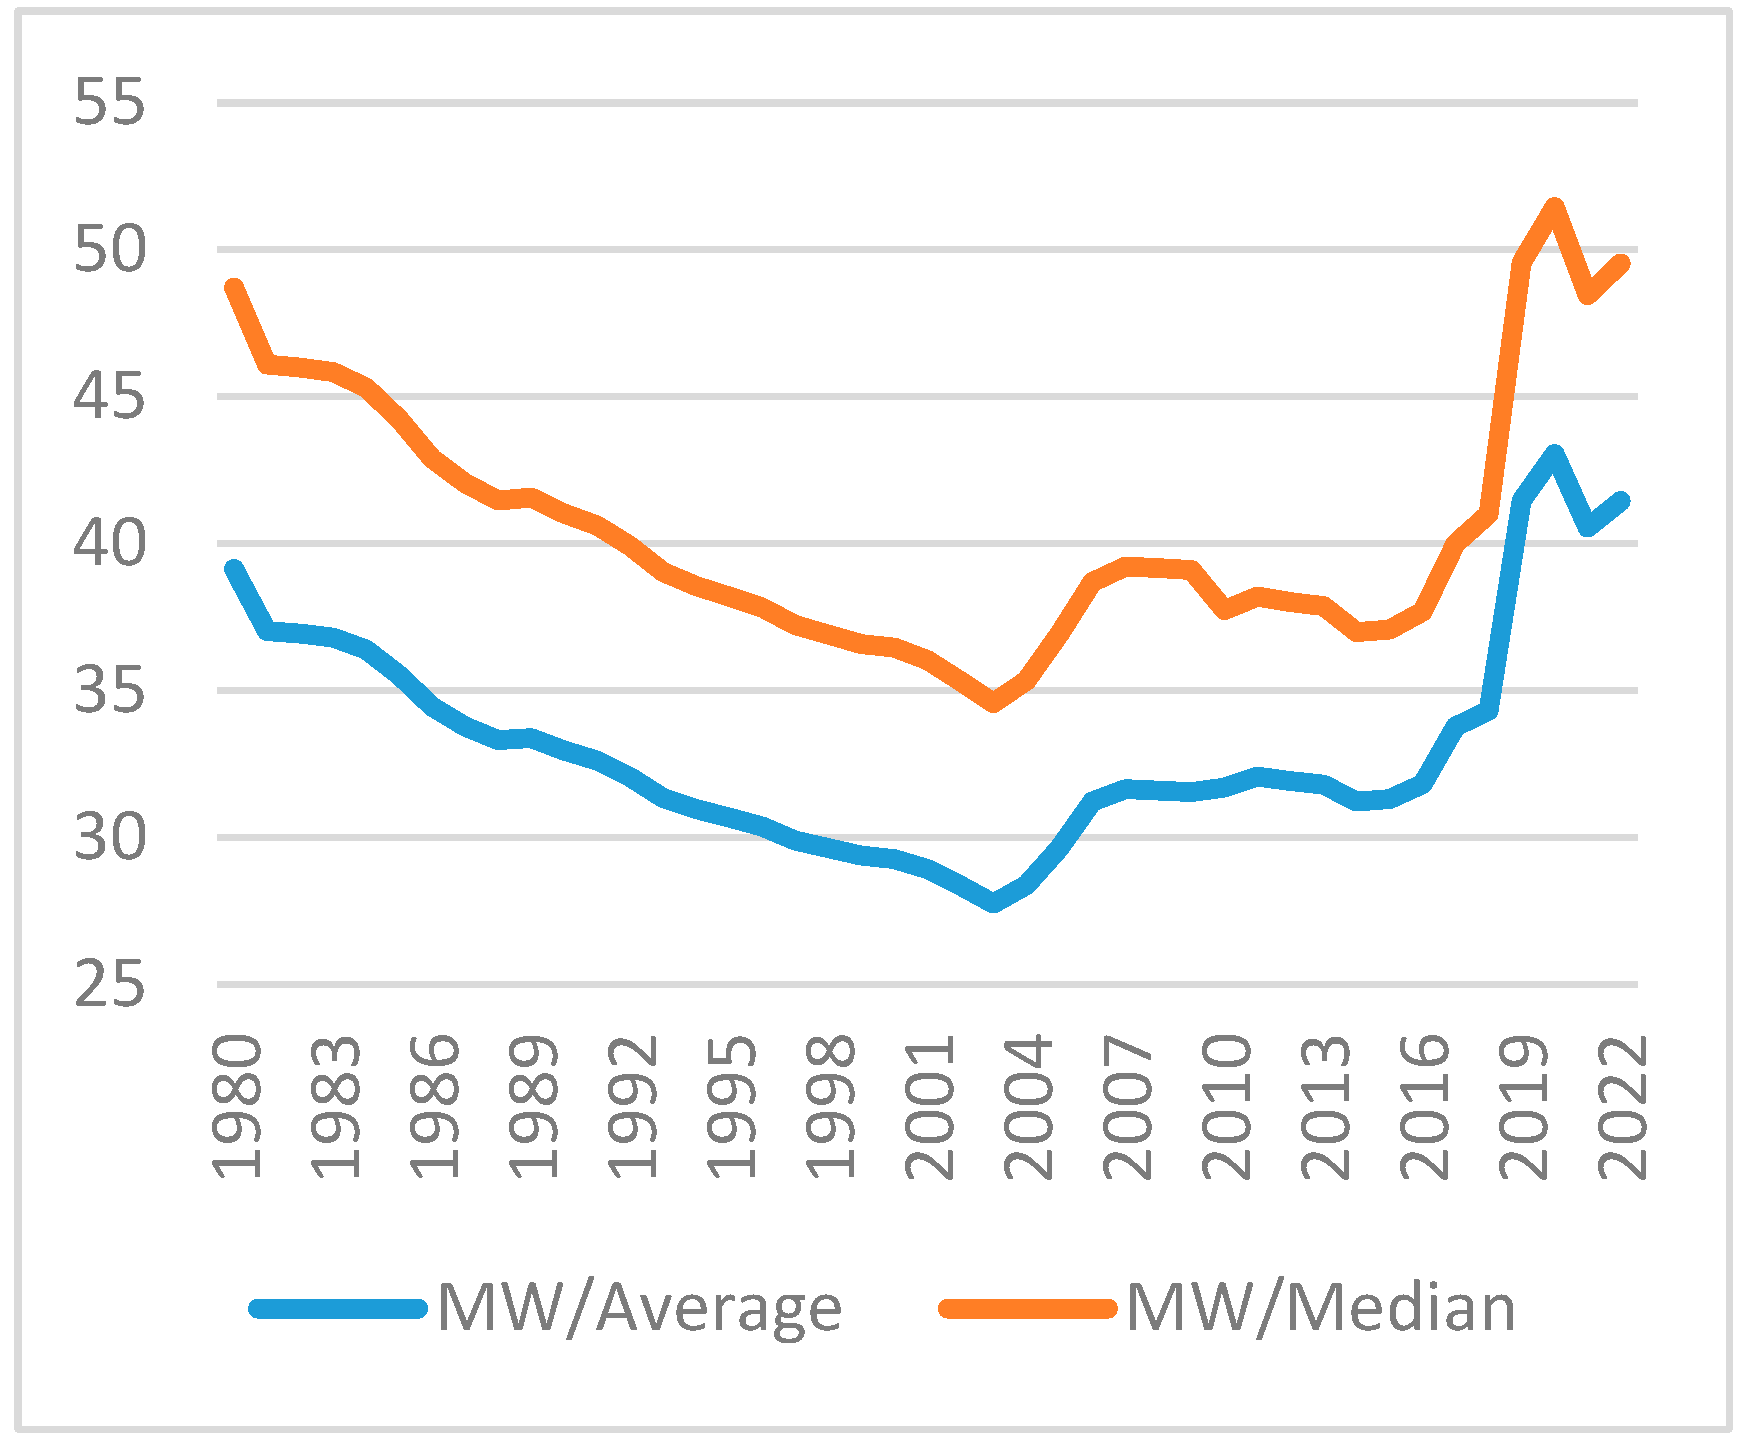
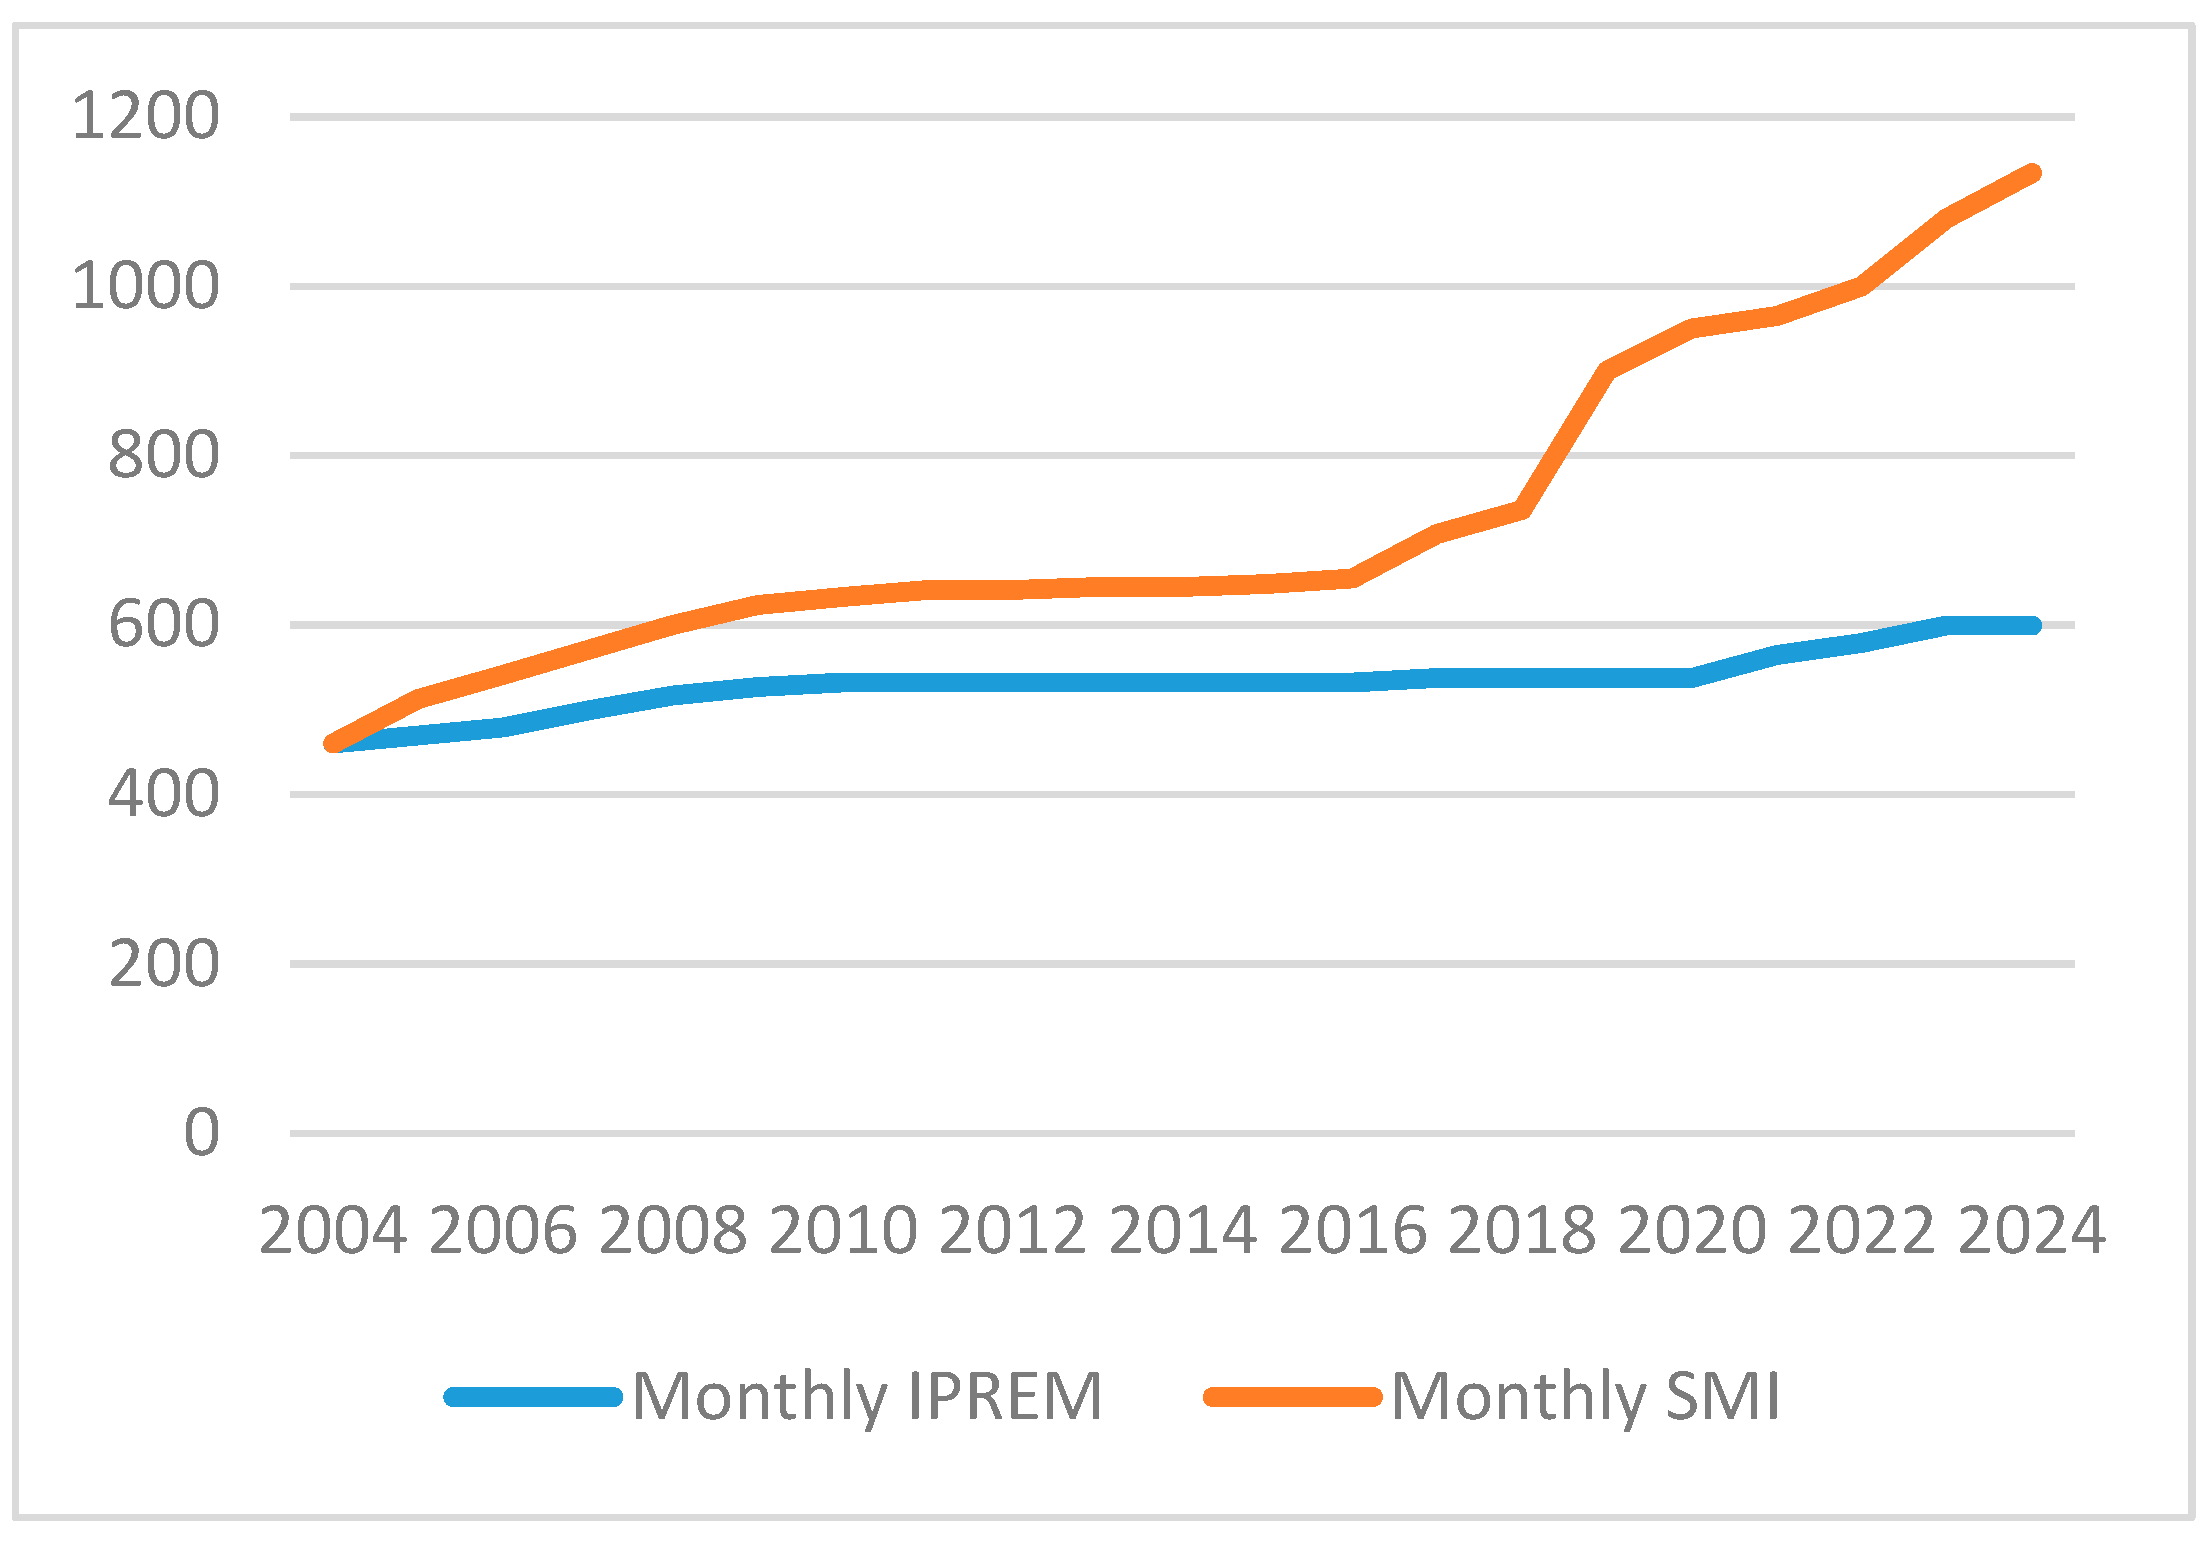
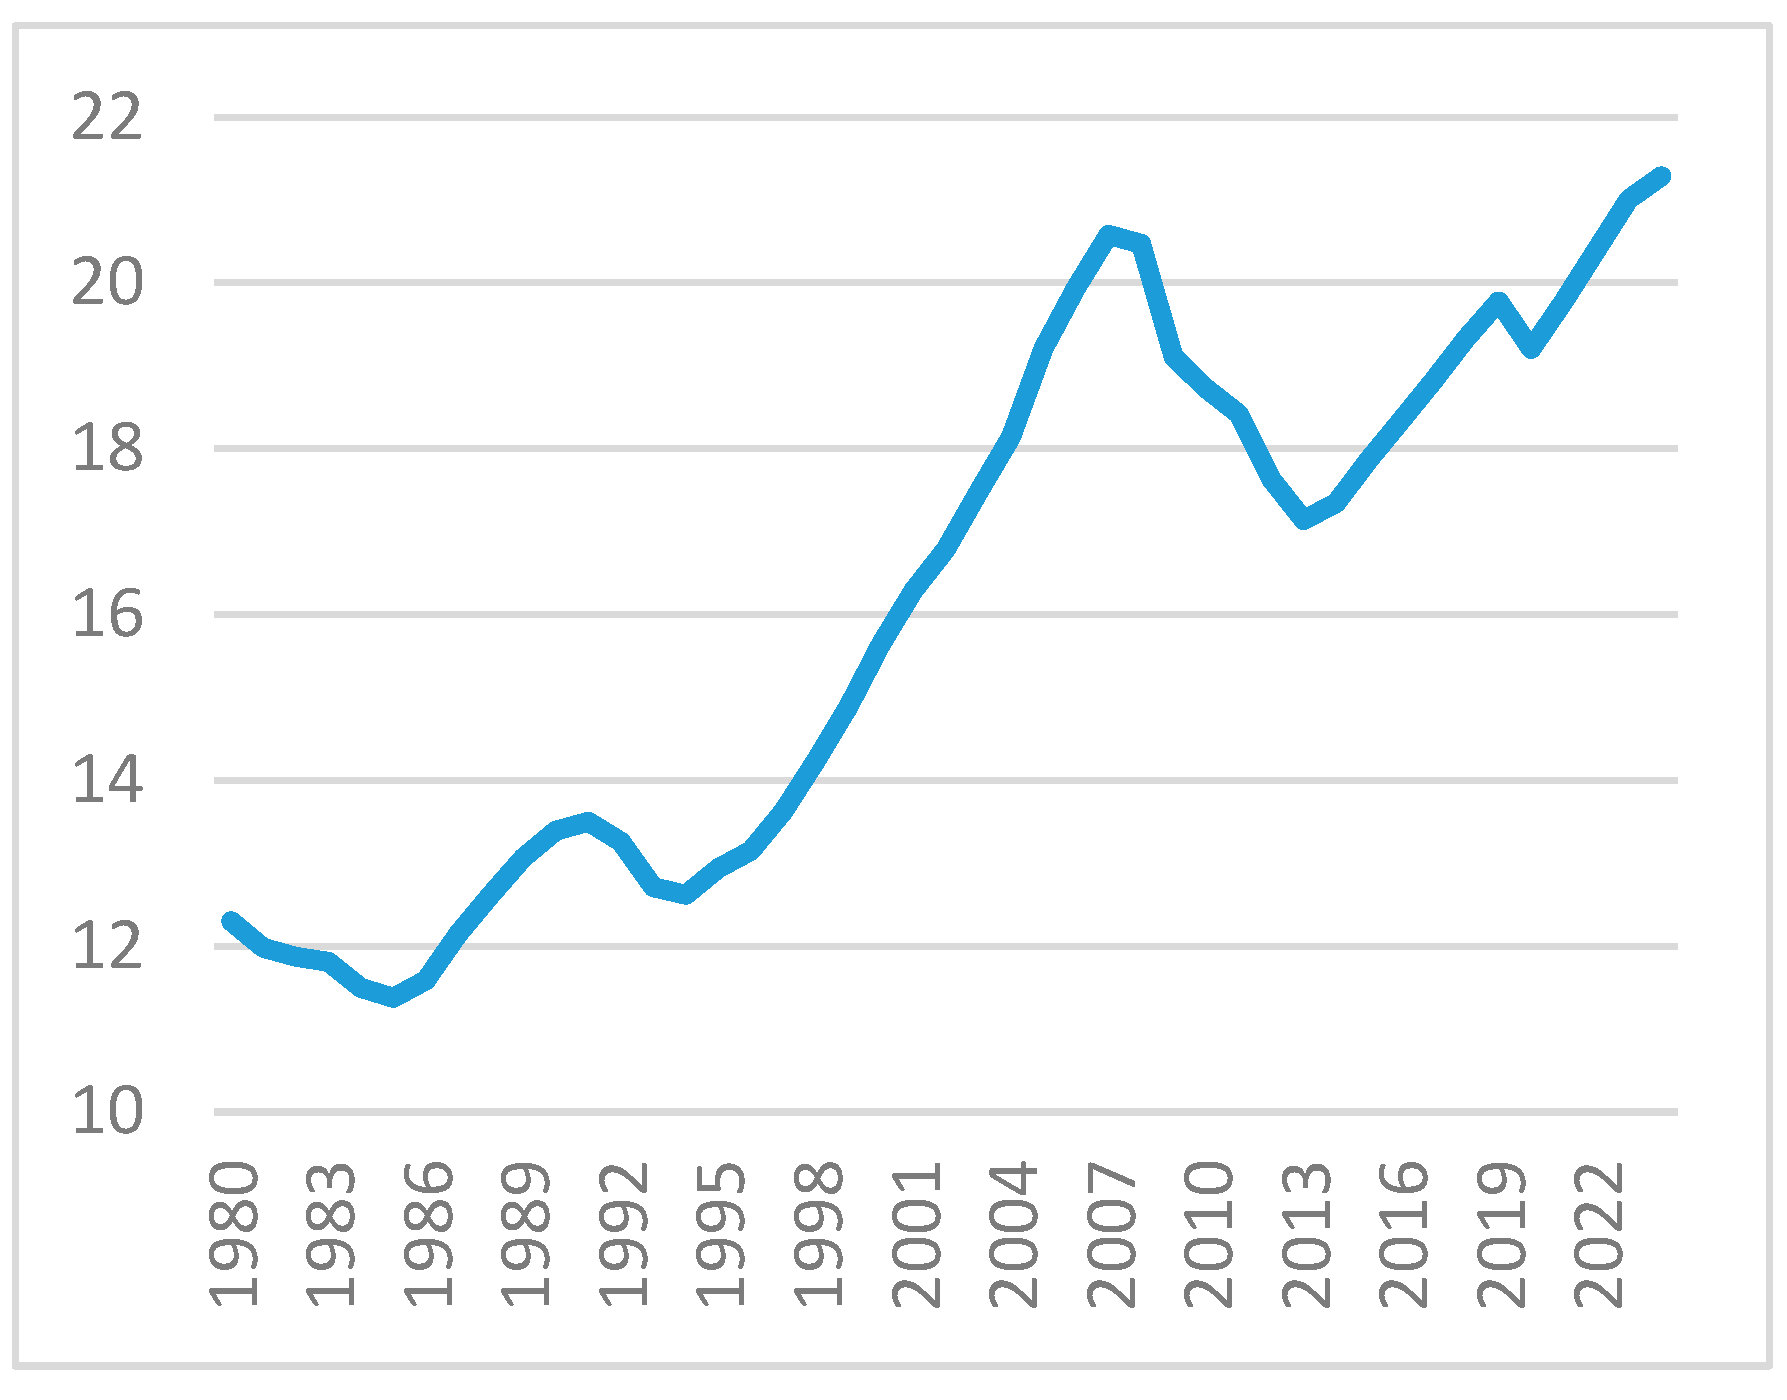

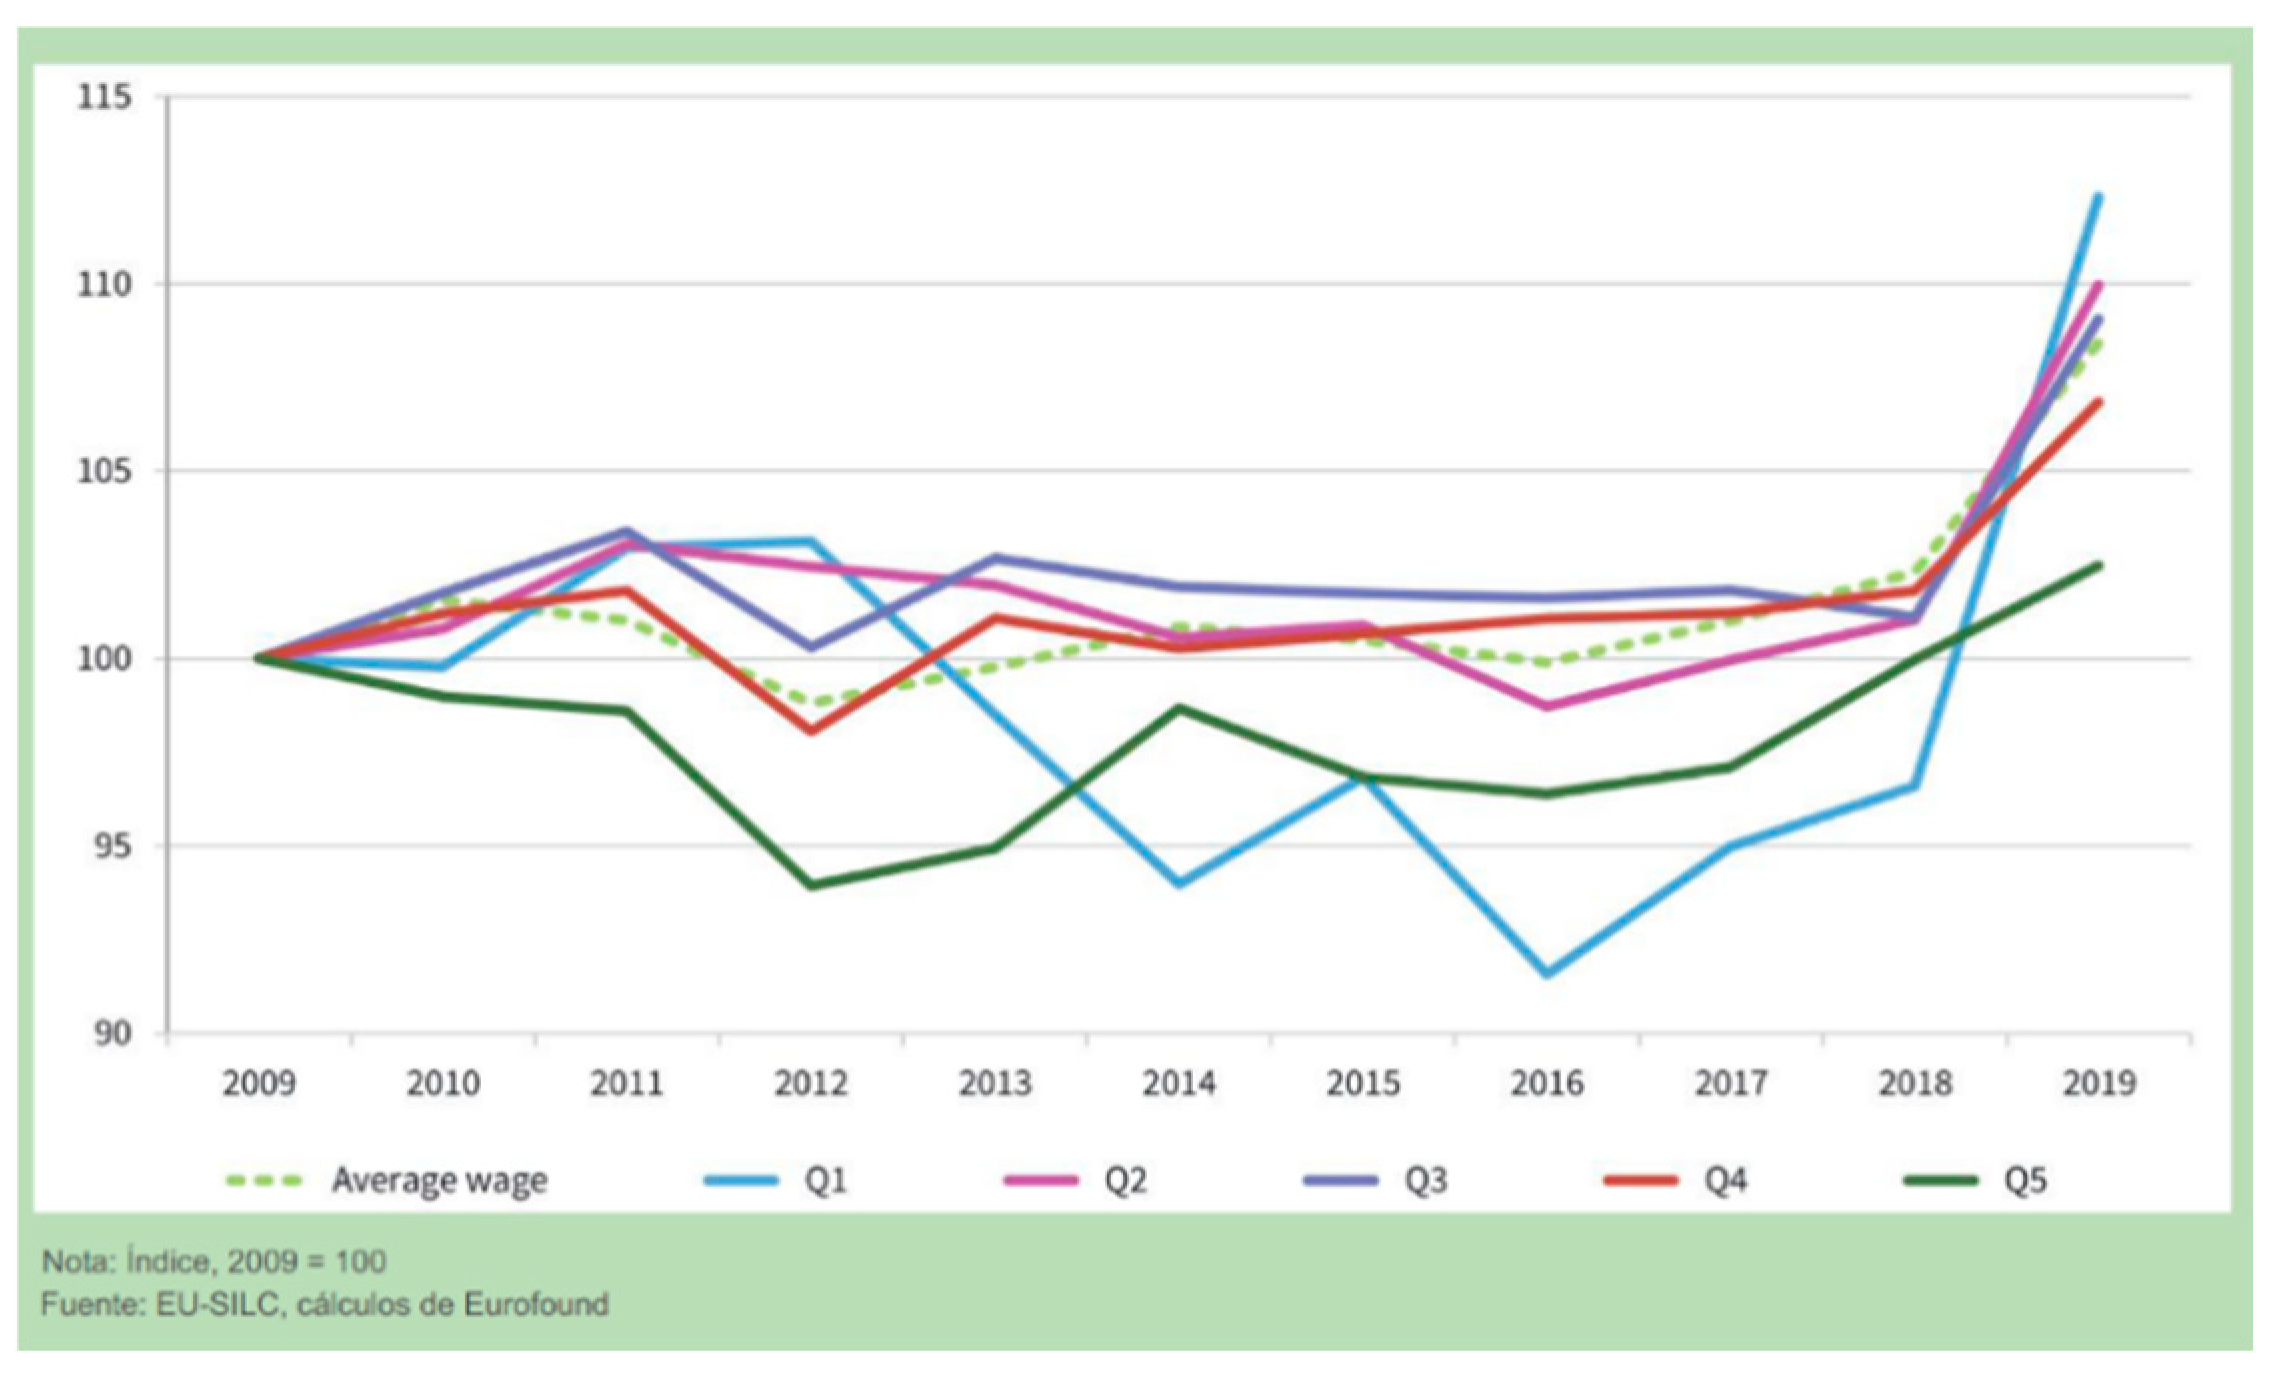
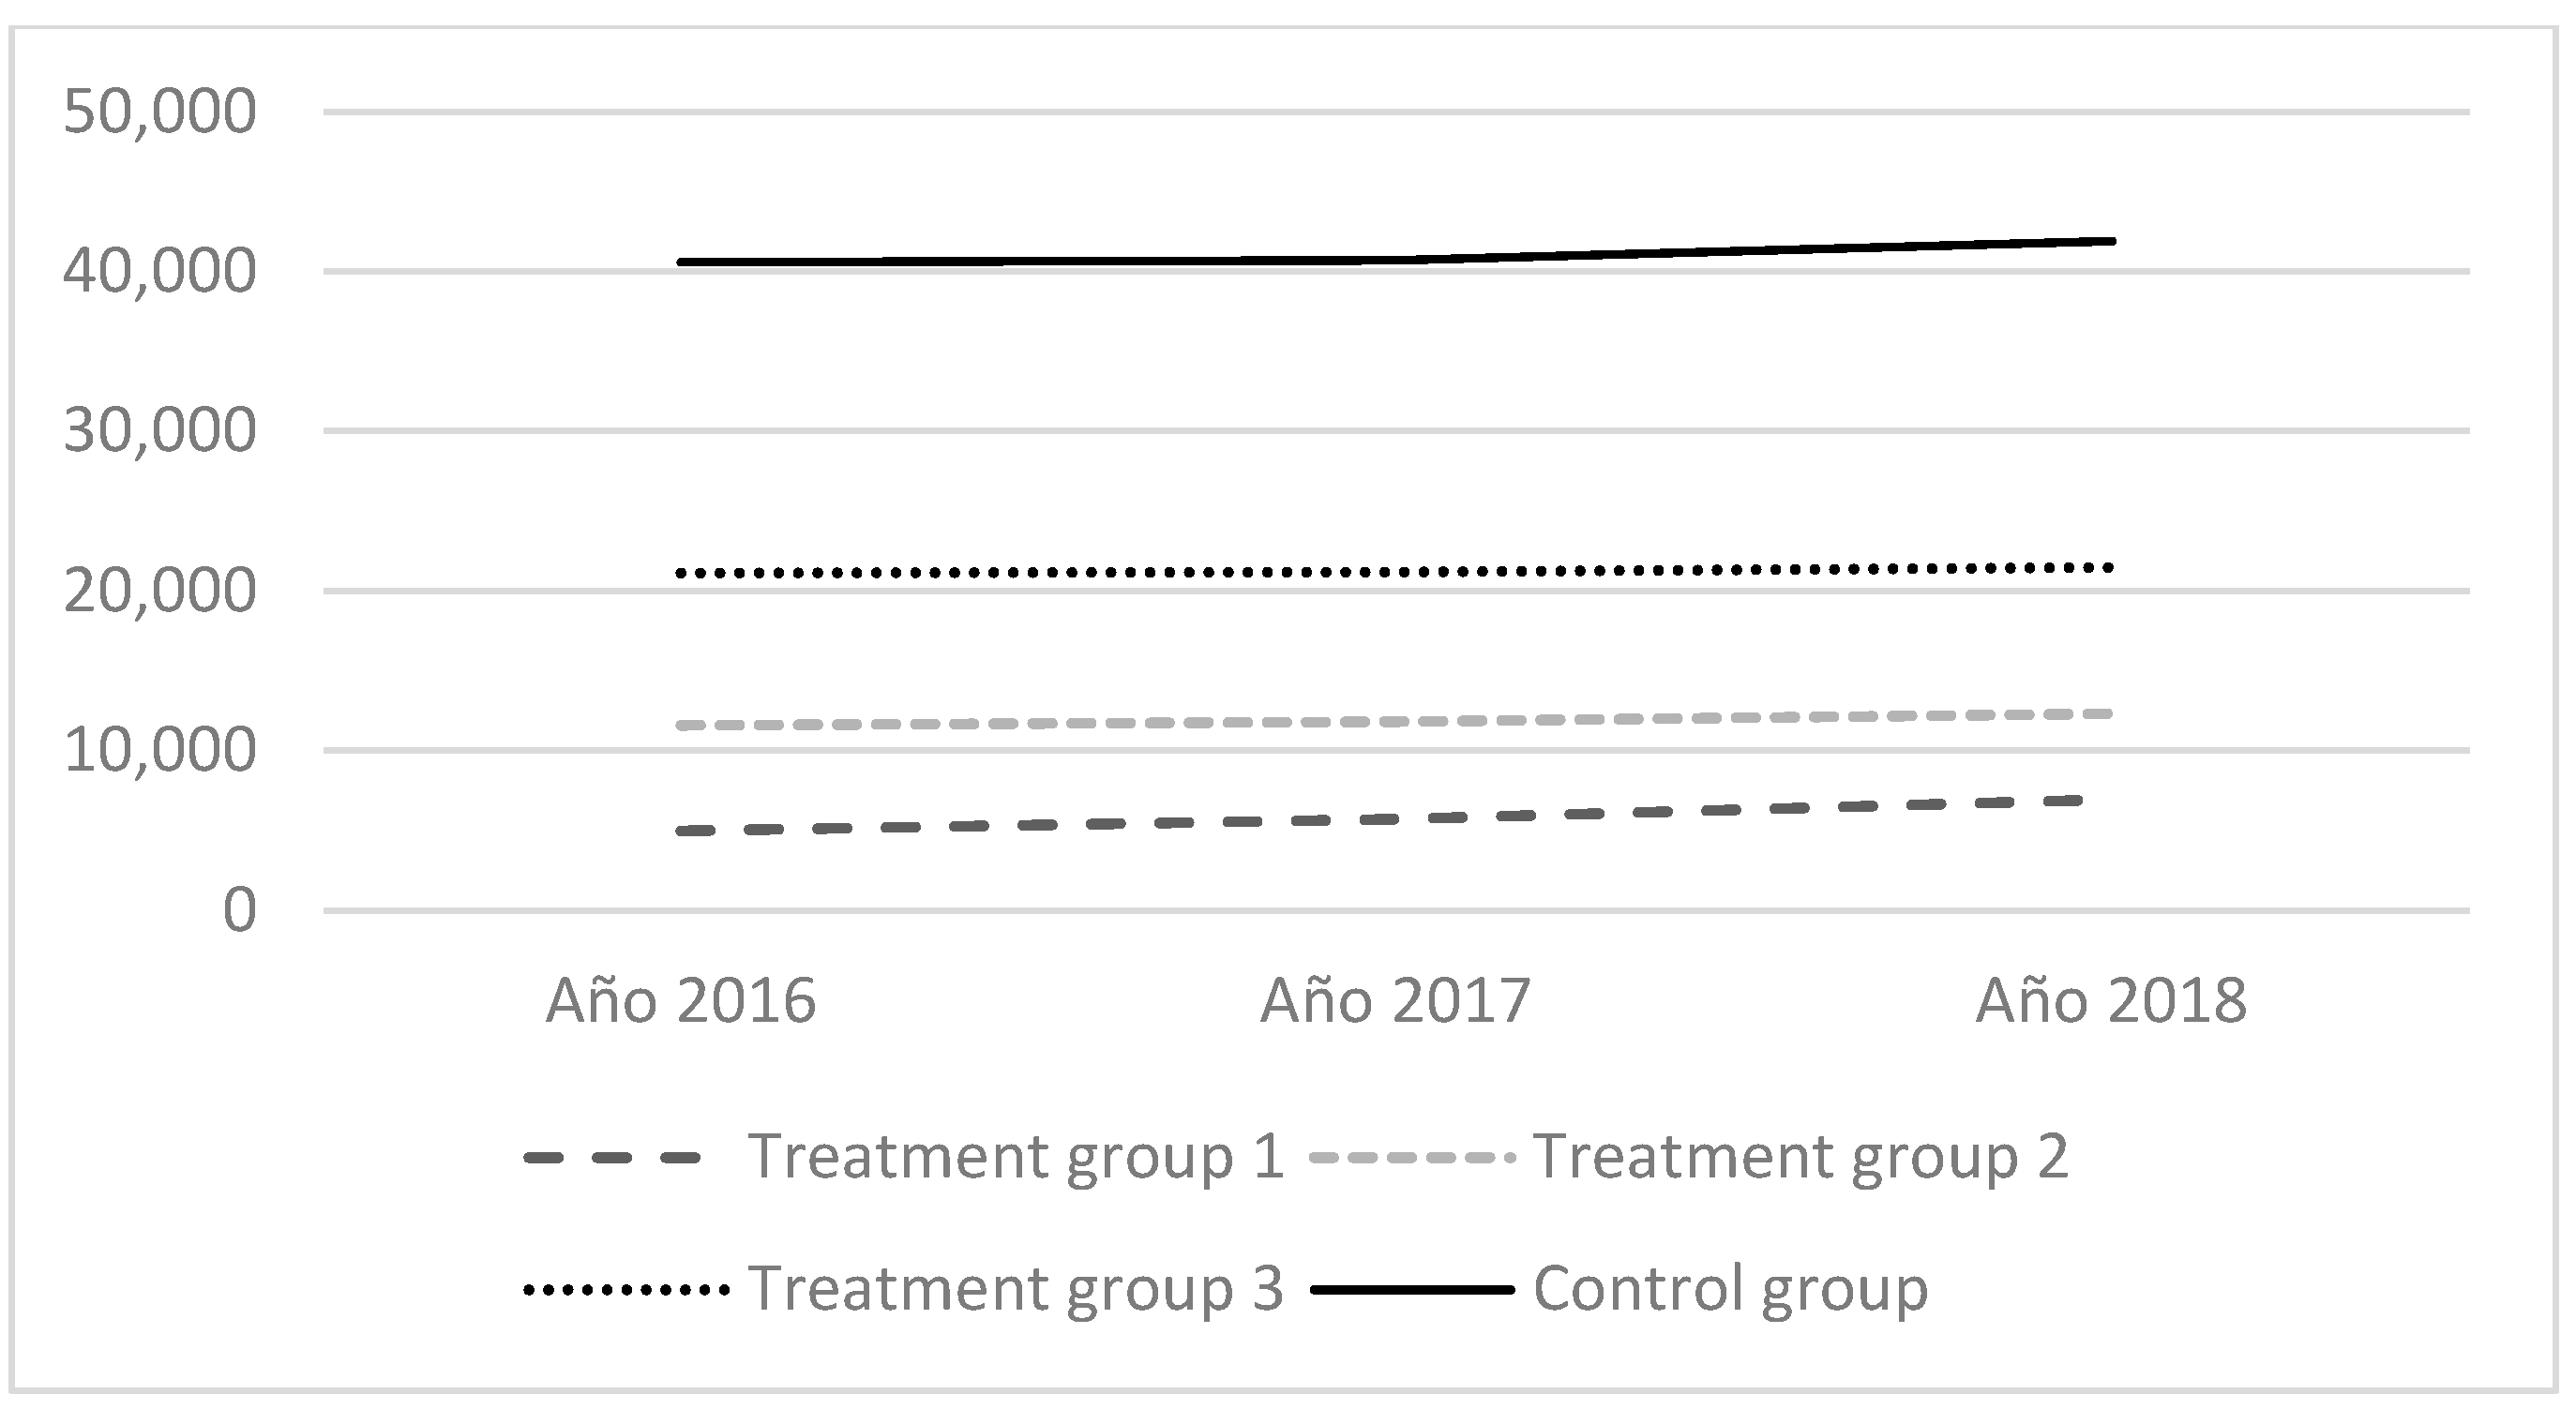
Disclaimer/Publisher’s Note: The statements, opinions and data contained in all publications are solely those of the individual author(s) and contributor(s) and not of MDPI and/or the editor(s). MDPI and/or the editor(s) disclaim responsibility for any injury to people or property resulting from any ideas, methods, instructions or products referred to in the content. |
© 2024 by the authors. Licensee MDPI, Basel, Switzerland. This article is an open access article distributed under the terms and conditions of the Creative Commons Attribution (CC BY) license (https://creativecommons.org/licenses/by/4.0/).