Article

High School Course-Completion Trajectories and College Pathways for All: A Transcript Analysis Study on Elective Computer Science Courses

1
Department of Industrial Education, National Taiwan Normal University, Taipei 106, Taiwan
2
Department of Psychology and Special Education, Texas A&M University-Commerce, Commerce, TX 75428, USA
3
Center of Health Professional Education, School of Medicine, Uniformed Services University of the Health Sciences, Bethesda, MD 20814, USA
4
School of Educational Studies, Claremont Graduate University, Claremont, CA 91711, USA
5
Graduate Institute of Clinical Pharmacy, National Taiwan University, Taipei 100, Taiwan
*
Authors to whom correspondence should be addressed.
Educ. Sci. 2022, 12(11), 808; https://doi.org/10.3390/educsci12110808
Submission received: 17 October 2022 / Revised: 7 November 2022 / Accepted: 10 November 2022 / Published: 13 November 2022

Abstract

:
Whereas researchers regard high school math and science coursework as the best indicator of college readiness for students in the United States, computer science coursework and its relationship to college attendance, particularly for minoritized students, have not received due attention despite its root in the mathematical and scientific reasoning ability. We examined students’ high school course completion patterns across subjects and grade levels with a special focus on elective computer science courses and whether the coursework pattern transitions worked differently for minoritized students in Texas, USA. Latent profile analysis and latent transition analysis revealed multiple patterns of coursework, including Regular, Trailing, and Computer Science-Intensive. However, high school students seemed to attempt computer science courses with an experimental attitude. High school girls, low-income, and Latinx and African American students were less likely to complete computer science courses, despite demonstrating a similar coursework pattern in the previous year. Similarly, students with limited English proficiency, those eligible for free- or reduced-price lunch programs, and Native American students systematically have a lower chance to attend college, despite sufficient academic preparation in high school. Findings highlight the challenges minoritized students face and how students approach elective computer science courses in high school.

1. Introduction

College education has become increasingly important for individuals’ career prospects, health and well-being, and a chance to move up the socioeconomic ladder [1]. In the United States, individuals with postsecondary education experience enjoy more job opportunities and a higher income than those with only a high school diploma [2]. Among all factors predicting college enrollment, high school coursework (i.e., ninth to 12th grade in the United States) in math and science is found to be one of the strongest predictors [3,4]. However, students must also be proficient in other subjects, such as English language arts, in order to avoid developmental courses further delaying their academic pursuit [5].
One notable exclusion that bears substantial contemporary relevance is the computer science (CS) courses. Although unanimously considered part of the science, technology, engineering, and math (STEM) curriculum, CS has received little attention until recently [6,7]. However, the skills learned in CS courses are valuable to students’ future educational pursuit across academic disciplines [8,9]. Systematically treating CS courses as an essential element of students’ high school coursework is much warranted, particularly when we look beyond math and science courses.
Besides personal interest and academic aptitude, students’ STEM coursework is related to their sociodemographic background characteristics, and minoritized students historically lack access to more rigorous courses in high school [10]. Subsequently, these students do not have a compatible college aspiration or opportunity to attend college with their peers [11]. As such, these implicit obstacles should also be systematically addressed when illustrating students’ transitions between yearly coursework patterns and educational pathways from high school to college.
All in all, in this study, we adopted the life course perspective to review the coursework pathways among students attending public high schools in Texas, United States, who complete high school coursework and enter college. We focused on high school students’ coursework across different subjects at each grade level in terms of distinct patterns of course completion (i.e., between-person difference) in major academic subject areas, which were later linked together to form the trajectories of coursework throughout high school. We specifically separated CS courses from other science courses since CS courses were lumped into the elective courses in the graduation requirements for our target cohort (see below). We further explored how students transitioned to different patterns of coursework at each turn of grade level (i.e., within-person difference). Finally, we linked the high school coursework trajectories to college attendance and examined how the grade-level transitions during high school and the college pathways were shaped by students’ sociodemographic backgrounds. In sum, we asked the following questions:
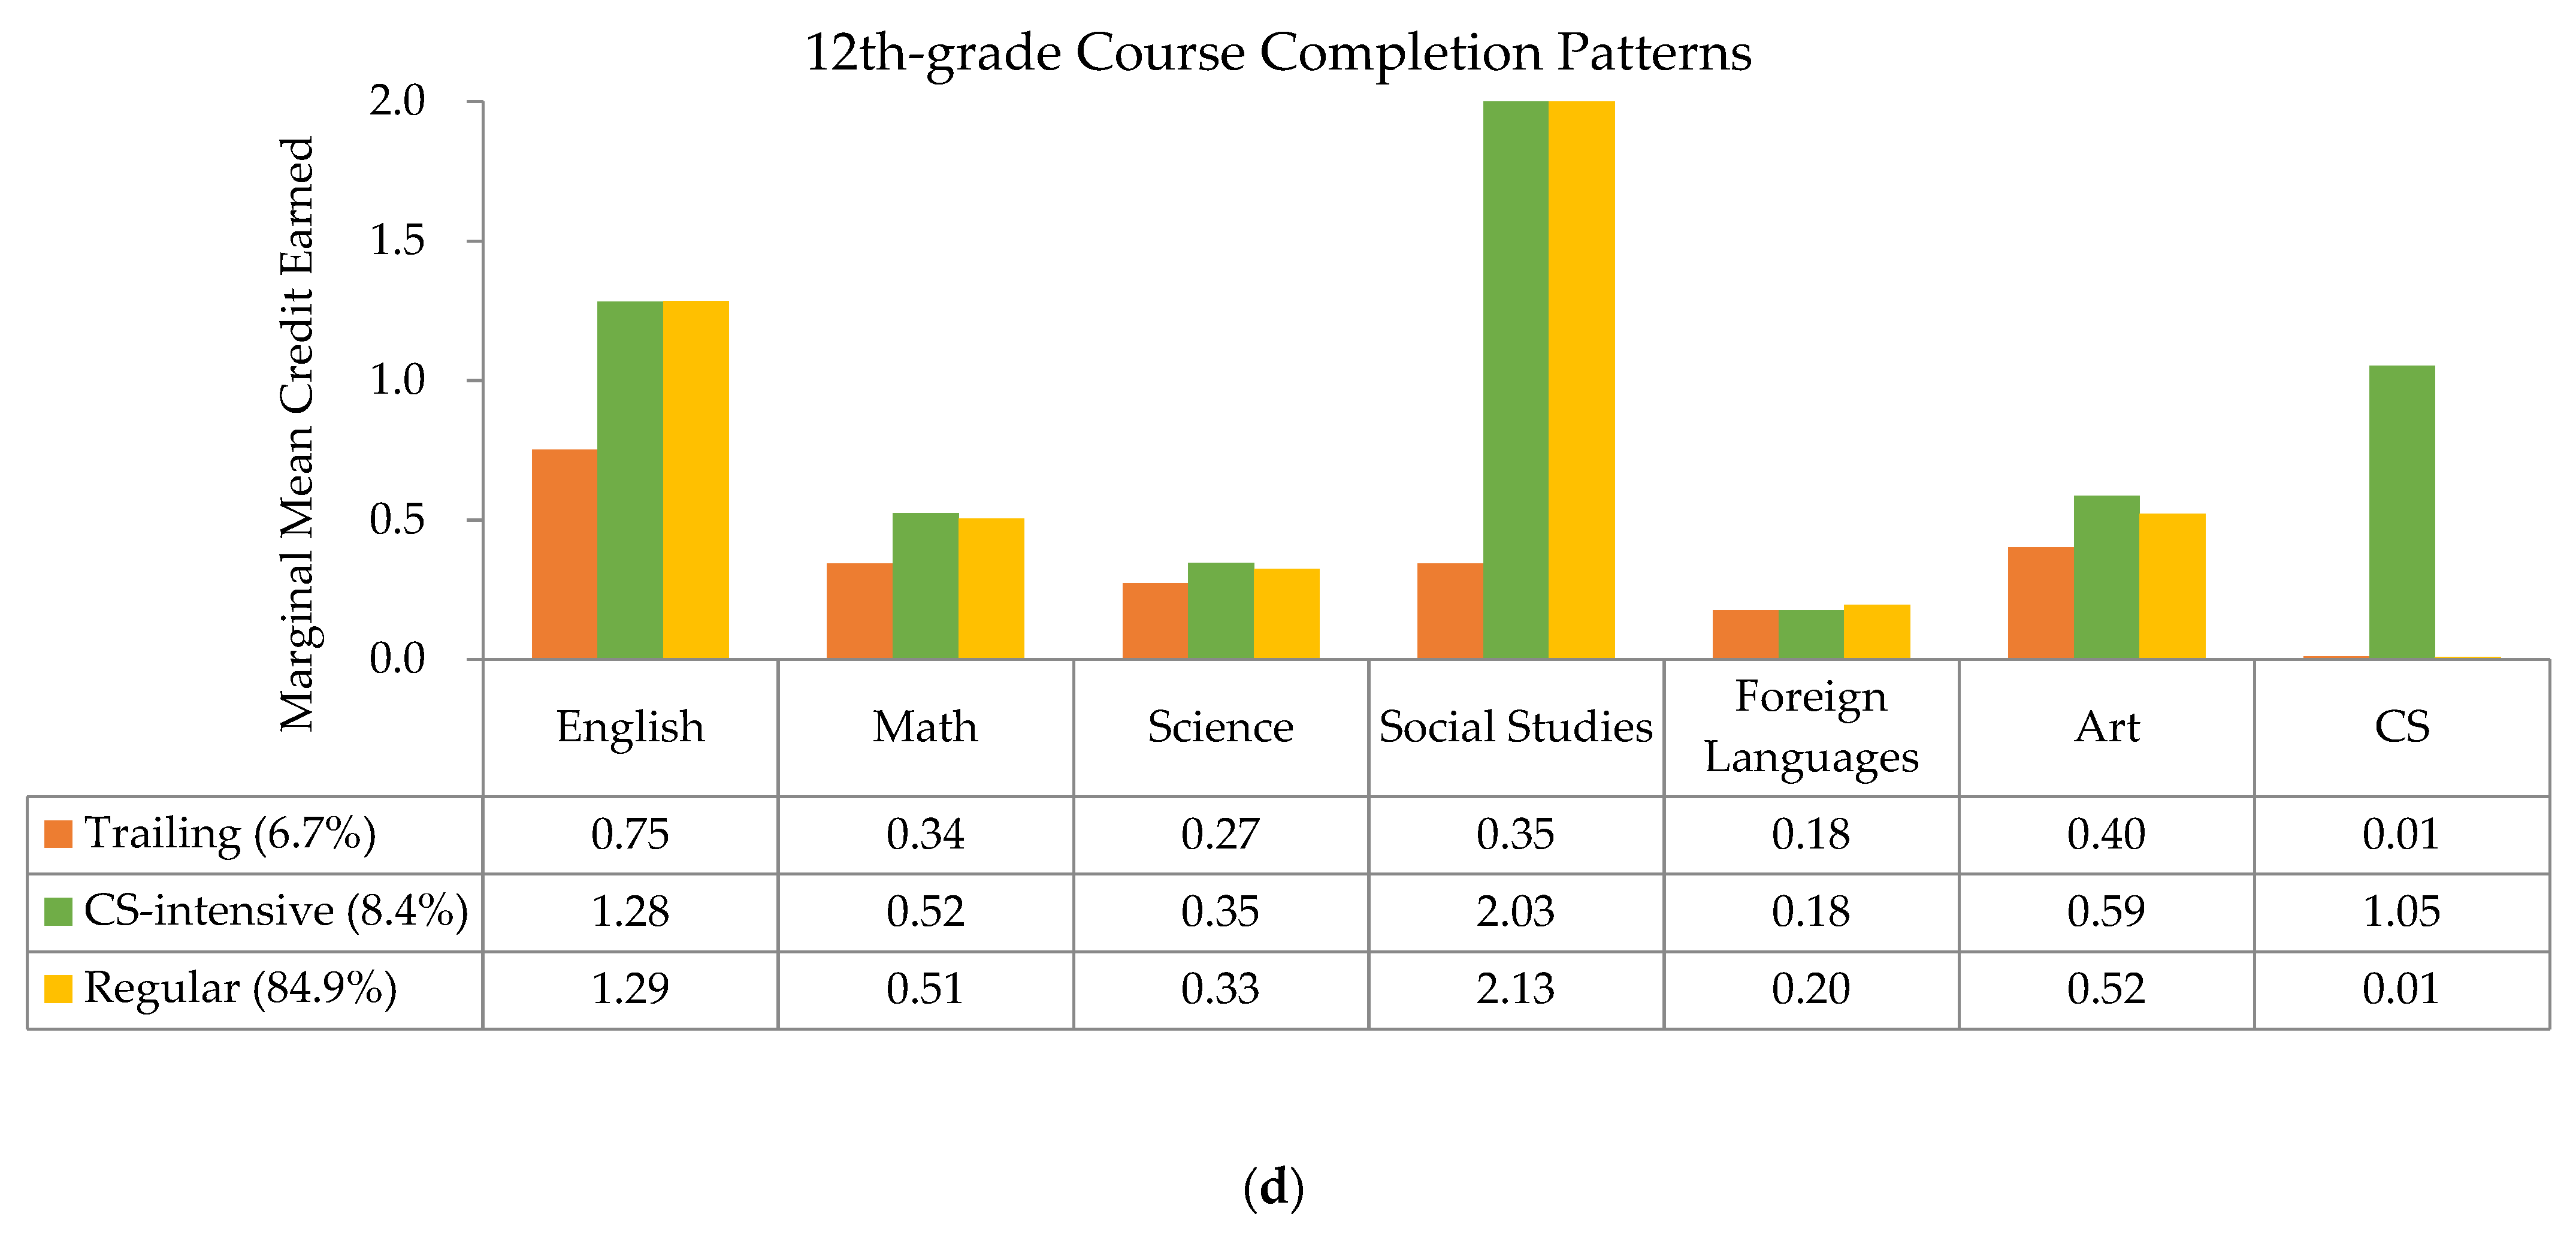
  • What are the distinctive patterns of high school coursework across seven subjects at each grade level?
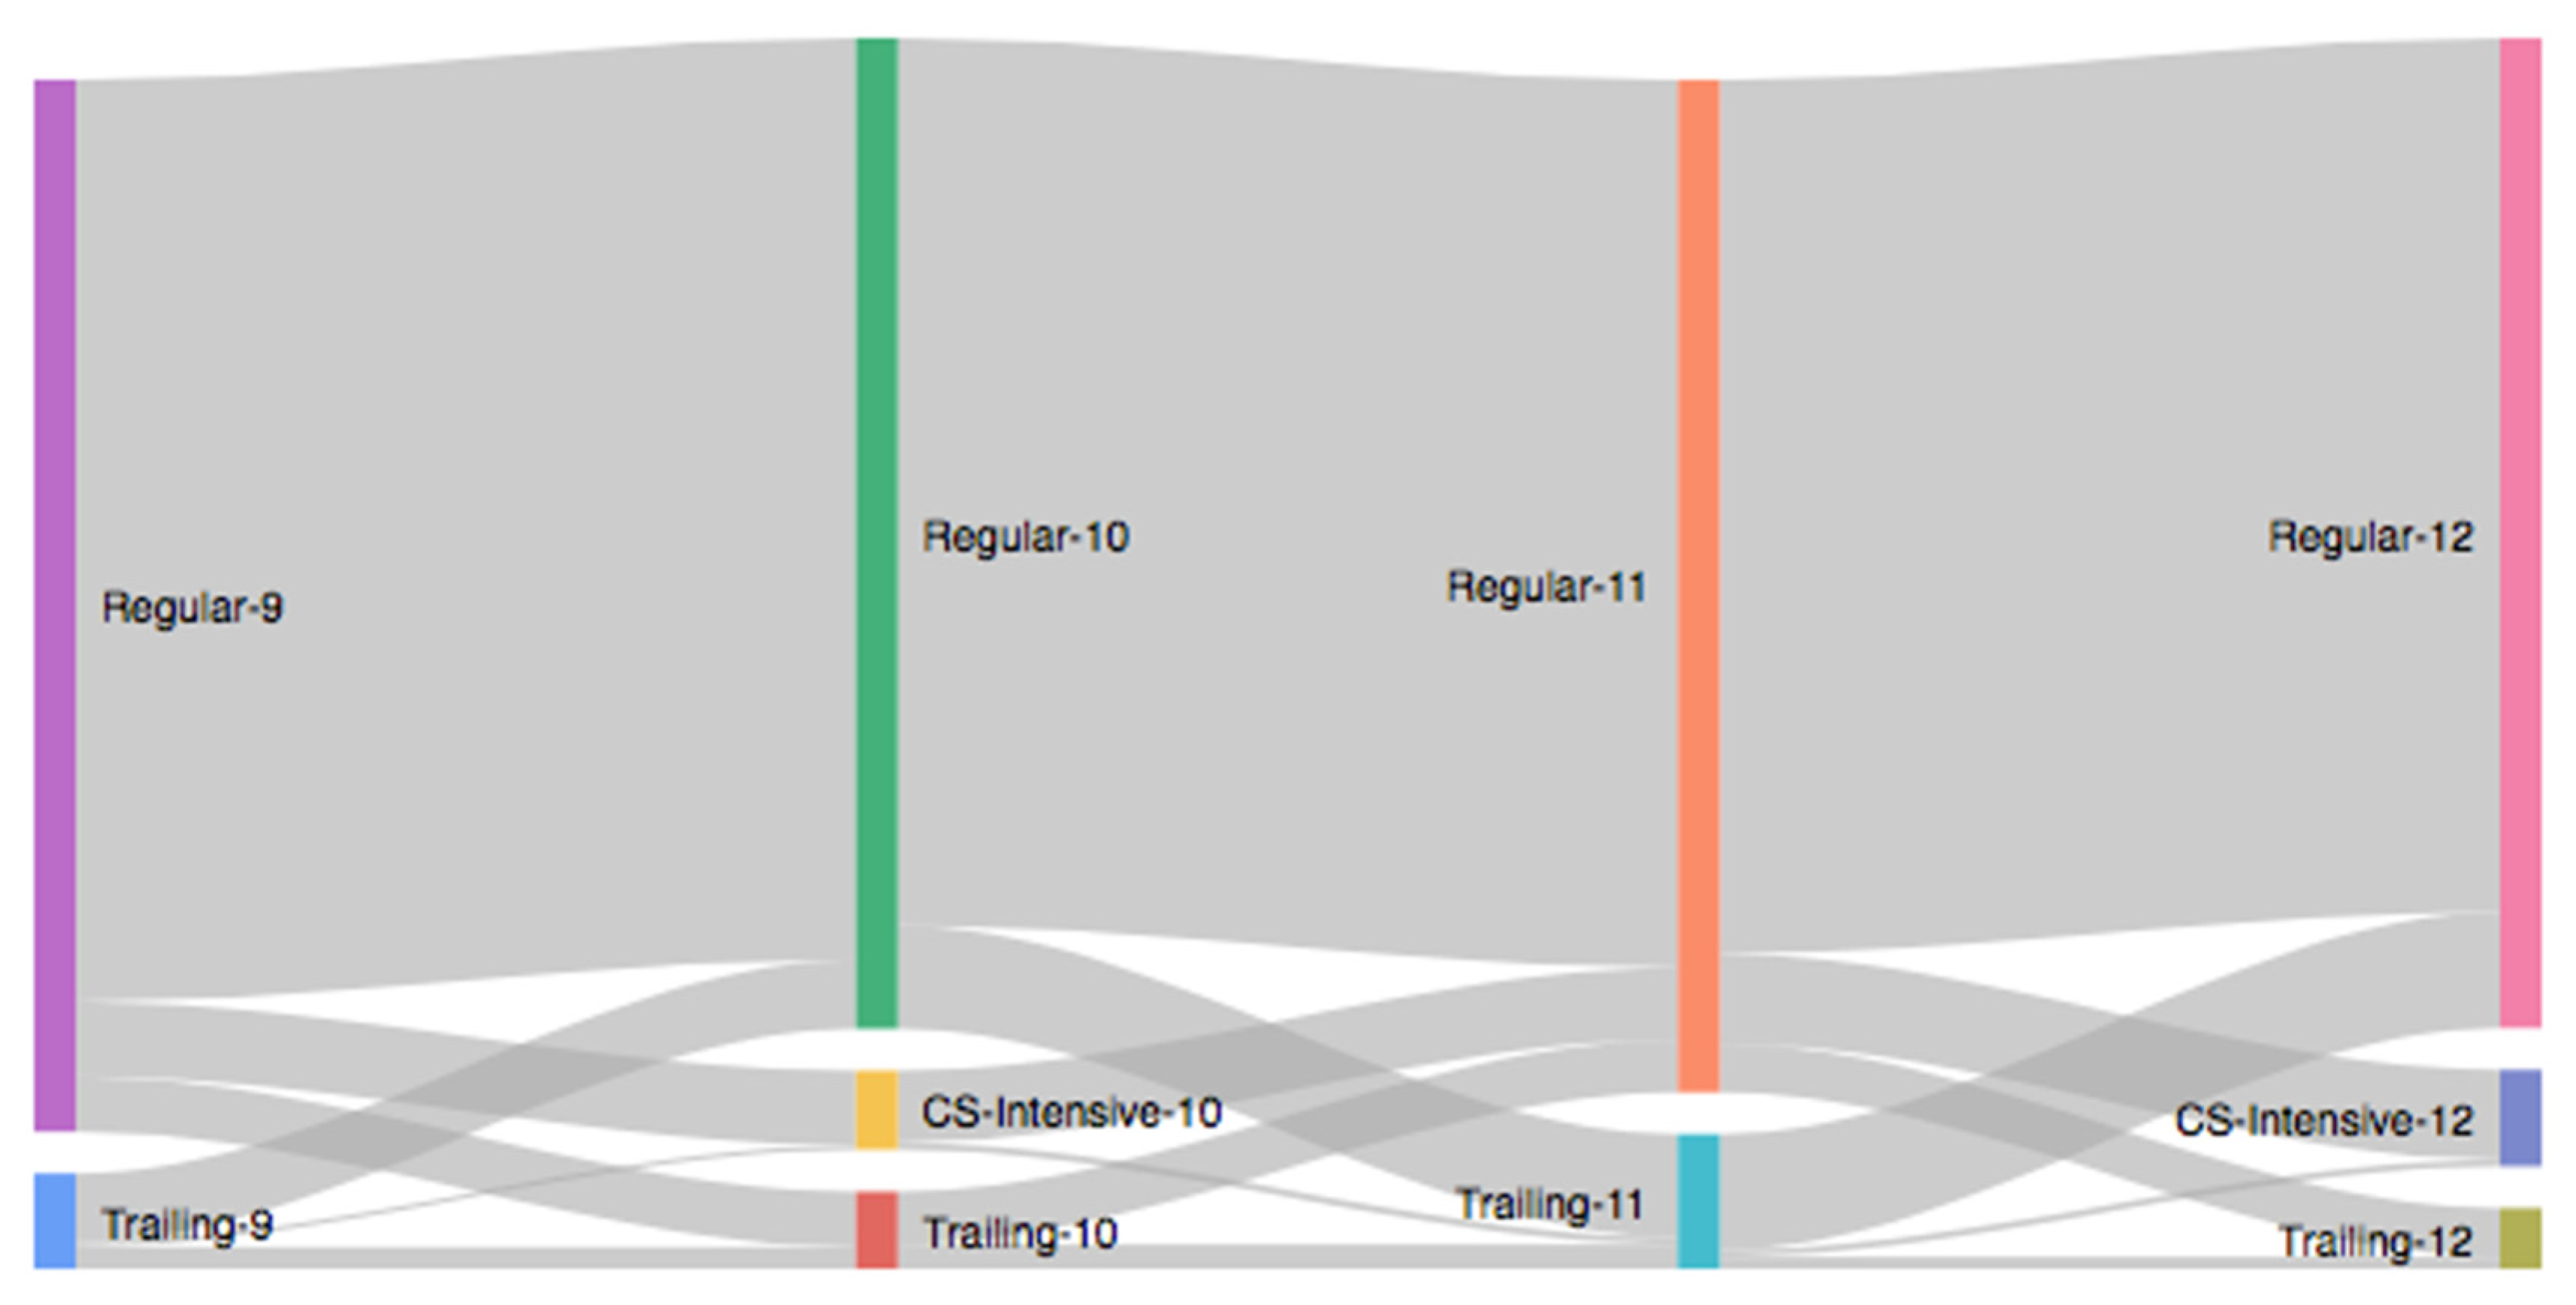
  • Linking the patterns and transitions between patterns across grade levels together, what are the major trajectories of coursework in high school? How are varying trajectories of coursework associated with postsecondary enrollment?
  • How does students’ sociodemographic background shape coursework trajectories over time?

2. Review of Relevant Literature

2.1. Navigating through High School Curriculum: A Life Course Perspective

As the high school curriculum aims to equip students with essential knowledge and skills for future career and postsecondary education [6], how students navigate through the coursework underneath the state-wide graduation requirements and enter college afterward has drawn much theoretical and empirical attention. The dynamic process through which students build their academic trajectory can be described by the life course perspective [12,13]. The life course perspective postulates that individuals’ development across time is embedded in the historical and structural context and consists of a series of events and transitions in between. In such context, individuals build their life course by constantly making choices and leveraging opportunities, particularly at the transitional points in which individuals have a chance to alter their life course.
Since prior events and transitions cast influences of varying magnitudes on later choices of events and transitions, succeeding events and transitions should be understood vis-à-vis earlier ones [14]. Moreover, the series of events and transitions thereof are built when individuals continually interact with the environment through varying social mechanisms, along with critical social and institutional agents encountered during the life course [13]. As a result, empirical research adopting the life course perspective should focus on the incremental steps individuals pave over time, the transitions between events that prompt individuals to continue the pathway or make a shift, and the constraints on life course imposed by the multiple social and contextual structures [15].
More specifically, high school students’ academic trajectory is a good example of how individuals build their academic life course through voluntary and involuntary decisions under environmental constraints [15]. High school curricula in the United States are highly structured and differentiated but allow more flexibility for personal choice than that in earlier educational stages. Being the pivot between the end of public education and the beginning of postsecondary education, students undergo a journey full of transitions [16]. Students’ subsequent coursework is collectively dictated by the academic and career interest, earlier coursework and performance, and teacher recommendation and parental expectations [17,18]. Besides the graduation requirements, students are granted a limited number of electives to choose from (e.g., career and technical education, dual enrollment), especially towards the later part of the high school curriculum. As such, students’ academic life course heads in different directions after each turn of grade level, though these transitional opportunities—and the utilization thereof—are simultaneously limited by the sociodemographic background of the student and school resources [19].
Given all the opportunities and restraints at play, the way students employ these transitions to build their academic pathways toward future education and careers has a direct consequence on how students will fare further down the life course [13,20]. From the life course perspective, existing empirical studies are mostly focused on one facet of students’ coursework, such as the math and science course sequence [6]. Given the clear sequence that students are required to follow [3], the high school math curriculum is arguably the most studied academic trajectory. Analyzing state or national longitudinal transcript data, researchers have tackled the positive role of a specific or the first fundamental math course (e.g., Algebra II) [4,21,22], advanced-level math and science courses [23,24], the highest-level math and science courses [18,25,26], and the ways students follow the course sequence of math and science that later impact their college attendance, college graduation, and economic returns to education [27,28]. Those who start from a more advanced position eventually complete more advanced courses than their counterparts [29,30]. However, students generally do not take more advanced courses until meeting the graduation requirements that typically include a comprehensive set of coursework in multiple subjects [22].

2.2. Computer Science Coursework in High School

Whereas existing studies imply that math and science are the most critical subjects in students’ future success beyond high school in the US, an examination including other subjects, such as CS, is critical for understanding high school pathways to postsecondary academic outcomes [3,22,23,31]. Situated at the intersection of math, science, and engineering [32], computing- or CS-related courses have been perceived as difficult, complex, and ancillary courses reserved for students with high academic disposition until CS courses become mandatory. Conversely, students’ prior programming experience is related to their sense of belonging in computing [33], which may, in turn, motivate students to eventually major in CS in college because students are able to see the relevance of CS to their future careers [34]. A comprehensive review of students’ high school academic experience that also addresses CS is necessary to complement our knowledge of students’ postsecondary education attendance and choice of major.

2.3. Sociodemographic Disparities in High School Coursework and Postsecondary Enrollment

Minoritized students do not always have equitable access to, or the ability to employ, the same opportunities to construct a life course that prepares them for a desirable academic or career outcome [35]. Despite demonstrating a similar academic performance to their European American peers, decades of research have shown that racial/ethnic minority students, non-native speakers of English, and students from low socioeconomic status (SES) are often placed at a less rigorous track [36,37]. In turn, these students tend to have poorer college readiness and lower college attendance rate than their more privileged counterparts. That is, the effect of high school academic achievement on students’ college attendance varies between gender, race/ethnicity, and SES [6,25].
This gloomy outlook of the academic life courses among minoritized students calls for a better understanding of students’ coursework, including electives such as CS. Researchers and practitioners have documented a sizable racial/ethnic disparity in the participation and outcome of high-school elective CS courses [7]. For example, high school girls, as well as African American and Latinx students, are consistently underrepresented in elective CS classrooms [34], even with a similar prior academic performance to their European American peers [8,9]. Therefore, researchers should examine whether separate trajectories to college attendance for students of different socioeconomic backgrounds better describe students’ educational pathways than assuming a monotonous trajectory for all students.

2.4. Current Study

Guided by the life course perspective, we placed a particular interest in students’ CS coursework along with other subjects and sociodemographic backgrounds at each grade level. Methodologically, we argue that a person-centered approach fits the life course perspective well [38]. This approach enables researchers to examine the waxes and wanes of the number of credits earned in each subject over time by connecting patterns together. Between time points, the person-centered approach further depicts the transitions of the coursework patterns when accounting for students’ prior coursework patterns. Meanwhile, researchers can empirically examine whether students of different sociodemographic backgrounds experience the transition equally in terms of the probability of transitioning from one pattern to the other at each transition point (e.g., from freshman to sophomore year, from senior year to college). Afterward, we linked students’ high school coursework trajectory to their college attendance record, forming the college pathways when accounting for students’ sociodemographic background during the high school-to-college transition. We summarized the analytical framework in Figure 1.

3. Materials and Methods

3.1. Sample and Data

We analyzed data from the Texas Statewide Longitudinal Data System, which includes the administrative and transcript data on student sociodemographic information and course completion in high school. Due to data access limitations and to allow a reasonable time to evaluate students’ postsecondary success, the target population consists of students enrolled in public high schools as first-time ninth graders in Fall 2004 (N = 383, 450; all headcounts are masked per the regulation of Texas Education Research Center) [39]. For this particular cohort, the Texas Education Agency charted three tiers of graduation requirements that varied in the number of required credit units: minimum, recommended, and advanced. However, none of the tiers required any CS credits. Instead, all CS courses were elective and would be counted under the elective courses requirement (7.5, 4.5, and 4.5 credits minimum for the minimum, recommended, and advanced tiers, respectively). To our knowledge, few school districts charted a clear course sequence for CS or implemented grade-level requirements or prerequisites for taking certain CS courses.
To increase the efficiency of computing in statistical analyses, a random sample of students who moved up by one grade level every academic year (i.e., no record of retention) and whose ninth-grade administrative and transcript data were located were selected for analyses (n = 19,000, or 5.0% of the target population from 852 public high schools). Among them, about half of the students in the analytical sample were female (51.8%). Fewer than half of the students self-identified as European American (46.7%), followed by Latinx (36.2%), African American (13.0%), Asian American (3.8%), and Native American (0.3%). In ninth grade, more than one-third of the students (37.7%) were eligible for free- or reduced-price lunch programs, 3.8% of the students were denoted as having limited English proficiency, and 4.1% of the students were placed in the individualized educational program. This analytical sample did not differ from the target population in the distribution of gender, race/ethnicity, and eligibility for free- or reduced-price lunch programs (χ2 = [0.001, 1.66], df = 1, p = [0.09, 0.99]) [39]. However, there were significantly fewer students receiving individualized education programs and with limited English proficiency in the analytical sample than the target population (χ2 = 3.97 and 7.85, df = 1, p = 0.05 and 0.01, respectively).
In addition, we matched the Texas Statewide Longitudinal Data System data to the National Student Clearinghouse data, which tracks students’ enrollment in educational institutions in the US. After matching, about 43.2% of the students included in the analytical sample eventually attended a four-year college, 28.1% attended a two-year college, and 28.7% did not attend college (see Table 1 for a summary of the descriptive statistics).

3.2. Measures

3.2.1. Course-Completion Patterns in High School

The key independent variables were students’ course-completion patterns for each grade level in high school. These patterns were based on seven subject areas (English, math, science, social studies, foreign language, art, and CS) and were identified by the latent profile analysis (see below). A course was considered completed when students received a Complete status, and the corresponding credits of each completed course within the same subject area in the same academic year were summed up. Only regular academic courses were considered in the present study, excluding courses designated as dual credit, advanced placement, and international baccalaureate, given the varying availabilities of these courses in different school districts. All transcript data were extracted from Texas Statewide Longitudinal Data System.

3.2.2. College Attendance

The outcome variable was a three-level categorical variable of college attendance (1 = four-year college, 2 = two-year college, 3 = no attendance [reference group]), denoting students’ enrollment in the highest level of the postsecondary institution within nine years after high school graduation (i.e., from May 2008 to May 2017), based on the National Student Clearinghouse data.

3.2.3. Standardized Test Scores

Students’ tenth-grade standardized test scores (i.e., the Texas Assessment of Knowledge and Skills) in reading and math were included as auxiliary variables to explain the transition of course-completion patterns between sophomore and junior years. The raw test scores were transformed to scale scores by the Texas Education Agency, and the scale scores of the analytical sample were further transformed into z-scores in statistical analyses.

3.2.4. Sociodemographic Backgrounds

Students’ biological sex (boy or girl), race/ethnicity (Native American, Asian American, African American, Latinx, and European American), eligibility for free- or reduced-price lunch, with limited English proficiency, and whether students were placed in an individualized education program were entered as auxiliary variables in latent transition analysis (see below). These data were derived from students’ ninth-grade enrollment records in the Texas Statewide Longitudinal Data System based on parents’ or guardians’ reports to the school districts, and we adopted the same categorization of the record in the current study.

3.3. Analysis

Latent profile analysis and latent transition analysis were used to answer the research questions. As a person-centered technique, latent profile analysis groups students into distinctive patterns based on the observed characteristics (i.e., credits earned in every academic year) [40]. When students’ pattern membership at each grade level were linked together in latent transition analysis, we estimated whether and to what extent students transition from one pattern to the other over time, formulating the trajectories [41] to represent the life course of each student. We further addressed the predictors of transition probability between patterns to explain the sociodemographic differences in the transition probability [42]. Such flexibility allowed us to empirically identify how students’ sociodemographic backgrounds calibrate their chance to change the pattern of coursework (i.e., mobility) or stay in a similar pattern (i.e., inertia) in the next year.
Consequently, we conducted a manual three-step latent transition analysis following the procedures recommended by Asparouhov and Muthén (2014) and Nyland-Gibson et al. (2014). In the first step, unconditional latent profile analysis was conducted separately for each grade level to understand the optimal number and characteristics of each course-completion pattern. Model comparison was conducted, in which the best solution would have the lowest Akaike Information Criterion, Bayesian Information Criterion, and adjusted Bayesian Information Criterion. In addition, the p-values of the Voung–Lo–Mendell–Rubin test and the Lo–Mendell–Rubin adjusted likelihood ratio test would become statistically non-significant (ps > 0.05 in the current study) when adding one more profile to the best solution. For example, if the p-values of the Voung–Lo–Mendell–Rubin test and Lo–Mendell–Rubin adjusted likelihood ratio test is greater than 0.05 when a three-profile solution is estimated, the two-profile solution is favored. To retain acceptable interpretability of the results, in the best-fitting solution, each profile should also account for 5% or more of the analytical sample. Second, after choosing the best-fitting latent profile model, the posterior probability of being assigned to a specific profile as opposed to others was calculated and specified. Within each grade level, the most populous profile was treated as the reference group. Finally, latent transition analysis was conducted by linking the latent profile membership of each grade level together. Note that students’ sociodemographic variables and the tenth-grade Texas Assessment of Knowledge and Skills scale scores of reading and math were treated as auxiliary variables.
In addition, students’ highest level of postsecondary enrollment was regressed on the latent profile indicator of the senior year. To account for the differences in course offerings between schools, the fixed effect of high school affiliation was specified. All analyses were conducted in SPSS 22.0 and Mplus 7.4 with robust maximum likelihood estimation.

3.4. Missing Data

There were several sources of missing data in the present study. First of all, we cannot locate some students’ transcript data at the subsequent grade levels despite their complete records in their freshman and sophomore years. The size of the analytical sample decreased from 21,140 for freshman and sophomore years to 21,010 and 20,940 in junior and senior years, respectively, which were equivalent to a 0.6% and 0.3% rate of missing. In latent transition analysis, we used a full information maximum likelihood procedure to handle the missing course-completion patterns in junior and senior years. Second, 1300 students (6.1%) had missing values in their Texas Assessment of Knowledge and Skills scores, but we were not able to identify the specific reason for non-participation (e.g., were absent on the day of testing, were designated as students with limited English proficiency) [39]. This non-participation rate is smaller in the present study than the state average (9.3%). Consequently, we applied the listwise deletion in latent transition analysis for those who had missing values in their Texas Assessment of Knowledge and Skills scores.
Third, to account for the difference in course offerings between high schools, a fixed effect model based on high school affiliation was conducted. To achieve a robust estimate of the clustering effect, we omitted high schools with less than five students represented in the random sample. Finally, in the National Student Clearinghouse data, 31.7% of the students had no records and were designated as non-college-attending students, and FIML was applied to handle the missing data.

4. Results

4.1. Diversity of Course-Completion Patterns

Latent profile analysis revealed that there were multiple course-completion patterns at each grade level (see Table 2 and Figure 2 for details). During freshman and sophomore years, there were two and three distinctive patterns, respectively, since the two- and three-profile solutions were estimated to have the lowest Bayesian Information Criterion, and the p-values of the Voung–Lo–Mendell–Rubin test and Lo–Mendell–Rubin adjusted likelihood ratio test was greater than 0.05 when one more profile was specified. In addition, in these solutions, each pattern accounted for more than 5% of the students.
For the course-completion patterns in junior and senior years, the two- and three-profile solutions were selected as the best-fitting models, respectively. Although these solutions did not have the lowest Bayesian Information Criterion, and the p-values of the Voung–Lo–Mendell–Rubin test and Lo–Mendell–Rubin adjusted likelihood ratio test suggested that more profiles be specified, solutions with more patterns were not selected because of the small size of some profiles (i.e., less than 5% of the students). To avoid focusing on a trivial fraction of students, the two- and three-profile solutions for students’ course-completion patterns as juniors and seniors, respectively, were favored.
In all four grade levels, one pattern accounted for more than 86% of the students exhibiting a similar course completion pattern over time. This pattern was named Regular to designate that most students at a given grade level earned about one credit in English, math, science, and social studies, fewer than one credit in social studies and foreign language, and close to zero credit in CS. Another group of students tended to complete fewer credits in nearly all subject areas except CS than those in the Regular pattern. This pattern was thus named Trailing and accounted for about 5.4–12.0% of the students. In the sophomore and senior years, there was another discrete subgroup termed the CS-Intensive pattern, including 7.0–8.4% of the students. These students, on average, completed one credit in CS (e.g., Web Design) while completing a similar number of credits in other subjects in each grade to those in the Regular group.

4.2. Mobility and Inertia in Coursework Trajectories and Sociodemographic Disparities

In sum, latent transition analysis charted 36 different coursework trajectories throughout high school. Whereas almost two-thirds of the students were estimated to follow the Regular pattern four years in a row (62.9%), 24.8% would fall into the Trailing pattern at least once. In addition, 14.4% of the students were predicted to be grouped in the CS-intensive pattern at least once.
Within each trajectory, there was a great tendency to stay in or return from other coursework patterns to the Regular pattern (see Figure 3). Focusing on students in the CS-intensive pattern, they mostly came to this pattern from the Regular pattern (7.8–9.4%) and then returned to the Regular pattern at the next grade level. Though some were grouped in the Trailing pattern at the prior grade level, they were predicted to have a 3.4–5.5% chance to enter the CS-intensive pattern later on.
Focusing additionally on the sociodemographic disparities in the transition into the CS-intensive pattern, firstly, the negative logit indicated that high school girls were less likely to transition into the CS-intensive pattern than boys (e.g., logit = −0.45 and −0.48 between 9th and 10th grade, ps < 0.001), regardless of their prior coursework pattern. That is, they were also more likely to return to the Regular pattern (i.e., the reference pattern) than boys. Second, compared with their European American peers, African American and Latinx students were less likely to move into the CS-intensive pattern (e.g., logit = −0.37 and −0.51 for African American and Latinx students between 9th and 10th grade, respectively, ps < 0.01), but Asian American students were predicted to be about twice more likely to move into the CS-intensive pattern (e.g., OR = 2.79 and 2.23 from Trailing and Regular to CS-intensive profile between 9th and 10th grade, respectively). Third, students from economically disadvantaged households would have a lower chance to move into the CS-intensive pattern throughout high school than their counterparts (e.g., logit = −0.62 and −0.19 between 9th and 10th grade, respectively, ps < 0.05). Finally, a better Texas Assessment of Knowledge and Skills math score in 10th grade was related to a higher chance to transition from the CS-intensive to the Regular pattern, instead of to the Trailing pattern, in the junior year (logit = −0.95, p < 0.001; see Table 3 for details).

4.3. Pathways to College

The probability of entering college was related to the interaction between students’ course-completion pattern in 12th grade and their sociodemographic background (see Table 3). For students who were profiled in the CS-intensive pattern in 12th grade, students with limited English proficiency and those from a lower SES household were less likely to enroll in college than their counterparts. Additionally, whereas Native American students were less likely to enroll in four-year college despite prior CS coursework, African American and Asian American students were much more likely to enter four-year college than European American students after they completed much more CS credits than peers.

5. Discussion and Implications

5.1. High School Coursework Patterns and Trajectories in CS Fields

This study is one of the first empirical studies to employ the life course perspective to identify and profile the heterogeneous, grade-by-grade patterns of high school coursework of multiple academic subjects. Our study resonates with Adelman’s [3] advocacy that including high school CS coursework enriches our understanding of the multiple venues in which students navigate through high school curricula.
We documented three major characteristics of CS coursework among this particular cohort of high schools in Texas, USA. First of all, only about one in seven high school students is estimated to devote much more time to elective CS courses, although CS is an increasingly growing technology-related field of study. Second, the CS-intensive profile is not manifest every year. Finally, only 6.2% of the students grouped in the CS-intensive profile in 10th grade returned to the same profile again in 12th grade. These phenomena imply that CS courses are perceived as extra as opposed to an integral part of student’s coursework when such courses are not required for high school graduation. Without the external motivator, teachers, parents, and students themselves may put more emphasis on math and science than CS courses because of the direct linkage to college readiness [4,6,18,21,22,23] or the clear sequences during advising [27,28,29]. This low participation and return rate of CS courses may hinder students’ interest in CS fields in college since the accumulation of learning experience is key to a greater aspiration to a particular field [34,43]. At the curriculum level, it is not surprising that the CS-intensive profile does not emerge in 9th grade when students would spend more time on required courses and in 11th grade when students have broader access to dual credit, advanced placement, and international baccalaureate courses [44]. The low return rate may also stem from overlapping CS courses in the curriculum since most school districts did not publish a sequence of CS courses. As such, there was few reasons to take essentially the same course twice.
The multiple coursework patterns throughout high school become even more evident when connecting the yearly coursework patterns together to form the 36 trajectories (see Figure 3). Such fluidity of coursework is partly shaped by students’ academic achievement. It appears that student’s proficiency in math is related to students’ later coursework (logit = −0.95, OR = 0.39, p < 0.001), but only if these students have tried more CS courses than peers. However, an outstanding coursework history is not an absolute requirement (cf. [7]). For example, students profiled in the CS-intensive pattern may come from and later return to the Trailing pattern (see Figure 3).
Indeed, we found that the coursework mobility is also shaped by students’ sociodemographic backgrounds. For example, coming from the Trailing profile in 9th grade, Asian American students would be more likely to transition to the CS-intensive profile in 10th grade than their European American peers (logit = 1.03, OR = 2.79, p < 0.01), but we did not observe such rebound among Latinx students (logit = −0.45, OR = 0.64, p < 0.05). Following the life course perspective [12,13,14], it is likely that whether taking CS courses is a matter of the cultural and academic identity students have experienced and constructed first-handedly [33]. Such identity is related to the way students imagine and perceive what CS is as a subject or a career. For example, literature has documented students’ sentiments and stereotypes towards CS courses that these courses are only reserved for a selected group of students: males, very bright students, and even geeks [45]. As such, it is likely that whether taking CS courses is a matter of the cultural upbringing and academic identity they are constructing, as well as the psychosocial experience they have accumulated [46,47]. Since we were limited to administrative and transcript records in this study, researchers should address the psychosocial dimension of students’ (and even parents’ and teachers’) choice of CS-related electives to understand the motives behind the choice of coursework [33].

5.2. Pathways to College

We found that high school girls and African American and Asian American students profiled in the CS-intensive pattern in 12th grade show a higher level of college attendance than their counterparts. Nevertheless, the college pipeline fails this group of arguably most prepared students when they are financially struggling, not native English speakers and Native American students. First, prior research has revealed that students from economically disadvantaged households do not have the financial means to afford college [48], particularly when the process of financial aid application in the US (e.g., Free Application for Student Federal Aid, Pell Grant) tends to confuse or frustrate students and their family [49,50]. Second, students who do not speak English as their first language may not have the resources to complete financial aid application because of language barriers or unaware of the cost of and benefit of a postsecondary credential [11], hence putting off their plan of entering postsecondary education of any level for almost ten years. Finally, our findings call for concerted work on Native American students’ academic pathways to college and beyond [51]. Though coming from the CS-intensive profile in 12th grade, Native American students are less likely to attend a four-year college than their European American peers. Resonating with the life-course perspective again [12,13,14], the literature points to cultural factors (e.g., family value, belongingness) that a broader and more diverse academic experience during high school is related to college attendance for certain groups of students for college [8] but not for Native American adolescents and young adults [52,53]. Future researchers should curate rich datasets to capture the academic, psychosocial, and cultural facets of the life course of Native American students in late adolescence to understand the dynamics between students’ academic and cultural experiences, which may eventually guide students’ college plans [52].

5.3. Implications

The life course perspective guides us to illustrate the multiple transitions in students’ academic life courses, as well as how the transitions are systematically subject to students’ sociodemographic backgrounds. It is evident that there exists a sizable sociodemographic discrepancy in taking CS courses and attending college among equally-prepared students. Though we are not able to change our sociodemographic background, literature has demonstrated that actionable intervention may include helping students build connections to resourceful adults during college choice [11]. At the structural level, national and state-wide policymakers should prioritize providing resources to school districts to make CS courses available or even mandatory and improve course quality [32,54,55], in that underprivileged students are less likely to benefit from CS courses if the instructors are undertrained [56]. To help students access resources, recent reforms in high school CS curriculum in the US (e.g., COMPUGIRLS, CS4All, Exploring Computer Science) [7,57] directly address the stereotype of the computing discipline and work environment by providing substantial support to the minoritized population [45].
Similarly, researchers and educators should devote effort to clarifying what prevents students with similar course completion patterns from reaping similar academic and postsecondary outcomes. The policy and guidelines of coursework advising should be carefully reviewed to accommodate the highly diverse and dynamic course-completion patterns and trajectories and to avoid implicit socioeconomic biases. Moreover, our findings suggest that time and effort should be strategically allocated to assist and inspire minoritized students even when their coursework pattern looks normative. Future researchers should empirically examine how inclusive these programs are to better prepare students with different backgrounds for postsecondary education and career.

5.4. Limitations

As the current study focused solely on high school students without records of retention and on regular courses, readers should be cautious when interpreting the findings. First of all, although some students lagged behind their peers in terms of the number of completed credits, it does not necessarily mean that these students had unsatisfactory academic performance or stopped taking CS courses. Particularly during the junior and senior years, students would take more advanced courses (e.g., advanced placement, international baccalaureate) or dual credit courses when they were granted more opportunities to explore different types of courses [58,59].
Second, given the low missingness, the influence of missing data on parameter estimates and statistical power when the listwise deletion was adopted was arguably minimal [52]. However, more investigations are needed to ensure that the data were missing completely at random to empirically justify the use of the listwise deletion. Finally, readers should interpret our statistical results as correlational instead of causal. Exhibiting a specific course-completion pattern in one grade may not be the cause of being grouped to another pattern in the next grade.

6. Conclusions

Taking CS coursework into account reveals the nuances of the coursework patterns and academic trajectories of high school students in Texas, USA. With two to three coursework patterns at each grade level, students exhibit 36 different coursework trajectories throughout high school. However, students may part ways and enter different coursework patterns in the next grade level though they share the same pattern in the previous year. Such departure is sometimes related to students’ sociodemographic background. Eventually, the probability of attending college, despite taking more CS courses in 12th grade, is once again related to students’ sociodemographic background. As more states and high schools in the US require CS courses, special attention to equitable access to and resources for CS courses for all students is needed to sustain students’ interest and learning experience in CS over time.

Author Contributions

Conceptualization, H.-Y.C., T.-L.M. and G.K.S.; methodology, H.-Y.C. and G.K.S.; software, H.-Y.C.; formal analysis, H.-Y.C.; writing—original draft preparation, H.-Y.C., T.-L.M. and Y.-M.H.; writing—review and editing, H.-Y.C., T.-L.M., G.K.S. and Y.-M.H.; visualization, H.-Y.C.; funding acquisition, H.-Y.C. All authors have read and agreed to the published version of the manuscript.

Funding

This research is funded by a grant from the Texas OnCourse project at the University of Texas-Austin, Austin, Texas, USA, and the Ministry of Science and Technology, Taiwan (MOST 110-2410-H-003-136-MY3) to the first author.

Institutional Review Board Statement

Institutional Review Board of Texas A&M University-Commerce, USA, #1315, 13 December 2016.

Informed Consent Statement

Not applicable.

Acknowledgments

The conclusions of this research do not necessarily reflect the opinion or official position of the Texas Education Research Center, the Texas Education Agency, the Texas Higher Education Coordinating Board, the Texas Workforce Commission, or the State of Texas.

Conflicts of Interest

The authors declare no conflict of interest.

References

  1. Ma, J.; Pender, M.; Welch, M. Education Pays 2016: The Benefits of Higher Education for Individuals and Society; College Board: New York, NY, USA, 2016. [Google Scholar]
  2. Jepsen, C.; Troske, K.; Coomes, P. The Labor-Market Returns to Community College Degrees, Diplomas, and Certificates. J. Labor Econ. 2014, 32, 95–121. [Google Scholar] [CrossRef] [Green Version]
  3. Adelman, C. Answers in the Tool Box: Academic Intensity, Attendance Patterns, and Bachelor’s Degree Attainment; Department of Education: Washington, DC, USA, 1999. [Google Scholar]
  4. Kim, J.; Kim, J.; Desjardins, S.L.; McCall, B.P. Completing Algebra II in High School: Does it Increase College Access and Success? J. High. Educ. 2015, 86, 628–662. [Google Scholar] [CrossRef]
  5. Tierney, W.G.; Garcia, L.D. Postsecondary Remediation Interventions and Policies. Am. Behav. Sci. 2011, 55, 99–101. [Google Scholar] [CrossRef]
  6. Attewell, P.; Domina, T. Raising the Bar: Curricular Intensity and Academic Performance. Educ. Eval. Policy Anal. 2008, 30, 51–71. [Google Scholar] [CrossRef]
  7. Goode, J.; Flapan, J.; Margolis, J. Computer Science for All: A School Reform Framework for Broadening Participation in Computing. In Diversifying Digital Learning: Online Literacy and Educational Opportunity; Tierney, W.G., Corwin, Z.B., Ochsner, A., Eds.; Johns Hopkins University Press: Baltimore, MD, USA, 2018; pp. 45–65. [Google Scholar]
  8. Goode, J.; Estrella, R.; Margolis, J. Lost in Translation: Gender and High School Computer Science. In Women and Information Technology: Research on Underrepresentation; Cohoon, J.M., Aspray, W., Eds.; MIT Press: Cambridge, MA, USA, 2006; pp. 89–113. [Google Scholar]
  9. So, W.W.M. Does computation technology matter in science, technology, engineering and mathematics (STEM) projects? Res. Sci. Technol. Educ. 2021. [CrossRef]
  10. Paz, T.; Levy, D. Introducing computer science to educationally disadvantaged high school students. Res. Sci. Technol. Educ. 2005, 23, 229–244. [Google Scholar] [CrossRef]
  11. Perna, L.W. Differences in the Decision to Attend College among African Americans, Hispanics, and Whites. J. High. Educ. 2000, 71, 117–141. [Google Scholar] [CrossRef]
  12. Elder, G.H. Age Differentiation and the Life Course. Annu. Rev. Sociol. 1975, 1, 165–190. [Google Scholar] [CrossRef]
  13. Elde, G.H., Jr. Time, Human Agency, and Social Change: Perspectives on the Life Course. Soc. Psychol. Q. 1994, 57, 4–15. [Google Scholar] [CrossRef]
  14. Elder, G.H. The Life Course as Developmental Theory. Child Dev. 1998, 69, 1–12. [Google Scholar] [CrossRef]
  15. Crosnoe, R.; Benner, A.D. Educational Pathways. In Handbook of the Life Course; Shanahan, M.J., Mortimer, J.T., Johnson, M.K., Eds.; Springer: Cham, Switzerland, 2016; Volume II, pp. 179–200. [Google Scholar] [CrossRef]
  16. Crosnoe, R.; Johnson, M.K. Research on Adolescence in the Twenty-First Century. Annu. Rev. Sociol. 2011, 37, 439–460. [Google Scholar] [CrossRef] [PubMed] [Green Version]
  17. Powell, A.G.; Farrar, E.; Cohen, D.K. The Shopping Mall High School. In NASSP Bulletin; Houghton Mifflin Company: Boston, MA, USA, 1985. [Google Scholar]
  18. Schneider, B.; Swanson, C.B.; Riegle-Crumb, C. Opportunities For Learning: Course Sequences and Positional Advantages. Soc. Psychol. Educ. 1997, 2, 25–53. [Google Scholar] [CrossRef]
  19. Blossfeld, P.N.; Blossfeld, G.J.; Blossfeld, H.-P. Changes in Educational Inequality in Cross-National Perspective. In Hand-Book of the Life Course; Shanahan, M.J., Mortimer, J.T., Eds.; Springer: Cham, Switzerland, 2016; pp. 223–247. [Google Scholar] [CrossRef]
  20. Riegle-Crumb, C. The Path through Math: Course Sequences and Academic Performance at the Intersection of Race-Ethnicity and Gender. Am. J. Educ. 2006, 113, 101–122. [Google Scholar] [CrossRef] [PubMed] [Green Version]
  21. Gaertner, M.N.; Kim, J.; DesJardins, S.L.; McClarty, K.L. Preparing Students for College and Careers: The Causal Role of Algebra II. Res. High. Educ. 2013, 55, 143–165. [Google Scholar] [CrossRef]
  22. Long, M.C.; Conger, D.; Iatarola, P. Effects of High School Course-Taking on Secondary and Postsecondary Success. Am. Educ. Res. J. 2012, 49, 285–322. [Google Scholar] [CrossRef]
  23. Altonji, J.G.; Blom, E.; Meghir, C. Heterogeneity in Human Capital Investments: High School Curriculum, College Major, and Careers. Annu. Rev. Econ. 2012, 4, 185–223. [Google Scholar] [CrossRef] [Green Version]
  24. Aughinbaugh, A. The effects of high school math curriculum on college attendance: Evidence from the NLSY97. Econ. Educ. Rev. 2012, 31, 861–870. [Google Scholar] [CrossRef]
  25. Horn, L.; Kojaku, L.K.; MPR Associates, Inc. High School Academic Curriculum and the Persistence Path through College: Persistence and Transfer Behavior of Undergraduates 3 Years after Entering 4-Year Institutions; U.S. Department of Education: Washington, DC, USA, 2001. [Google Scholar]
  26. Tyson, W.; Lee, R.; Borman, K.M.; Hanson, M.A. Science, Technology, Engineering, and Mathematics (STEM) Pathways: High School Science and Math Coursework and Postsecondary Degree Attainment. J. Educ. Stud. Placed Risk (JESPAR) 2007, 12, 243–270. [Google Scholar] [CrossRef]
  27. Aschbacher, P.R.; Li, E.; Roth, E.J. Is science me? High school students’ identities, participation and aspirations in science, engineering, and medicine. J. Res. Sci. Teach. 2009, 47, 564–582. [Google Scholar] [CrossRef]
  28. Davenport, J.E.C.; Davison, M.L.; Kuang, H.; Ding, S.; Kim, S.-K.; Kwak, N. High School Mathematics Course-Taking by Gender and Ethnicity. Am. Educ. Res. J. 1998, 35, 497–514. [Google Scholar] [CrossRef]
  29. McFarland, D.A. Curricular Flows: Trajectories, Turning Points, and Assignment Criteria in High School Math Careers. Sociol. Educ. 2006, 79, 177–205. [Google Scholar] [CrossRef]
  30. Schiller, K.S.; Schmidt, W.; Muller, C.; Houang, R.T. Hidden Disparities: How Courses and Curricula Shape Opportunities in Mathematics during High School. Equity Excel. Educ. 2010, 43, 414–433. [Google Scholar] [CrossRef] [PubMed]
  31. Adelman, C. The Toolbox Revisited: Paths to Degree Completion from High School through College; Department of Education: Washington, DC, USA, 2006. [Google Scholar]
  32. Tucker, A.; Deek, F.; Jones, J.; McCowan, D.; Stephenson, C.; Verno, A. A Model Curriculum for K-12 Computer Science: Final Report of the ACM K-12 Task Force Curriculum Committee; Association for Computing Machinery, Inc.: New York, NY, USA, 2003. [Google Scholar]
  33. Sax, L.J.; Blaney, J.M.; Lehman, K.J.; Rodriguez, S.L.; George, K.L.; Zavala, C. Sense of Belonging in Computing: The Role of Introductory Courses for Women and Underrepresented Minority Students. Soc. Sci. 2018, 7, 122. [Google Scholar] [CrossRef] [Green Version]
  34. Chen, C.; Kang, J.M.; Sonnert, G.; Sadler, P.M. High School Calculus and Computer Science Course Taking as Predictors of Success in Introductory College Computer Science. In ACM Transactions on Computing Education; Association for Computing Machinery, Inc.: New York, NY, USA, 2020; Volume 21. [Google Scholar] [CrossRef]
  35. Saw, G.; Chang, C.-N.; Chan, H.-Y. Cross-Sectional and Longitudinal Disparities in STEM Career Aspirations at the Intersection of Gender, Race/Ethnicity, and Socioeconomic Status. Educ. Res. 2018, 47, 525–531. [Google Scholar] [CrossRef]
  36. Lucas, S.R.; Berends, M. Sociodemographic Diversity, Correlated Achievement, and de Facto Tracking. Sociol. Educ. 2002, 75, 328. [Google Scholar] [CrossRef]
  37. Oakes, J.; Guiton, G. Matchmaking: The Dynamics of High School Tracking Decisions. Am. Educ. Res. J. 1995, 32, 3–33. [Google Scholar] [CrossRef]
  38. Piccarreta, R.; Studer, M. Holistic analysis of the life course: Methodological challenges and new perspectives. Adv. Life Course Res. 2018, 41, 100251. [Google Scholar] [CrossRef]
  39. Texas Education Agency. Grade-Level Retention in Texas Public Schools, 2006–2007; Texas Education Agency: Austin, TX, USA, 2008. [Google Scholar]
  40. Meredith, W.; Tisak, J. Latent curve analysis. Psychometrika 1990, 55, 107–122. [Google Scholar] [CrossRef]
  41. Nylund-Gibson, K.; Grimm, R.; Quirk, M.; Furlong, M. A Latent Transition Mixture Model Using the Three-Step Specification. Struct. Equ. Model. A Multidiscip. J. 2014, 21, 439–454. [Google Scholar] [CrossRef] [Green Version]
  42. Asparouhov, T.; Muthén, B. Auxiliary Variables in Mixture Modeling: Three-Step Approaches Using Mplus. Struct. Equ. Model. Multidiscip. J. 2014, 21, 329–341. [Google Scholar] [CrossRef]
  43. Lent, R.W.; Brown, S.D. Social cognitive model of career self-management: Toward a unifying view of adaptive career behavior across the life span. J. Couns. Psychol. 2013, 60, 557–568. [Google Scholar] [CrossRef] [PubMed]
  44. College Board. Choosing Your AP Courses. Available online: https://apstudents.collegeboard.org/choosing-courses (accessed on 3 November 2022).
  45. Margolis, J.; Goode, J.; Chapman, G. An equity lens for scaling: A Critical Juncture for Exploring Computer Science. ACM Inroads 2015, 6, 58–66. [Google Scholar] [CrossRef]
  46. Robnett, R.D.; Nelson, P.A.; Zurbriggen, E.L.; Crosby, F.J.; Chemers, M.M. Research mentoring and scientist identity: Insights from undergraduates and their mentors. Int. J. STEM Educ. 2018, 5, 41. [Google Scholar] [CrossRef] [PubMed]
  47. Syed, M.; Azmitia, M.; Cooper, C.R. Identity and Academic Success among Underrepresented Ethnic Minorities: An Interdisciplinary Review and Integration. J. Soc. Issues 2011, 67, 442–468. [Google Scholar] [CrossRef]
  48. Paulsen, M.B.; John, E.P.S. Social Class and College Costs: Examining the Financial Nexus between College Choice and Persistence. J. High. Educ. 2002, 73, 189–236. [Google Scholar] [CrossRef]
  49. Bettinger, E.P.; Long, B.T.; Oreopoulos, P.; Sanbonmatsu, L. The Role of Application Assistance and Information in College Decisions: Results from the H&R Block Fafsa Experiment. Q. J. Econ. 2012, 127, 1205–1242. [Google Scholar] [CrossRef]
  50. Kofoed, M.S. To Apply or Not to Apply: FAFSA Completion and Financial Aid Gaps. Res. High. Educ. 2016, 58, 1–39. [Google Scholar] [CrossRef]
  51. Jackson, A.P.; Smith, S.A.; Hill, C.L. Academic Persistence Among Native American College Students. J. Coll. Stud. Dev. 2003, 44, 548–565. [Google Scholar] [CrossRef] [Green Version]
  52. Fong, C.J.; Alejandro, A.J.; Krou, M.R.; Segovia, J.; Johnston-Ashton, K. Ya’at’eeh: Race-reimaged belongingness factors, academic outcomes, and goal pursuits among Indigenous community college students. Contemp. Educ. Psychol. 2019, 59, 101805. [Google Scholar] [CrossRef]
  53. Guillory, R.M.; Wolverton, M. It’s about Family: Native American Student Persistence in Higher Education. J. High. Educ. 2008, 79, 58–87. [Google Scholar] [CrossRef]
  54. Ryoo, J.; Goode, J.; Margolis, J. It takes a village: Supporting inquiry- and equity-oriented computer science pedagogy through a professional learning community. Comput. Sci. Educ. 2015, 25, 351–370. [Google Scholar] [CrossRef]
  55. Abu-El-Haija, L.; Payton, F.C. A Plan to Offer Computer Science Classes in All North Carolina High Schools. Issues Sci. Technol. 2021, 37, 16–18. [Google Scholar]
  56. Fields, D.A.; Kafai, Y.; Nakajima, T.; Goode, J.; Margolis, J. Putting Making into High School Computer Science Classrooms: Promoting Equity in Teaching and Learning with Electronic Textiles in Exploring Computer Science. Equity Excell. Educ. 2018, 51, 21–35. [Google Scholar] [CrossRef]
  57. Lee, J.; Husman, J.; Scott, K.A.; Eggum-Wilkens, N.D. COMPUGIRLS: Stepping Stone to Future Computer-Based Technology Pathways. J. Educ. Comput. Res. 2015, 52, 199–223. [Google Scholar] [CrossRef]
  58. Hu, X.; Chan, H.-Y. Does Delivery Location Matter? A National Study of the Impact of Dual Enrollment on College Readiness and Early Academic Momentum. Teach. Coll. Rec. Voice Sch. Educ. 2021, 123, 1–32. [Google Scholar] [CrossRef]
  59. Gottfried, M.A.; Plasman, J.S. Linking the Timing of Career and Technical Education Coursetaking with High School Dropout and College-Going Behavior. Am. Educ. Res. J. 2017, 55, 325–361. [Google Scholar] [CrossRef]
Figure 1. Analytical path diagram.
Education 12 00808 g001
Figure 2. Course-completion patterns by year. (a) 9th-grade course completion patterns; (b) 10th-grade course completion patterns; (c) 11th-grade course completion patterns; (d) 12th-grade course completion patterns.
Education 12 00808 g002aEducation 12 00808 g002b
Figure 3. Sankey diagram of transitions between coursework patterns.
Education 12 00808 g003
Table 1. Summary of the sociodemographic background of the final analytical sample.
VariableDefinition%
Outcome variable
 College enrollmentHighest level of college ever enrolled
4-year college43.2%
2-year college28.1%
No attendance +28.7%
Sociodemographic background
Gender: FemaleSelf-report gender at 9th grade51.8%
Gender: Male +48.2%
Race/ethnicity: Native AmericanSelf-report race/ethnicity status at 9th grade0.3%
Race/ethnicity: Asian American3.8%
Race/ethnicity: African American13.0%
Race/ethnicity: Latinx36.2%
Race/ethnicity: European American +46.7%
English proficiency: LimitedLimited English proficiency status at 9th grade3.8%
English proficiency: Proficient +96.2%
SES: Economically disadvantagedEligibility of free/reduced lunch program at 9th grade37.7%
SES: Not economically disadvantaged +62.3%
Special education: Being placed in the individualized education programWhether students were placed in individualized education program at 9th grade4.1%
Special education: Not being placed in the individualized education program +95.9%
Note. SES = socioeconomic status. + Reference category in statistical analyses.
Table 2. Summary of model comparison of latent profile analysis.
Grade LevelNumber of ProfileAkaike Information CriterionBayesian Information CriterionAdjusted Bayesian Information CriterionVoung–Lo–Mendell–Rubin TestLo–Mendell–Rubin Adjusted Likelihood Ratio Test
9th1116,040.08116,151.62116,107.12----
9th295,754.8095,930.0795,860.15<0.001<0.001
9th322,065.1522,304.1622,208.821.001.00
10th1143,918.11144,029.53143,985.04----
10th289,597.6089,772.7089,702.780.010.01
10th374,134.9274,373.6974,278.35<0.001<0.001
10th461,801.5562,103.9961,983.230.060.06
11th1197,107.32197,218.66197,174.17----
11th2186,898.03187,072.99187,003.070.010.01
11th3133,827.15134,065.73133,970.39<0.001<0.001
11th4(no convergence)
12th1231,067.53231,178.82231,134.33----
12th2191,896.26192,071.14192,001.23<0.001<0.001
12th3172,684.49172,922.97172,827.63<0.001<0.001
12th4159,766.47160,068.54159,947.78<0.001<0.001
12th5(no convergence)
Note. Bold rows show the preferred solution.
Table 3. Summary of moderating effects on pattern transitions (selected results).
9th-grade Pattern 10th-grade Pattern Auxiliary Variable Logit SE OR
Trailing
CS-intensive
(threshold)−2.040.09
Female−0.450.120.64 ***
Limited English proficiency status−0.220.28
Economically disadvantaged−0.620.180.54 **
Individualized education program placement−0.460.24
Native American1.761.45
Asian American 1.030.332.79 **
African American−0.260.26
Latinx−0.450.190.64 *
Regular
CS-intensive
(threshold)−2.040.09
Female−0.480.070.62 ***
Limited English proficiency status−0.380.35
Economically disadvantaged−0.190.100.82 *
Individualized education program placement−0.370.23
Native American−0.030.60
Asian American 0.800.122.23 ***
African American−0.370.140.69 **
Latinx−0.510.120.60 ***
10th-grade Pattern11th-grade PatternAuxiliary VariableLogitSEOR
CS-intensive
Trailing
(threshold)−1.350.08
Female−0.520.250.59 *
Limited English proficiency status−0.050.54
Economically disadvantaged−0.140.28
Individualized education program placement0.010.56
Native AmericanN/AN/A
Asian American −0.480.63
African American0.400.34
Latinx0.510.27
Standardized test score: Reading−0.230.14
Standardized test score: Math−0.950.210.39 ***
11th-grade Pattern12th-grade PatternAuxiliary VariableLogitSEOR
Trailing
CS-intensive
(threshold)−1.850.06
Female−0.650.250.52 **
Limited English proficiency status0.600.61
Economically disadvantaged−0.890.270.41 ***
Individualized education program placement0.300.41
Native American2.121.11
Asian American N/AN/A
African American0.0010.35
Latinx−0.520.32
Regular
CS-intensive
(threshold)−1.850.06
Female−0.300.060.74 ***
Limited English proficiency status0.300.25
Economically disadvantaged−0.040.09
Individualized education program placement−0.050.17
Native American−0.210.54
Asian American 0.540.121.71 ***
African American−0.050.11
Latinx−0.240.100.79 *
12th-grade PatternHighest Level of College EducationAuxiliary VariableLogitSEOR
CS-intensive
4-year
(threshold)−15.140.93
Female1.580.684.83 *
Limited English proficiency status−6.591.680.001 ***
Economically disadvantaged−8.661.11<0.001 ***
Individualized education program placement−0.741.60
Native American−6.550.940.001 ***
Asian American 12.951.56-- ***
African American2.771.3015.92 *
Latinx1.181.00
CS-intensive
2-year
(threshold)−3.530.98
Female1.310.68
Limited English proficiency status−4.951.550.01 **
Economically disadvantaged−8.071.11<0.001 ***
Individualized education program placement1.341.54
Native AmericanN/AN/A
Asian American 12.041.58-- ***
African American2.501.31
Latinx1.181.01
Note. Results concerning the CS-intensive pattern are presented; please contact the authors for complete results. N/A = empty cells. To avoid confusion, the odds ratio (OR) was reported if it is statistically significant at p < 0.05 level. * p < 0.05 ** p < 0.01 *** p < 0.001.
Publisher’s Note: MDPI stays neutral with regard to jurisdictional claims in published maps and institutional affiliations.

