Abstract
Computer science is a dynamic field of study that requires constant review and updating of the curricular designs in academic programs—in general, measuring the impact of plan changes has been little explored in the literature. In most cases, it focuses only on structuring its curricula, leaving aside several factors associated with important events or facts such as student dropout, retention, and inclusion. However, these features provide academic institutions with many opportunities to understand student performance and propose more effective preventive/corrective actions to avoid dropouts. This work focuses on the curricular changes’ influence on student gender imbalance, socioeconomic provenance, and dropout. Specifically, we employ three different approaches for our analysis: (i) a longitudinal study of four curricula from informatics engineering to computer science transition at San Pablo Catholic University, (ii) an exploratory analysis for identifying essential features that determines the events mentioned above, and (iii) a survival analysis to estimate the probability that a student will stay (not dropout) before graduate, and calculate the average permanence time per curricula. Our analysis shows that the female student rates decreased, student rates from lower socioeconomic provenance increased, and the dropout rates were reduced with updates towards an internationally standardized curriculum. This is even strongly evidenced when the program changes its name. Finally, the set of techniques employed in this work composes a statistical mechanism that can be replicated/adapted to any other program in computer science aiming to extract valuable insights to support the decision-making process in educational institutions.
1. Introduction
The central concern of curricular design is to ensure students’ academic success. It is a dynamic, emergent, and collaborative learning process for students and teachers [1]. Generally, a curricular design is guided by three questions: What do our students need to learn? How can we help our students learn? How do we know our students have learned? [2]. Therefore, understanding the influence of the educational variables, such as the type of curricular design, is a relevant key to preventing various educational phenomena, such as student dropout [3] and the unbalancing of gender.
The curricular design could be a critical aspect that affects dropouts differently. This problem primarily occurs with fields of study that evolve rapidly in time, manifesting itself with an increase in the number of courses; this is the case in computer science. Student dropout research differs in the data used, such as scholarship [4], academic grades [5,6,7], student residence and provenance [8], and socioeconomic status [9]. However, recent studies evidence the relationship between different curricular designs and student dropout [3,10,11]. On the other hand, the study of gender differences in computer science and related areas has captured the attention of many researchers, as shown in [12,13]. One of the focuses of interest is to understand if the negative stereotypes of women are decisive when choosing a career related to computing. Furthermore, other studies explore if socioeconomic variables impact academic performance in computer science programs [14]. Although various investigations focus on the influence of gender and socioeconomic level in universities, there are only a few reports on how these variables react to changes in curricular design. This paper presents a case study that explores the impact of different computing curriculum designs on educational phenomena such as student inclusion and dropout. First, we report some evidence of our experience of the curricular reform at the San Pablo Catholic University (UCSP, for its acronym in Spanish) from Peru. We then discuss the transition between curricula from informatics engineering to computer science and how these changes influence the proportion of gender, socioeconomic level of the provenance location, and student dropout in various contexts.
2. Contextualization
Computer science undergraduate programs in Latin America have been influenced by various trends worldwide since their inception. In the following, we will describe four main factors that we consider to have affected the evolution of these undergraduate programs.
- (a)
- Computer Science/Informatics. Undergraduate programs in computing in Latin America have been influenced since their inception by two trends, which have both emerged since the late 1940s: the Anglo-American with the term computer science and the European with the term Informatics. In practice, the international scientific community considers both terms synonymous. They refer to the study of computers, including the theory of computation, software design, and algorithms, and the way humans interact with technology. Computer science/informatics and six other branches of computing are currently regulated based on the world standard called Computing Curricula [15]. This standard was developed in cooperation with institutions such as the Association for Computing Machinery (ACM) and the Computer Society from the Institute of Electrical and Electronics Engineers (IEEE-CS) and propose guidelines to undergraduate programs in computing-based areas. Other institutions such as the International Federation for Information Processing (IFIP, Europe) also support this standard. This trend in computer science has a strongly marked presence in Brazil. On the other hand, there is also a significant presence of computer science programs in Argentina, Chile, and Mexico, although they still maintain a diversity of nomenclatures. In the rest of the Latin American countries, this trend is not very significant or is in an initial stage.
- (b)
- Systems engineering in English-speaking countries. Another essential factor to be considered in this context is the term Systems Engineering that emerged in the 1940s in the USA and was defined as the engineering discipline that deals with complex engineering problems requiring multidisciplinary approaches, including management aspects. This trend is currently regulated by the International Council on System Engineering (INCOSE) and exists mainly in English-speaking countries.
- (c)
- Systems engineering in Latin America. In addition to establishing Systems Engineering (in the 1960s), the activity generated by companies such as IBM emerged. To manage its installed computing solutions, IBM created a job position called a Systems Engineer, which a person of any professional background could fill. Then, from this required position in the market, several Latin American countries such as Colombia, Peru, Ecuador, and Venezuela, among others, began to create undergraduate programs under the name Systems Engineering. This regional version of Systems Engineering consists of topics related to Business, Marketing, Accounting, Administration, Economics, Organizational behavior, Indus- trial Engineering, Electronic Engineering, and the content of some parts of the seven standards of Computing Curricula (ACM, CS-IEEE).
- (d)
- Computer Engineering in Spain. As in Latin America, the terminology of Systems Engineering is common; in Spain, this convergence led to “Ingeniería Informática” (informatics engineering). However, after adhering to the Bologna agreement (in 1999), the need to standardize and internationalize the content of these careers arose. At present, for historical reasons, this denomination is still maintained. Still, each computer-related program is being built or aligned based on one of the seven programs proposed in the Computer Science Study Plans (ACM, CS-IEEE).
In the case of Peru, there are currently around 90 professional programs related to computing. Of these programs, 94% follow the trend described in (c) with adaptations from (d), and only 6% of the undergraduate programs follow the direction described in (a), mainly focused on the computer science standard. In this work, we use the undergraduate program in computer science at the San Pablo Catholic University in Peru as our case study. This program started in 1999 under the name of “Ingeniería Informática” (informatics engineering), strongly marked by the trend of (c). Then, early in its history, in 2001, it began its internal transformation towards the computer science standard. Finally, in 2010, having changed the vast majority of courses, the name was formally changed from “Ingeniería Informática” to “Ciencia de la Computación” (Computer Science). After that, the computer science standard has continued to the present day.
3. Related Work
Despite the fact that computer science (and related computing programs) is young and rapidly developing compared to most other programs, it has proven to be extremely popular in recent years. In recent work, Savic et al. [16] investigated the diverse motivations that students have for studying novel programs such as computer science. These motivations range from an affinity for science and the constant advancement of technology, making this knowledge more understandable than in a traditional career. It is therefore essential to have a solid curricular design that meets the demands of students and aligns with what the world trend requires [1]. Furthermore, an ideal curricular design implies the knowledge of computer software and mathematical and statistical foundations that help implement, interpret, and communicate its results.
As in many exact science programs, the proportion of female students is lower than that of male students. Different investigations report the preference, development, and adaptation of the female gender in computer science programs [12,13,17]. However, many other variables impact academic performance, such as social, economic, or circumstantial. For instance, as mentioned in [14], there is a solid and positive relationship between socioeconomic status and academic achievement. The research question proposed by [14] consists of identifying the variables between socioeconomic status and computer science achievement. Miranda et al. [14] explore the influence of socioeconomic variables, commenting on the actions to be taken to mitigate the problems and impact on academic achievement. It represents one of the first efforts to study the effect of the student’s socioeconomic origin and residence on their university studies.
Understanding the student’s success in computer science and exploring, various aca- demic phenomena such as retention and university dropouts is an essential topic for universities. For instance, Pappas et al. [18] investigated students’ intention to complete their studies in computer science using variables such as year of studies, students’ effort, expected GPA, current GPA, absence from classes, gender, and others. Furthermore, we can find more specific studies on student retention in computer science courses such as “Data Structures and Algorithms”. Christoph et al. [19] showed that gender alone is not enough to predict students leaving the program after this course despite reporting a desire to continue their studies. In general, design curricular changes seek a structural reorganization in any career that will facilitate the opening of access, permanence, and continuity in studies, but also a privileged opportunity to update and improve teaching and assessment processes. Mendez et al. [20] propose a practical test of learning analytics to extract insights on the nature of current performance in the computer science program.
Note: While various investigations explore the impact of variables such as gender, socioeconomic status, and student preferences on success in a computer science program, to the best of our knowledge, there are no longitudinal studies that report: (i) how these variables are reflected in time, and (ii) how curricular changes impact phenomena such as student dropout, gender balance at universities, and the inclusion of students from locations with low-income socioeconomic.
4. Research Questions
This study explores the influence of curricular changes in various contexts. The first two questions are associated with the balance of students according to gender and socioeconomic origin. The last four questions are related to the problem of academic dropout. Therefore, we formulate the following research questions that guide our data analysis.
RQ1: Did the different curriculum designs have an impact on students’ gender proportion?
RQ2: Did the different curriculum designs impact the proportion of students according to provenance location socioeconomic level?
RQ3: Did the different curriculum designs have an impact on students’ dropout rates?
RQ4: What was the impact of gender and provenance location socioeconomic level on student dropout rates?
RQ5: Did the different curriculum designs have an impact on student’s permanence time?
RQ6: What variables are most decisive in predicting the permanence time before dropping out?
5. Materials and Methods
In this section, we present the setup used for our study. First, we introduce the dataset employed for our study, and we then present an exploratory analysis from the data.
5.1. Data Set
As commented above, we employed data from the Computer Science program at San Pablo Catholic University in Peru. It began in 1999, with the name Informatics Engineering. In 2011, the program’s name was formally updated to Computer Science. We obtained these data with the collaboration of the IT department, which was responsible for masking sensitive data. Thus, we do not have access to the students’ names or personal information. The personal masked identity (in short, MaskPerson_ID) is unique based on this dataset. MaskPerson_ID is different from MaskStudent_ID. If a person is withdrawn from the university and then reinstated, they will do so with a new MaskStudent_ID. Our dataset comprises 1355 students, where 706 are Informatics Engineering students, and 649 are Computer Science students. In general, we grouped the available features as follows:
- (a)
- Demographic data consists of general information about students, such as person identifier, gender, marital status, date of birth, age, provenance location, residence location, and high school type.
- (b)
- General academic data are data linked to universities. One variable is the name of the curriculum design, which assumes values of IE1, IE2, CS1, and CS2. Additionally, we have the admission semester. In the same vein, we have the name of the enrolled semester, which can be regular or not. For example, 2001–01 and 2001–02 are regular semesters, and other configurations are non-regular semesters. They are resources that satisfy the number of hours and credits as summer courses. The completed semester represents the practical semester of study, assuming a unique value between 1 and 10. For example, a student may have enrolled in five periods and have only two semesters completed; this occurs because the student failed some courses. The scholarship represents the state of whether or not it has financial funding. Finally, student status assumes the following values: graduated, regular, reserved, separated, retired, and transferred.
- (c)
- Academic data by course is related to the enrolled courses. Based on the courses, we have attributes of course code, course name, type of course (compulsory or elective), course grade (on a scale from 0 to 20), weekly hours per course, number of credits per course, hours of absence per course, and reservation status per course.
Based on the collected data described in items (a), (b), and (c), we selected some variables and recalculated others, considering that they have a reasonable correlation with the variables that define the gender of students, provenance location socioeconomic level, and dropout status. These attributes are decisive to respond to the research questions formulated in Section 4.
We use MaskStudent_ID to calculate the number of student IDs (NumStudent_ID). In a similar context, we processed the name of the curriculum design to determine for each student the initial curricular design (Initial_CD), the final curricular design (Final_CD), the number of curricular designs (Number_CD), and the variable that defined if the person changed the curricular design or not (Changed_CD).
To understand the impact of curricular changes on inclusion phenomena in computer science, we used nominal variables that define gender and location of origin. The variable student’s gender (Gender) is not modified. However, we processed the name of the provenance location. We used the 2019 Peruvian Human Development Index 1 (in short, HDI) data to have a socioeconomic measure of the location provenance. Briefly, HDI measures the average gain in three basic dimensions of development: a long and healthy life, access to knowledge, and a decent standard of living. We linked the Peruvian HDI data to the provenance location for each student and created a new variable that represents the provenance location socioeconomic level for each student.
We labeled this variable Socioeconomic_Prov, which can be high, medium, or low. The provenance location is classified with a high level when the HDI is higher than 0.7. Medium level occurs when the HDI is between 0.55 and 0.7. Otherwise, the provenance location has a low level.
A large amount of research that addresses various phenomena in higher education reveals that academic variables tend to be the most determining. One of them is the variable that defines whether the student has a scholarship or not (Scholarship). Therefore, we process the information described in (b) and (c) to obtain variables such as the final grade point average (Final_GPA), the mean of enrolled courses per semester Courses_Mean, the proportion of faulted courses concerning the total number of enrolled courses (Faults_Courses), the proportion of faulted courses by the absence with the total number of enrolled courses (Absences_Courses), the proportion of reservations about the total number of enrolled courses (Reservations_Courses), and the proportion of non-regular semesters concerning the total number of enrolled semesters (NonRegular_Prop).
In addition, we consider a student as dropped out when their student status is separated, retired, or transferred. Otherwise, the student did not drop out. Therefore, we introduce a variable that defines the dropout status (Dropout). Finally, as time variables, we have the semester of admission to the university, the number of completed semesters, and the number of enrolled semesters denoted by Admission_Sem, Completed_Sem and Enrolled_Sem, respectively. We briefly describe and classify the attributes used in Table 1.

Table 1.
Description of the data attributes collected from each student at the studied university.
5.2. Exploratory Data Analysis
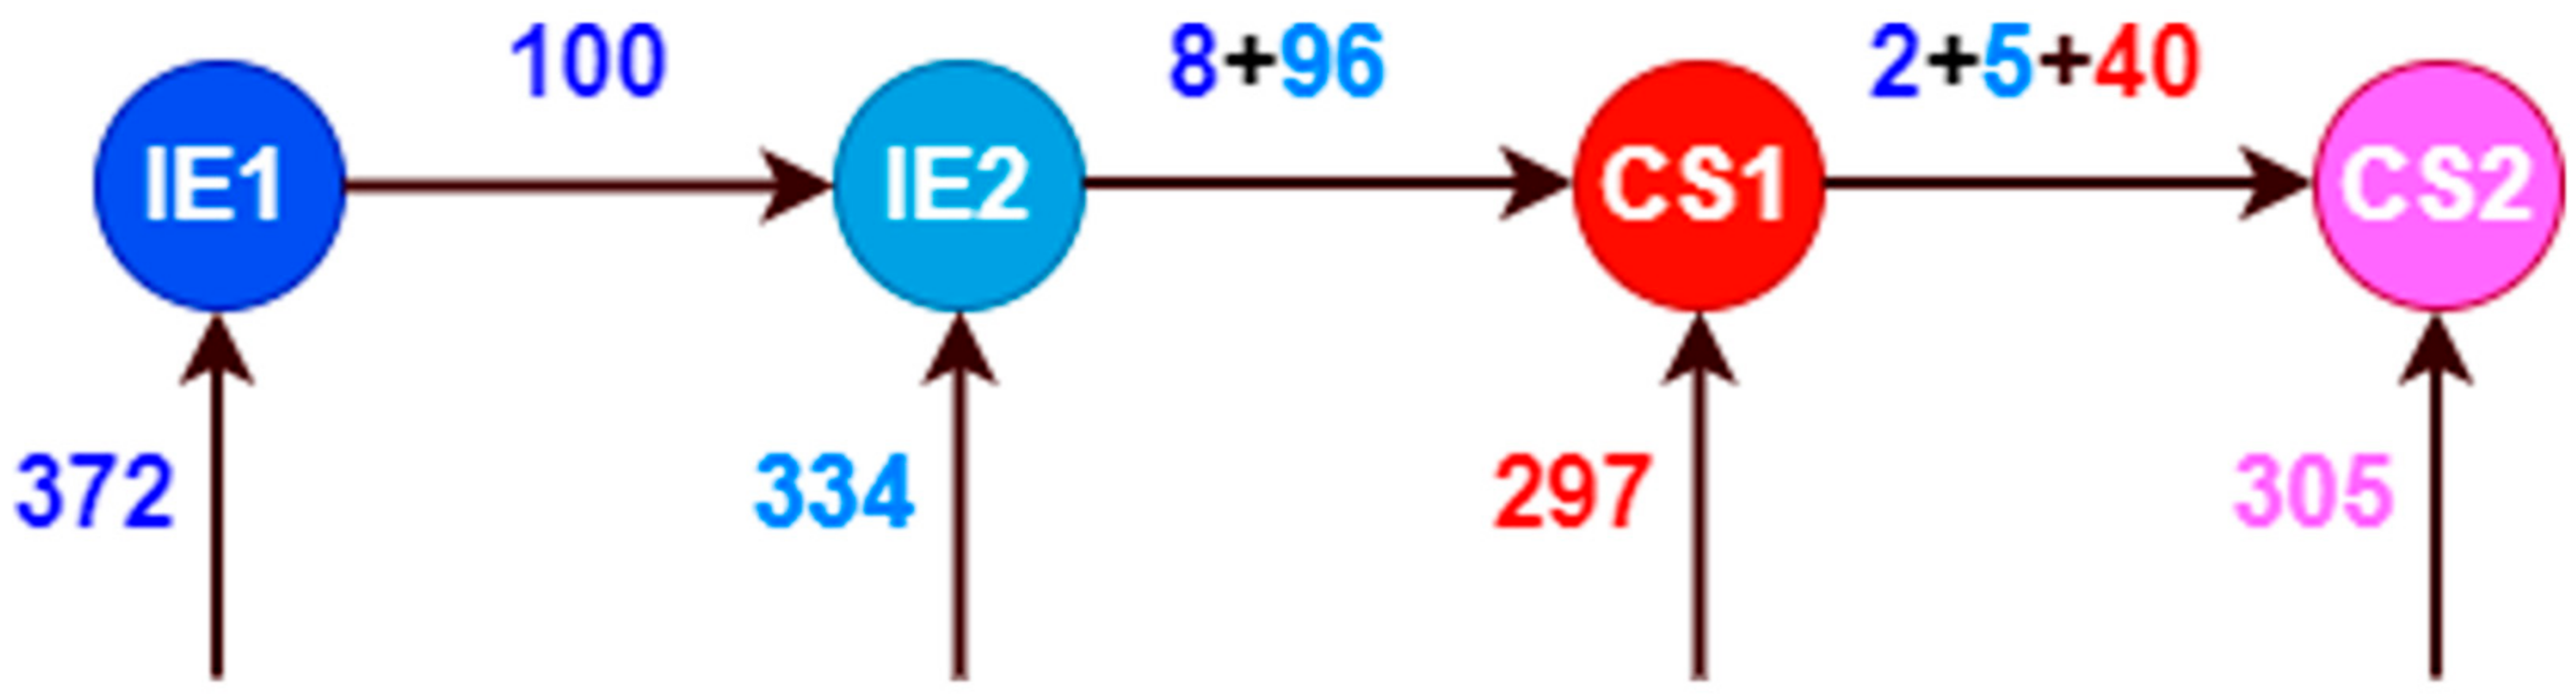
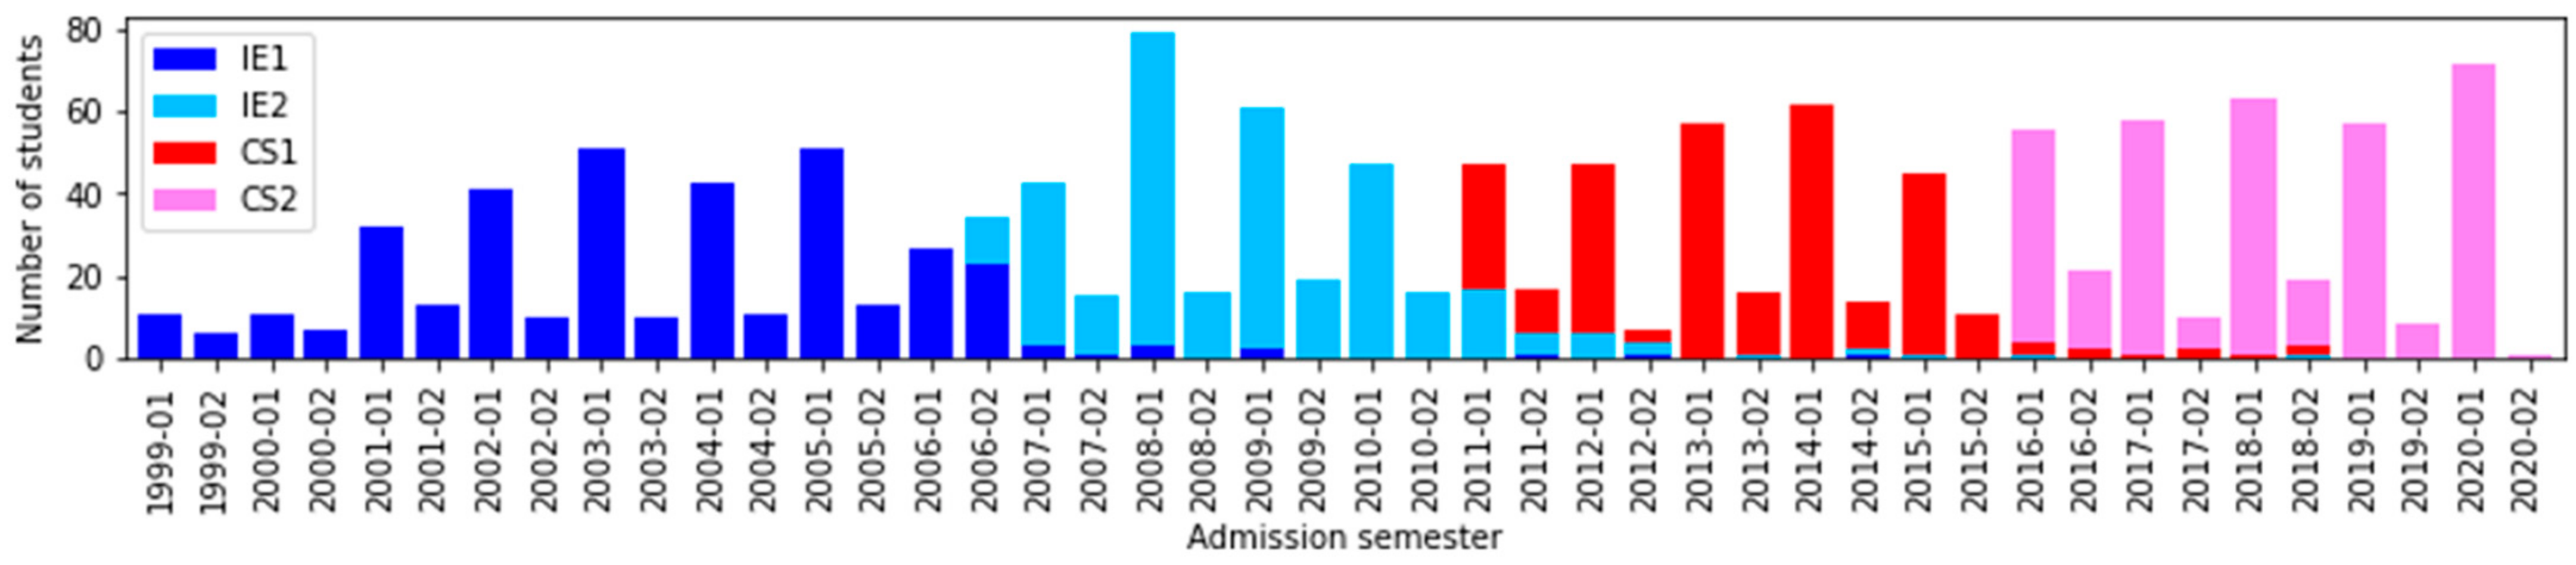
Our analysis seeks to understand the impact of curricular changes in our dataset. Over the years, the program of computer science employed four curriculum designs named IE1, IE2, CS1, and CS2 that started in 1999–01, 200–02, 2011–01, and 2016–01, respectively. In Figure 1, we represent student transition in the four curricular designs; we use an entry and exit scheme to provide an overview of these data using the attributes Initial_CD and Final_CD. It shows that 372 students started in IE1; however, 100 of them changed curricular design to IE2. We have detailed this information by each admission semester in Figure 2. One can observe students with different curricular designs in the same admission semester. This phenomenon occurs due students with a reserve starting their studies later with a previous curricular design. For instance, in 2006–02, we can notice 23 students of IE1 and 11 students, at that time, in the recently created IE2 (www.pe.undp.org, accessed on 23 February 2022).

Figure 1.
Scheme of student transition among curricular designs using Initial_CD and Final_CD.

Figure 2.
Number of students according to Admission_Sem and Initial_CD.
Additionally, Table 2 summarizes the distribution of students who changed curricular design or not. For example, of the 297 students who enrolled in CS1, we have 40 of them who changed CS1, which represents 13% of the total students enrolled in CS1. This value is approximately half the value obtained in IE2, whose percentage is 28.74%.
Table 2.
Distribution of students according to Initial_CD and Changed_CD.
Table 3 summarizes the number of students for each curricular design, grouped by Gender and Socioeconomic_Prov. For example, of the 372 students who started at IE1, 29.84% are women, while in the current curricular design (CS2), the proportion of female students decreased significantly, with 13.35% of female students.
Table 3.
Distribution of students grouped by Initial_CD, Gender, and Socioeconomic_Prov.
Most students come from a high level of Socioeconomic_Prov. We note that, of the 352 students enrolled in CS2, only 13 are students with low socioeconomic provenance. This value represents 3.7% of the total students enrolled in CS2. In addition, it seeks to understand the changes in curricular design. Visually, we illustrate in Figure 3 the distribution of students by Changed_CD. Of the 1355 students, we found that 236 changed their curricular design. We can see that the changes in curriculum design were less frequent after 2016–01.
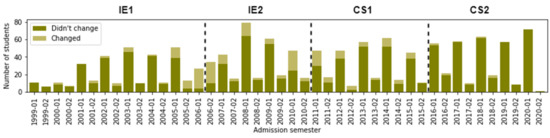
Figure 3.
Number of students according to Admission_Sem and Changed_CD.
6. Results
In this section, we describe the results of the research questions given in Section 4.
6.1. (RQ1) Did the Different Curricular Designs Have an Impact on Students’ Gender Proportion?
As mentioned in [12,13], the gender balance in the computer science field is still a problem today. It is common to have a lower proportion of female students than male students. This situation is also usual at UCSP. In Figure 4, we represent the number of students for each semester of admission and its distribution by gender. Visually, we can see that the proportion of female students (in dark green) decreased over time.
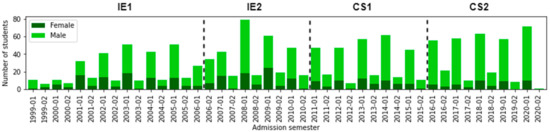
Figure 4.
Number of students according to Admission_Sem and Gender.
Considering the third and fourth columns of Table 3, we find the distribution of the students by gender. Therefore, when applying the Chi-square test to this data distribution, we obtain p < 0.001. This value shows a significant dependence between student gender and curricular design. Focusing our analysis on female students and observing the curricular design IE2 and CS1, we noticed it went from 27.25% (in IE2) to 18.18% (in CS1). This indicates a percentage reduction of 9.17%.
Even when comparing the first and last curricular designs, we observe that the percentage of women in CS2 (29.84%) is less than half that of women in IE1 (13.35%). Therefore, we conclude that the rate of female students decreased with the curricular changes. Based on the values of Table 4, we noticed in IE2 that 27.47% of female students changed their curricular design. The opposite case occurs in CS1 because only one female student changed curricular design, representing 1.85%. However, we can deduce that female students are resistant to changes in curricular design. Compared with male students, we can see that the rates of change in men are higher than that of women for each curricular design.
Table 4.
Distribution of students according to Initial_CD, Gender, and Changed_CD.
The decrease in the proportion of female students is possible because computer pro- grams were initially formulated as engineering programs, as detailed in Section 2. This phenomenon is not only evident in our case study. According to National Science Foundation statistics (https://www.nsf.gov/statistics/2017/nsf17310/digest/fod-women/computer-sciences.cfm) (accessed on 23 February 2022), the percentages of women in computer science programs for different levels decreased in EEUU. On the other hand, our analysis reports that female students are less likely to change their curricular design. For example, only one female student changed her curricular design in CS1. On the other hand, analyzing the Peruvian context, the term “Engineering” leads to the idea of having greater job possibilities than a scientific program.
6.2. (RQ2) Did the Different Curriculum Designs Impact the Proportion of Students According to Provenance Location Socioeconomic Level?
Socioeconomic variables represent an essential factor in explaining different effects in students that purely academic variables cannot. One way is to understand the influence of the provenance location and influence with each curriculum design. Initially, for addressing this research question, we summarize the number and percentages of students according to socioeconomic provenance, as shown in Table 3. Based on these values, we obtain p < 0.001 and conclude that there is a dependency between the provenance location socioeconomic level and the type of curricular design. We showed that the percentage of students of high socioeconomic provenance also decreased in each curricular design. The rates of students belonging to a high socioeconomic origin are 79.03%, 77.84%, 72.05%, and 66.19%. Currently, CS2 has 33.81% students whose provenance location socioeconomic level is medium and low.
In other words, the proportion of students from medium and low socioeconomic provenance has increased with each curricular design. Therefeore, curricular changes increased the admission of students with low and medium socioeconomic provenance.
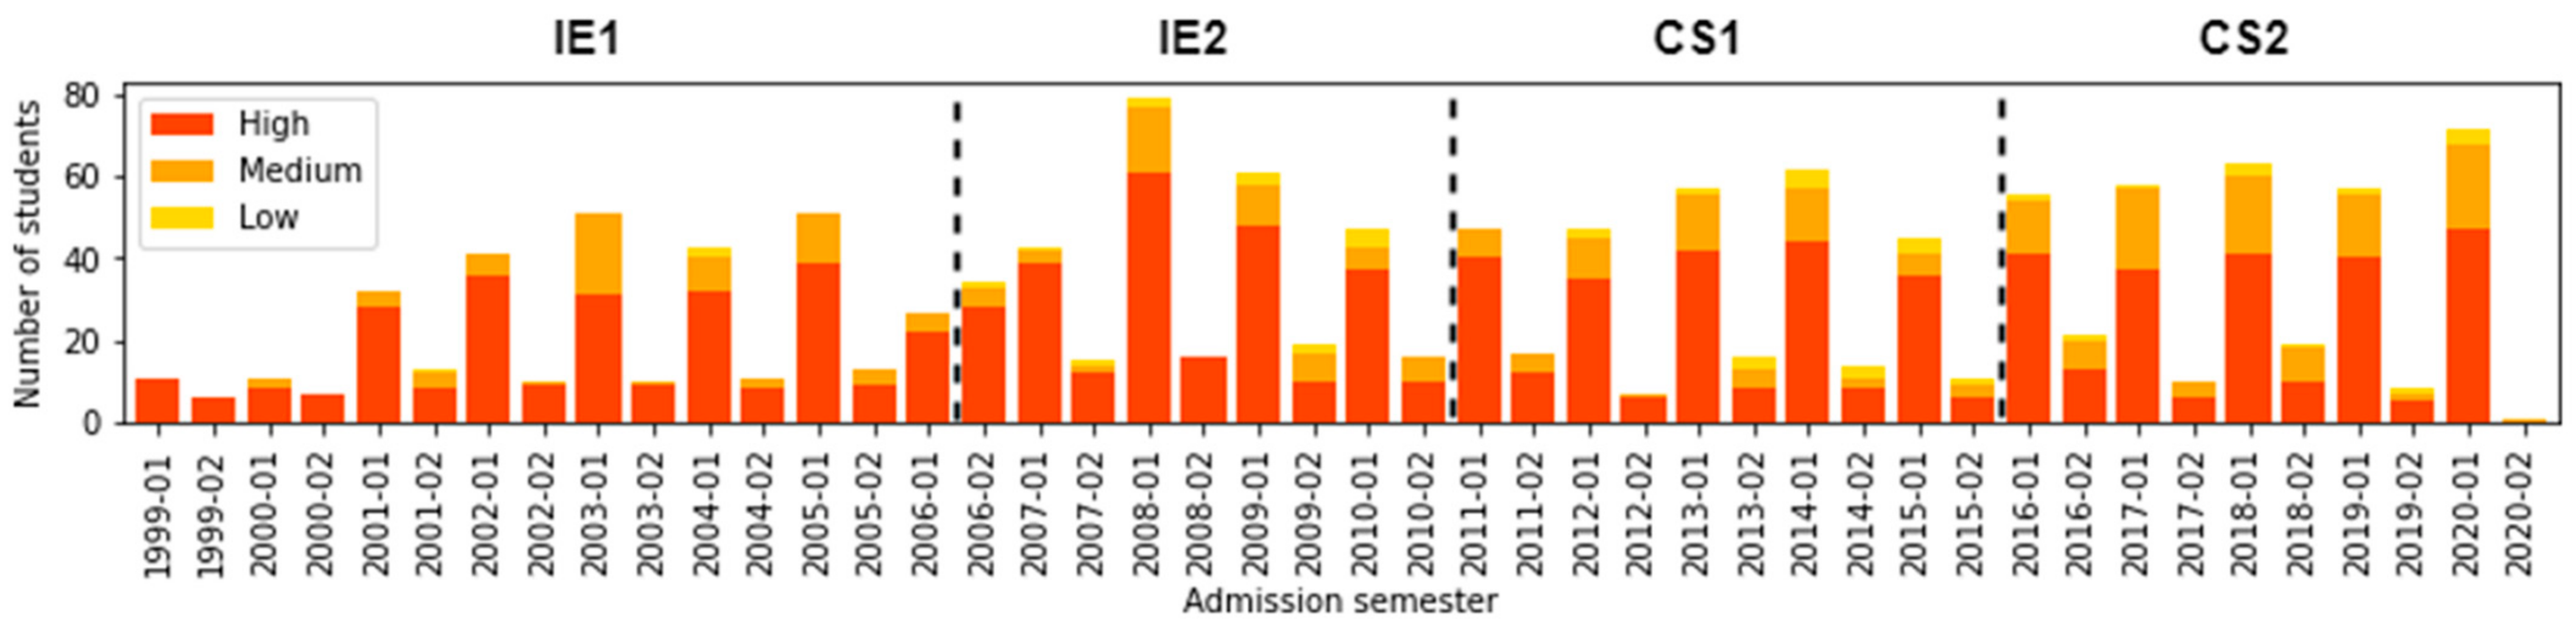
Furthermore, Figure 5 represents the number of students that start for each admission semester and its distribution according to their provenance location socioeconomic level. As can be seen, the proportion of students from medium and low provenance location socioeconomic level increased during CS1 and CS2, from 2016–02 to 2020–02. We confirmed the mentioned findings by interacting with the University Community Office, which is responsible for, among many other tasks, granting students scholarships and performing academic support. This affirms an increment in the number of scholarships to students with lower incomes and a continuous improvement in academic mentoring programs.

Figure 5.
Number of students according to Admission_Sem and Socioeconomic_Prov.
Table 5 summarizes the number and rates of curricular changes for each type of socioeconomic level. Therefore, we can conclude that most students who change their curricular design are of high socioeconomic provenance. The opposite case occurs with students where provenance location socioeconomic level is low. While the percentage of students who change their curricular design is lower in CS1, these results indicate that the provenance location socioeconomic level is decisive in relation to changes of curricular design.
Table 5.
Distribution of students according Initial_CD, Socioeconomic_Prov, and Changed_CD.
Analyzing the impact according to gender, we deduce that a possible cause that decreases the proportion of female students is that, initially, this program was named Informatics Engineering. In the Peruvian context, the term “Engineering” leads to the idea of having greater job possibilities than a scientific program. UCSP is the first Peruvian university to have a computer science program that uses recommendations of ACM Computing Curricula. This turned out to be attractive for people from different parts of Peru. Even a season when the UCSP decentralized its admission process by holding it in neighboring cities, the variety of students according to socioeconomic level location provenance increased. In addition, in recent years, support based on scholarships for outstanding students from low-income places has increased. (https://www.acm.org/education/curricula-recommendations) (accessed on 23 February 2022)
6.3. (RQ3) Did the Different Curriculum Designs Have an Impact on Students’ Dropout Rates?
Student dropout is a priority issue for any educational institution in the world [10,11]. It can be addressed in different contexts to understand the impact of dropout rates for each curricular design. Our dataset consists of 1355 students, of which 871 students dropped out. This value represents 64.28% of the total number of students enrolled. Furthermore, we observed that 252, 266, 220, and 133 students dropped out for IE1, IE2, CS1, and CS2, respectively. In percentage terms, these values correspond to 67.74%, 79.64%, 74.07%, and 37.78%. The highest dropout rate occurred in IE2. This rate was reduced by 5.57% in CS1, whose value is 74.07%.
Analyzing the dropout rate for each semester of admission, we note in Figure 6 the number of students and classify if they dropped out or not. Moreover, we noticed that the student dropout rate decreased in CS1 compared to IE2. Numerous students dropped out in CS1, which did not necessarily start in CS1 but came from previous curriculum designs such as IE1 and IE2. Even the lowest rate occurs in CS2 because this curricular design presents the most significant number of regular students.
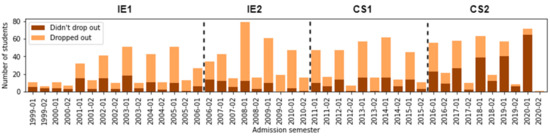
Figure 6.
Number of students according to Admission_Sem and Dropout.
Table 6 shows that the dropout percentages of students who did not change their curricular design are 69.05%, 73.31%, and 84.09% for IE1, IE2, and CS1, respectively. Furthermore, we observe that the change rate in curriculum design in CS1 is approximately half of the rate in IE2. We can conclude that most dropout students who did not change their curricular design were in CS1, while the students who did not drop out mostly remain in their curriculum design.
Table 6.
Distribution of students according to Initial_CD, Dropout, and Changed_CD.
This computer science program’s international standard-based curricular content is varied and challenging for students without sufficient preparation. We observe that many of the students drop out in the first semesters of university, reinforcing the idea described previously. In Section 6.5 and Section 6.6, we will explore other possible causes.
6.4. (RQ4) What Was the Impact of Gender and Provenance Location Socioeconomic Level on Student Dropout Rates?
We aim to determine if curriculum change’s impact was decisive in the subgroups of students according to the variables Gender and Socioeconomic_Prov. The numbers of dropout students and their respective percentages are displayed in Table 7. We can now analyze the impact of these variables with Dropout, as follows:
Table 7.
Distribution of dropout students according Initial_CD, Gender, and Socioeconomic_Prov.
- Dropout students according to Gender: Applying the Chi-square test, we obtain a value of p < 0.001, suggesting a dependence on curricular changes in dropout students grouped by gender. We note that there is not much difference between them. The most significant percentage difference occurs in IE1, i.e., the dropout rate for men was 71.26%, while the dropout rate for women was 61.26%. In CS1, both dropout rates coincide (70.4% for male and female students). So, in dropout students, the curricular design impacted the gender balance. We concluded that although the dropout rates are very high for both genders, we find a minor percentage difference in computer science (CS1 and CS2) than informatics engineering (IE1 and IE2).
- Dropout students according to Socioeconomic_Prov. We obtain a p < 0.001 and demonstrate dependence between these variables. In most cases, the higher the provenance location socioeconomic level, the lower the dropout rate. The opposite case occurs in CS2. This phenomenon may be due to several reasons. For instance, we highlight the recent improvement of economic support promoted by the Peruvian government—allowing low-income students to continue their studies thanks to financial aid. Based on this, we can say that poor performance in studies is not always the only reason for dropping out. It is a phenomenon that is much more complex. Analyzing the dropout rates in students of low socioeconomic origin shows that, in IE1 and IE2, all students dropped out, while in CS1, there is a slight improvement, with only 85% of them dropping out. Currently, in CS2, the dropout percentage is 23.08%, which presents better results than students from a better provenance location socioeconomic level.
Overall, we observe that the dropout percentages are similar in each subgroup. How- ever, in all cases, the dropout percentages in CS1 are lower than those found in IE2. So, a standardized curriculum has lower dropout rates.
6.5. (RQ5) Did the Different Curriculum Designs Have an Impact on Students’ Permanence Time?
We use survival analysis tools to address this question. As mentioned in [21], these techniques have a wide range of applications, such as health sciences, economy, and education. The main objective of the survival analysis is to monitor observations and estimate the time of occurrence of a particular event. In our case, the event to be monitored is Student Dropout. However, some of the events have not occurred for some instances. These cases are known as censored data. In this context, we consider censoring when student dropout does not happen (Dropout = No). In other words, when the variable Student_Status assume values as Regular, Graduated, and Reserved. Table 8 shows the distribution of non-dropout students for each curricular design.
Table 8.
Distribution of non-dropout students according to Initial_CD and Student_Status.
In IE1, we noticed that most of them have already graduated (98.34%), while two have not graduated yet (one is a regular student, and another has a reserved enrollment). On the other hand, we found a higher number of non-dropout students in CS1 (77 students) compared to IE2 (68 students). In contrast, the percentage of graduate students is higher in IE2 (86.76%) than in CS1 (58.44%). Finally, in CS2, the majority are regular students.
To measure the impact of curricular changes on student permanence times, we estimate the survival curves for each curricular design. Briefly, a survival curve is a graph obtained by evaluating the survival probability over time, whose definition is S(t) = Prob(T > t).
In general terms, the survival curve is a non-increasing function, and 1-S(t) defines the cumulative dropout probability curve at time t. In our analysis, we apply the Kaplan– Meier estimator to obtain these curves for each curricular design. In addition, we consider two different types of timescales as the number of completed semesters and then the number of enrolled semesters. In both cases, we estimate the survival curves by grouping them by:
- (a)
- Students who did not change their curricular design (Changed_CD = No).
- (b)
- Students who changed their curricular design (Changed_CD = Yes).
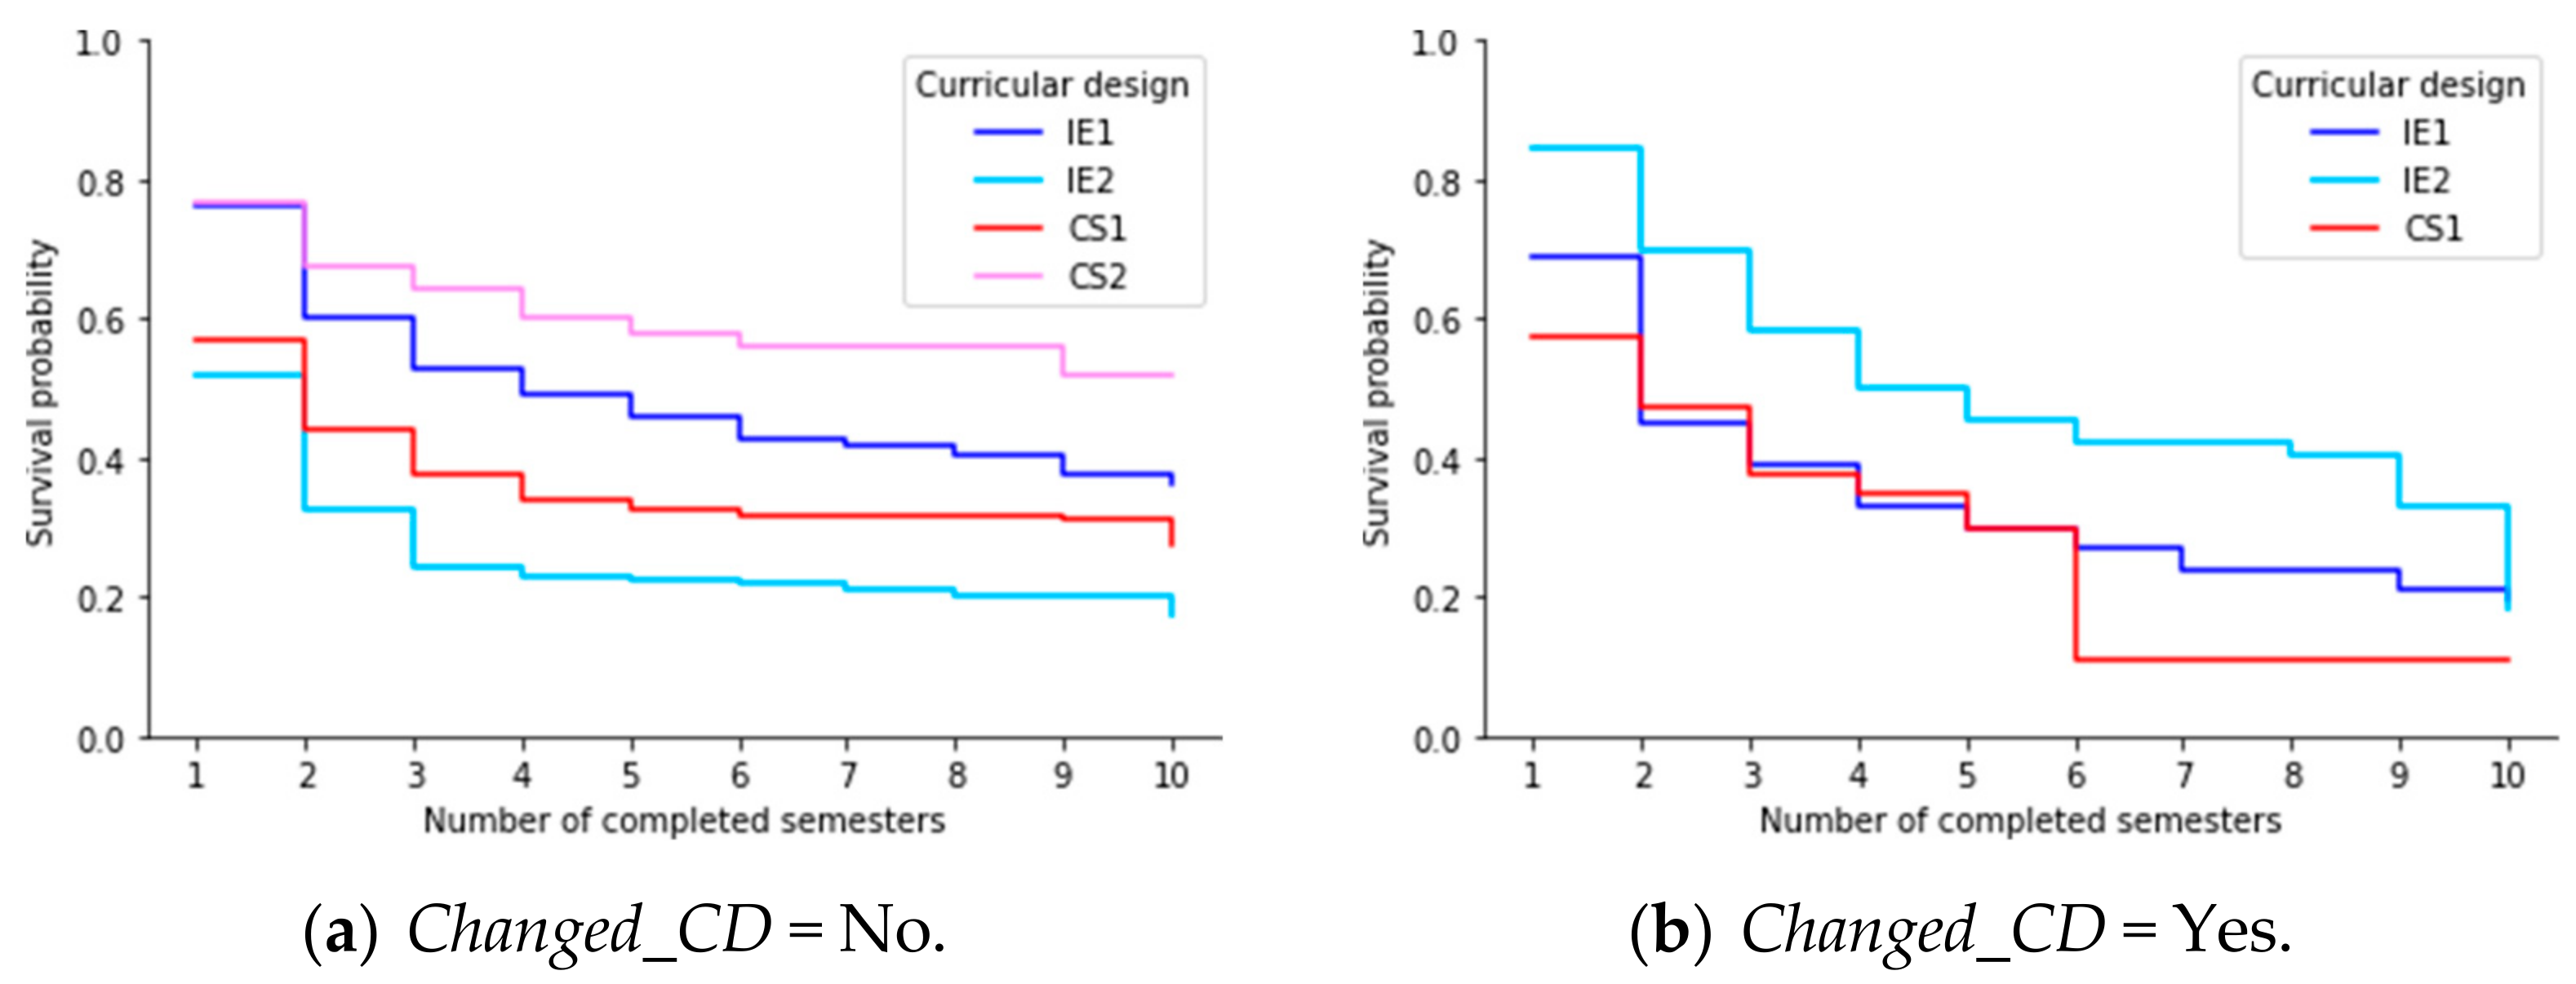
According to different studies that address survival models in education [22,23], it is usual to find that high dropout rates occurred during the first two semesters. Analyzing the timescale defined by Completed_Sem, see Figure 7. We estimate the survival curves for students who changed or did not change their curricular design. In Figure 7a, we noticed that the estimated survival probabilities up to the first two completed semesters are 0.60, 0.33, 0.44, and 0.68 for IE1, IE2, CS1, and CS2, respectively. We obtained the best result in CS2 and the worst in IE2. Even this situation extends to the entire time interval. However, this did not occur when analyzing students who changed their curricular design. As we can see in Figure 7b, the worst performance occurred in CS1.

Figure 7.
Estimated survival curves according to Completed_Sem and Changed_CD.
They even had very similar behaviors between the second and fifth completed semester, but after the sixth semester, the situation changed dramatically in CS1 (with survival probability equal to 0.11). We obtained similar results considering the number of semesters enrolled. This analysis differs from the previous one, where IE2 varies consider- ably from the other curriculum designs after the fifth enrolled semester.
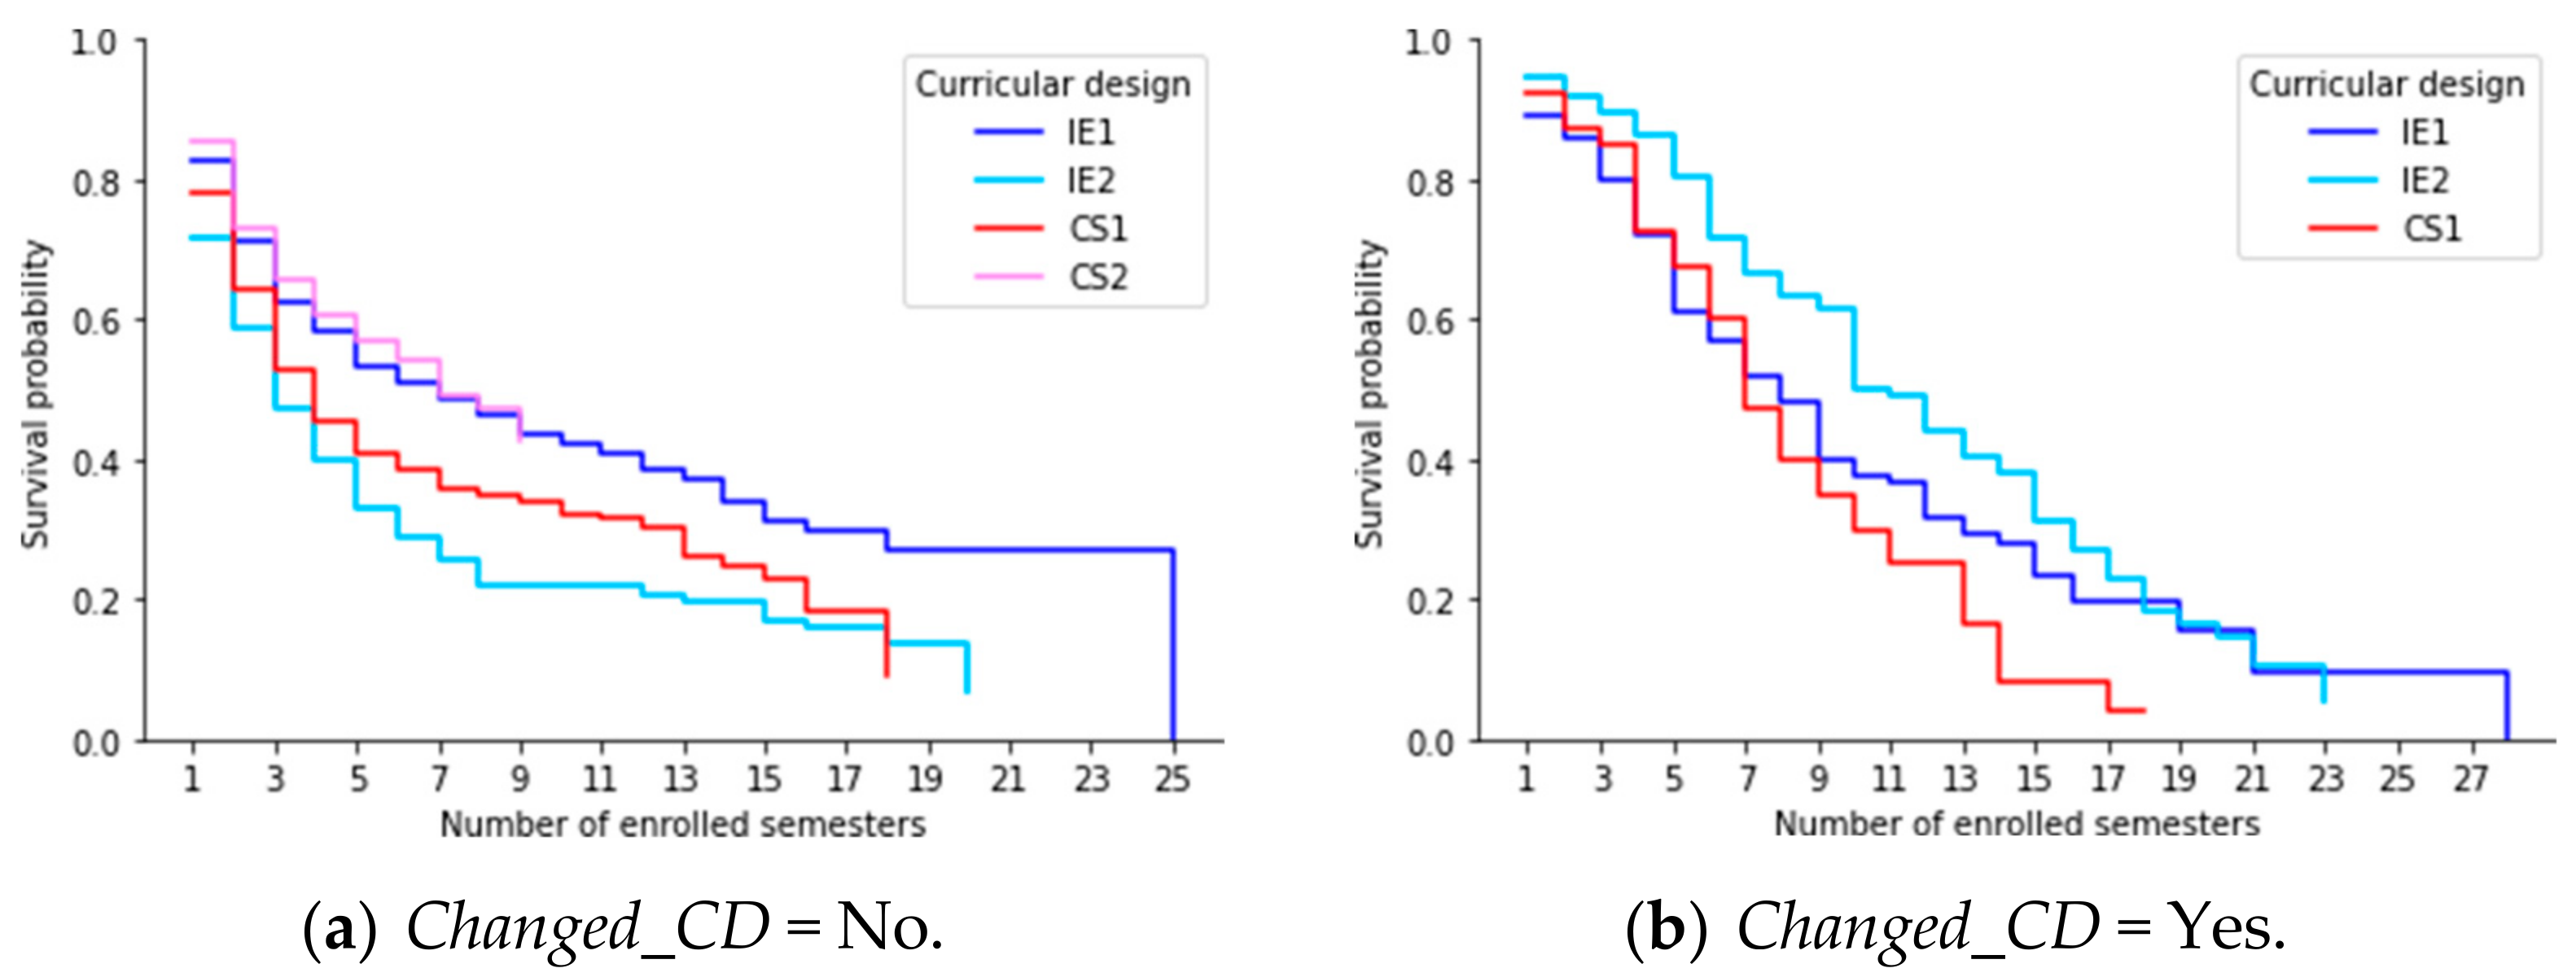
Generally, computer science students take more than ten semesters to complete their studies. These results show high student retention rates, which means that students use more time than expected. To better understand this context, we use Enrolled_Sem as a timescale and estimated the survival curves according to values of Changed_CD, see Figure 8. According to Figure 8a, students who changed IE2 present the best results. That is to say, the students in IE2 adapted better not only to the curricular change but to a type of computer program more organized according to the world trend [15]. Even this accentuated with the change from informatics engineering to computer science. Furthermore, Figure 8a shows that students who did not change their curricular design have students who stayed more than eighteen enrolled semesters. The most extreme case occurs in IE1 with twenty-five enrolled semesters. In contrast, in Figure 8b, we find a similar result: the maximum number of semesters enrolled in IE1. Therefore, students who changed their curricular design are more at risk of dropping out.
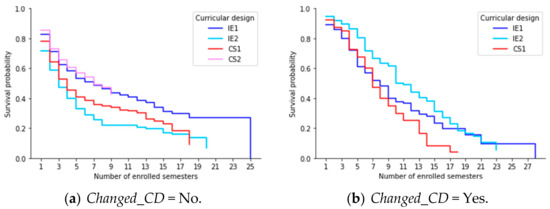
Figure 8.
Estimated survival curves according to Enrolled_Sem and Changed_CD.
Table 9 shows the average permanence time for each curricular design from values in both Figure 7 and Figure 8. In general, these averages are higher in students who did not change their curricular design (IE1 and CS1). However, we found the opposite case in IE2. The difference is even more remarkable when considering the number of enrolled semesters as a timescale. We even highlight that the average stay times improved in CS1 compared to IE2 in those students who did not change their curricular design. In the context of the number of completed semesters, this time increased from 3.9 (in IE2) to 5.3 (in CS1). A similar phenomenon occurred when analyzing the number of semesters enrolled, while these average times decreased when considering students who changed their curricular design.
Table 9.
Permanence time average according to Initial_CD, Completed_Sem, and Enrolled_Sem.
After analyzing the survival curves in the various scenarios, we can confirm that the most significant probability that a student has to drop out occurs in the first few semesters. Despite this, the impact of the change to ACM computing curricula was significant. In all scenarios, the probability of remaining in CS1 is more significant than remaining in CS2. We confirmed this by analyzing the average permanence times.
6.6. (RQ6) What Variables Are Most Decisive in Predicting the Permanence Time before Dropping Out?
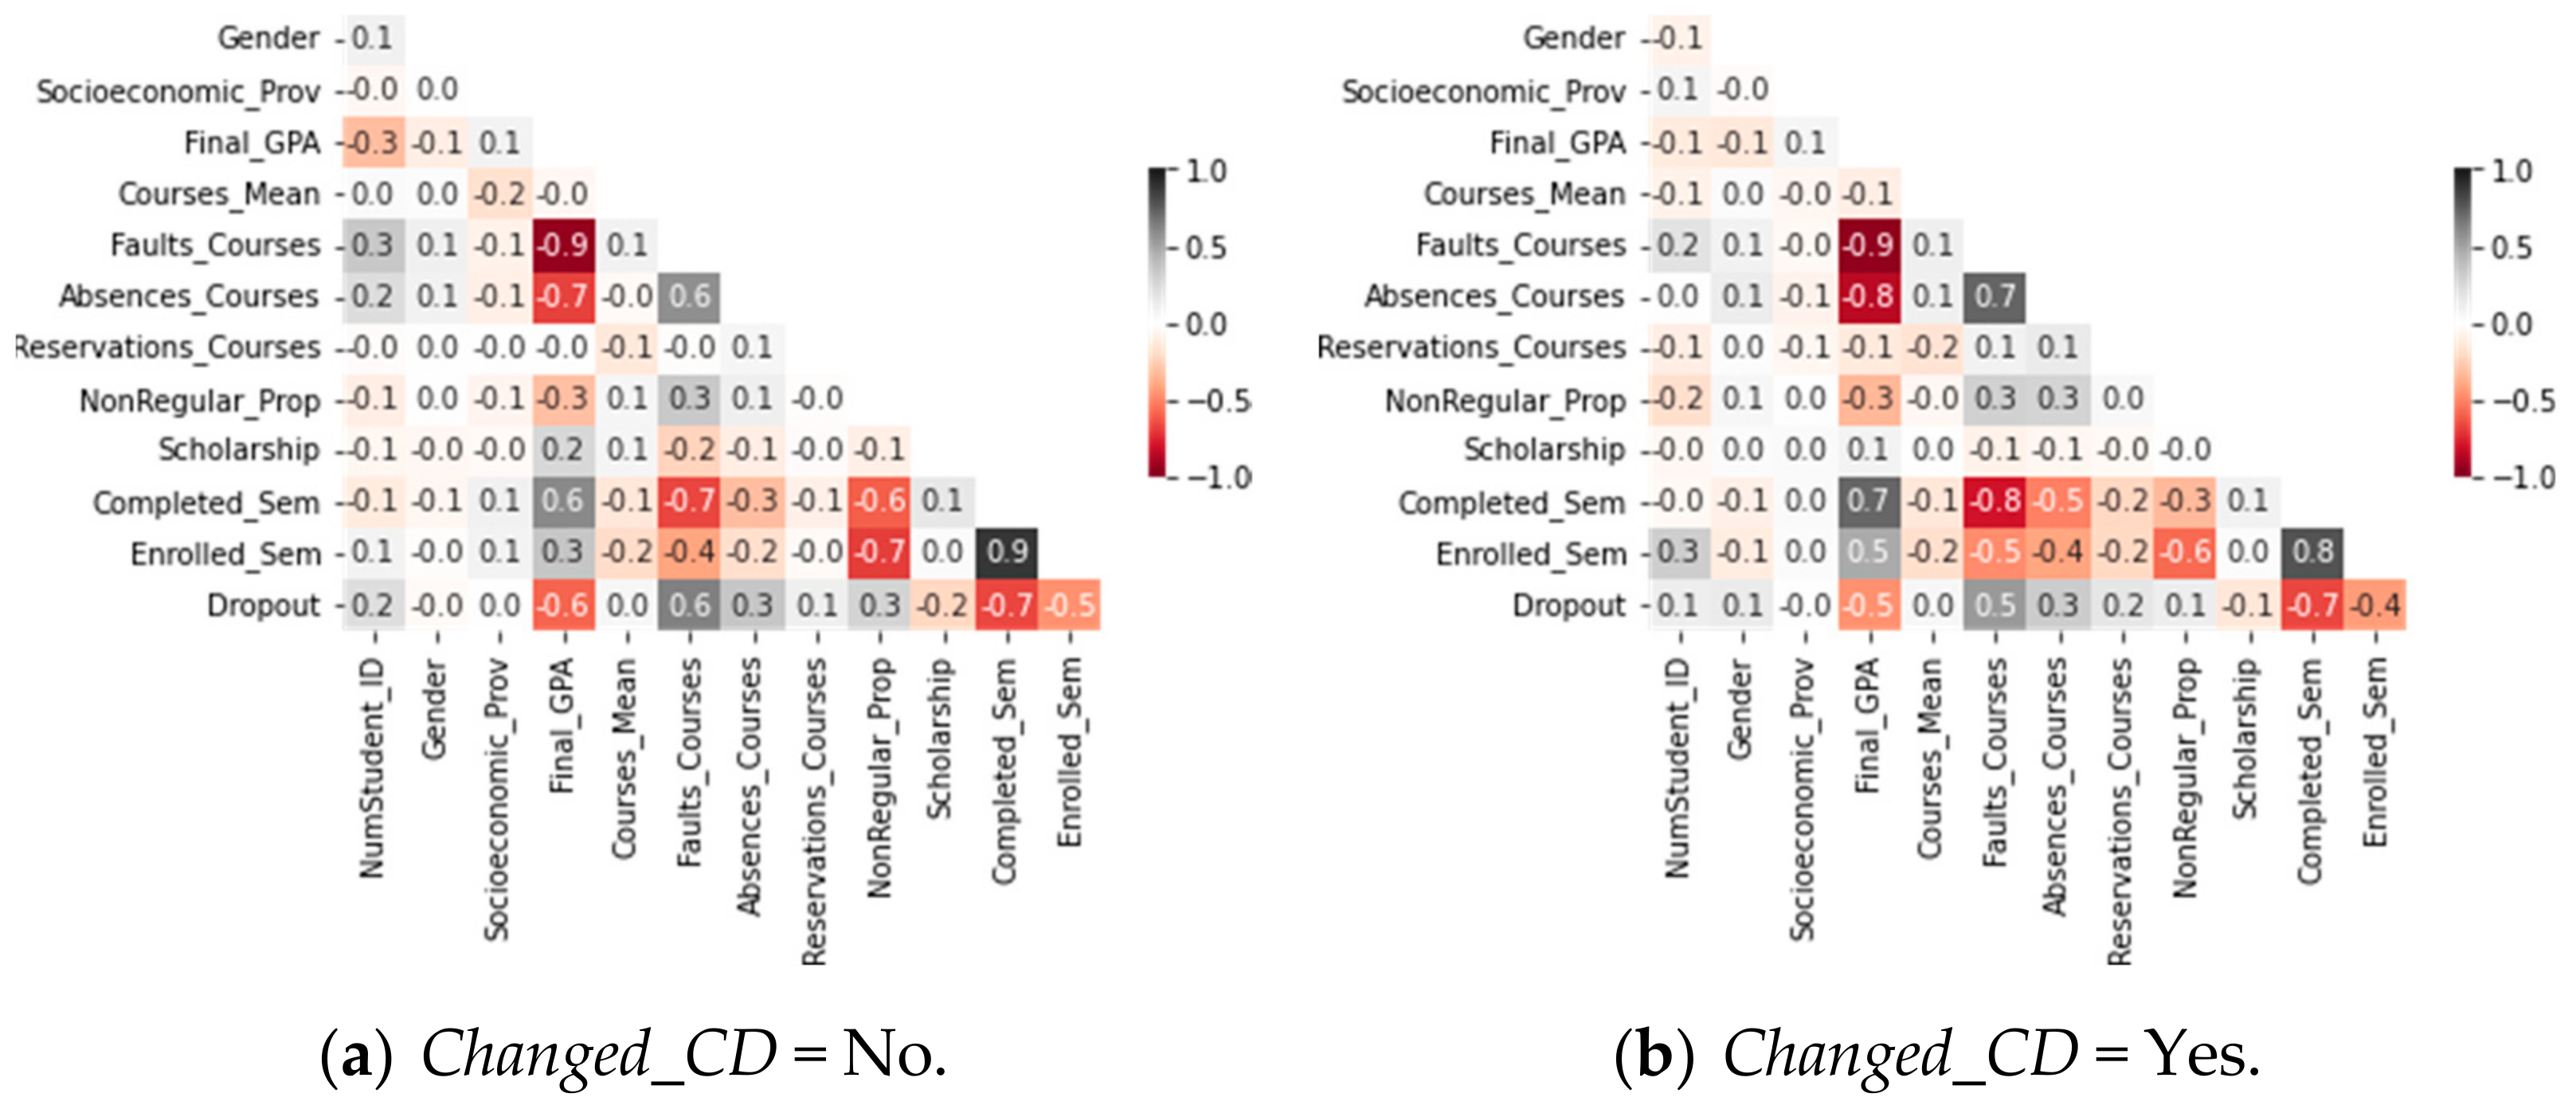
We focus our analysis on understanding which variables have the most significant predictive capacity in estimating the permanence time before dropping out. First, we perform a correlation analysis. Figure 9a shows the correlation matrices for students who did not change their curricular design. In the case of students who changed their curricular design, see Figure 9b.
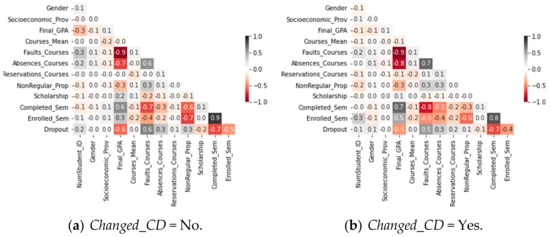
Figure 9.
Correlation matrices according to Changed_CD.
As is usual in various studies explored in the literature [5,6,7], academic variables are highly correlated with the dropout variable. Based on the correlation matrices, we note that if a student had better Final_GPA, the risk of dropping out decreased. The opposite occurs with Faults_Courses. Then, more failed courses implied that the risk of dropping out also increased. Even time-dependent variables such as Completed_Sem and Enrolled_Sem are highly correlated. From this, we can deduce that the longer a student stays at the university, the risk of dropping out will decrease. Therefore, we can deduce that time-dependent variables have a greater predictive capacity. So, to mitigate the impact of these variables, we must use other survival tools as the Cox regression model (or simply, Cox model). Considering the vector of predictor variables X = (X1, X2, …, Xn), we define the hazard function by:
where h0(t) is the baseline hazard. It corresponds to the value of the hazard if all the predictor variables are equal to zero. Once we fit the model, we assess how well it can predict survival time. Even our test data is usually subject to censoring. Therefore, metrics such as root mean squared error or correlation are unsuitable.
h(t) = h0 (t) exp(β1 X1 + β2 X2 +···+ βn Xn)
A generalization of the area under the receiver operating characteristic (ROC) commonly used in classification machine learning algorithms in survival models is Harrell’s concordance index (or simply, C-index). The interpretation is identical for binary classification, as follows:
- C-index of 0.5 denotes a random model;
- C-index of 1.0 denotes a perfect model;
- C-index of 0.0 denotes a perfectly wrong model.
Therefore, we fit a Cox model to each variable individually for each curricular design and record the C-index on the training set. Additionally, similar to our previous analyses, we calculated the C-index by each variable in the case of a change or not of curricular design at different timescales. Table 10 summarizes the results when considering the number of completed semesters and Table 11 when the timescale is the number of enrolled semesters.
Table 10.
C-index for each attribute according Changed_CD and Completed_Sem.
Table 11.
C-index for each attribute according Changed_CD and Enrolled_Sem.
Based on the results of Table 10, we highlight Final_GPA and Faults_Courses as vari- ables with the highest predictive capacity. In the case of students who did not change their curricular design, we found that the C-index increased with each curricular change. While Gender and Socioeconomic_Prov are variables with less predictive capacity (in relation to C-index). Therefore, we confirm that the dropout rates by subgroups of students are similar, as described in Section 6.4. In both cases, a particular case occurs with Scholarship.
In the first curricular designs, very few students had a scholarship, and for this reason, the C-index is close to 0.5. Additionally, the C-index of Courses_Mean was reduced with each curricular change and presented worse results when Changed_CD = Yes. Similar results were obtained with the variable NonRegular_Prop. Additionally, Absences_Courses is more accentuated in students who changed their Initial_CD.
However, we had different results when the timescale was Enrolled_Sem. Table 11 shows that NonRegular_Prop is the most predictive variable when consider students that did not change their Initial_CD. This result is interesting because there is a high retention rate in the university. That is, students take more time than expected to finish their university studies, and for this reason, they enroll in non-regular semesters to pass the previously failed courses. Even the failures for courses also stood out as one of the most predictive variables. However, NonRegular_Prop, Courses_Mean, and Absences_Courses are the most predictive variables when the student changed curriculum design. Furthermore, Gender and Socioeconomic_Prov have C-index values close to 0.5.
Because this computer science program is exigent for students without sufficient preparation, academic variables are decisive for the early identification of students at risk of dropping out.
7. Discussion
Does curricular change have an enormous impact on computer science programs around the world? Specifically, Latin America was impacted by a late standardization of such programs with international standards (as proposed by ACM and IEEE). However, we also observed that, due to the context, the “engineering” career motivates many young students to follow, essentially by the belief in a wide range of job opportunities, among other reasons, as detailed in Section 2. In UCSP, initially, the change from an engineering-based career to a science-based career provoked many dropouts. An important aspect is the inclusion of women and low-income students in computer science programs.
Along with time, it has been reduced, essentially by better communication and aware- ness to candidates and students—in early periods—of the undergraduate program. Our analysis seeks to answer the impact of curricular changes using the research questions defined in Section 4. In particular, Section 6.1 showed that curricular changes decreased in female students, and even women are less likely to change the curricular design. On the contrary, in Section 6.2, we note that the proportion of students whose provenance location socioeconomic level is low increased. We have shown that this variable is relevant for our analysis because, with a lower Socioeconomic_Prov, we obtained lower percentages when changing the curricular design.
One of the significant problems educational institutions face is dealing with high rates of student dropout. We detailed in Section 6.3 how dropout rates increased when moving from an engineering program to a program more in line with computer science. In addition, the percentage of dropout students who changed their curricular design decreased with these changes. Meanwhile, in Section 6.4, we focused on understanding dropout rates according to Gender and Socioeconomic_Prov. Based on these results, we note that the dropout rates are very similar between men and women in each curricular design. Although only slightly, these dropout rates increased when switching from an engineering program to a computer science program. In contrast, the dropout rates are not similar when analyzing students grouped by socioeconomic provenance. In other words, students from lower socioeconomic backgrounds are more vulnerable to dropping out.
We apply tools of survival analysis to estimate the length of stay before dropping out and which are the most influential variables to predict these times. We use two different timescales in both cases: the number of completed semesters and the number of enrolled semesters. Section 6.5 discovered that the average permanence time was higher in curriculum designs of computer science. However, this does not happen when we analyze students who changed their curricular design. In this particular case, the survival probabilities were lower in the computer science program than in the informatics engineering program.
Time-dependent variables have a higher predictive capacity, which we obtain by applying correlation analysis. Therefore, to mitigate the impact of these variables, we use the Cox model. According to Section 6.6, we can see that the Final_GPA and Faults_Courses were the most predictive (using the C-index) when the Completed_Sem is the time scale. However, these variables take a backseat when considering the variable Enrolled_Sem. When considering this timescale, the most predictive variable is NonRegular_Prop. Here it is important to note that, with this variable, we identified those students who follow non-regular semesters to make up failed courses or for those students with good academic performance who seek to finish their degree in a shorter time.
8. Conclusions
This work addressed a case study at a Peruvian university to understand the impact of curriculum changes in his computer science program, which previously was an informatics engineering program. According to international standards, the change in the name was provoked by reformulation and adaptation to a computer science program. Analyzing the impact according to gender, we can deduce that a possible cause of the decrease in the proportion of female students is that, initially, this career was called informatics engineering. In the Peruvian context, the term “Engineering” leads to the idea of having more job opportunities than a scientific program. Additionally, this computer science program is a pioneer in Peru that follows standardized computing curricula. For this reason, we conclude that this standardization was attractive to people from different parts of the country and increased the diversity of students from provenance cities with socioeconomic levels that were medium to low. However, this standardization made it challenging for students with insufficient preparation. Statistical tools reveal that the highest dropout rates occur in the first few semesters, being the determining academic factor for this to occur. Although many works address curricular changes in computer science, they do not focus on understanding the impact of curricular changes on the phenomena of inclusion and dropout of students as this work has addressed. It opens a wide range of different analytical/predictive studies in relevant aspects such as dropout prediction, inclusion analysis, and academic monitoring. Finally, our research can be replicated/adapted to any other program in computer science (or related fields) with the aim of revealing patterns, extracting valuable insights from its data, and supporting the decision-making process in educational institutions. However, the cleaning/wrangling data step can become complex, even for a person with deep knowledge of it. For this reason, the collaborative work with domain experts was decisive in reporting this case study.
Author Contributions
Conceptualization, D.A.G.-P., A.J.C.-V. and E.G.-N.; methodology, D.A.G.-P., G.G.-Z. and E.G.-N.; formal analysis, A.J.C.-V., G.C.-C. and J.P.; writing—original draft preparation, D.A.G.-P., G.G.-Z., A.J.C.-V., G.C.-C., J.P. and E.G.-N. All authors have read and agreed to the published version of the manuscript.
Funding
The authors acknowledge the financial support by Concytec Project—World Bank “Improvement and Expansion of Services of the National System of Science, Technology and Technological Innovation” 8682-PE, through its executing unit ProCiencia for the project “Data Science in Education: Analysis of large-scale data using computational methods to detect and prevent problems of violence and desertion in educational settings”. [Grant 028-2019-FONDECYT-BM-INC.INV].
Institutional Review Board Statement
Not applicable.
Informed Consent Statement
Informed consent was obtained from all subjects involved in the study.
Data Availability Statement
The data are not publicly available due to the terms of the consent forms signed that specifies that data will be kept confidential.
Acknowledgments
We would like to thank the reviewers for their constructive comments and suggestions.
Conflicts of Interest
The authors declare no conflict of interest.
References
- Fraser, S.P.; Bosanquet, A.M. The curriculum? That’s just a unit outline, isn’t it? Stud. High. Educ. 2006, 31, 269–284. [Google Scholar] [CrossRef]
- Biggs, J. What the student does: Teaching for enhanced learning. High. Educ. Res. Dev. 1999, 18, 57–75. [Google Scholar] [CrossRef] [Green Version]
- Vergel, J.; Quintero, G.A.; Isaza-Restrepo, A.; Ortiz-Fonseca, M.; Latorre-Santos, C.; Pardo-Oviedo, J.M. The influence of different curriculum designs on students’ dropout rate: A case study. Med. Educ. Online 2018, 23, 1432963. [Google Scholar] [CrossRef] [PubMed] [Green Version]
- Barbosa, A.; Santos, E.; Pordeus, J.P. A machine learning approach to identify and prioritize college students at risk of dropping out. In Proceedings of the SBIE 2017, Natal, Brazil, 30 October–2 November 2017; Volume 28, p. 1497. [Google Scholar]
- Rovira, S.; Puertas, E.; Igual, L. Data-driven system to predict academic grades and dropout. PLoS ONE 2017, 12, e0171207. [Google Scholar] [CrossRef] [PubMed] [Green Version]
- Palmer, S. Modelling engineering student academic performance using academic analytics. IJEE 2013, 29, 132–138. [Google Scholar]
- Gitinabard, N.; Khoshnevisan, F.; Lynch, C.F.; Wang, E.Y. Your actions or your associates? Predicting certification and dropout in MOOCs with behavioral and social features. arXiv 2018, arXiv:1809.00052. [Google Scholar]
- Aulck, L.; Aras, R.; Li, L.; L’Heureux, C.; Lu, P.; West, J. STEM-ming the Tide: Predicting STEM attrition using student transcript data. arXiv 2017, arXiv:1708.09344. [Google Scholar]
- Solís, M.; Moreira, T.; Gonzalez, R.; Fernandez, T.; Hernandez, M. Perspectives to predict dropout in university students with machine learning. In Proceedings of the 2018 IEEE—IWOBI, San Carlos, Costa Rica, 18–20 July 2018; IEEE: Piscatway, NJ, USA, 2018; pp. 1–6. [Google Scholar]
- Iputo, J.E.; Kwizera, E. Problem-based learning improves the academic performance of medical students in South Africa. Med. Educ. 2005, 39, 388–393. [Google Scholar] [CrossRef] [PubMed]
- Quintero, G.A.; Vergel, J.; Arredondo, M.; Ariza, M.C.; Gómez, P.; Pinzon-Barrios, A.M. Integrated medical curriculum: Advantages and disadvantages. J. Med. Educ. Curric. Dev. 2016, 3, 133–137. [Google Scholar] [CrossRef] [PubMed] [Green Version]
- Ioannis, B.; Maria, K. Gender and Student Course Preferences and Course Performance in Computer Science Departments: A Case Study. Educ. Inf. Technol. 2019, 24, 1269–1291. [Google Scholar] [CrossRef]
- Baer, A.; DeOrio, A. A Longitudinal View of Gender Balance in a Large Computer Science Program. In Proceedings of the 51st ACM Technical Symposium on Computer Science Education, Portland, OR, USA, 11–14 March 2020; Association for Computing Machinery: New York, NY, USA, 2020; pp. 23–29. [Google Scholar]
- Parker, M.C.; Solomon, A.; Pritchett, B.; Illingworth, D.A.; Marguilieux, L.E.; Guzdial, M. Socioeconomic Status and Computer Science Achievement: Spatial Ability as a Mediating Variable in a Novel Model of Understanding. In Proceedings of the 2018 ACM Conference on International Computing Education Research, Espoo, Finland, 13–15 August 2018; Association for Computing Machinery: New York, NY, USA, 2018; pp. 97–105. [Google Scholar]
- Force, C.T. Computing Curricula 2020: Paradigms for Global Computing Education; Association for Computing Machinery: New York, NY, USA, 2020. [Google Scholar]
- Savic, M.; Ivanovic, M.; Lukovic, I.; Delibasic, B.; Protic, J.; Jankovic, D. Students’ preferences in selection of computer science and informatics studies: A comprehensive empirical case studyStudents’ preferences in selection of computer science and informatics studies: A comprehensive empirical case study. Comput. Sci. Inf. Syst. 2021, 18, 251–283. [Google Scholar] [CrossRef]
- Ying, K.M.; Rodríguez, F.J.; Dibble, A.L.; Martin, A.C.; Boyer, K.E.; Thomas, S.V.; Gilbert, J.E. Confidence, Connection, and Comfort: Reports from an All-Women’s CS1 Class. In Proceedings of the 52nd ACM Technical Symposium on Computer Science Education, Virtual Event USA, 13–20 March 2021; Association for Computing Machinery: New York, NY, USA, 2021; pp. 699–705. [Google Scholar]
- Pappas, I.O.; Giannakos, M.N.; Jaccheri, L. Investigating Factors Influencing Students’ Intention to Dropout Computer Science Studies. In Proceedings of the 2016 ACM Conference on Innovation and Technology in Computer Science Education, Arequipa, Peru, 11–13 July 2016; Association for Computing Machinery: New York, NY, USA, 2016; pp. 198–203. [Google Scholar]
- Christoph, F.; Weimer, W.; Angstadt, K. The Early Bird Gets the Worm: Major Retention in CS3. In Proceedings of the 26th ACM Conference on Innovation and Technology in Computer Science Education V. 1, Virtual Event Germany, 26 June–1 July 2021; Association for Computing Machinery: New York, NY, USA, 2021; pp. 422–428. [Google Scholar]
- Mendez, G.; Ochoa, X.; Chiluiza, K.; de Wever, B. Curricular Design Analysis: A Data-Driven Perspective. J. Learn. Anal. 2014, 1, 84–119. [Google Scholar] [CrossRef] [Green Version]
- Wang, P.; Li, Y.; Reddy, C.K. Machine Learning for Survival Analysis: A Survey. ACM Comput. Surv. 2019, 51, 110. [Google Scholar] [CrossRef]
- Ameri, S.; Fard, M.J.; Chinnam, R.B.; Reddy, C.K. Survival Analysis Based Framework for Early Prediction of Student Dropouts. In Proceedings of the 25th ACM International on Conference on Information and Knowledge Management, Indianapolis, IN, USA, 24–28 October 2016; Association for Computing Machinery: New York, NY, USA, 2016; pp. 903–912. [Google Scholar]
- Gutierrez-Pachas, D.A.; Garcia-Zanabria, G.; Cuadros-Vargas, A.J.; Camara-Chavez, G.; Poco, J.; Gomez-Nieto, E. A comparative study of WHO and WHEN prediction approaches for early identification of university students at dropout risk. In Proceedings of the 2021 XLVII Latin American Computing Conference (CLEI), Cartago, Costa Rica, 25–29 October 2021; pp. 1–10. [Google Scholar]


Publisher’s Note: MDPI stays neutral with regard to jurisdictional claims in published maps and institutional affiliations. |
© 2022 by the authors. Licensee MDPI, Basel, Switzerland. This article is an open access article distributed under the terms and conditions of the Creative Commons Attribution (CC BY) license (https://creativecommons.org/licenses/by/4.0/).