Abstract
Currently, the number of job offers in STEM careers (Science, Technology, Engineering and Mathematics) is growing up, but by contrast, the number of graduates in these fields is decreasing, particularly women graduates. Consequently, if we do not promote the training of women in STEM careers, the gender gap, far from narrowing, will continue to widen. This paper presents the research carried out in the ALAS project (Accompanying girLs towArds STEM careers), which consists of an experimental analysis based on a multi-model study to discover the possible causes of this low participation of women in STEM fields. The models used are the (1) expectancy–value theory of motivation, (2) social role theory, and (3) gender stereotypes theory. Additionally, participatory workshops have been carried out, with the aim of capturing the students’ reactions when they are introduced to STEM practices. The surveyed target groups range from primary education groups up to university graduates and enterprise employees, including both students and teachers. The obtained results show that there are still social patterns that make young people differentiate certain types of activities based on gender, especially at secondary school age. Nevertheless, the findings reveal that beyond the three studied models, a key factor in young people’s decision to be enrolled in STEM careers is their educational environment.
1. Introduction
In the search for an education system adapted to the new digital age, the European Union (EU) has implemented the Digital Education Action Plan (2021–2027). This plan aims to enrich the quality and inclusiveness of Member States’ (MS) education and training systems, while adapting to the digital age and advancing the process of the digital and ecological transition [1]. Additionally, the European Education Area (EEA) for 2025 aims to remove barriers to learning and improve access to quality education for all [2,3].
In this context, according to data collected by Eurostat and shown in Figure 1 and Figure 2, in 2020, 57.30% of tertiary education graduates (post-secondary education) in the EU were women, while in Spain, the graduates of tertiary education were 57.14% women. This percentage remained stable over a six-year period for both Spain and the EU. In all fields of education, the percentage of female graduates was higher than male graduates in the period from 2014 to 2020 (according to the most recent published data series), except for the fields of Information and Communication Technology, and Engineering, Industry and Construction. The fields of Information and Communication Technology; Engineering, Industry and Construction; and Natural Sciences, Mathematics and Statistics are part of the Science, Technology, Engineering and Mathematics (STEM) disciplines. It is possible to see that in 2014, less than a quarter (17.93%) of graduates in the field of Information and Communication Technology in Europe were female, and this percentage has slightly increased up 20.79% as of 2020. In Spain, the percentage started at 14.63%, and far from increasing or keeping constant, it has decreased to 12.6%.
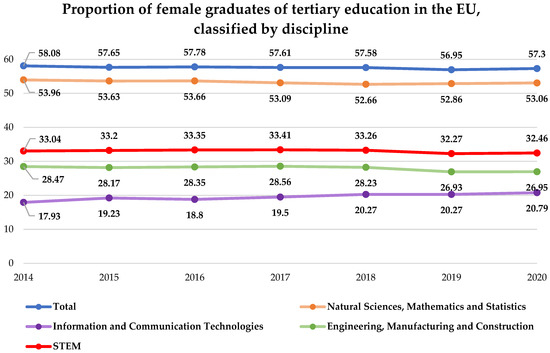
Figure 1.
Proportion of female graduates of tertiary education in the EU, classified by discipline. Source: Eurostat (STEM = Average [Information and Communication Technology; Natural Sciences, Mathematics and Statistics; Engineering, Manufacturing and Construction]).
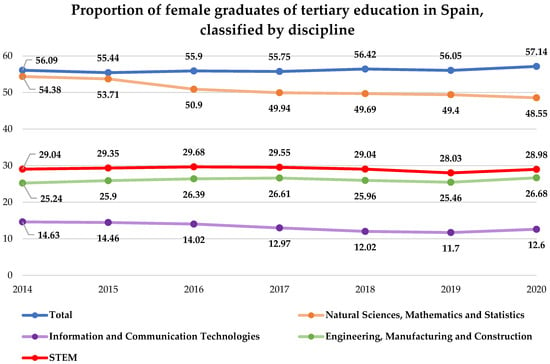
Figure 2.
Proportion of female graduates of tertiary education in Spain, classified by discipline. Source: Eurostat.
As we can observe from the collected data series, the low presence and participation of women in STEM careers is a transgenerational reality [4,5]. According to the data provided by the Spanish Ministry of Universities in its report for 2022 [6], 56.9% of Spanish students who presented to university entrance exams (in Spanish, referred to as PAU; Prove Access University) in 2020 were women. Of this percentage, 89.8% of women passed the tests. These percentages are slightly lower in the case of men, where 43.1% of students who presented to the PAUs were male, and 88.9% passed the tests. This gender balance is maintained in terms of enrolment; of the 1,340,632 students enrolled in university degrees, 56% are women. However, when these same data are analysed in the Engineering and Architecture branch, from all the students enrolled at university, only 233,365 (17.40%) are enrolled in Engineering and Architecture degrees. Of these 233,365 enrolments, only 59,974 (25.7%) are female enrolments. These data mean that from the total number of new enrolments in university degrees, only 4.47% are women enrolled in Engineering and Architecture.
Taking the University of Huelva (UHU) as an example, the number of new students in recent years in degrees with a greater affinity to the area of technology has been analysed (BEng Industrial and Electronic engineering, BEng Industrial and Mechanical engineering, and BEng Computer Science). As shown in Figure 3, in the BEng in Industrial and Electronic Engineering (green for men and blue for woman), the percentage of women enrolled (blue) in the degree shows an inverted “W” effect. The percentage of women enrolled is always below 15%. In the case of the BEng in Computer Science (orange and red), the evolution of female enrolment with respect to male enrolment is stagnant, without exceeding 9% (red). The 2013/2014 academic year started with a 16.2% enrolment rate, but in the 2022/2023 academic year, only 8.2% of students were women. The situation is more serious in the BEng in Industrial and Mechanical engineering (ochre and pink), which in the 2013/2014 academic year started with 9.1% of students being women (pink), while in the current 2022/2023 academic year, only 4.9% of students enrolled are women.
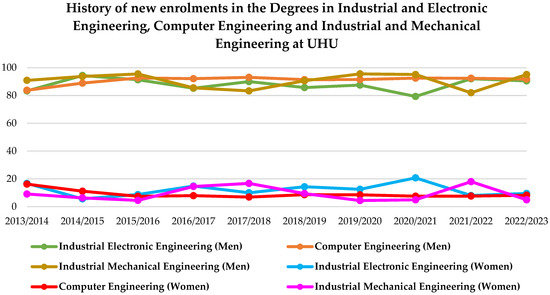
Figure 3.
History of new enrolments. BEng in Industrial and Electronic engineering, Computer Science and Industrial and Mechanical engineering. UHU. Source: https://www.uhu.es/unidad-calidad/informes-y-datos/perfil-del-alumnado-de-nuevo-ingreso (accessed on 12 March 2023).
However, on the other hand, STEM-related job offers have seen a 12% growth in the last decade. The demand for STEM professionals is growing at a higher rate than in other sectors [7]. According to the European Center for the Development of Professional Vocation (CEDEFOP), this growth will be 8% by 2025, compared to the average growth of 3% projected for all occupations [8]. Over the next decade, the increase in STEM-related occupations is expected to rise to 10.8% [9]. STEM-related professions are in the top 20 in the EU, as shown in Table 1. However, companies find it difficult to engage and hire qualified personnel in these areas. Nowadays, people who aspire to job offers are required to have both hard (technical knowledge) and soft (knowledge linked to leadership and social relations) skills. This demand is not covered in many cases, due to a lack of applicants for these professions who have the necessary skills to be able to develop professionally in an increasingly competitive environment [10,11,12,13].

Table 1.
STEM occupations among the top 20 bottleneck vacancies at European level.
In this sense, the 59% of participants in the study carried out in [14] point to three main reasons that explain these difficulties:
- There is a graduate shortage due to negative perceptions of STEM professions;
- Major technological advances mean that degrees have to adapt to these changes;
- There is a common perception that most STEM professions are not gender-neutral.
In conclusion, the low percentage of women graduates in STEM-related fields combined with the increase in job vacancies that will occur in these professions in the coming years will not contribute to reducing the gender gap in these professions; on the contrary, this gap may widen.
Trying to reverse this situation, the European Union is taking measures to engage women in the STEM field. In 2015, the United Nations General Assembly (UNGA) declared 11 February as the International Day of Women and Girls in Science, as part of the effort to achieve full and equal participation of women and girls in science. There are also other resources such as the European Platform of Women Scientists (EPWS) [15], wherein more than 100 networks of women scientists and organisations from all over Europe promote equal opportunities in research fields across all scientific disciplines. GENERA (the Gender Equality Network in the European Research Area) is a Horizon 2020 project aiming to continue, monitor and improve the gender equality plans of research institutions and organisations.
Based on the scientific literature, the following works, which are focused on analysing the gender gap in STEM careers, deserve special attention. The study by McDaniel [16] examines how gender equality culture influences adolescents’ choice of career when they begin to plan their future. The study was conducted on a group of 15-year-olds from 24 different countries. The author recognised that it is unknown how gender stratification or cultural ideologies impact the development of boys’ and girls’ STEM career expectations.
More recently, new scientific works also related to the STEM gender gap concern have been brought up for discussion. The proposal made by García-Holgado et al. [17] analyses a number of Latin American and European universities in order to define gender equality action plans to enrol, retain and orient women in STEM programmes. Dulce-Salcedo et al. [18] conducted a study to test whether the presence of female STEM teachers in secondary education positively influences the enrolment of more women in STEM in tertiary education.
Apart from the cultural factor mentioned in [16,17], and the expectative factor studied in [18], Jiang observes in [19] that men’s ability-sorting behaviour is statistically stronger than women’s when choosing a degree. The author defends that gender differences in ability and ability sorting explain a portion of the gender gap in STEM careers. These gender stereotypes were also investigated by Kumar et al. [20] with children aged 4–6 years. The authors assessed the perceptions of children when they viewed one of four groups of scientists: all-male, all-female, a lone female among all males, or a lone male among all females.
Finally, the gender gap was monitored from adolescence to adult age by Gaweł and Krstić in [21]. This study quantifies the impact of the gender gap at different levels of education (youth, higher education, adult learning and STEM education) in EU countries. The authors observed that in countries with a relatively lower level of female entrepreneurship and education outcomes, the gender gap in entrepreneurship is affected most significantly by gender gaps in early leavers, higher education and STEM education.
Based on all of the above, the starting hypothesis of this work is that the gender gap in STEM careers cannot be explained by one single psychological model, and that the reasons for the low presence of women in STEM careers are not only psychological or cultural, but also due to the educational environment.
The objective of this paper is to analyse the possible causes and effects of the low presence of women in STEM-related fields. To carry out the study, an evaluation of young people in five different stages of their lives, from childhood to adult life, is carried out. For this purpose, a multi-model study is applied, based on the (1) expectancy–value theory of motivation, (2) social role theory, and (3) gender stereotypes theory, to examine the reasons for the low presence of women in STEM-related careers in the EU.
Additionally, the study includes visits to educational centres wherein different participatory workshops are carried out with students from both primary and secondary schools. Table 2 shows the main contribution of authors’ proposal, taking into account the aforementioned related works. Table 2 is divided into five items, where the first item is “Scope” and serves to evaluate where the study has been conducted (nationally, internationally or both). The second item, “Target group” refers to the group on which the research is conducted in order to evaluate the gender gap in the STEM field, such as students, graduates, teachers and entrepreneurs. The third item, “academic year” is oriented to students in order to classify them by age. The fourth item, “Survey analysis tool” is used to evaluate the questionnaires/tools used to determine the possible causes of the gender gap. Finally, the last item, “Activities” refers to whether any type of participatory workshop is carried out in the study to bring STEM activities closer to the surveyed target groups.
Table 2.
Authors’ contribution regarding scientific related works.
The novelty of the authors’ proposal is constituted as follows.
- Interregional and international scope: the study is carried out in different regions of Spain (Huelva, Cadiz, and Badajoz), and in three European countries (Italy, Austria and the Czech Republic).
- Target groups: the sample analysed is made up of young people at five different moments of the life cycle, all linked to the transition to adult life (primary education, secondary education, higher education and the early stages of their entry into the labour market), with the aim of identifying the reasons for the low presence of women in STEM environments.
- Academic year: the study includes the entire education system, from primary education to university education.
- Survey analysis tool: the surveys are based on a multi-model theoretical foundation applying three theories: the expectancy–value theory of motivation, the social role theory and the gender stereotypes theory.
- Activities: participatory workshops led by women specialists in STEM fields. These workshops are given in primary and secondary education settings, and the workshops are adapted to the educational level at which they are given.
2. Materials and Methods
2.1. ALAS Approach: Foundation and Methodology
In order to find an explanation for the low participation of women in STEM-related studies, ALAS research (Accompanying girLs towArds STEM careers) developed a study to analyse the possible causes and effects. To carry out the study, an evaluation of people in five different stages of their lives, from childhood to adult life (primary education, secondary education, university students, university graduates and enterprise/industry professionals), is carried out, as shown in Figure 4.
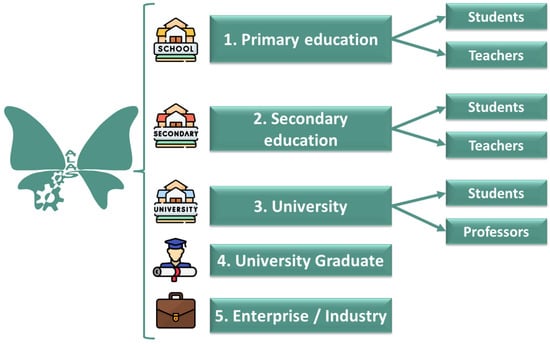
Figure 4.
ALAS research. Five different stages from childhood to adult life.
The research group has extended the study outside Spain to identify whether the gender gap in STEM careers is a national or international problem, and, secondly, whether the causes of this gender gap are similar across countries. The study has been carried out in different regions of Spain (Huelva, Cádiz, and Badajoz), and three EU countries: Italy (Rome), the Czech Republic (Prague) and Austria (Vienna). Figure 5 shows a map of the educational centres visited.
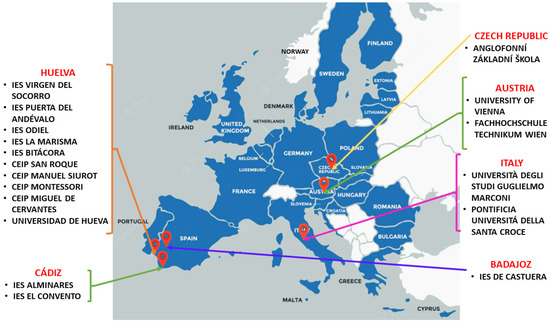
Figure 5.
ALAS geography. Sites visited during the project execution.
2.1.1. Methodology and Surveys
In order to carry out the study on the five different life stages mentioned above, a series of surveys based on the theoretical models, shown in Figure 6, were distributed. The surveys are anonymous; only gender, age and educational centre information was received. As Figure 6 shows, the surveys are based on a multi-model theoretical foundation in order to identify causes, make decisions and alleviate the current very low participation of women in STEM careers. The multi-model study involves
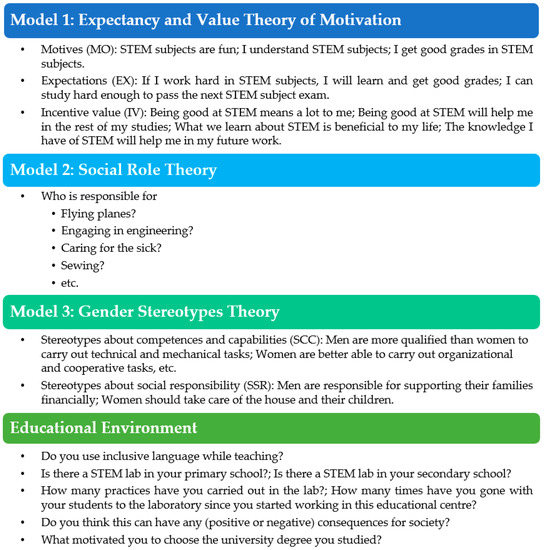
Figure 6.
ALAS methodology: the multi-model basis used in the research.
- The expectancy–value theory of motivation [22,23,24,25,26]: this model has been used to explain the vocational segregation of women and their under-representation in technology-related studies. The model proposes that the manifestation of a behaviour is the result of a multiplication of three components: the need for achievement (motives, MO), the probability of success (expectations, EX), and the incentive value (IV) of the task. People only enrol in studies that they believe they can succeed in because they have the skills and/or competencies to pursue them (expectations for success), and because they perceive them to have a high value (subjective task value).
- To measure these variables, in primary education, the response options were “Yes” and “No”, to ensure the subjects’ understanding and the reliability of their answers. At higher levels (secondary, university and graduates), the responses used consisted of a 5-point Likert scale, ranging from 1 (strongly disagree) to 5 (strongly agree).
- Social role theory [27,28,29]: this model aims to highlight the sources of prejudice towards women in leadership positions. The goal of this model is to obtain information on participants’ beliefs about the tasks and activities they consider to be the domain of men, women or both. Socially, there is an incongruence between a woman’s traditional work role and a leadership position. This means that many women do not obtain leadership positions, or do not stay in them for long. Traditionally, women have had roles attributed to them that relate to care and emotions, while men have had roles attributed to them that relate to achievement, assertiveness and power.
- Gender stereotypes theory [30,31,32,33]: this model explains that gender stereotypes have a multicomponent structure linked to personality traits, role-related behaviours and professions. This means that the closer the match between a person’s self-image and the prototypical image of someone working in a particular field, the more likely that person is to choose that profession. When applied to women, this means that they find few similarities between themselves and the prototypical image of a person working in the STEM field. The main cause of this problem is the lack of female role models in the scientific and technological fields, which does not encourage women to opt for these fields. For this purpose, the construct is made up of two components: stereotypes about competences and capabilities (SCC), and stereotypes about social responsibility (SSR).
- To measure these variables, in primary education, the response options were “Yes” and “No”, to ensure the subjects’ understanding and the reliability of their answers. At higher levels (secondary, university and graduates), the responses used consisted of a 5-point Likert scale, ranging from 1 (strongly disagree) to 5 (strongly agree).
- The educational environment [34]: To identify possible structural problems and how the educational environment influences the selection of academic curricula from primary school to university, additional questions have been included in the surveys; these questions concern the number of laboratories in a given centre, the number of laboratory practices carried out, the use of inclusive language, etc.
These theories are applied to the surveys as shown in Figure 6. Each theory is applied to one construct, and each construct is made up of a series of questions. In this sense, references [22,23,24,25,26] have been consulted to formulate the questions in the surveys to analyse the expectancy–value theory of motivation. The questions in the surveys related to social role theory have been obtained from [27,28,29], and the questions that allow us to evaluate the gender stereotypes theory were obtained from [30,31,32,33]. Finally, the authors used [34] as a basis to elaborate upon constructs related to educational environment.
2.1.2. Materials and Participatory Workshops
In addition to distributing surveys, in primary and secondary educational centres, participatory workshops have been carried out. The aim of these participatory workshops is to introduce students to STEM careers by means of technological and scientific laboratory practices. The complexity of these participatory workshops is adapted to the age of the students. According to the gender stereotypes theory explained above, stereotypes have an effect on students’ choice of a profession. For this reason, in order to engage girls in STEM, female STEM leaders were made responsible for running the workshops. The participatory workshops were driven by female students from the University of Huelva (Industrial Chemical Engineers and Industrial Electronics Engineers). Figure 7 shows the women Industrial Chemical Engineers teaching chemistry practice. In this workshop, they made slime and hydroalcoholic gel.
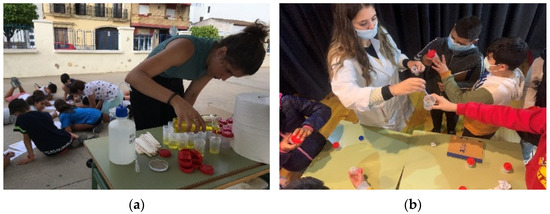
Figure 7.
Chemical participatory workshop: (a) making slime; (b) making hydroalcoholic gel.
Figure 8 shows how the women Electronics Engineers led a hydrogen and renewable energy-based participatory workshop and another participatory workshop about an Arduino microcontroller.
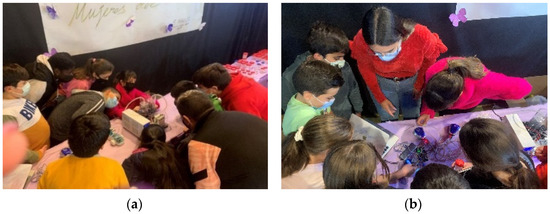
Figure 8.
Renewable energy-based and Industrial and Electronic participatory workshops: (a) hydrogen and renewable energies; (b) Arduino microcontroller.
2.2. Inferential Statistics, and Reliability and Consistency Tests
The information obtained was organised in four databases, one for each educational level. The analyses were carried out in SPSS-21.
Firstly, the validity of the constructs, (Model 1) the expectancy–value theory of motivation (variables: motives, MO, expectations, EX and incentive value, VI), (Model 2) social role theory (SR), and (Model 3) gender stereotypes theory (variables: stereotypes about competences and capabilities, SCC, and stereotypes about social responsibility, SSR), was verified by analysing the convergent and discriminant validity indicators of the quantitative variables. A unidimensional analysis showed that the value of the first component for all constructs was greater than 1. To measure convergent and discriminant validity, other indicators were used, such as the average variance extracted (AVE) and the square root of variance. The AVE of the constructs was above the threshold of 0.53 (except for the MO and VI constructs of primary education, which were 0.50 and 0.48, respectively), and the internal consistency criteria were met for most of the constructs. Further details of these scales, including the factor loadings for each item, Cronbach’s alpha, AVE and discriminant validity analysis, are provided in Appendix A.
Secondly, in order to obtain information about each construct according to gender and educational stage, a frequency analysis was carried out, as shown in Appendix B. The frequency tables show the number and percentage of cases of each observed value for the variables.
Thirdly, to determine the independence between the sex variable and the rest of the variables, the chi-square coefficient (χ2) was calculated for each educational level. In this analysis, the sex variable acts as an independent variable, and the rest as dependent variables. The objective of this test is to contrast the dependency relationship by means of the significance level; if the significance value is greater than or equal to alpha (0.05), it is determined that there is no dependency. If the significance value is less, dependency is accepted. Further details of this analysis are provided in Appendix C.
3. Results
The results are classified by target group and by construct. In this way, it will be easier to identify where and when the neutrality that early ages students have towards STEM careers is blurred, and when the gap between the number of male students and the number of female students who prefer STEM careers becomes significant.
Firstly, in relation to the impact of the study, Figure 9 shows the target number (in blue) and the achieved number (in orange with labels) of participants finally enrolled in the research.
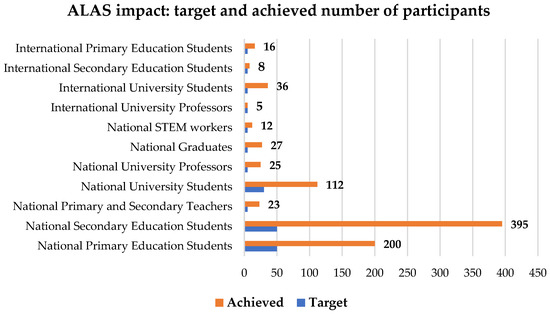
Figure 9.
Quantitative impact indicator using the target groups and real scope.
Based on above, the initial objective was to achieve at least 150 participants; in the end, the research involved a total of 858 participants (472% more than expected). In all cases, the surveys were anonymous; only gender, age and educational centre statistics were received.
3.1. Primary Education Students
The results obtained in the variables MO, EX and VI, of the (Model 1) expectancy–value theory of motivation, do not show significant differences between the sexes. The percentages of girls’ and boys’ responses to the different items were similar (Figure 10). In the same way, it is highlighted that there is no dependency between these variables and the sex variable, since all the values of χ2 were greater than 0.05 (Appendix C).
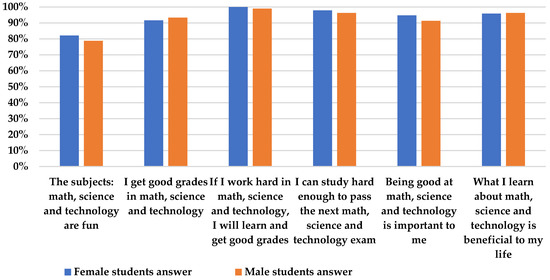
Figure 10.
Primary education answers to questions based on (Model 1) the expectancy–value theory of motivation.
The results obtained in the SR variable, of (Model 2) the social role construct, do not show significant differences between the sexes. This construct asks the question “Who is responsible for these activities?”. The percentages of responses from girls and boys were similar (Figure 11). Similarly, we observed that only the item “Who should dedicate themselves to agriculture?” was dependent on the sex variable (χ2 = 0.03), since for the rest of the items, the values of χ2 were higher than 0.05 (Appendix C). However, it should be noted that the item “Taking care of sick people” was attributed in a high percentage by students to both sexes and in a low percentage to the female sex, but no person surveyed attributed it only to men. In the same way, the items “Dedicate themselves to agriculture” and “...to mechanics” were not attributed to the female sex by anyone.
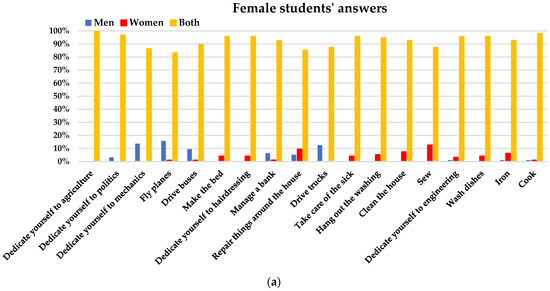
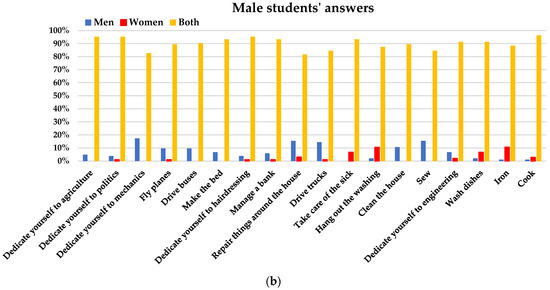
Figure 11.
Primary education answers to questions based on (Model 2) the social role theory: (a) female students’ answers; (b) male students’ answers.
In relation to (Model 3) the gender stereotypes construct, the data show that the SCC and SSR variables vary according to sex, as shown in Figure 12. The percentages of affirmative responses from male students show that they consider their own sex “more capable of performing technical and mechanical tasks” and the opposite sex (female) “more capable of organizational and cooperative tasks”. Regarding the question related to study specialities (STEM vs. social science), the male students responded with a higher percentage that “the performance of their classmates is better in careers related to the humanities and social sciences”. Finally, a significant difference is observed in the responses to the item “Men are responsible for supporting their families financially”. Additionally, to the item “Women should take care of the home and the care of their children”, only 11% of surveyed female students responded affirmatively, while this percentage is tripled in case of male students, rising until to 31%. On the other hand, the dependence of some items on the sex variable was demonstrated (for example, “men are more capable than women of performing technical and mechanical tasks”, “the performance of girls is better in writing careers, humanities and social sciences”, “the performance of boys is better in scientific and technical careers” and “women should worry about the house and taking care of their children”), as the values of χ2 were less than 0.05 (Appendix C).
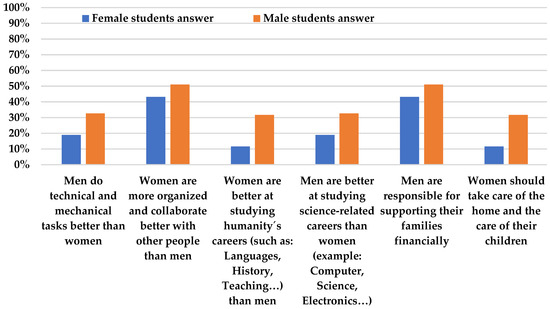
Figure 12.
Primary education answers to questions based on (Model 3) the gender stereotypes theory.
Regarding the educational environment, the data reveal that the vast majority of educational centres are not equipped with a science laboratory (83.4%); therefore, 98.5% of primary education students have not visited one in the last year. Regarding the sex of science and mathematics teachers, the data show that in most cases it is female (87.4% and 78.9%) (Table 3).
Table 3.
Educational environment in primary education.
3.2. Secondary Education Students
The results obtained for the variables MO, EX and VI, of the expectancy–value construct, do not show significant differences between both sexes. However, there is a slight tendency of female students to respond negatively (compared to their peers) to the items “I understand STEM subjects”, “I get good grades in STEM subjects” and “If I work hard in STEM subjects I will learn and I will get good grades”. The percentage of “totally agree” responses in the above items is higher in boys than in girls (Figure 13), and the means of male responses to these items are higher than those of female students (Appendix B). It was also shown that an item of the MO variable, “I understand STEM subjects”, is dependent on the sex variable, since the value of χ2 was less than 0.05 (Appendix C).
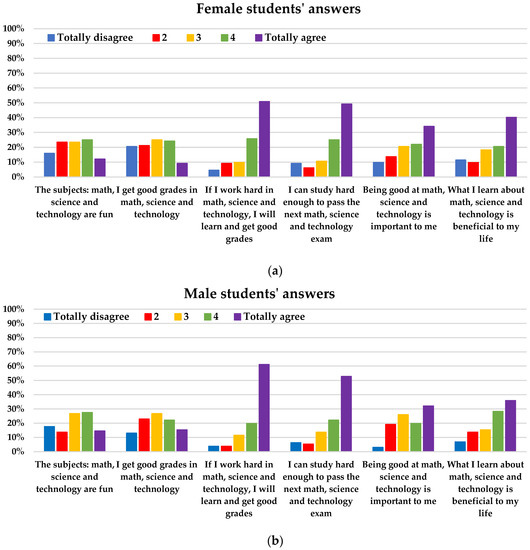
Figure 13.
Secondary education answers to questions based on (Model 1) the expectancy–value theory of motivation: (a) female students’ answers; (b) male students’ answers.
The results obtained in the SR variable of the (Model 2) social role theory show significant differences between the sexes. The percentages of responses from the female students when awarding the execution of the different tasks to “both sexes” were higher than those of the male students, as well as the percentages of responses from the students when assigning domestic tasks and caring for people to the female sex (Figure 14). In a similar vein, it was shown that there is a dependency between all the items of this variable and the sex variable, since the values of χ2 were less than 0.05 (Appendix C). It is notable that no male or female student attributed the items “make the beds”, “dedicate themselves to hairdressing” and “hang out the washing” to the male sex, nor did they attribute “dedicate themselves to agriculture”, “…to mechanics” or “fly planes” to the female sex.
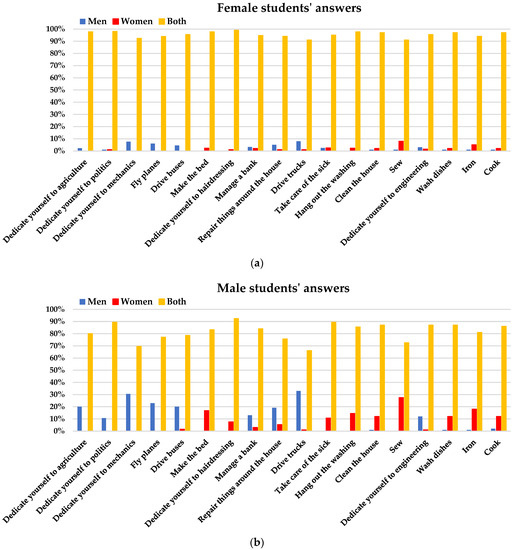
Figure 14.
Secondary education answers to questions based on (Model 2) the social role theory: (a) female students’ answers; (b) male students’ answers.
Regarding the gender stereotypes construct (Model 3), the data shows that the SCC and SSR variables vary depending on sex. The answers of the students indicate that they agree to a greater extent than their classmates with the items asked (Figure 15). For the SCC variable, the average of the responses given by male students (Mean_male) to the item “men are more capable of doing technical and mechanical tasks” was 2.22, while that of the female students (Mean_female) was 1.48. The male students also consider to a greater extent than their female counterparts that “boys’ performance is better in technical careers” (Mean_male = 2.02; Mean_female = 1.45). Additionally, in the item “boys are better in STEM professions”, the means of the male students were higher than those of the female students (Mean_male = 2.56; Mean_female = 1.64) (Appendix B). Regarding the SSR variable, the means of the male responses were higher than those of the female students, which indicates that they agree to a greater extent than their peers that “maintaining families financially” is the responsibility of the male sex (Mean_male = 1.85; Mean_female = 1.23), while “taking care of the home and the offspring” is the responsibility of the female sex (Mean_male = 1.85; Mean_female = 1.31) (Appendix B). Finally, the data demonstrated the dependence of the items of the gender stereotypes construct on the sex variable, since the values of χ2 were less than 0.05, except in the item of the SCC variable “women are more capable of doing organizational and cooperative tasks”, since the value of χ2 was 0.06 (Appendix C).
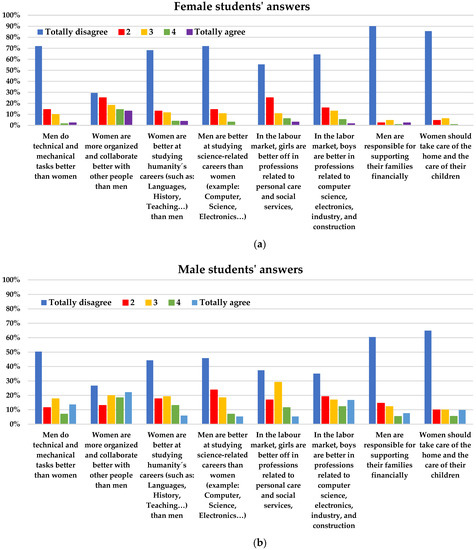
Figure 15.
Secondary education answers to questions based on (Model 3) the gender stereotypes theory: (a) female students’ answers; (b) male students’ answers.
Regarding the educational environment, the data reveal that most of the educational centres visited have a STEM laboratory (88.2%); even so, 75.3% of the students had visited it less than 10 times in the last year. Regarding the sex of science teachers, the majority were female (67.3%); however, in the subjects of mathematics and technology, the data showed that the majority of teachers were male (57% and 63.1%) (Table 4).
Table 4.
Educational environment in secondary education.
3.3. Primary and Secondary Teachers
The main questions formulated for teachers were related to educational environment, as shown in Figure 16. We can observe that in almost all (70%) the educational centres visited, there is a STEM laboratory, but unfortunately less than 35% of the surveyed teachers give lessons in the STEM laboratory to his/her students. Despite there being a science lab in the school, more than a half of surveyed teachers do not prepare hands-on experiments for their students in STEM labs.
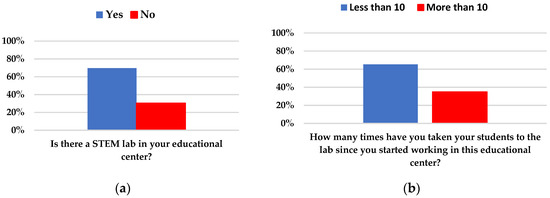
Figure 16.
Primary and secondary teachers’ answers about the educational environment: (a) question about if the educational centre has science laboratory; (b) question about how often students use science laboratory.
Of the whole sample of teachers consulted in surveys, 78.3% are women and 21.7% are men. Another additional question they were asked was “Do you use inclusive language while teaching?” Some responses about the use or non-use of inclusive language were “Because I do not think it’s necessary”, “It’s not a habit for me”, “I think it’s essential because there is still a lot of gender inequality”, “For students to acquire this language” and “To normalize it”.
The degree of teachers’ awareness of the low participation of female students in the fields of science and technology was also assessed, as shown in Figure 17. Regarding the answers, we can observe that in primary and secondary schools, female teachers are more concerned than male teachers about the decrease in students choosing STEM careers, but male teachers are more cognizant of the gender gap in STEM careers.
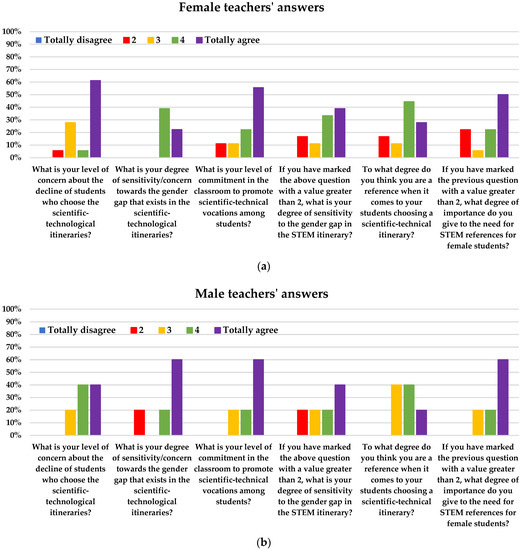
Figure 17.
Primary and secondary teachers’ answers on their degree of awareness of the low participation of female students in STEM careers: (a) female teachers’ answers; (b) male teachers’ answers.
3.4. University
At university level, the research was extended to both students and professors from different fields; these not only included engineering, but also science, social sciences and economics.
3.4.1. University Students
The results obtained in the variables MO and EX, of the (Model 1) expectancy–value theory of motivation, do not show significant differences between both sexes, although the means of the male responses are somewhat higher than those of the female students (Appendix B). However, there are two items of the VI variable that do show differences in the answers offered by the female students and the male students, since the males answered with a higher percentage of affirmative responses that “being good in STEM subjects means a lot to me” (Mean_male = 3.47; Mean_female = 2.98) and that “being good in these subjects will help me in the rest of my studies” (Mean_male = 3.46; Mean_female = 2.96) (Appendix B and Figure 18). However, only one item of the expectancy–value construct is dependent on the sex variable (“I understand STEM subjects”), since the value of χ2 was less than 0.05 (Appendix C).
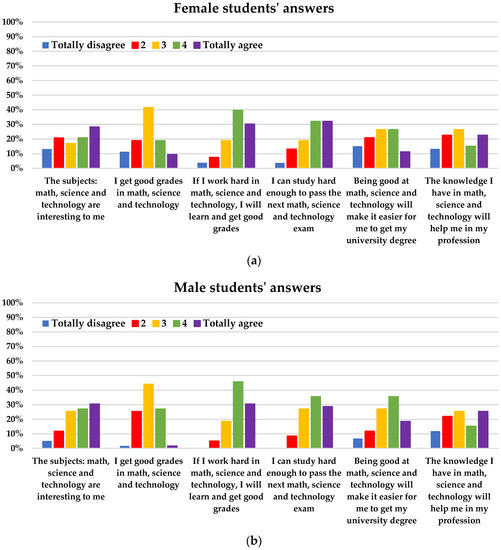
Figure 18.
University students’ answers to questions based on (Model 1) expectancy–value theory of motivation: (a) female students’ answers; (b) male students’ answers.
The results obtained in the RS variable of the (Model 2) social role theory do not show significant differences between the sexes. The percentages of female and male responses to the different items were similar (Figure 19). In the same way, it was shown that there is no dependency between most of the items of this construct and the sex variable, since the values of χ2 were higher than 0.05 (Appendix C), with the exception of the item “who should be dedicated to agriculture?”, which did show dependence (χ2 = 0.03). It is worth highlighting the fact that no female student attributed certain domestic and care tasks to the male sex (i.e., making the bed, taking care of the sick, hanging out the washing, cleaning the house and sewing), but the male students did. In a similar vein, the items “dedicate themselves to agriculture”, “...to politics” and “repairing things around the home” were attributed in a high percentage by students to both sexes and in a low percentage to the male sex, but no person surveyed attributed this item only to women.
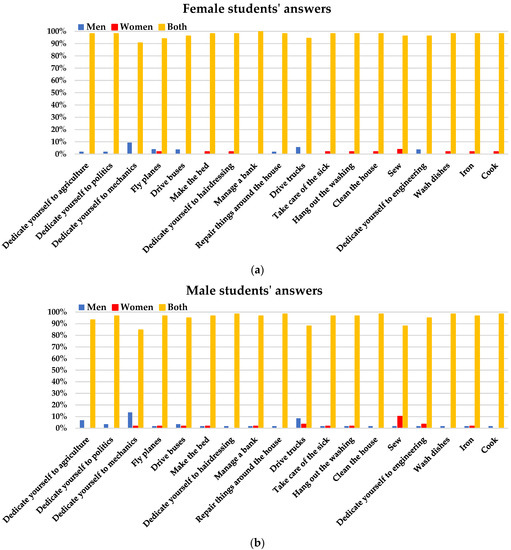
Figure 19.
University students’ answers to questions based on (Model 2) the social role theory: (a) female students’ answers; (b) male students’ answers.
As for the SCC and SSR variables of the (Model 3) gender stereotypes theory, the percentages of the responses of students stating that they “totally disagree” with almost all the items were higher than 50% in both sexes, except for the one related to “Women are more organized and collaborate better with other people than men”. More than 15% of surveyed male student agreed totally with this item, while only 5% of the surveyed female students (Figure 20) agreed with this item. The means of the responses of both sexes are similar (Appendix B). The χ2 analysis showed that there is no dependence between the SCC and SSR variables with the sex variable, since all the values are greater than 0.05 (Appendix C).
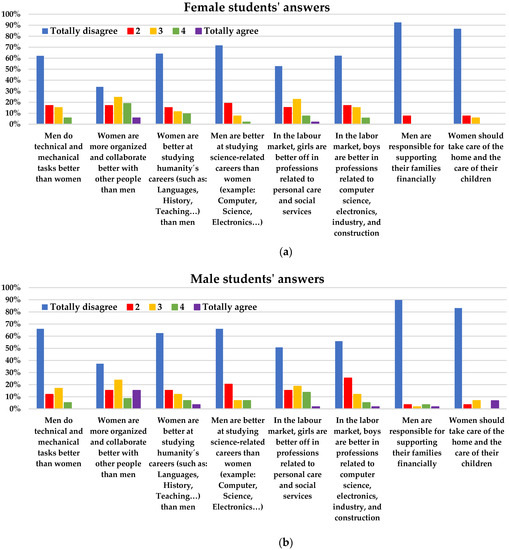
Figure 20.
University students’ answers to questions based on (Model 3) the gender stereotypes theory: (a) female students’ answers; (b) male students’ answers.
Additionally, university students were asked about their degree of concern in relation to the effect that the actual gender gap in STEM careers could have on society. Almost 70% of the surveyed participants think this will have consequences for society, as shown in Figure 21.
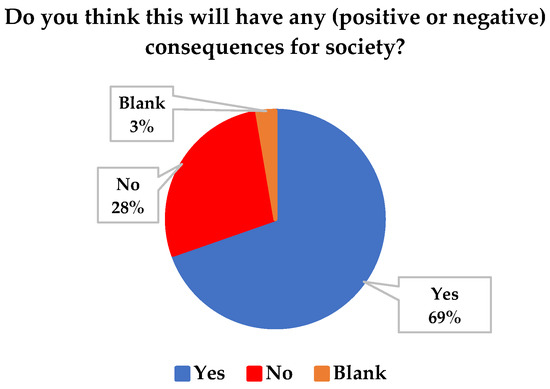
Figure 21.
University students’ answers to an additional question on the impact that the low percentage of women enrolled in STEM carers could have on society.
As for the primary and secondary students, the last construct discussed with the university students was the educational environment. With regard to the reasons that guided the students to choose their current university degree, differences can be observed between the responses of women and men studying STEM careers, and between women studying STEM and women studying non-STEM careers. Half of the surveyed students studying STEM careers (54.55% of women and 55.26% of men) recognise that they selected STEM careers by vocation. By contrast, this percentage increased to 88.10% (women) and 71.43% (men) in the case of non-STEM students.
Other reasons such as family influence have a weight of 18.8% in STEM women (the highest weight in comparison with the non-STEM women and all the male students). Additionally, almost one fifth of surveyed STEM women (18.18%) say their choice was motivated by professional opportunities. This percentage duplicates in the case of STEM men (34.21%). The responses of the students of non-STEM degrees do not contemplate family influences or professional opportunities in their choice. Observing only the male students, the responses of the STEM students were mostly related to vocation and professional opportunities (55.26% and 34.21%), similar to male students of non-STEM degrees (71.43% and 19.05%) (Table 5).
Table 5.
Reasons that guided the choice of curriculum.
3.4.2. University Professors
Surveys asked this group their gender, age, years of teaching experience, and the institution in which they teach. Of this group of 25 professors, 20% were women and 80% were men. The professors’ surveys were more focused on how they perceive the roles that traditionally exist in this field between men and women, as they apply to male and female students. As Figure 22 shows, they were also asked additional questions, including: “Do you use inclusive language while teaching?”. More than half of professors, regardless of whether they are men or women, do not use inclusive language in classes. Some answers about the use or not of inclusive language were “It’s a waste of time”, “It makes communication difficult”, “I have not internalized it. It does not come naturally to me”, “Because I do not agree with this language”, “I’m used to it and it seems to me the most appropriate” and “This language shows equality and respect”.
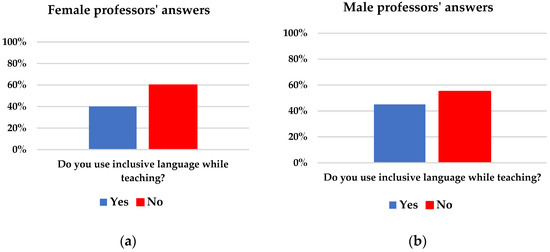
Figure 22.
University professors answers to an additional question on the use of inclusive language in the classroom: (a) female professors’ answers; (b) male professors’ answers.
3.5. University Graduates
The results obtained in the variables MO, EX and VI of the (Model 1) expectancy–value theory of motivation do not show significant differences between the sexes. In a similar vein, it is highlighted that there is no dependency between these variables and the sex variable, since all the values of χ2 were greater than 0.05 (Appendix C).
However, there is one item of the VI variable that does show differences in the answers offered by the female students and the male students; the male students responded with a higher percentage of affirmative responses that “being good in STEM subjects means a lot to me” (Mean_male = 4.08; Mean_female = 3.63) (Appendix B and Figure 23).
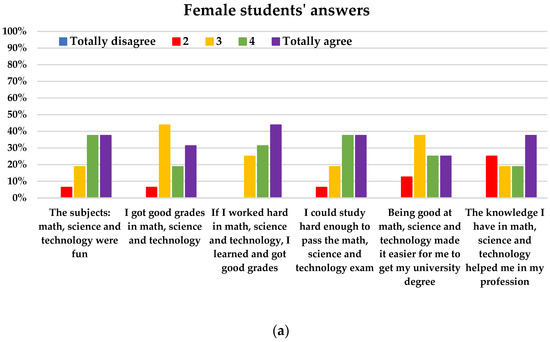
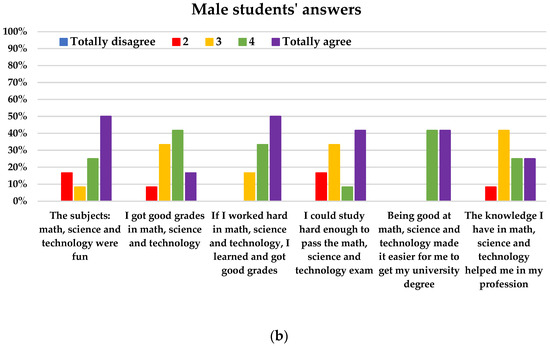
Figure 23.
University graduates’ answers to questions based on (Model 1) the expectancy–value theory of motivation. (a) female students’ answers; (b) male students’ answers.
The results obtained in the SR variable of the (Model 2) social role theory do not show significant differences between the sexes. The percentages of female and male responses to the different items were similar (Figure 24). In the same way, it was shown that there is no dependency between most of the items of this construct and the sex variable, since the values of χ2 were higher than 0.05 (Appendix C). Nevertheless, it is worth highlighting the fact that a higher number of female graduates consider both women and men to be responsible for doing all the tasks mentioned in the survey (100% of surveyed women believe that task such as flying planes, managing a bank, taking care of the sicks and cleaning the house correspond to both men and women). However, regarding the answers from male graduates, it can be seen that there are considerable number of tasks that male graduates consider to correspond exclusively to men (dedicating themselves politics, dedicating themselves to mechanics, flying planes, driving buses); meanwhile, they considered several domestic tasks to correspond exclusively to women (taking care of the sick, hanging out the washing, cleaning the house, sewing).
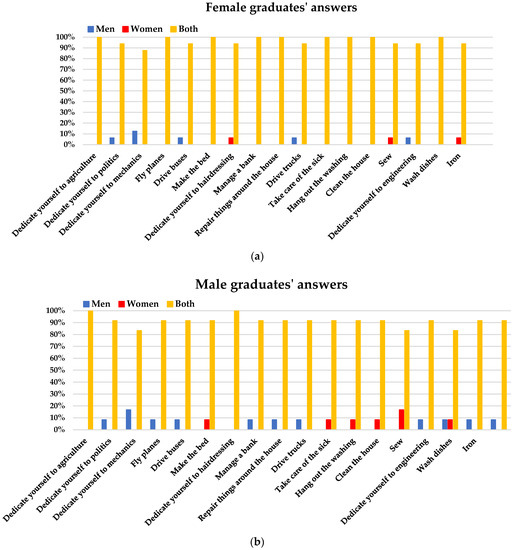
Figure 24.
University graduates’ answers to questions based on (Model 2) the social role theory: (a) female graduates’ answers; (b) male graduates’ answers.
In relation to (Model 3) the gender stereotypes theory, for the SCC and SSR variables, students of both sexes stated that they “totally disagree” with almost all of the items (i.e., more than 50% of students of both sexes), as shown in Figure 25, Appendix B. The χ2 analysis showed that there is no dependence between the SCC and ERS variables with the sex variable, since all the values are greater than 0.05 (Appendix C). But some items deserve attention. For example, in the item “In the labour market, boys are better at STEM professions”, the disagreement level is higher in woman than in men (Mean_female 1.44, Mean_male = 1.92). In the items “Men are responsible for supporting their families financially” and “Women should take care of the home and of their children”, absolutely all of the surveyed women disagreed, but not all of the surveyed men thought the same. There were even some who totally agreed with these items (Mean_female = 1, Mean_male = 1.50).
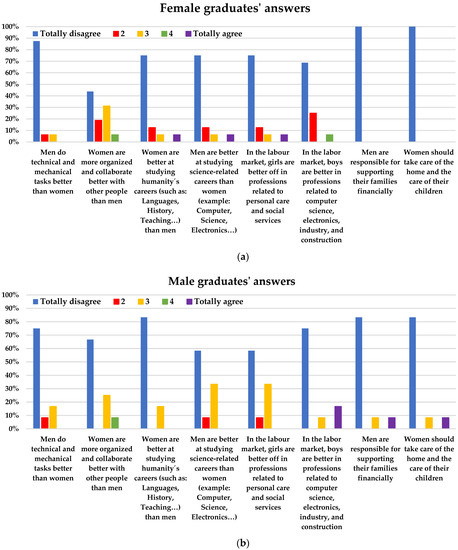
Figure 25.
University graduates’ answers to questions based on (Model 3) the gender stereotypes theory: (a) female graduates´ answers; (b) male graduates´ answers.
3.6. Enterprise/Industry Professionals
The last target group studied is that of enterprise and industry professionals. The surveys were anonymous; only information on gender, age, position held in the company and years of experience was obtained. The surveys asked questions about the type of activity carried out by the company within the STEM field, and the gender equality that exists within the company. Figure 26 shows the obtained results from some of the questions in the survey: “Is there an equal environment between men and women in the company where you work?”, “Do you use inclusive language in your work environment?” and “Does the company in which you work have an Equality Plan registered in REGCON?”. As Figure 26a shows, there is an equal environment in the companies, although inclusive language is not yet well established (Figure 26b). Similarly, most STEM workers do not know if there is an Equality Plan in their company (Figure 26c).
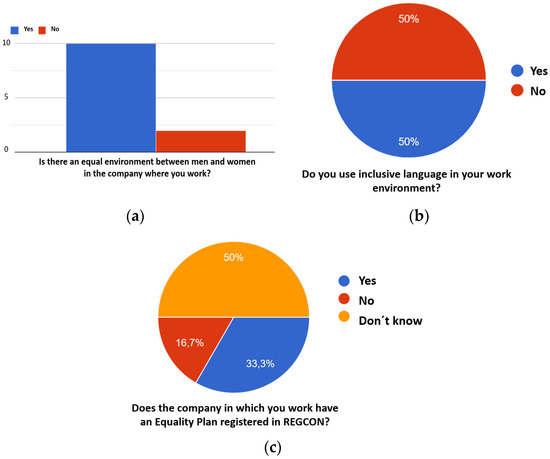
Figure 26.
Enterprise/industry professionals’ answers to questions about the STEM field and the gender equality that exists within their company: (a) question about equality environment; (b) question about inclusive language; (c) question about equality plan.
4. Discussion
Based on collected data, the initial hypothesis is validated. There is not a single model that explains the low presence of women in STEM careers. From the research carried out, we can observe an interrelation between the three models. Students who classify tasks and professions according to gender (i.e., the social role theory) are prone to assigning different capabilities to women and men (i.e., the gender stereotypes theory).
Then, with regard to the tasks and activities that students consider to be typical of men, women or both sexes, i.e., the roles that society has traditionally attributed to men and women, the data do show significant differences between male and female students, especially in secondary education; at this stage (coinciding with adolescence), male students showed greater discrimination between the roles assigned to the sexes.
Regarding gender stereotypes related to competences and skills, the collected data indicate that from primary education onwards, there is a greater tendency for male students to consider themselves better at STEM disciplines and professions. This tendency is more noticeable in secondary education, but tends to decrease in higher education. Regarding the stereotypes of social responsibility attributed to the sexes, according to the data analysed, male students show a greater discrimination of responsibilities attributed to each sex than female students. These differences are more pronounced at an early age (primary and secondary education), and diminish by the time they reach higher education.
Regarding the influence of educational environments on the promotion of STEM degrees, the data revealed the frequent use of non-active methodologies in primary and secondary schools, as well as a lower female presence in the teaching teams of these subjects in secondary schools. These findings could indicate that the educational environments analysed (primary and secondary) favour female students rarely choosing STEM degrees.
With regard to the motivations for the choice of degree, according to the data analysed, vocation is the main reason. In addition, university students believe that the low percentage of women in STEM degrees will increase inequalities between men and women. On the causes of low female participation in STEM, students’ opinions differ by gender. Female students attribute low participation to social causes, and male students attribute low participation to gender differences in taste. Both female and male university students would encourage guidance in the previous educational stages to increase female participation in STEM degrees.
With regard to teachers, both primary and secondary education teachers are highly committed to closing the gender gap in all fields, and particularly in STEM careers.
Unfortunately, university professors do not seem to be either as committed or as concerned about the gender gap in STEM careers. Most of them are not looking for new resources to help challenge the gender gap in their classes.
Regarding companies and industries, it can be observed that they reflect what is happening in the other productive sectors and the rest of society in general. More than 83% of surveyed companies have a gender equality plan, but only half use inclusive language in the work environment.
Comparing the results obtained by the authors in this research with previous scientific works referred to in Table 2, we can observe the following. The study carried out in [16] with 15-year-old students in 57 countries found that 64% of boys and girls expect to be able to work in a STEM-related profession. In our case, the study conducted by the authors found that 40% of female secondary school students believe that their knowledge obtained in mathematics, science and technology will be beneficial for their future (Figure 13a). Similarly, a study in [16] found that the separation of men and women in certain sectors of the public sphere can spread certain gender roles in professional occupations. The authors’ study, based on “(Model 2) social role theory” also found that there are still professions rooted in gender roles.
García-Holgado, Mena et al. [17] showed that only 32.69% of graduates in STEM programs during the 2018/2019 academic year were female. In the study conducted by the authors, in Figure 1, it is shown that in 2018, 33.26% of graduates in tertiary education in the EU in STEM disciplines were female.
The results of the study by Dulce-Salcedo et al. [18] indicate that this gap could be reduced by exposing students to a higher proportion of female STEM teachers in secondary education. In the study conducted by the authors, surveys of primary and secondary education teachers are pooled, and of the 23 teachers surveyed, 18 are female teachers; both female students and female teachers are aware of the importance of having a female reference in STEM classes.
Jiang [19] conducted a study in which he found that family reasons, place of work and stereotypes rooted in women’s place of origin influence a higher dropout rate in women in STEM disciplines than in men. In the study carried out using “(Model 2) social role theory”, the authors found ideological entrenchment regarding women taking care of the home and caring for the sick.
The study conducted by Kumar et al. [20] with children between 4 and 6 years of age found that in the male/all-female condition, the scientist figure was more rooted in the male role, with 59%, as opposed to 33% in the all-female condition, 38% in the all-male condition and 43% in the female/all-male condition. In the study carried out by the authors for “(Model 2) social role theory” with children in primary education, it can be seen that many professions still have a gender difference in perception (Figure 11a,b), where powerful and intellectual occupations are associated with men, and more care-oriented professions are associated with women.
The results obtained from the study conducted by Krstić and Gaweł [21] determined that the gender gap in STEM entrepreneurship is determined by the gender gap in STEM education. There are twice as many male entrepreneurs as female entrepreneurs. In higher education, the largest STEM-related gender gaps are in science, mathematics, computing, engineering, manufacturing, and construction, with far more male graduates than female graduates. The study conducted by the authors shows that in higher education (Figure 1 and Figure 2) the number of women graduates in tertiary education in Europe ranges between 32–33%, while in Spain, it ranges between 28–29%.
5. Conclusions
Based on the obtained results, it can be concluded that we have a long way to go to reach gender-balanced study ratios in STEM fields. On the one hand, the results of the surveys show that there are still social patterns that make young people differentiate certain types of activities based on gender. At this stage, boys still think that professions related to the care of the home and of sick people are the responsibility of women, while more technical, authoritative and manual professions are for men. This can also be extrapolated in the opposite direction, resulting in careers such as nursing, social work, primary education and psychology being dominated by women.
On the other hand, it can be seen that of the three educational levels (primary, secondary and university), higher education teachers, compared to primary and secondary teachers, are the least aware of the gender gap in STEM. Most of the university professors surveyed state that they have no intention of carrying out any type of small action in their classes to contribute to the visibility of women in a field with such a low percentage of women.
Apart from the conclusions obtained from the responses to the surveys related to the three models analysed, the authors determined that one of the most important reasons for low engagement in STEM areas is the educational environment, i.e. the poor contact that students have with science and engineering in primary and secondary school. It is difficult to engage students (male or female) in science or engineering at the age of eighteen (university) when they have never stepped into a STEM laboratory before. The authors deduce that it is crucial to redefine the curriculum, adapting it to ensure that primary and secondary students learn science and engineering with the “five senses” (seeing, touching, hearing, smelling and tasting).
The participatory workshops carried out in this study have been designed to show that the fields of technology and science are strongly linked to decision-making and economic and social leadership positions. If the presence of women in STEM careers is strengthened, women’s capacity for influence in these fields will be much greater.
Author Contributions
Conceptualization, M.M. and F.S.; methodology, M.M., Y.C. and F.S.; formal analysis, M.M., F.S., Y.C. and J.M.A.; writing—original draft preparation, M.M.; writing—review and editing, J.M.A.; project administration, F.S. All authors have read and agreed to the published version of the manuscript.
Funding
This research was funded by Ref:15/3ACT/21 and the APC was funded by Ref: 2020-1-IT02-KA226-HE-095424.
Institutional Review Board Statement
The study was conducted in accordance with the Declaration of Helsinki, and approved by the Institutional Review Board of University of Huelva on 11 January 2023.
Informed Consent Statement
Informed consent was obtained from all subjects involved in the study.
Data Availability Statement
The data presented in this study are available on request from the corresponding author. The data are not publicly available due to the participation of minors in the study.
Acknowledgments
This work has been supported by project Ref:15/3ACT/21 ALAS: Accompanying Girls Towards Stem Careers, founded by the Spanish Ministry of Equity.
Conflicts of Interest
The authors declare no conflict of interest.
List of Acronyms
| ALAS | Accompanying girLs towArds STEM careers |
| AVE | Average variance extracted |
| BEng | Bachelor of Engineering degree |
| CEDEFOP | European Center for the Development of Professional Vocation |
| EEA | European Education Area |
| EPWS | European Platform of Women Scientists |
| ERA | European Research Area |
| EU | European Union |
| GENERA | Gender Equality Network in the European Research Area |
| MS | Member state |
| PAU | University entrance exams |
| STEM | Science, Technology, Engineering and Mathematics |
| UHU | University of Huelva |
| UNGA | United Nations General Assembly |
Appendix A
| Factorial Analysis | Primary Students | Secondary Students | University Students | University Graduates | ||||||||||||
| Mean (SD) | Load | AVE | Alfa | Mean (SD) | Load | AVE | Alfa | Mean (SD) | Load | AVE | Alfa | Mean (SD) | Load | AVE | Alfa | |
| Motives (MO) | ||||||||||||||||
| STEM subjects are fun | 4.22 (1.59) | 0.62 | 0.50 | 0.49 | 3.01 (1.29) | 0.79 | 0.73 | 0.84 | 3.49 (1.31) | 0.79 | 0.71 | 0.78 | 3.93 (1.15) | 0.85 | 0.81 | 0.89 |
| I understand STEM subjects | 4.50 (1.33) | 0.85 | 3.14 (1.26) | 0.90 | 3.31 (1.09) | 0.93 | 3.64 (1.09) | 0.94 | ||||||||
| I get good grades in STEM subjects | 4.70 (1.06) | 0.64 | 2.92 (1.27) | 0.86 | 2.99 (0.96) | 0.80 | 3.57 (1.03) | 0.91 | ||||||||
| Expectations (EX) | ||||||||||||||||
| If I work hard in STEM subjects, I will learn and get good grades | 4.98 (0.28) | 0.71 | 0.54 | −0.18 | 2.66 (1.35) | 0.92 | 0.85 | 0.82 | 3.94 (0.95) | 0.90 | 0.81 | 0.78 | 4.18 (1.02) | 0.90 | 0.81 | 0.78 |
| I can study hard enough to pass the next STEM subjects exam | 4.88 (0.67) | −0.71 | 4.20 (1.13) | 0.92 | 3.80 (1.05) | 0.90 | 3.93 (1.05) | 0.90 | ||||||||
| Incentive value (IV) | ||||||||||||||||
| Being good at STEM means a lot to me | 4.72 (1.03) | 0.67 | 0.48 | 0.44 | 3.58 (1.27) | 0.79 | 0.64 | 0.81 | 3.24 (1.21) | 0.78 | 0.60 | 0.68 | 3.82 (1.06) | 0.83 | 0.79 | 0.82 |
| Being good at STEM will help me in the rest of the years in my studies | 4.86 (0.74) | 0.76 | 3.99 (1.19) | 0.77 | 3.22 (1.4) | 0.81 | 3.46 (1.32) | 0.89 | ||||||||
| What we learn about STEM is beneficial to my life | 4.84 (0.79) | 0.64 | 3.58 (1.26) | 0.82 | - | - | - | - | ||||||||
| The knowledge I have of STEM will help me in my future work | - | - | 3.70 (1.33) | 0.83 | 3.16 (1.53) | 0.74 | 3.25 (1.29) | 0.86 | ||||||||
| Stereotypes about competences and capabilities (SCC) | ||||||||||||||||
| Men are more qualified than women to do technical and mechanical tasks | 2.05 (1.76) | 0.75 | 0.53 | 0.68 | 1.15 (1.27) | 0.72 | 0.61 | 0.87 | 1.63 (0.94) | 0.75 | 0.57 | 0.84 | 1.43 (0.96) | 0.58 | 0.61 | 0.83 |
| Women are better able to do organizational and cooperative tasks | 2.89 (2.00) | 0.55 | 2.76 (1.46) | 0.73 | 2.47 (1.37) | 0.68 | 1.89 (1.07) | 0.54 | ||||||||
| Girls’ performance is better in arts, humanities and social sciences majors | 1.88 (1.66) | 0.82 | 1.90 (1.22) | 0.80 | 1.7 (1.07) | 0.82 | 1.57 (1.17) | 0.91 | ||||||||
| The performance of boys is better in scientific-technical careers | 1.68 (1.51) | 0.76 | 1.73 (1.05) | 0.83 | 1.47 (0.82) | 0.78 | - | - | ||||||||
| In the labour market, girls are better in professions related to care and services | - | - | - | - | 2.03 (1.18) | 0.73 | 1.96 (1.15) | 0.69 | 1.61 (1.03) | 0.91 | ||||||
| In the job labour, boys are better at STEM professions | - | - | - | - | 2.10 (1.35) | 0.86 | 1.68 (0.96) | 0.81 | 1.64 (1.19) | 0.87 | ||||||
| Stereotypes about social responsibility (SSR) | ||||||||||||||||
| Men are responsible for supporting their families financially | 1.80 (1.61) | 0.86 | 0.74 | 0.65 | 1.54 (1.09) | 0.93 | 0.87 | 0.85 | 1.16 (0.61) | 0.85 | 0.72 | 0.60 | 1.21 (0.83) | 0.99 | 0.98 | 0.1 |
| Women should take care of the house and their children. | 2.43 (1.92) | 0.86 | 1.58 (1.17) | 0.93 | 1.32 (0.88) | 0.85 | 1.21 (0.83) | 0.99 | ||||||||
Appendix B
| Secondary Students | University Students | University Graduates | ||||
| Mean (SD) Female | Mean (SD) Male | Mean (SD) Female | Mean (SD) Male | Mean (SD) Female | Mean (SD) Male | |
| Motives (MO) | ||||||
| STEM subjects are fun | 2.94 (1.27) | 3.08 (1.30) | 3.30 (1.42) | 3.66 (1.18) | 3.81 (1.17) | 4.08 (1.16) |
| I understand STEM subjects | 2.94 (1.27) | 3.34 (1.21) | 3.06 (1.20) | 3.54 (0.93) | 3.56 (1.15) | 3.75 (1.05) |
| I get good grades in STEM subjects | 2.80 (1.27) | 3.04 (1.26) | 2.96 (1.11) | 3.02 (0.82) | 3.50 (1.15) | 3.67 (0.88) |
| Expectations (EX) | ||||||
| If I work hard in STEM subjects, I will learn and get good grades | 4.09 (1.75) | 4.31 (1.07) | 3.85 (1.06) | 4.02 (0.84) | 4.19 (0.83) | 4.17 (1.27) |
| I can study hard enough to pass the next STEM subjects exam | 3.99 (1.29) | 4.10 (1.19) | 3.75 (1.16) | 3.85 (0.94) | 4.06 (0.93) | 3.75 (1.21) |
| Incentive (IV) | ||||||
| Being good at STEM means a lot to me | 3.57 (1.34) | 3.59 (1.21) | 2.98 (1.25) | 3.47 (1.14) | 3.63 (1.02) | 4.08 (1.08) |
| Being good at STEM will help me in the rest of the years in my studies | 3.97 (1.23) | 4.01 (1.15) | 2.96 (1.41) | 3.46 (1.36) | 3.19 (1.47) | 3.83 (1.03) |
| What we learn about STEM is beneficial to my life | 3.60 (1.31) | 3.56 (1.21) | - | - | - | - |
| The knowledge I have of STEM will help me in my future work | 3.68 (1.38) | 3.73 (1.27) | 3.11 (1.35) | 3.20 (1.36) | 3.19 (1.42) | 3.33 (1.15) |
| Stereotypes about competences and capabilities (SCC) | ||||||
| Men are more qualified than women to do technical and mechanical tasks | 1.48 (0.90) | 2.22 (1.47) | 1.64 (0.94) | 1.61 (0.95) | 1.19 (0.54) | 1.75 (1.29) |
| Women are better able to do organizational and cooperative tasks | 2.56 (1.38) | 2.96 (1.51) | 2.45 (1.29) | 2.49 (1.45) | 2 (1.03) | 1.75 (1.14) |
| Girls’ performance is better in arts, humanities and social sciences majors | 1.62 (1.07) | 2.19 (1.30) | 1.66 (1.02) | 1.73 (1.13) | 1.50 (1.09) | 1.67 (1.30) |
| The performance of boys is better in scientific-technical careers | 1.45 (0.80) | 2.02 (1.19) | 1.40 (0.72) | 1.54 (0.90) | ||
| In the labour market, girls are better in professions related to care and services | 1.77 (1.06) | 2.31 (1.23) | 1.91 (1.11) | 2 (1.19) | 1.50 (1.09) | 1.75 (0.96) |
| In the job labour, boys are better at STEM professions | 1.64 (1) | 2.56 (1.49) | 1.64 (0.94) | 1.71 (0.98) | 1.44 (0.81) | 1.92 (1.56) |
| Stereotypes about social responsibility (SSR) | ||||||
| Men are responsible for supporting their families financially | 1.23 (0.77) | 1.85 (1.27) | 1.08 (0.27) | 1.24 (0.79) | 1 (0) | 1.50 (1.24) |
| Women should worry about the house and taking care of their children. | 1.31 (0.87) | 1.85 (1.36) | 1.19 (0.52) | 1.44 (1.10) | 1 (0) | 1.50 (1.24) |
Appendix C
| χ2 Gender | ||||
| Primary Students | Secondary Students | University Students | University Graduates | |
| Motives (MO) | ||||
| STEM subjects are fun | 0.56 | 0.38 | 0.30 | 0.57 |
| I understand STEM subjects | 0.69 | 0.04 | 0.03 | 0.54 |
| I get good grades in STEM subjects | 0.65 | 0.34 | 0.07 | 0.65 |
| Expectations (EX) | ||||
| If I work hard in STEM subjects, I will learn and get good grades | 0.34 | 0.25 | 0.60 | 0.48 |
| I can study hard enough to pass the next STEM subjects exam | 0.47 | 0.78 | 0.43 | 0.30 |
| Incentive value (IV) | ||||
| Being good at STEM means a lot to me | 0.35 | 0.14 | 0.30 | 0.12 |
| Being good at STEM will help me in the rest of the years in my studies | 0.79 | 0.23 | 0.36 | 0.59 |
| What we learn about STEM is beneficial to my life | 0.90 | 0.13 | - | - |
| The knowledge I have of STEM will help me in my future work | - | 0.33 | 0.10 | 0.59 |
| Social Role (SR) | ||||
| Who would these activities correspond to men, women or both? Engage in agriculture | 0.03 | 0.00 | 0.21 | - |
| … Politics | 0.61 | 0.00 | 0.62 | 0.35 |
| … Mechanics | 0.48 | 0.00 | 0.49 | 0.75 |
| … Fly planes | 0.42 | 0.00 | 0.79 | 0.24 |
| … Drive buses | 0.58 | 0.00 | 0.63 | 0.83 |
| … Do housework | 0.44 | 0.00 | 0.63 | 0.24 |
| … Engage in hairdressing | 0.06 | 0.00 | 0.34 | 0.38 |
| … Head a bank | 0.98 | 0.02 | 0.41 | 0.24 |
| … Repair devices at home | 0.34 | 0.00 | 0.94 | 0.24 |
| … Drive trucks | 0.58 | 0.00 | 0.32 | 0.83 |
| … Take care of sick | 0.44 | 0.00 | 0.63 | 0.24 |
| … Hang out the washing | 0.14 | 0.00 | 0.63 | 0.24 |
| … Cleaning the house | 0.43 | 0.01 | 0.37 | 0.24 |
| … Sew the clothes | 0.58 | 0.00 | 0.26 | 0.38 |
| … Engage to engineering | 0.11 | 0.02 | 0.32 | 0.83 |
| … Washing the dishes | 0.29 | 0.01 | 0.37 | 0.24 |
| … Ironing | 0.56 | 0.00 | 0.63 | 0.83 |
| … Cooking | 0.65 | 0.01 | 0.37 | 0.24 |
| Stereotypes about competences and capabilities (SCC) | ||||
| Men are more qualified than women to do technical and mechanical tasks | 0.03 | 0.00 | 0.88 | 0.48 |
| Women are better able to do organizational and cooperative tasks | 0.27 | 0.06 | 0.31 | 0.38 |
| Girls’ performance is better in arts, humanities and social sciences majors | 0.00 | 0.00 | 0.72 | 0.52 |
| The performance of boys is better in scientific-technical careers | 0.02 | 0.00 | 0.64 | - |
| In the labour market, girls are better in professions related to care and services | - | 0.00 | 0.88 | 0.26 |
| In the job labour, boys are better at STEM professions | - | 0.00 | 0.69 | 0.21 |
| Stereotypes about social responsibility (SSR) | ||||
| Men are responsible for supporting their families financially | 0.07 | 0.00 | 0.34 | 0.24 |
| Women should worry about the house and taking care of their children. | 0.00 | 0.00 | 0.20 | 0.24 |
References
- Marchisio, M.; Barana, A.; Fissore, C.; Pulvirenti, M. Digital Education to Foster the Success of Students in Difficulty in Line with the Digital Education Action Plan. EDEN Conf. Proc. 2021, 1, 353–363. [Google Scholar] [CrossRef]
- Alexiadou, N.; Rambla, X. Education policy governance and the power of ideas in constructing the new European Education Area. Eur. Educ. Res. J. 2022, 4, 14749041221121388. [Google Scholar] [CrossRef]
- Kushnir, I. Referentiality mechanisms in EU education policymaking: The case of the European Education Area. Eur. J. Educ. 2022, 57, 128–141. [Google Scholar] [CrossRef]
- Martínez, M.; Segura, F.; Andújar, J.M.; Ordóñez, R. ALAS: Accompanying girls towards STEM careers. An experimental study from primary to higher education. In Proceedings of the 6th IEEE Eurasian Conference on Educational Innovation, Singapore, 3–5 February 2023. [Google Scholar]
- Martínez, M.; Segura, F.; Andújar, J.M.; Ceada, Y.; Martín, M.J. Study on the Low Presence of Women in the STEM field. Search for Reasons to Be Able to Increase Participation. In Proceedings of the V Jornadas ScienCity 2022. Fomento de la Cultura Científica, Tecnológica y de Innovación en Ciudades Inteligentes, Huelva, Spain, 14–16 November 2022; pp. 10–13. [Google Scholar]
- Secretaría General de Universidades. Datos y Cifras del Sistema Universitario Español. Publicación 2021–2022. In Datos y Cifras. 2022. Available online: https://www.universidades.gob.es/stfls/universidades/Estadisticas/ficheros/DyC_2021_22.pdf (accessed on 12 March 2023).
- Langdon, D.; McKittrick, G.; Beede, D.; Khan, B.; Doms, M. STEM: Good Jobs Now and for the Future. In ESA Issue Brief #03-11. 2011; pp. 37–49. Available online: https://eric.ed.gov/?id=ED522129 (accessed on 12 March 2023).
- Fallis, A. Encouraging STEM Studies for the Labour Market. J. Chem. Inf. Model. 2015, 53, 1689–1699. [Google Scholar]
- U.S. Bureau of Labor Statistics. Employment Projections. 2022. Available online: https://www.bls.gov/emp/tables/stem-employment.htm (accessed on 12 March 2023).
- Tres Bishop, D. The Hard Truth About Soft Skills. Muma Bus. Rev. 2017, 1, 233–239. [Google Scholar] [CrossRef] [PubMed]
- Mely, W.; Br, B.; Nirwana, D.; Manulang, R. The Effect of Organizational Learning on Improving Hard skills, Soft Skills, and Innovation on Performance. J. Prajaiswara 2022, 3, 126–146. [Google Scholar]
- Schislyaeva, E.R.; Saychenko, O.A. Labor Market Soft Skills in the Context of Digitalization of the Economy. Soc. Sci. 2022, 11, 91. [Google Scholar] [CrossRef]
- Karimi, H.S.; Piña, A.A. Strategically Addressing the Soft Skills Gap Among STEM Undergraduates. J. Res. STEM Educ. 2021, 7, 21–46. [Google Scholar] [CrossRef]
- Attström, K.; Niedlich, S.; Sandvliet, K.; Kuhn, H.-M.; Beavor, E. Mapping and Analysing Bottleneck Vacancies in EU Labour Markets—Overview Report. 2014, p. 122. Available online: https://ec.europa.eu/eures/downloadSectionFile.do?fileId=8010 (accessed on 12 March 2023).
- García-Holgado, A.; Verdugo-Castro, S.; González, C.; Sánchez-Gómez, M.C.; García-Peñalvo, F.J. European Proposals to Work in the Gender Gap in STEM: A Systematic Analysis. IEEE Rev. Iberoam. Tecnol. Aprendiz. 2020, 15, 215–224. [Google Scholar] [CrossRef]
- McDaniel, A. The role of cultural contexts in explaining cross-national gender gaps in STEM expectations. Eur. Sociol. Rev. 2016, 32, 122–133. [Google Scholar] [CrossRef]
- García-Holgado, A.; Mena, J.; García-Peñalvo, F.J.; Pascual, J.; Heikkinen, M.A.; Harmoinen, S.; García, L.; Niebles, R.P.; Amores, L. Gender equality in STEM programs: A proposal to analyse the situation of a university about the gender gap. In Proceedings of the 2020 IEEE Global Engineering Education Conference (EDUCON), Porto, Portugal, 27–30 April 2020; Volume 21, pp. 1–9. [Google Scholar]
- Dulce-Salcedo, O.V.; Maldonado, D.; Sánchez, F. Is the proportion of female STEM teachers in secondary education related to women’s enrollment in tertiary education STEM programs? Int. J. Educ. Dev. 2022, 91, 102591. [Google Scholar] [CrossRef]
- Jiang, X. Women in STEM: Ability, preference, and value. Labour Econ. 2021, 70, 101991. [Google Scholar] [CrossRef]
- Kumar, S.C.; Haber, A.S.; Ghossainy, M.E.; Barbero, S.; Corriveau, K.H. The impact of visualizing the group on children’s persistence in and perceptions of STEM. Acta Psychol. 2023, 233, 103845. [Google Scholar] [CrossRef] [PubMed]
- Gaweł, A.; Krstić, M. Gender Gaps In Entrepreneurship And Education Levels From The Perspective Of Clusters Of European Countries. J. Dev. Entrep. 2021, 26, 2150024. [Google Scholar] [CrossRef]
- Pintrich, P.R.; Groot, E.V. De Motivational and self-regulated learning components of classroom. J. Educ. Psychol. 1990, 82, 33–40. [Google Scholar] [CrossRef]
- Bandura, A. Self-Efficacy: The Exercise of Control; W H Freeman/Times Books/Henry Holt & Co. 1997. Available online: https://psycnet.apa.org/record/1997-08589-000 (accessed on 12 March 2023).
- Eccles, J.S.; Wigfield, A. Motivational beliefs, values, and goals. Annu. Rev. Psychol. 2002, 53, 109–132. [Google Scholar] [CrossRef]
- Wigfield, A.; Eccles, J.S. Expectancy–Value Theory of Achievement Motivation. Contemp. Educ. Psychol. 2000, 25, 68–81. [Google Scholar] [CrossRef]
- Eccles, J.S.; Freedman-Doan, C.; Frome, P.; Jacobs, J.; Yoon, K.S. Gender-role socialization in the family: A longitudinal approach. In The Developmental Social Psychology of Gender; Lawrence Erlbaum Associates Publishers: Mahwah, NJ, USA, 2000; pp. 333–360. [Google Scholar]
- Eagly, A.H.; Wood, W. Social role theory. Handb. Theor. Soc. Psychol. 2012, 2, 458–476. [Google Scholar] [CrossRef]
- Eagly, A.H. Sex Differences in Social Behavior: A Social-Role Interpretation; John, M., Ed.; MacEachran Memorial Lecture Series; 1985; Lawrence Erlbaum Associates, Inc.: Hillsdale, NJ, USA, 1987. [Google Scholar]
- Eagly, A.H.; Wood, W.; Diekman, A.B. Social role theory of sex differences and similarities: A current appraisal. In The Developmental Social Psychology of Gender; Lawrence Erlbaum Associates Publishers: Mahwah, NJ, USA, 2000; pp. 123–174. [Google Scholar]
- Deaux, K.; Lewis, L.L. Structure of gender stereotypes: Interrelationships among components and gender label. J. Pers. Soc. Psychol. 1984, 46, 991–1004. [Google Scholar] [CrossRef]
- Deaux, K.; Winton, W.; Crowley, M.; Lewis, L.L. Level of categorization and content of gender stereotypes. Soc. Cogn. 1985, 3, 145–167. [Google Scholar] [CrossRef]
- Sáinz, M.; Meneses, J.; López, B.-S.; Fàbregues, S. Gender Stereotypes and Attitudes Towards Information and Communication Technology Professionals in a Sample of Spanish Secondary Students. Sex Roles 2016, 74, 154–168. [Google Scholar] [CrossRef]
- Hannover, B.; Kessels, U. Self-to-prototype matching as a strategy for making academic choices. Why high school students do not like math and science. Learn. Instr. 2004, 14, 51–67. [Google Scholar] [CrossRef]
- Sturrock, G.R.; Zandvliet, D.B. Citizenship Outcomes and Place-Based Learning Environments in an Integrated Environmental Studies Program. Educ. Sci. 2023, 13, 292. [Google Scholar] [CrossRef]


Disclaimer/Publisher’s Note: The statements, opinions and data contained in all publications are solely those of the individual author(s) and contributor(s) and not of MDPI and/or the editor(s). MDPI and/or the editor(s) disclaim responsibility for any injury to people or property resulting from any ideas, methods, instructions or products referred to in the content. |
© 2023 by the authors. Licensee MDPI, Basel, Switzerland. This article is an open access article distributed under the terms and conditions of the Creative Commons Attribution (CC BY) license (https://creativecommons.org/licenses/by/4.0/).