Abstract
Though adults tend to endorse the stereotype that boys are better than girls in math, children tend to favor their own gender or be gender egalitarian. When do individuals start endorsing the traditional stereotype that boys are better? Using two longitudinal U.S. datasets that span 1993 to 2011, we examined three questions: (1) What are the developmental changes in adolescents’ gender stereotypes about math abilities from early to late adolescence? (2) Do the developmental changes vary based on gender and race/ethnicity? (3) Are adolescents’ stereotypes related to their math motivational beliefs? Finally, (4) do these patterns replicate across two datasets that vary in historical time? Adolescents in grades 8/9 and 11 were asked whether girls or boys are better at math (n’s = 1186 and 23,340, 49–53% girls, 30–54% White, 13–60% Black, 1–22% Latinx, and 2% to 4% Asian). Early adolescents were more likely to be gender egalitarian or favor their own gender. By late adolescence, adolescents’ stereotypes typically shifted towards the traditional stereotype that boys are better. In terms of race/ethnicity, White and Asian adolescents significantly favored boys, whereas Black and Latinx adolescents were more likely to endorse gender egalitarian beliefs. Adolescents’ stereotypes were significantly related to their expectancy beliefs, negatively for girls and positively for boys.
1. Introduction
Psychologists have studied and attempted to minimize gender gaps in STEM for several decades, yet gender gaps persist to this day [1,2]. Gender gaps in math are of particular concern, as math serves as a gateway to numerous STEM educational opportunities [3]. One possible contributor to the persistent gender gaps in math is if individuals’ stereotypes have not changed historically. Gendered math ability stereotypes, such as the belief that boys are better at math than girls, exacerbate gender gaps by promoting boys in math while hindering girls, who are already marginalized in math [1,4]. Though women historically have made gains in many STEM fields (including math) [5], U.S. media portrayals have not substantially improved [6]. Furthermore, a recent U.S. study suggests that parents’ math ability gender stereotypes have not significantly changed over a 20-year period from 1984 to 2009 [7]. Although the U.S. ranks in the upper third of countries for gender equality (ranking 43 out of 146), it currently ranks below many nations, including most of Europe [8]. Furthermore, the U.S. has a greater gender gap in STEM participation compared to many nations [1]. Examining the potential historical differences in U.S. adolescents’ math stereotypes will help us understand whether these gender stereotypes have persisted like parents’ stereotypes and potentially continue to contribute to gender differences in adolescents’ math motivational beliefs.
Most of the existing research on adolescents’ gender ability stereotypes in math focuses on Whites and does not address developmental changes nor historical differences [9,10], although there are notable exceptions, e.g., [9,11]. Furthermore, replication of research findings is important for our field but seldom investigated [12]. In particular, conceptual replication is valuable because it examines whether effects persist across different demographics, measures, and contexts, which speaks to the robustness of the finding [12,13]. To address these gaps in the literature, the present study explores the prevalence of adolescents’ math ability gender stereotypes and the correlates across two large U.S. datasets that span early and late adolescence and include racially/ethnically diverse adolescents. Though the two longitudinal datasets differ in some respects, testing these processes across these two datasets allowed us to test the extent to which the findings were replicated during two different historical time periods, namely the 1990s and 2010s. Prior research has found that parents’ math gender stereotypes favoring boys [7] and gender differences in math self-concept [2] have not changed during this same period of time. Thus, we wished to explore if adolescent gender stereotypes also have not changed during this time period. Similar endorsement of math gender stereotypes during this time period may help explain why gender differences in math self-concept, in addition to differences in participation in certain STEM fields, remain [1,2].
1.1. Understanding Math Ability Stereotypes through Situated Expectancy-Value Theory and Social Status Theory
Situated expectancy-value theory [14] postulates that gender stereotypes are culturally situated attitudes that influence individuals’ beliefs, choices, and performance. According to this theory, adolescents’ gender stereotypes about a domain like math influence their subsequent motivational beliefs, which are composed of two primary constructs— expectancies for success (how well someone expects to perform in a domain such as math) and subjective task-values (beliefs about how interesting, useful, or important a task is) [14]. Specifically, if an individual believes their gender is generally good at a domain, they are likely to have higher expectancy and value beliefs in that domain [10,15]. Individuals’ motivational beliefs, in turn, are central determinants of their academic and career outcomes throughout life [14]. Thus, adolescents’ gender stereotypes about a domain should have implications for their motivational beliefs and subsequent outcomes in that domain.
Situated expectancy-value theory argues that social position factors, including gender and race/ethnicity, influence where one is situated in society; however, it provides less insight into the specific processes or expectations. To examine why the prevalence of individuals’ math gender stereotypes may differ by social group, we employed social status theory. Social status theory [16] argues that socially privileged groups (e.g., White individuals, boys) are more likely to endorse traditional gender stereotypes because they have more to gain by upholding current social systems. Based on this theory, male, White, and Asian adolescents (particularly White and Asian boys) have more to gain by upholding traditional gender stereotypes about math because of their strong representation, whereas female, Black, and Latinx adolescents (particularly Black and Latina girls) have less to gain from upholding traditional stereotypes and may be more likely to endorse gender egalitarian or non-traditional beliefs. Although White and Asian girls may not directly benefit from the traditional math gender stereotype that boys have stronger math abilities, they may still be more likely to endorse them than Black and Latinx adolescents. This is because members of their family and community (such as their fathers and brothers) may benefit from traditional math gender stereotypes; recent evidence suggests that Asian and White parents are more likely to hold traditional math gender stereotypes than Black and Latinx parents [7]. As a result, Asian and White parents and other family members may be more likely to transmit these beliefs to their children, including their daughters. Additionally, competency and self-reliance are valued as part of Black women’s gender identity [17]. Thus, female, Black, and Latinx adolescents may be less likely to endorse traditional math gender stereotypes, whereas male, Asian, and White adolescents may be more likely to endorse these stereotypes.
Adolescence is an important developmental period to investigate changes in math gender stereotypes because it coincides with cognitive maturation as well as identity development [18,19,20]. Greater endorsement of traditional math gender stereotypes as adolescents move through early to late adolescence is plausible because adolescents have increasingly sophisticated cognitive abilities to apply stereotypes to their own identity and motivational beliefs [20,21]. Moreover, puberty as well as middle and high school settings, may lead adolescents to pay more attention to gendered social comparisons in math classrooms [22]. Adolescents also have a greater lifetime exposure to stereotypes about STEM than younger children and may be in contexts that highlight traditional stereotypes, like advanced STEM courses [22,23]. Thus, adolescents’ traditional stereotypes may become more prevalent with age due to developmental processes and as contexts draw attention to gender and math ability [24].
1.2. Empirical Evidence on the Prevalence and Differences in Adolescents’ Math Ability Gender Stereotypes
Developmental changes. Prior research suggests that individuals’ beliefs may shift to more traditional math gender stereotypes during adolescence. Two U.S. studies among racially/ethnically diverse youth suggest that early adolescents have gender egalitarian views—the belief that both genders are equally good at math—compared to children [25] and late adolescents [10]. One of these studies charted the changes in students’ math gender stereotypes longitudinally; using one of the datasets used in the present study, the researchers found that U.S. adolescents’ gender-stereotyped beliefs became more traditional across high school, and by the eleventh grade, both girls and boys were significantly more likely to believe males are better at math [10]. These patterns align with cross-sectional research on majority-White French and German high school and college students [26,27]. Though several studies suggest that the traditional stereotype that boys are better than girls at math is more prominent in late adolescence, there are some inconsistencies in the literature. One study suggests traditional stereotype beliefs may emerge as early as the ninth grade among majority-White gifted youth in the UK [28], whereas another UK study and a French Canadian study (both majority White) found that adolescents (grades 9–12) and late adolescents (grade 10) hold gender egalitarian beliefs [9,29]. Thus, research conducted among diverse samples in the U.S. has largely found that early adolescents hold gender egalitarian views, which switch to more traditional views in late adolescence [10]. These differences were replicated in some cross-sectional non-U.S. studies [26,27] but not in other studies, potentially because the latter studies had, on average, younger adolescents (e.g., grade 10 versus grade 11) [10,26,29]. Thus, the present study aimed to expand upon the prior literature by examining the replication of changes in adolescent math gender stereotypes in two diverse, longitudinal U.S. datasets that included both early and late adolescents.
Gender differences. Findings from several studies suggest that boys typically endorse traditional gender math stereotypes more often than girls [9,30]. This is potentially because, according to social status theory, boys have more to gain from endorsing these beliefs compared to girls and thus may be more likely to endorse traditional math gender stereotypes [16]. Alternatively, some parents and media may socialize girls not to endorse traditional gender stereotypes. Prior research finds that parents of girls are less likely to endorse traditional math gender stereotypes [7], and parents may be more careful about endorsing traditional gender stereotypes around their daughters. Relatedly, although the media as a whole still largely portrays sexist stereotypes [31], there are some programs and media targeted towards girls that endorse the belief girls can be anything, including being good at math. Thus, endorsing traditional math stereotypes may be more common among boys and may be particularly pronounced among boys in late adolescence, given the prevalence of traditional math stereotypes at that time [27,32,33].
Racial/Ethnic differences. Social status theory suggests that members of groups underrepresented in STEM (i.e., Black and Latinx adolescents) will be less likely to endorse traditional stereotypes in that domain compared to members of groups overrepresented in STEM (i.e., Asian and White adolescents). Findings among Black and White Americans support this assertion [16,34]. For example, one study about gender stereotypes among fourth-, sixth-, and eighth-grade Black and White adolescents found that girls and Black adolescents were less likely to endorse traditional gender stereotypes than their peers [10]. Black girls were the least likely to endorse traditional gender ability stereotypes in math and science, whereas White boys were the most likely to endorse the stereotype [16]. Relatedly, one study among Black seventh and eighth graders found that adolescents, on average, endorsed non-traditional math stereotypes favoring girls [35]. Thus, evidence from several studies in elementary and middle school suggests that Black adolescents may endorse less traditional gender stereotypes than White adolescents, though this has not been tested during high school. Most prior research has taken place among early adolescents when non-traditional or egalitarian views are expected. Research with late adolescents and longitudinal research across adolescence is needed to chart the developmental changes in Black adolescents’ math gender stereotypes.
Moreover, few studies examine the prevalence of math ability gender stereotypes among Latinx and Asian adolescents. Much of the existing research focuses on citizens of Asian countries rather than Asian Americans; thus, it is unclear to what extent these findings generalize to Asian adolescents in the U.S. Similar to Asian families, Latinx families have been found to endorse more traditional gender roles [36]. However, this may not translate to more traditional math ability gender stereotypes for Latinx adolescents, given that two studies found Latinx mothers and parents had gender egalitarian views about individuals’ math abilities [7,30], which were significantly less traditional than Asian and White parents’ stereotypes [7]. Two additional studies among adult women found Latina women had significantly less traditional STEM-gender implicit stereotypes compared to White women [37,38]. Thus, past studies suggest that Asian adolescents might endorse more traditional math gender stereotypes similar to White adolescents, whereas Latinx adolescents may endorse less traditional stereotypes similar to Black adolescents, although it remains an open question among Asian and Latinx adolescents. It is important to explore math gender stereotypes among Asian and Latinx adolescents for multiple reasons. First, both racial/ethnic groups comprise sizable portions of the U.S. school age population and are some of the fastest growing racial/ethnic groups. Second, it is important to explore math gender stereotypes among Asian and Latinx adolescents because we cannot assume that the patterns for White families generalize to other groups, as emerging evidence among Black and White adolescents suggests stereotype processes vary by racial/ethnic group [16]. Finally, studying stereotypes of Asian and Latinx adolescents has critical theoretical implications. Both ethnic groups culturally endorse traditional gender roles, yet differ in their representation in STEM, which makes for an interesting theoretical test of social status theory [16].
1.3. Adolescents’ Math Gender Stereotypes and Motivational Beliefs
According to situated expectancy-value theory, adolescents’ gender stereotypes about math should shape their math motivational beliefs (such as expectancy-value beliefs) [14]. One study among high school students in the U.S. linked traditional math gender stereotype endorsement to lower math motivational beliefs for girls and higher beliefs for boys [10]. However, another study among U.S. fourth, sixth, and eighth graders (54% White, 30% Black) found that traditional gender stereotypes were positively related to boys’ expectancy beliefs but not significantly related to girls’ beliefs [39]. Much of past research has been conducted among children; however, it is also important to explore these relations replicated during late adolescence, when stereotypes are theorized to become more traditional and thus may be more likely to benefit boys while harming girls. Furthermore, it is important to explore the extent to which these processes replicate among Asian, Latinx, and Black adolescents in the U.S. or the extent to which the relations may differ across these groups. For example, because of the model minority stereotype, Asian adolescents may be stereotyped in school and society as excelling at math, regardless of gender [40]. Furthermore, studies have found that Asian adolescents do not demonstrate the gender differences in math motivational beliefs that White adolescents do [2,11,41]. However, stereotype threat research indicates that while highlighting Asian identity may improve performance among Asian American women, highlighting female identity may lower performance [42]. This suggests that gender-based stereotypes about math still affect Asian American women and girls. Relatedly, given that Latino boys are often stereotyped as not doing well academically by teachers [22], math gender stereotypes may not benefit them in the same way they do White boys. Thus, our study adds to this body of literature by testing the extent to which racially/ethnically diverse U.S. adolescents’ gender stereotypes are related to their expectancy and value beliefs in two longitudinal datasets that span early and late adolescence and differ in terms of historical time.
1.4. Current Study
Based on situated expectancy-value theory [14], adolescents’ gender stereotypes about math ability should vary by age, gender, or race/ethnicity and be differentially related to their expectancy-value beliefs. We utilized two large, longitudinal datasets that included early adolescents at the first time point (eighth and ninth grades) and late adolescents at the second time point (eleventh grade) from the mid-1990s to the 2010s. The two datasets were identified by consulting experts in the field and searching for datasets in databases of publicly available data (e.g., IES, OSF, and the Henry A. Murray Research Archive at Harvard) using terms such as “math gender stereotypes”. These two datasets were included because they had data on math gender stereotypes and expectancy-value belief questions on adolescents in the U.S.; other datasets did not include both types of data for this age group. Using multiple datasets also afforded us the ability to test for conceptual replication across historical time, study design, and races/ethnicities, to see whether the results are similar across the datasets. Scholars argue that conceptual replication provides more compelling evidence than exact replication [12] because it addresses the robustness of the findings across different participant demographics, measures, and contexts [13]. As an open research question, we examined conceptual replication and historical differences in prevalence.
Based on the reviewed literature and situated expectancy-value theory [14], we examined the following hypotheses:
1.4.1. Hypothesis 1: Changes in the Prevalence of Math Gender Stereotypes over Time
Based on past research [10], we expected adolescents to move from same-gender biased or egalitarian gender stereotypes in early adolescence (eighth/ninth grades) to traditional stereotypes favoring boys in late adolescence (eleventh grade). Additionally, we expected this pattern to replicate across the two datasets, given that past research has found these developmental differences, and parents’ stereotypes and youth’s math self-concepts have not changed over historical time. Finally, we explored if these changes varied based on gender and race/ethnicity.
1.4.2. Hypothesis 2: Group Differences in the Prevalence of Math Gender Stereotypes
Based on past research [43], we expected that boys would hold significantly more traditional math gender stereotypes at all grade levels compared to girls. Furthermore, based on past research and theory [16], we expected that even though Asian and White adolescents would take the developmental path outlined above (favoring their own gender in early adolescence but boys in late adolescence), Black and Latinx adolescents would largely be gender egalitarian or favor their own gender across adolescence. Additionally, we expected that Asian and White adolescents would hold significantly more traditional math gender stereotypes at all grade levels compared to Black and Latinx. We expected these patterns to replicate across the two datasets, given a past study found that parent gender stereotypes (including racial/ethnic differences) were replicated across four datasets [7].
1.4.3. Hypothesis 3: Adolescents’ Math Gender Stereotypes in Relation to Their Math Motivational Beliefs
We expected that more traditional gender stereotypes would be positively associated with math expectancy and value beliefs among boys but negatively associated with expectancy and value beliefs among girls. We additionally wished to explore these relations within each racial/ethnic group. We expected these patterns to replicate across both datasets, given past research has found these patterns, e.g., [10].
2. Method
2.1. Datasets
This present study used two longitudinal datasets. The first was a large, local dataset: the Maryland Adolescent Development in Context Study (MADICS). The second dataset was a large nationally representative dataset: the High School Longitudinal Study (HSLS). For more information on MADICS, including study questionnaires, see https://garp.education.uci.edu/madics.html (accessed on 21 August 2023). For more information about HSLS, see the National Center for Education Statistics website [44].
For this paper, we used all waves when the math gender stereotype data were collected in each dataset; MADICS and HSLS included the stereotype data at two waves—either the eighth or ninth grades and the eleventh grade. Adolescents were excluded from our sample if they were missing data for (a) their gender (MADICS n = 11; HSLS n = 0) or (b) their stereotype data at both time points (MADICS n = 285; HSLS n = 160). Detailed descriptions of the participants in the analytic sample for each study are in Table 1 and below.

Table 1.
Participants by dataset.
2.1.1. Maryland Adolescent Development in Context Study (MADICS): Eighth and Eleventh Grades
MADICS is a longitudinal study following one cohort of 1482 adolescents (49% girls) and their families. The sample includes primarily Black (60% of the sample) and White (30%) families (in addition to 15 Latinx families, 20 Asian families, and 93 families that were multiethnic or another race/ethnicity) from a range of socioeconomic statuses in Maryland and the D.C. area. The present study used data from adolescents in Waves 3 and 4 (1993 and 1996) when adolescents were in the eighth (ages 13–14; n = 1043) and eleventh grades (ages 16–17; n = 855).
2.1.2. High School Longitudinal Study (HSLS): Ninth and Eleventh Grades
HSLS is a longitudinal and nationally representative study of more than 20,000 adolescents (49% girls, 54% White, 17% Latinx, 11% Black, and 9% Asian) from 944 schools in the U.S. Eligible schools and adolescents were selected using a random, stratified sample design. The present study used data from adolescents in Wave 1 (2009) and Wave 2 (2012) when adolescents were in the ninth grade (ages 14–15; n = 20,720) and eleventh grade (ages 16–17; n = 20,010). To be representative of the U.S. population, analyses in this study were adjusted using the analytic weight W2STUDENT, strata, and clusters.
2.2. Measures
HSLS and MADICS included the same constructs with slight item-level variations, allowing us to examine conceptual replication [12]. For a full list of items by dataset, see Supplementary Table S1.
2.2.1. Adolescents’ Math Ability Gender Stereotypes
Adolescents in HSLS and MADICS reported their gender math ability stereotypes using a similar item [45]. This item was measured in the ninth and eleventh grades in HSLS and the eighth and eleventh grades in MADICS; these were the only two time points the question was asked in both datasets. In the HSLS dataset, they were asked, “In general, how would you compare males and females in math?” (1 = females much better to 5 = males much better). In the MADICS dataset, adolescents were asked, “Who is better at math and science, girls or boys?” (1 = girls are a lot better, 2 = girls are somewhat better, 3 = girls and boys are the same, 4 = boys are somewhat better, and 5 = boys are a lot better). Adolescents’ responses were recoded. The response “girls and boys are the same” was set to 0. Responses that endorsed the belief that girls are better at math were set to be below 0 (−1 = girls are somewhat better, −2 = girls are a lot better). Responses that reflected the traditional belief that boys are better at math were set to be above 0 (1 = boys are somewhat better, 2 = boys are a lot better).
Past research about math gender stereotypes has used this item [10,24,45]. The item has strong face validity as well as criterion validity because it directly asks about ability stereotypes, and prior research has found that the item significantly correlates with other scales in the expected direction [24]. Furthermore, prior research indicates that single items perform similarly to scales [46,47,48], and the use of a single item allows adolescents to endorse the belief that girls are better at math, that boys are better, or that both genders are the same at math [10].
2.2.2. Adolescents’ Math Expectancy and Value Beliefs
Both HSLS and MADICS had math expectancy and value belief items based on Eccles’ situated expectancy-value model that prior work has validated [49,50]. The expectancy belief scale had three items in MADICS (eighth grade: alpha = 0.82; eleventh grade: alpha = 0.85) and four items in HSLS (ninth grade: alpha = 0.89; eleventh grade: alpha = 0.90). An example expectancy belief item is “How good at math are you?” (1 = not at all good, 7 = very good). The value belief scale was three items in MADICS (eighth grade: alpha = 0.68; eleventh grade: alpha = 0.64) and six items in HSLS (ninth grade: alpha = 0.80; eleventh grade: alpha = 0.80). An example value belief item is “In general, how useful is what you learn in math?” (1 = not at all useful, 7 = very useful). HSLS used a response scale of 1–4, and MADICS used a 1–5 response scale for two value questions and a 1–7 scale for the remaining question; in order to combine the three items, the 1–5 response scale was converted to a 1–7 scale using a linear transformation. For more information regarding psychometric properties such as measurement invariance, see [41,51] (HSLS) and [52] (MADICS).
2.2.3. Background and Covariates
For the present analyses, we examined potential variations based on adolescent gender (girl or boy, reported by adolescents) and adolescent race/ethnicity (Asian, Black, Latinx, White, or other, reported by adolescents). Additionally, we controlled for household income (reported by the caregivers) and highest caregiver education (reported by the caregivers).
2.3. Plan of Analysis
Data were analyzed in SPSS version 26 for MADICS, and STATA version 14.1 or R version 4.0.1 and Rstudio were used for HSLS. The proportion of missing values across the two datasets ranged from 11–12% for adolescent gender stereotypes in early adolescence, 14–25% for adolescent gender stereotypes in late adolescence, 11–19% for motivational beliefs items, and 0–28% for family income and parent education level. Missing data were imputed if adolescents had stereotype data from at least one single time point. Within each dataset, we compared adolescents who were missing some data to adolescents who had complete data. In MADICS, participants who were missing some data reported significantly lower family incomes (d = 0.22) and parent education (d = 0.13), were more likely to be boys than girls (φ = 0.09) and were more likely to be Black than White (φ = 0.04) (ps < 0.003) compared to adolescents with complete data. There were no significant differences in adolescents’ math motivational beliefs or math gender stereotypes (ds = −0.07–0.02; ps < 0.089). In HSLS, participants with some data missing reported a significantly lower parent education (d = 0.29), family income (d = 0.28), and math motivational beliefs (ds = 0.07–0.15); had more traditional math gender stereotypes (ds = 0.06–0.11); were more likely to be boys (φ = 0.04); and were more likely to be Asian (φ = 0.05), Black (φ = 0.05), Latinx (φ = 0.05), and less likely to be White (φ = −0.12) (all ps < 0.001) compared to adolescents with complete data. Thus, although there were significant differences between adolescents with missing data and those with complete data, all effects were small or less than small. Missing data in both datasets were handled by multiple imputations [53]. Thirty datasets were imputed in SPSS using auxiliary variables that included data from other time points, demographic data, and transcript data (e.g., math grade and SES).
2.3.1. Hypothesis 1: Changes in the Prevalence of Math Gender Stereotypes over Time
To understand the prevalence of adolescents’ math gender stereotypes, it is important to describe how much these beliefs change over time and the extent to which those changes vary across groups. For Hypothesis 1, we expected adolescents would hold more traditional math gender stereotypes in late adolescence (i.e., eleventh grade) compared to early adolescence (i.e., eighth grade in MADICS and ninth grade in HSLS). We expected that this would replicate across the two datasets. We examined these changes through three steps: (a) repeated measures MANCOVAs in each dataset, (b) a series of one-sample t-tests in each dataset, and (c) testing the extent to which these effects replicate across the two datasets.
First, we examined the overall changes in adolescents’ math gender stereotypes and the extent to which these changes varied across gender and race/ethnicity with repeated measures MANCOVA. We estimated one repeated measure MANCOVA in each dataset to investigate (a) the main effects of time, gender, and race/ethnicity, as well as (b) the interactions between time, gender, and race/ethnicity. We ran this MANCOVA both with and without using family income and parent education as the covariates; for the analyses with covariates, please see the Supplementary Materials. p-values and the effect sizes (eta squared) were used to determine meaningful significance. These analyses describe the extent to which there were changes in adolescents’ math gender stereotypes and whether these changes varied across groups (e.g., boys and girls); however, they provide less information on what the changes look like for each group or if adolescents favor a particular gender or if their stereotypes significantly differ from gender egalitarian views. For instance, girls’ stereotypes might shift from slightly favoring their own gender to slightly favoring boys over time, but these stereotypes may not differ from gender egalitarian beliefs at either time point. For that, we employed one-sample t-tests.
We examined the prevalence of these math gender stereotypes in early and late adolescence within each gender and racial/ethnic group using a series of one-sample t-tests, which examined the extent that each group’s mean differed from zero. Because zero was coded to signify gender egalitarian beliefs (i.e., believing boys and girls are equally good at math), these t-tests examine the extent to which participants in each group hold egalitarian beliefs or favor one gender (and which gender they favor). For example, if early adolescents are more egalitarian as expected, boys’ and girls’ means should not significantly differ from zero, though they may still change over time. If late adolescents favor boys as expected, then boys’ and girls’ means should be different from zero with positive means, which indicates they favor boys, on average. In each dataset, we tested these one-sample t-tests for girls and for boys overall, which included all racial/ethnic groups, as well as for girls and for boys in each racial/ethnic group. For example, in MADICS, we estimated six one-sample t-tests: girls overall, boys overall, Black girls, White girls, Black boys, and White boys.
Finally, we examined the extent to which the analyses in the first two parts, namely the MANCOVA and one-sample t-tests, were replicated across the two datasets. After calculating the means, standard deviations, and effect sizes within each dataset separately, we used random-effects models to estimate the combined effect, or an average effect size across the datasets adjusted for sample sizes using Comprehensive Meta-Analysis, version 3.3 (CMA, [54]). In addition to the combined effect size, we obtained two statistics (Cochran’s Q and I2) that describe the heterogeneity of the effect sizes across the datasets. A significant Cochran’s Q statistic indicates that there is significant heterogeneity across datasets, whereas the I2 indicates the percentage of variance that differs between datasets [55,56].
2.3.2. Hypothesis 2: Group Differences in the Prevalence of Adolescents’ Math Gender Stereotypes
A second important aspect in understanding the prevalence of adolescents’ math gender stereotypes is describing the differences across groups. We expected boys would have more traditional stereotypes than girls. We also expected that Asian and White adolescents would have more traditional stereotypes than Black and Latinx adolescents. We tested these two hypotheses with the gender and race/ethnicity main effects and the gender by race/ethnicity interaction from the MANCOVA described under Hypothesis 1. A MANCOVA was estimated for each dataset separately. We examined the extent to which these findings replicated across datasets using the random-effects models described under Hypothesis 1.
2.3.3. Hypothesis 3: Adolescents’ Math Gender Stereotypes in Relation to Their Math Motivational Beliefs
We hypothesized that adolescents’ math gender stereotypes would significantly relate to their motivational beliefs (positively for boys, negatively for girls). Regressions controlling for parent education and income were run by grade and gender for adolescents’ stereotypes and math motivational beliefs. Parent education and income were controlled for, given they are related to adolescents’ motivational beliefs [57]. A regression was estimated separately at each grade level and for each gender in each dataset, and by race/ethnicity. We did not test if the regression coefficients replicated across the two datasets, as it is not appropriate to compute the relevant statistics (Cochran’s Q and I2) across regression coefficients [58]. Instead, to compare whether the effects were similar across datasets, gender, and race/ethnicity, we plotted the unstandardized B coefficients with 95% confidence intervals (using unstandardized coefficients is recommended when the predictor variable is easy to understand, which is the case with a single item predictor; [59]). This approach has been recommended to compare the effects [60].
3. Results
3.1. Hypothesis 1: Prevalence of Math Gender Stereotypes
3.1.1. Changes from Early to Late Adolescence
We anticipated that early adolescents would hold more gender egalitarian beliefs (i.e., endorse the belief that both genders are equal), and late adolescents would report more traditional stereotypes (i.e., the belief that boys are better than girls at math). To test this, we investigated age-related changes through repeated measures MANCOVAs (see Supplementary Materials for the results where we controlled for family income and parent education; the results were largely similar with one exception: in MADICS, the time by gender stereotypes main effect was no longer significant). As expected, boys’ and girls’ stereotypes significantly became more traditional from the eighth to eleventh grades in MADICS [F(1) = 9.68, p = 0.002, ηp2 = 0.014] and from the ninth to eleventh grades in HSLS [F(1) = 510.77, p = < 0.001, ηp2 = 0.022]. Overall, the longitudinal data supported our hypothesis that gender stereotypes would become more traditional by late adolescence, which was replicated in both datasets.
Next, we tested if these changes varied by gender and race/ethnicity. One of the six interactions was statistically significant. Specifically, the grade by gender interaction was statistically significant in HSLS [F(1) = 54.40, p < 0.001, ηp2 = 0.002], indicating that girls had larger increases towards the traditional stereotype over adolescence than boys in HSLS. This interaction was not significant in MADICS [F(1) = 0.34, p = 0.562]. The grade by race/ethnicity interaction was not significant in either MADICS [F(3) = 0.095, p = 0.758] or HSLS [F(3) = 1.258, p = 0.287], and neither was the three-way interaction between grade, gender, and race/ethnicity in MADICS [F(1) = 0.861, p = 0.489] nor HSLS [F(1) = 2.612, p = 0.074]. Thus, there were mixed findings concerning whether the changes in adolescents’ stereotypes were larger for girls than boys and that there was no evidence that the changes varied by race/ethnicity.
3.1.2. Prevalence in Early Adolescence
We expected that early adolescents, on average, would endorse gender egalitarian beliefs. Unexpectedly, the t-tests suggested early adolescents largely favored their own gender as their ratings significantly differed from zero in favor of their own gender. This finding emerged for girls in both datasets and boys in HSLS; the one exception was that boys in MADICS, on average, held gender egalitarian beliefs as their mean did not significantly differ from zero (Table 2).
Table 2.
Math gender stereotypes by race and gender: One-sample t-tests investigating whether the means for boys and girls significantly differ from egalitarianism (0).
Additionally, favoring their own gender seemed more pronounced for girls than boys. Girls evidenced small effect sizes, ranging from −0.25 among eighth graders in MADICS to −0.15 among ninth graders in HSLS, with a combined effect size of −0.19 (Figure 1). The size of this effect significantly varied across the two datasets [Q(1) = 4.537, p = 0.033, I2 = 77.958], with the effect of girls’ favoring their own gender being more pronounced in MADICS than HSLS. The effect sizes for boys were negligible, ranging from 0.00 in the eighth grade in MADICS to 0.05 in the ninth grade in HSLS, with a combined effect size of 0.05; the size of the effect was similar across the two datasets [Q(1) = 2.716, p = 0.099, I2 = 63.180]. Despite the differences in the t-tests, many early adolescents endorsed gender egalitarian beliefs. Seventy-nine percent (79%) of early adolescents in MADICS (eighth grade) and 58% of early adolescents in HSLS (ninth grade) endorsed the belief that females and males are equally good at math (see Figure 2a,b).

Figure 1.
Adolescents’ math gender stereotypes: effect sizes (Cohen’s d) by grade and gender. Effect sizes to the left indicate bias towards girls/females, and effect sizes to the right indicate bias towards boys/males. HSLS SOURCE: U.S. Department of Education, Institute of Education Sciences, National Center for Education Statistics, High School Longitudinal Study of 2009 (HSLS:09), Base Year and First Year Follow-Up.
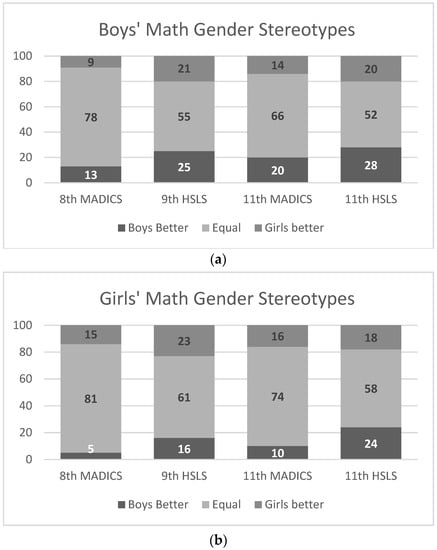
Figure 2.
(a) Boys’ math gender stereotypes frequencies. (b) Girls’ math gender stereotypes frequencies. Frequency of answers to the question “Who’s better at math?” by gender and grade. HSLS SOURCE: U.S. Department of Education, Institute of Education Sciences, National Center for Education Statistics, High School Longitudinal Study of 2009 (HSLS:09), Base Year and First Year Follow-Up.
3.1.3. Prevalence in Late Adolescence
In late adolescence, we expected both genders to endorse the more traditional beliefs that boys are better at math compared to girls. We found evidence for this trend among boys and partial evidence among girls. In both MADICS and HSLS, boys in the eleventh grade were significantly more likely to endorse the traditional gender stereotype (Table 2), with 28% saying boys are better than girls (Figure S1a). The size of these effects for boys was a negligible to small bias towards boys in both datasets, ranging from 0.09 in MADICS and 0.16 in HSLS, with a combined effect size of 0.11 (Figure 1); this effect was significantly larger in HSLS than MADICS [Q(1) = 6.903, p = 0.009, I2 = 85.513]. The pattern for girls in the eleventh grade varied by dataset. In MADICS, girls still favored their own gender. In HSLS, girls were significantly more likely to say that boys are better than girls at math, with 24% of girls saying boys are better than girls (Figure S1b). Among girls in late adolescence, the effect sizes were negligible, ranging from a slight bias towards girls (d = −0.09) in MADICS to a slight bias towards boys (d = 0.10) in HSLS, with a combined effect size of 0.01 (Figure 1); these effects significantly varied across the two datasets [Q(1) = 20.874, p < 0.001, I2 = 95.209]. In sum, late adolescent boys in both datasets and girls in HSLS were significantly more likely to favor the traditional beliefs that boys are better at math than girls; however, the effect sizes were less than small and did not replicate across the two datasets.
3.2. Hypothesis 2: Group Differences in Prevalence
3.2.1. Stereotype Prevalence by Gender
As expected, the MANCOVA gender main effect showed that boys had more traditional math gender stereotypes compared to girls in the two datasets [MADICS: F(1) = 36.65, p < 0.001, ηp2 = 0.02; HSLS F(1) = 170.94, p < 0.001, ηp2 = 0.01]. The means are shown in Table 2, and the effect sizes are shown in Figure 1, while the frequencies of gender stereotype endorsement by gender at each grade level are presented in Figure S1a,b. In sum, as expected, boys had more traditional math gender stereotypes than girls.
3.2.2. Stereotype Prevalence by Race/Ethnicity
We also tested for race/ethnic differences and the prevalence of gender stereotypes with each racial/ethnic group (Table 2). The MADICS dataset included Black and White adolescents, and HSLS included Asian, Black, Latinx, and White adolescents.
As expected, the racial/ethnic main effect in the MANCOVAs indicated significant differences. In MADICS, White adolescents had significantly more traditional math gender stereotypes than Black adolescents [F(1) = 11.56, p = 0.001, ηp2 = 0.011], which aligns with our hypothesis. This finding was replicated in the HSLS dataset, where White and Asian adolescents, who had similarly traditional stereotypes, were more traditional in their beliefs than Black and Latinx adolescents, who had similar non-traditional stereotypes [F(1) = 46.52, p < 0.001, ηp2 = 0.007].
Using the MANCOVA, we also examined whether these racial/ethnic differences emerged for boys and girls through the race/ethnicity by gender interaction term. The interaction term was not statistically significant in MADICS [F(1) = 0.08, p = 0.774], but was in HSLS [F(3) = 10.53, p < 0.001, ηp2 = 0.002]. Pairwise comparisons suggest that the racial/ethnic differences varied across boys and girls. Parallel to the racial/ethnic main effect described earlier, Asian boys had the most traditional stereotypes (ninth grade: ps < 0.001; eleventh grade: ps = 0.003 to < 0.001), followed by White boys (ninth grade: ps = 0.134–0.579; eleventh grade: ps < 0.001), followed by Black and Latino boys (who did not significantly differ from each other; ninth and eleventh grades: ps = 0.791–1.000). In contrast, White girls had more traditional stereotypes than Black and Latina girls (ninth and eleventh grades: ps < 0.001), and Asian and Latina girls had more traditional math gender stereotypes than Black girls (ninth grade: ps < 0.001; eleventh grade: ps = 0.019 to <0.001). Asian girls did not significantly differ from Latina and White girls at either grade level (ps = 0.182 to 0.796). The racial/ethnic differences among boys largely parallel the differences found overall, whereas the racial/ethnic differences among girls varied from the overall findings, with White girls having the most traditional beliefs and no differences among Asian and Latina girls.
Next, we examined the prevalence of adolescent gender stereotypes within each racial/ethnic group (see Table 2). As expected, White and Asian boys had the most traditional gender stereotypes in early and late adolescence (Asian boys: d = 0.20 to 0.33; White boys: = 0.06 to 0.19). In contrast, early adolescent Black and Latina girls had the most non-traditional stereotypes, favoring girls (Black girls combined effect: = −0.30; Latina girls: d = −0.23). By late adolescence, Black girls still held non-traditional stereotypes, favoring girls, but with negligible effect sizes (combined effect: = −0.08), and Latina girls were gender egalitarian (d = 0.03). Thus, as expected, Asian and White boys were the most traditional, particularly in late adolescence, whereas Black and Latina girls were the least traditional, particularly in early adolescence. Both groups became more traditional across adolescence but did not switch from favoring one gender to the other.
In contrast, Asian and White girls and Black and Latino boys both switched from non-traditional or egalitarian beliefs to traditional beliefs during adolescence. Asian and White girls typically held non-traditional stereotypes in early adolescence (Asian girls: d = −0.15; White girls combined: = −0.10), but held traditional stereotypes favoring boys in late adolescence, with negligible to small effect sizes (d = 0.11 to 0.16). Black boys were gender egalitarian in early adolescence (combined: = 0.01), but held traditional stereotypes in late adolescence, with negligible effect sizes (d = 0.04 to 0.06). Thus, Asian and White girls and Black and Latino boys both switched to having traditional math gender stereotypes by late adolescence.
White and Black adolescents were included in both datasets, affording us the opportunity to test if the effect sizes replicated across the two datasets (Figure 3a,b). We found that the effect sizes replicated for seven of the eight comparisons, including Black adolescents and White boys in early and late adolescence, and White girls in early adolescence (ps = 0.354–0.998). The one exception was White girls in late adolescence [Q(1) = 3.993, p = 0.046, I2 = 74.955]. In this case, White girls in HSLS held traditional stereotypes, with a small effect size (d = 0.16), whereas White girls in MADICS endorsed gender egalitarianism (d = 0.01). Thus, the results largely replicated across the datasets for Black and White adolescents.
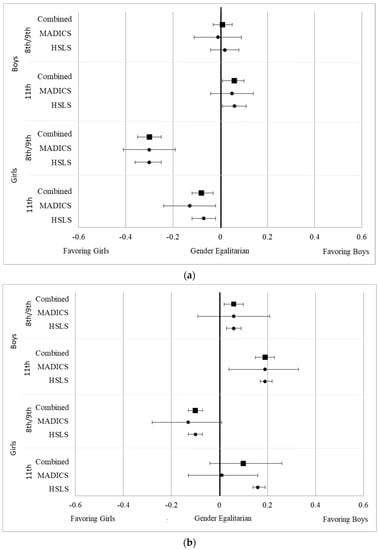
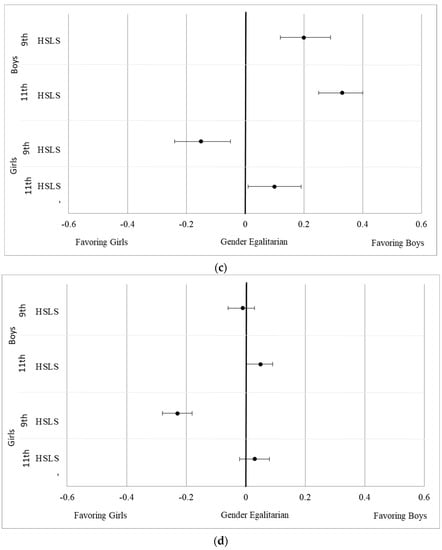
Figure 3.
(a) Black adolescents’ math gender stereotypes: effect sizes by grade and gender. (b) White adolescents’ math gender stereotypes: effect sizes by grade and gender. (c) Asian adolescents’ math gender stereotypes: effect sizes by grade and gender. (d) Latinx adolescents’ math gender stereotypes: effect sizes by grade and gender.
In conclusion, White adolescents had more traditional stereotypes than Black adolescents that were replicated across datasets. When additionally considering Asian and Latinx adolescents, Asian and White adolescents had more traditional stereotypes than Black and Latinx adolescents. When looking within race and gender groups, math stereotype effect sizes were replicated across the datasets in all cases except among White girls.
3.3. Hypothesis 3: Adolescents’ Math Gender Stereotypes and Motivational Beliefs
Regressions were used to examine the associations between adolescents’ stereotypes and motivational beliefs while controlling for parent income and education (see Table 3, see Supplementary Table S2 for the full regression model). We first describe the patterns across all racial/ethnic groups and then separately for each racial/ethnic group. Across the full sample, adolescents’ traditional gender math ability stereotypes were positively related to boys’ expectancy beliefs (β = 0.23 to 0.27) and negatively related to girls’ expectancy beliefs (β = −0.17 to −0.28) in early and late adolescence in both datasets with one exception—the relation was marginally significant for early adolescent girls in MADICS (β = −0.16). Regarding value beliefs, adolescents’ stereotypes were positively related to boys’ value beliefs (β = 0.10 & 0.20) and negatively related to girls’ value beliefs in HSLS (β = −0.10 & −0.15) but were largely not related in MADICS (β = −0.23 to 0.13). Overall, our hypothesis that math gender stereotypes would significantly relate to expectancy and value beliefs was largely supported.
Table 3.
Regression analysis coefficients: gender stereotypes and motivational beliefs, by grade and gender.
Next, we examined these same relations within each racial/ethnic group (see Table 3). The positive relations found between boys’ stereotypes and their expectancy beliefs overall replicated/emerged among Asian, Latinx, and White boys (β = 0.14 to 0.48) but were largely not significant for Black boys (β = 0.04 to 0.23). Similarly, the negative relations found between girls’ stereotypes and their expectancy beliefs largely replicated across Asian, Black, Latinx, and White girls (β = −0.49 to −0.04). Thus, across races/ethnicities and time points, stereotypes were largely positively related to expectancy beliefs for boys but negatively related for girls. Regarding value beliefs among boys, the relations were largely not significant for boys in early adolescence (β = −0.12 to 0.14) but largely were positively and significantly related in late adolescence for Asian, Black, Latinx, and White boys (β = 0.00 to 0.29). Among girls, value beliefs were significantly and negatively related to stereotypes for White and Latinx girls in early adolescence (β = −0.18 to −0.16) and for Asian, Black, and White girls in late adolescence (β = −0.12 to −0.49). However, the relations during late adolescence for girls were largely not statistically significant for the value beliefs in MADICS. Thus, expectancy beliefs were consistently related to adolescents’ math gender stereotypes across race/ethnicities and the datasets in early and late adolescence; however, value beliefs were only consistently related in late adolescence in the HSLS dataset.
We plotted the regression coefficients with 95% confidence intervals to examine whether the coefficients varied across the racial/ethnic groups and datasets (see Supplementary Figures S1a–d and S2a–d). The confidence intervals of the regression coefficients overlapped in all but two cases, both within the HSLS dataset. Among early adolescent boys, the positive relation between math gender stereotypes and value beliefs was larger for White boys than Latino boys. Additionally, among late adolescent girls, the negative relation between math gender stereotypes and expectancy beliefs was larger among Asian girls than White and Latinx girls. Asian and White boys had large, overlapping positive relations for expectancy beliefs, whereas girls’ across races/ethnicities had negative relations of similar strength for expectancy beliefs in early adolescence. In sum, relations between gender stereotypes and motivational beliefs largely overlapped across Asian, Black, Latinx, and White adolescents.
4. Discussion
Gender gaps continue to persist in STEM, despite psychologists’ attempts to study and minimize these gaps [1,2]. One potential reason for gender gaps is the traditional stereotype that boys are better at math than girls [1,4]. However, existing research has not systemically charted the changes in adolescents’ stereotypes nor if these normative developmental processes vary across the four largest racial/ethnic groups in the U.S. Furthermore, much of the existing research focuses on a single dataset, and few studies examine replication or historical differences. Using two longitudinal datasets, we examined four primary research questions. First, how do individuals’ gender stereotypes about math ability change across adolescence? Second, do these changes vary based on gender and race/ethnicity? Third, are adolescents’ math ability gender stereotypes related to their math expectancy and value beliefs? Finally, do these findings replicate across the two datasets that spanned over 20 years? Findings from this study make several contributions in terms of extending the existing literature and implications for theory and applied work.
4.1. The Prevalence and Changes in Gender Stereotypes
We found that individuals’ traditional stereotypes increased from early to late adolescence for all gender and racial/ethnic groups in both datasets. We know from prior research that children favor their own gender [24], whereas parents endorse traditional math gender stereotypes [7]. The current findings suggest that adolescence is a period characterized by changes in math ability stereotype beliefs and that individuals’ more traditional beliefs may emerge by late adolescence and persist well into adulthood. Gender stereotypes about math, paired with cultural values that emphasize “following your passions”, may result in adolescents relying on stereotypes to choose majors and careers, resulting in STEM gender gaps [61]. However, it is important to note that although math gender stereotypes moved toward being more traditional for all racial/ethnic groups, Black and Latina girls did not hold traditional stereotypes in late adolescence. Instead, they held gender egalitarian or non-traditional views. These findings help discern the prior mixed cross-sectional work on age differences. Thus, understanding when increases occur for each group defined by the intersection of race/ethnicity and gender is an important contribution, as it allows for a deeper understanding of math gender stereotype development and indicates when interventions might be most helpful and for whom.
Increases towards the traditional stereotype were theorized to occur in adolescence for multiple reasons. First, adolescents have the cognitive capacity to connect their social groups’ stereotypes to themselves [20,62,63]. Second, because adolescence is a period of intense identity development, adolescents have the motivation to relate these social group stereotypes to their own identity and motivational beliefs [18,21]. Adolescents look to important people in their lives and society more broadly to help them understand their social groups’ identities and, in turn, decide who they are [50]. Finally, many adolescents take advanced STEM coursework in late high school, and teacher practices in advanced math courses, such as allowing adolescents to shout out answers, may privilege boys while silencing girls [22]. Thus, although a significant portion of advanced math courses is comprised of girls (predominantly Asian and White girls), research suggests that girls are treated differently than boys in advanced math courses, which helps to explain why gender stereotypes about math and gender gaps in STEM persist, despite having a larger representation [22]. In sum, we found that traditional stereotypes increased from early to late adolescence in both datasets. These more traditional stereotypes have been found to persist through adulthood [7,10], helping us to understand the developmental time point when traditional math gender stereotypes begin to emerge.
Racial/Ethnic and Gender Comparisons
As hypothesized, Black and Latinx adolescents had less traditional stereotypes compared to Asian and White adolescents, and girls had less traditional stereotypes than boys. When examining the intersection of gender and race/ethnicity, the findings suggest that Black girls had the least traditional math gender stereotypes, whereas Asian and White boys had the most traditional math gender stereotypes, which aligned with our hypothesis. Other studies among Asian, Black, Latinx, and White U.S. high school students [10] and among Black U.S. families with adolescents and children [16,35] report similar findings. Social status theory [16] suggests that Black and Latinx adolescents and girls may be less likely to endorse traditional gender stereotypes, as disenfranchised groups have less to gain by upholding the status quo and may be more aware of social justice issues. Overall, our study indicates that Black and Latinx adolescents, particularly Black girls, were significantly less likely to endorse traditional math gender stereotypes when compared to White and Asian adolescents, particularly White and Asian boys.
The finding that Black adolescents demonstrated less traditional stereotypes compared to White adolescents replicated across the two datasets, which spanned nearly 20 years and used different methodologies (e.g., a nationally representative study versus a local study based in Maryland/D.C.). The one exception was that the prevalence of White girls’ stereotypes in the eleventh grade did not replicate across the datasets. White girls held gender egalitarian beliefs in MADICS (collected in 1996), but traditional stereotypes favoring boys as better at math in HSLS (collected in 2012). Though one might expect girls’ math ability stereotypes might become less traditional over historical time, this difference may have also resulted from methodological differences. For example, HSLS is a large national sample, whereas MADICS is a smaller, local sample from an urban area near Washington, D.C. Prior research finds that people in urban areas tend to have more progressive views than the rest of the country, which may have resulted in less traditional math gender stereotypes among White girls in the MADICS dataset [64]. However, it is unclear why this difference across datasets was only observed among White girls.
Our study is one of the first to examine math gender stereotypes among Asian and Latinx adolescents. Our findings suggest that a culture’s gender role beliefs may not translate into gender stereotypes about specific academic subjects, such as math. Both Asian and Latinx cultures espouse more traditional gender role beliefs [36]; however, these two groups differ dramatically concerning their representation in STEM, with Asians having stronger representation and being stereotyped to do well in math with the model minority hypothesis [40]. Aligned with the patterns in STEM, Asian boys in HSLS endorsed the strongest traditional stereotypes, whereas Latinx adolescents were more gender egalitarian. This finding also supports social status theory [16]; Asian adolescents may be more likely to have something to gain by supporting stereotypes related to STEM, given their high representation in the STEM fields and advanced STEM classrooms, whereas Latinx adolescents may be less likely to buy into math-related stereotypes given their underrepresentation in STEM.
4.2. Adolescents’ Math Gender Stereotypes and Their Expectancy and Value Beliefs
As hypothesized, boys’ stereotypes positively related to their expectancy beliefs, whereas girls’ traditional stereotypes negatively related to their expectancy beliefs. When examined by race/ethnicity, these relations were less prevalent among Black adolescents compared to other racial/ethnic groups; however, generally, the confidence intervals of the effect sizes overlapped between racial/ethnic groups within the same gender, suggesting similar effects. The relations with adolescents’ math value beliefs followed a similar pattern but were less consistent. One explanation for why significant relations were less common for value beliefs than for expectancy beliefs is that the gender stereotypes focused on stereotypes about math ability, not value. Given that expectancy and value beliefs about math are related but separate constructs [14], it follows that math expectancy beliefs would be more strongly related to a stereotype specifically about math ability. Future research might also explore value-related stereotypes in conjunction with ability stereotypes to examine whether value beliefs are more strongly related to the former.
Moreover, the relations between math ability gender stereotypes and expectancy-value beliefs emerged in both datasets spanning nearly 20 years and evidenced effects that were similar in size. Believing that boys are better at math than girls was positively related to the boys’ motivational beliefs and negatively related to the girls’ motivational beliefs in each dataset. Thus, stereotypes about gender and math ability may contribute to the persistent gender gap in math expectancy beliefs [2]. These findings provide support for situated expectancy-value theory [14] as well as the potential value of using archived datasets, particularly when combined with newer nationally representative datasets.
4.3. Practical Implications
This research has several practical implications. Given that we found adolescence may be a period when gender stereotypes become more traditional, parents and high school teachers should try to counteract such trends, particularly among boys and Asian and White adolescents. Such interventions might counteract traditional stereotypes and highlight that boys and girls perform similarly in math. Furthermore, they might discuss the gender gaps in math self-confidence and expectancy beliefs, explaining that due to math gender stereotypes, boys might be inclined to believe they are doing better in math than they are, whereas girls might believe they are doing worse than they actually are. Such a strategy may work to reduce gender stereotypes and provide adolescents an accurate understanding of their math abilities. Youth in adolescence may be especially interested in fairness and social justice issues [65], which may make it an ideal time for teachers and parents to broach the topic of equity and inclusion in STEM.
It is also important to note that many adolescents, particularly Black and Latinx adolescents, endorsed the belief that boys and girls are equally good in math. In early adolescence, Black and Latina girls believed, on average, that girls were better than boys in math. Prior research has demonstrated that a strength of many Black families is their encouragement of competence and self-reliance among their daughters [17]. Our findings suggest that Black individuals carry this strength with them into STEM, where Black families and adolescents were more likely to endorse counter-traditional gender stereotypes about math ability and be especially supportive of their daughters in STEM. Researchers and practitioners should learn from the positive parenting practices among Black families to better support girls and other groups who are marginalized and help promote culturally responsive practices in classrooms as well as home-based learning among other racial/ethnic groups.
This study found that the pattern of late adolescents favoring boys in math has not significantly changed in 20 years, and prior studies have similarly found that parent stereotypes favoring boys and gender gaps in math motivational beliefs have not changed in decades [7]. Furthermore, recent research indicates that gender gaps in math self-concept have persisted for the past 23 years [2]. We need to do more as researchers, teachers, parents, and as a society. However, changing adolescents’ math gender stereotypes at the level of the individual is only a small piece of creating more gender equality in STEM. For example, even though Black girls have the least traditional stereotypes, they are still underrepresented in STEM. There are many structural issues at the high school and college level, such as teacher practices that privilege boys and men and bias towards girls and women in STEM classrooms [22]. These structural issues must also be addressed to create greater gender equality in STEM.
4.4. Future Directions and Limitations
This study was unique in that it implemented two large datasets to investigate gender stereotypes. This approach has made replication possible; however, it also has limitations. The datasets differed demographically, and due to limited racial and ethnic diversity in the MADICS dataset, replication by race/ethnicity could only be examined among White and Black participants. Additionally, the people who identify as these pan-ethnic and racial categories are diverse, and the present study did not distinguish between important within-group ethnic variations. Furthermore, one dataset was nationally representative, whereas the other was a local dataset, making historical comparisons more difficult. Each dataset only had one item to measure gender stereotypes, which does not allow us to examine reliability or invariance over time. Furthermore, the MADICS gender stereotype question asked about both math and science, whereas the HSLS stereotype question focused on math. Despite this, we largely found that findings across the two datasets replicated, indicating that adolescents may hold similar gender stereotypes about math and science when it comes to ability. Relatedly, future studies might ask about STEM subjects beyond math. Relative to fields like computer science and engineering, math has greater gender parity [66]; however, individuals may hold stronger male bias regarding fields like computer science when compared to math [67]. However, we believe that assessing math gender stereotypes is still important, given that math is a gateway to these fields. We found that stereotypes became more traditional from early to late adolescence. Future studies might explore the mechanisms related to this increase, such as taking advanced math courses. Math gender stereotype increases may occur during late high school, and these beliefs may continue into adulthood. However, more longitudinal work would need to be conducted to better understand stereotype development.
This study investigated differences by race/ethnicity and gender, finding that underrepresented groups in STEM (girls, Black, and Latinx individuals) had significantly less traditional stereotypes. Future studies might also explore the differences related to SES and parent education; in the present study, we found some differences when we controlled for family income and parent education. Given that low-income and first-generation adolescents are also underrepresented in STEM, they may also be less likely to endorse math gender stereotypes. However, this might also differ at the intersections of race and gender (e.g., low-income White boys may still feel they have something to gain by upholding traditional stereotypes). Finally, both datasets used in this study are older (collected in the 1990s through to the 2010s); more recent data might further explore similar research questions to see if these effects hold up today. Given that gender gaps in STEM still remain [1], we believe our findings are relevant, despite the data being slightly older. Despite these limitations, the findings of this study contributed to the literature in several significant ways. The findings that replicated provide more confidence, as these patterns emerged consistently at the conceptual level and provided insight into areas of historical changes and stability. These findings also point to several new directions for further study, including racial/ethnic differences.
5. Conclusions
The present study makes several contributions to important areas. First, this study examines math ability gender stereotypes among adolescents across multiple datasets spanning the 1990s to the 2010s, allowing for replication and testing of potential historical differences. Second, this study allowed us to examine the developmental changes in individuals’ math gender stereotypes and their motivational correlates from early to late adolescence, including differences based on race/ethnicity. Adolescents’ math gender stereotypes became more traditional from early to late adolescence. This small increase towards believing boys are better in math than girls in late adolescence may be one reason why, and despite the many societal changes in regard to gender and similar math grades and test scores, math motivational beliefs have still not reached gender parity. However, many participants endorsed egalitarian beliefs or favored girls as better, especially among early adolescent girls and Black/Latinx adolescents. In particular, Black girls had non-traditional or gender egalitarian beliefs, highlighting a strength among Black girls and their families that future research might learn from.
Supplementary Materials
The following supporting information can be downloaded at: https://www.mdpi.com/article/10.3390/educsci13090866/s1.
Author Contributions
Conceptualization, C.R.S. and S.D.S.; methodology, C.R.S. and S.D.S.; formal analysis, C.R.S.; data curation, C.R.S., A.-L.D. and N.S.; writing—original draft preparation, C.R.S., Y.G., C.R. and G.L.; writing—review and editing, primarily C.R.S. and S.D.S. with contributions from all authors; supervision, S.D.S. and J.S.E.; project administration, S.D.S.; funding acquisition, S.D.S. and J.S.E. All authors have read and agreed to the published version of the manuscript.
Funding
This research was funded by the National Science Foundation grant numbers [DRL-1760757 and DRL-2054956] awarded to Sandra Simpkins and Jacquelynne Eccles. The original data collection of MADICS was supported by funding from the MacArthur Research Network on Successful Adolescent Development in High-Risk Settings and funding from NICHD Grant R01 033437.
Institutional Review Board Statement
The study was conducted in accordance with the Declaration of Helsinki, and approved by the Institutional Review Board (or Ethics Committee) of University of California, Irvine (protocol HS#2018-4349)” for studies involving humans.
Informed Consent Statement
The present study used deidentified, secondary human participant data.
Data Availability Statement
Data and material is available at the following websites. HSLS: https://nces.ed.gov/surveys/hsls09/ (accessed on 21 August 2023); MADICS: https://garp.education.uci.edu/msalt.html (accessed on 21 August 2023).
Conflicts of Interest
The authors declare no conflict of interest.
References
- Breda, T.; Jouini, E.; Napp, C.; Thebault, G. Gender Stereotypes Can Explain the Gender-Equality Paradox. Proc. Natl. Acad. Sci. USA 2020, 117, 31063–31069. [Google Scholar] [CrossRef] [PubMed]
- Rubach, C.; Lee, G.; Starr, C.R.; Gao, Y.; Safavian, N.; Dicke, A.-L.; Eccles, J.S.; Simpkins, S.D. Is There Any Evidence of Historical Changes in Gender Differences in American High School Students’ Math Competence-Related Beliefs from the 1980s to the 2010s? Int. J. Gend. Sci. Technol. 2022, 14, 55–126. [Google Scholar]
- Rickles, J.; Heppen, J.; Taylor, S.; Sorensen, N.; Walters, K.; Clements, P. Course Progression for Students Who Fail Algebra I in Ninth Grade; American Institutes for Research: Arlington County, VA, USA, 2017; Available online: https://www.air.org/sites/default/files/2022-03/Course-Progression-for-Students-Who-Fail-Algebra-I-in-Ninth-Grade-June-2017.pdf (accessed on 15 April 2023).
- Regner, I.; Steele, J.R.; Ambady, N.; Thinus-Blanc, C.; Huguet, P. Our Future Scientists: A Review of Stereotype Threat in Girls from Early Elementary School to Middle School. Rev. Int. De Psychol. Soc. 2014, 27, 13–51. [Google Scholar]
- Ceci, S.J.; Ginther, D.K.; Kahn, S.; Williams, W.M. Women in Academic Science: A Changing Landscape. Psychol. Sci. Public. Interest. 2014, 15, 75–141. [Google Scholar] [CrossRef]
- Long, M.; Steinke, J.; Applegate, B.; Knight Lapinski, M.; Johnson, M.J.; Ghosh, S. Portrayals of Male and Female Scientists in Television Programs Popular Among Middle School-Age Children. Sci. Commun. 2010, 32, 356–382. [Google Scholar] [CrossRef]
- Starr, C.R.; Ramos Carranza, P.; Simpkins, S.D. Stability and Changes in High School Students’ STEM Career Expectations: Variability Based on STEM Support and Parent Education. J. Adolesc. 2022, 94, 906–919. [Google Scholar] [CrossRef]
- World Economic Forum. Global Gender Gap Report. 2023. Available online: https://www.weforum.org/reports/global-gender-gap-report-2023/ (accessed on 16 August 2023).
- McGuire, L.; Mulvey, K.L.; Goff, E.; Irvin, M.J.; Winterbottom, M.; Fields, G.E.; Hartstone-Rose, A.; Rutland, A. STEM Gender Stereotypes from Early Childhood through Adolescence at Informal Science Centers. J. Appl. Dev. Psychol. 2020, 67, 101109. [Google Scholar] [CrossRef]
- Starr, C.R.; Simpkins, S.D. High School Students’ Math and Science Gender Stereotypes: Relations with Their STEM Outcomes and Socializers’ Stereotypes. Soc. Psychol. Educ. 2021, 24, 273–298. [Google Scholar] [CrossRef]
- Seo, E.; Shen, Y.; Alfaro, E.C. Adolescents’ Beliefs about Math Ability and Their Relations to STEM Career Attainment: Joint Consideration of Race/Ethnicity and Gender. J. Youth Adolesc. 2019, 48, 306–325. [Google Scholar] [CrossRef]
- Maxwell, S.E.; Lau, M.Y.; Howard, G.S. Is Psychology Suffering from a Replication Crisis? What Does “Failure to Replicate” Really Mean? Am. Psychol. 2015, 70, 487–498. [Google Scholar] [CrossRef]
- Plucker, J.A.; Makel, M.C. Replication Is Important for Educational Psychology: Recent Developments and Key Issues. Educ. Psychol. 2021, 56, 90–100. [Google Scholar] [CrossRef]
- Eccles, J.S.; Wigfield, A. From Expectancy-Value Theory to Situated Expectancy-Value Theory: A Developmental, Social Cognitive, and Sociocultural Perspective on Motivation. Contemp. Educ. Psychol. 2020, 61, 101859. [Google Scholar] [CrossRef]
- Plante, I.; O’Keefe, P.A.; Aronson, J.; Fréchette-Simard, C.; Goulet, M. The Interest Gap: How Gender Stereotype Endorsement about Abilities Predicts Differences in Academic Interests. Soc. Psychol. Educ. 2019, 22, 227–245. [Google Scholar] [CrossRef]
- Rowley, S.J.; Kurtz-Costes, B.; Mistry, R.; Feagans, L. Social Status as a Predictor of Race and Gender Stereotypes in Late Childhood and Early Adolescence. Soc. Social. Dev. 2007, 16, 150–168. [Google Scholar] [CrossRef]
- Black, A.R.; Peacock, N. Pleasing the Masses: Messages for Daily Life Management in African American Women’s Popular Media Sources. Am. J. Public. Health 2011, 101, 144–150. [Google Scholar] [CrossRef] [PubMed]
- Erikson, E.H. Identity: Youth and Crisis; Norton & Co.: Oxford, UK, 1968. [Google Scholar]
- Patterson, M.M.; Bigler, R.S. Effects of Consistency between Self and In-Group on Children’s Views of Self, Groups, and Abilities. Soc. Social. Dev. 2018, 27, 154–171. [Google Scholar] [CrossRef]
- Umaña-Taylor, A.J.; Quintana, S.M.; Lee, R.M.; Cross, W.E., Jr.; Rivas-Drake, D.; Schwartz, S.J.; Syed, M.; Yip, T.; Seaton, E.; Ethnic and Racial Identity in the 21st Century Study Group. Ethnic and Racial Identity During Adolescence and Into Young Adulthood: An Integrated Conceptualization. Child. Dev. 2014, 85, 21–39. [Google Scholar] [CrossRef]
- Eccles, J. Who Am I and What Am I Going to Do With My Life? Personal and Collective Identities as Motivators of Action. Educ. Psychol. 2009, 44, 78–89. [Google Scholar] [CrossRef]
- Musto, M. Brilliant or Bad: The Gendered Social Construction of Exceptionalism in Early Adolescence. Am. Sociol. Rev. 2019, 84, 369–393. [Google Scholar] [CrossRef]
- Steinke, J.; Lapinski, M.K.; Crocker, N.; Zietsman-Thomas, A.; Williams, Y.; Evergreen, S.H.; Kuchibhotla, S. Assessing Media Influences on Middle School–Aged Children’s Perceptions of Women in Science Using the Draw-A-Scientist Test (DAST). Sci. Commun. 2007, 29, 35–64. [Google Scholar] [CrossRef]
- Kurtz-Costes, B.; Copping, K.E.; Rowley, S.J.; Kinlaw, C.R. Gender and Age Differences in Awareness and Endorsement of Gender Stereotypes about Academic Abilities. Eur. J. Psychol. Educ. 2014, 29, 603–618. [Google Scholar] [CrossRef]
- Cvencek, D.; Meltzoff, A.N.; Greenwald, A.G. Math–Gender Stereotypes in Elementary School Children. Child. Dev. 2011, 82, 766–779. [Google Scholar] [CrossRef] [PubMed]
- Chatard, A.; Guimond, S.; Selimbegovic, L. “How Good Are You in Math?” The Effect of Gender Stereotypes on Students’ Recollection of Their School Marks. J. Exp. Soc. Social. Psychol. 2007, 43, 1017–1024. [Google Scholar] [CrossRef]
- Steffens, M.C.; Jelenec, P. Separating Implicit Gender Stereotypes Regarding Math and Language: Implicit Ability Stereotypes Are Self-Serving for Boys and Men, but Not for Girls and Women. Sex. Roles 2011, 64, 324–335. [Google Scholar] [CrossRef]
- Hargreaves, M.; Homer, M.; Swinnerton, B. A Comparison of Performance and Attitudes in Mathematics amongst the ‘Gifted’. Are Boys Better at Mathematics or Do They Just Think They Are? Assess. Educ. Princ. Policy Pract. 2008, 15, 19–38. [Google Scholar] [CrossRef]
- Plante, I.; Théorêt, M.; Favreau, O.E. Student Gender Stereotypes: Contrasting the Perceived Maleness and Femaleness of Mathematics and Language. Educ. Psychol. 2009, 29, 385–405. [Google Scholar] [CrossRef]
- Denner, J.; Laursen, B.; Dickson, D.; Hartl, A.C. Latino Children’s Math Confidence: The Role of Mothers’ Gender Stereotypes and Involvement Across the Transition to Middle School. J. Early Adolesc. 2018, 38, 513–529. [Google Scholar] [CrossRef]
- Ward, L.M.; Grower, P. Media and the Development of Gender Role Stereotypes. Annu. Rev. Dev. Psychol. 2020, 2, 177–199. [Google Scholar] [CrossRef]
- Bieg, M.; Goetz, T.; Wolter, I.; Hall, N. Gender Stereotype Endorsement Differentially Predicts Girls’ and Boys’ Trait-State Discrepancy in Math Anxiety. Front. Psychol. 2015, 6, 1404. [Google Scholar] [CrossRef]
- Hyde, J.S.; Fennema, E.; Lamon, S.J. Gender Differences in Mathematics Performance: A Meta-Analysis. Psychol. Bull. 1990, 107, 139–155. [Google Scholar] [CrossRef]
- Skinner, O.D.; Kurtz-Costes, B.; Vuletich, H.; Copping, K.; Rowley, S.J. Race Differences in Black and White Adolescents’ Academic Gender Stereotypes across Middle and Late Adolescence. Cult. Divers. Ethn. Minor. Psychol. 2021, 27, 537–545. [Google Scholar] [CrossRef]
- Evans, A.B.; Copping, K.E.; Rowley, S.J.; Kurtz-Costes, B. Academic Self-Concept in Black Adolescents: Do Race and Gender Stereotypes Matter? Self Identity 2011, 10, 263–277. [Google Scholar] [CrossRef] [PubMed]
- Gutierrez, B.C.; Halim, M.L.D.; Leaper, C. Variations in Recalled Familial Messages about Gender in Relation to Emerging Adults’ Gender, Ethnic Background, and Current Gender Attitudes. J. Fam. Stud. 2019, 28, 150–183. [Google Scholar] [CrossRef]
- O’Brien, L.T.; Blodorn, A.; Adams, G.; Garcia, D.M.; Hammer, E. Ethnic Variation in Gender-STEM Stereotypes and STEM Participation: An Intersectional Approach. Cult. Divers. Ethn. Minor. Psychol. 2015, 21, 169–180. [Google Scholar] [CrossRef] [PubMed]
- Starr, C.R. “I’m Not a Science Nerd!”: STEM Stereotypes, Identity, and Motivation Among Undergraduate Women. Psychol. Women Q 2018, 42, 489–503. [Google Scholar] [CrossRef]
- Kurtz-Costes, B.; Rowley, S.J.; Harris-Britt, A.; Woods, T.A. Gender Stereotypes about Mathematics and Science and Self-Perceptions of Ability in Late Childhood and Early Adolescence. Merrill-Palmer Q 2008, 54, 386–409. [Google Scholar] [CrossRef]
- McGee, E. “Black Genius, Asian Fail”: The Detriment of Stereotype Lift and Stereotype Threat in High-Achieving Asian and Black STEM Students. AERA Open 2018, 4, 16. [Google Scholar] [CrossRef]
- Hsieh, T.; Simpkins, S.D.; Eccles, J.S. Gender by Racial/Ethnic Intersectionality in the Patterns of Adolescents’ Math Motivation and Their Math Achievement and Engagement. Contemp. Educ. Psychol. 2021, 66, 101974. [Google Scholar] [CrossRef]
- Gibson, C.E.; Losee, J.; Vitiello, C. Replication Attempt of Stereotype Susceptibility (Shih, Pittinsky, & Ambady, 1999): Identity Salience and Shifts in Quantitative Performance. Soc. Psychol. 2014, 45, 194–198. [Google Scholar] [CrossRef]
- Passolunghi, M.C.; Rueda Ferreira, T.I.; Tomasetto, C. Math–Gender Stereotypes and Math-Related Beliefs in Childhood and Early Adolescence. Learn. Individ. Differ. 2014, 34, 70–76. [Google Scholar] [CrossRef]
- National Center for Statistics (NCES). High School Longitudinal Study of 2009 User Manuals; Institute of Education Sciences: Washington, DC, USA, 2019. Available online: https://nces.ed.gov/surveys/hsls09/usermanuals.asp (accessed on 23 February 2023).
- Eccles, J.S.; Jacobs, J.E.; Harold, R.D. Gender Role Stereotypes, Expectancy Effects, and Parents’ Socialization of Gender Differences. J. Soc. Social. Issues 1990, 46, 183–201. [Google Scholar] [CrossRef]
- Fisher, G.G.; Matthews, R.A.; Gibbons, A.M. Developing and Investigating the Use of Single-Item Measures in Organizational Research. J. Occup. Health Psychol. 2016, 21, 3–23. [Google Scholar] [CrossRef] [PubMed]
- Hays, R.D.; Reise, S.; Calderón, J.L. How Much Is Lost in Using Single Items? J. Gen. Intern. Med. 2012, 27, 1402–1403. [Google Scholar] [CrossRef] [PubMed]
- Nichols, A.L.; Webster, G.D. The Single-Item Need to Belong Scale. Personal. Individ. Differ. 2013, 55, 189–192. [Google Scholar] [CrossRef]
- Eccles, J.S.; Wigfield, A. In the Mind of the Actor: The Structure of Adolescents’ Achievement Task Values and Expectancy-Related Beliefs. Pers. Soc. Psychol. Bull. 1995, 21, 215–225. [Google Scholar] [CrossRef]
- Lauermann, F.; Tsai, Y.-M.; Eccles, J.S. Math-Related Career Aspirations and Choices within Eccles et al.’s Expectancy–Value Theory of Achievement-Related Behaviors. Dev. Psychol. 2017, 53, 1540–1559. [Google Scholar] [CrossRef]
- Jiang, S.; Simpkins, S.D.; Eccles, J.S. Individuals’ Math and Science Motivation and Their Subsequent STEM Choices and Achievement in High School and College: A Longitudinal Study of Gender and College Generation Status Differences. Dev. Psychol. 2020, 56, 2137–2151. [Google Scholar] [CrossRef]
- Diemer, M.A.; Marchand, A.D.; McKellar, S.E.; Malanchuk, O. Promotive and Corrosive Factors in African American Students’ Math Beliefs and Achievement. J. Youth Adolesc. 2016, 45, 1208–1225. [Google Scholar] [CrossRef]
- Enders, C.K. Applied Missing Data Analysis; Guilford Press: New York, NY, USA, 2010; Chapter xv; 377p. [Google Scholar]
- Borenstein, M. Comprehensive Meta-Analysis Software; John Wiley & Sons Ltd: Hoboken, NJ, USA, 2022; pp. 535–548. [Google Scholar] [CrossRef]
- Borenstein, M.; Hedges, L.; Higgins, J.; Rothstein, H. Introduction to Meta-Analysis; John Wiley & Sons Ltd: Hoboken, NJ, USA, 2021. [Google Scholar] [CrossRef]
- Hedges, L.V.; Schauer, J.M. Statistical Analyses for Studying Replication: Meta-Analytic Perspectives. Psychol. Methods 2019, 24, 557–570. [Google Scholar] [CrossRef]
- Schoon, I.; Eccles, J.S. Gender Differences in Aspirations and Attainment: A Life Course Perspective; Cambridge University Press: New York, NY, USA, 2014. [Google Scholar] [CrossRef]
- Hunter, J.E.; Schmidt, F.L. Methods of Meta-Analysis: Correcting Error and Bias in Research Findings/Frank L. Schmidt, University of Iowa, John E. Hunter, Michigan State University, 3rd ed.; SAGE: Thousand Oaks, CA, USA, 2015. [Google Scholar]
- Baguley, T. Standardized or Simple Effect Size: What Should Be Reported? Br. J. Psychol. 2009, 100, 603–617. [Google Scholar] [CrossRef]
- Thompson, B. Effect Sizes, Confidence Intervals, and Confidence Intervals for Effect Sizes. Psychol. Sch. 2007, 44, 423–432. [Google Scholar] [CrossRef]
- Siy, J.O.; Germano, A.L.; Vianna, L.; Azpeitia, J.; Yan, S.; Montoya, A.K.; Cheryan, S. Does the Follow-Your-Passions Ideology Cause Greater Academic and Occupational Gender Disparities than Other Cultural Ideologies? J. Personal. Soc. Social. Psychol. 2023, 125, 548–570. [Google Scholar] [CrossRef] [PubMed]
- Marcia, J.E. The Empirical Study of Ego Identity. In Identity and development: An Interdisciplinary Approach; Bosma, H.A., Graafsma, T.L.G., Grotevant, H.D., de Levita, D.J., Eds.; Sage Publications, Inc.: Thousand Oaks, CA, USA, 1994; pp. 67–80, Chapter xii; 204p. [Google Scholar]
- Bigler, R.S.; Patterson, M.M. Social Stereotyping and Prejudice in Children. In The Wiley Handbook of Group Processes in Children and Adolescents; John Wiley & Sons, Ltd.: Hoboken, NJ, USA, 2017; pp. 184–202. [Google Scholar] [CrossRef]
- Lyons, J.; Utych, S.M. You’re Not From Here!: The Consequences of Urban and Rural Identities. Polit. Behav. 2021, 45, 75–101. [Google Scholar] [CrossRef]
- Brown, C.S.; Bigler, R.S. Children’s Perceptions of Discrimination: A Developmental Model. Child. Dev. 2005, 76, 533–553. [Google Scholar] [CrossRef] [PubMed]
- Miller, D.; Tanenbaum, C. NSF Award Search: Award # 1920401—The Development of Gender Stereotypes About STEM Abilities: A Meta-Analysis; National Science Foundation: Washington DC, USA, 2019. Available online: https://nsf.gov/awardsearch/showAward?AWD_ID=1920401 (accessed on 23 February 2023).
- Master, A.; Meltzoff, A.N.; Cheryan, S. Gender Stereotypes about Interests Start Early and Cause Gender Disparities in Computer Science and Engineering. Proc. Natl. Acad. Sci. USA 2021, 118, e2100030118. [Google Scholar] [CrossRef]
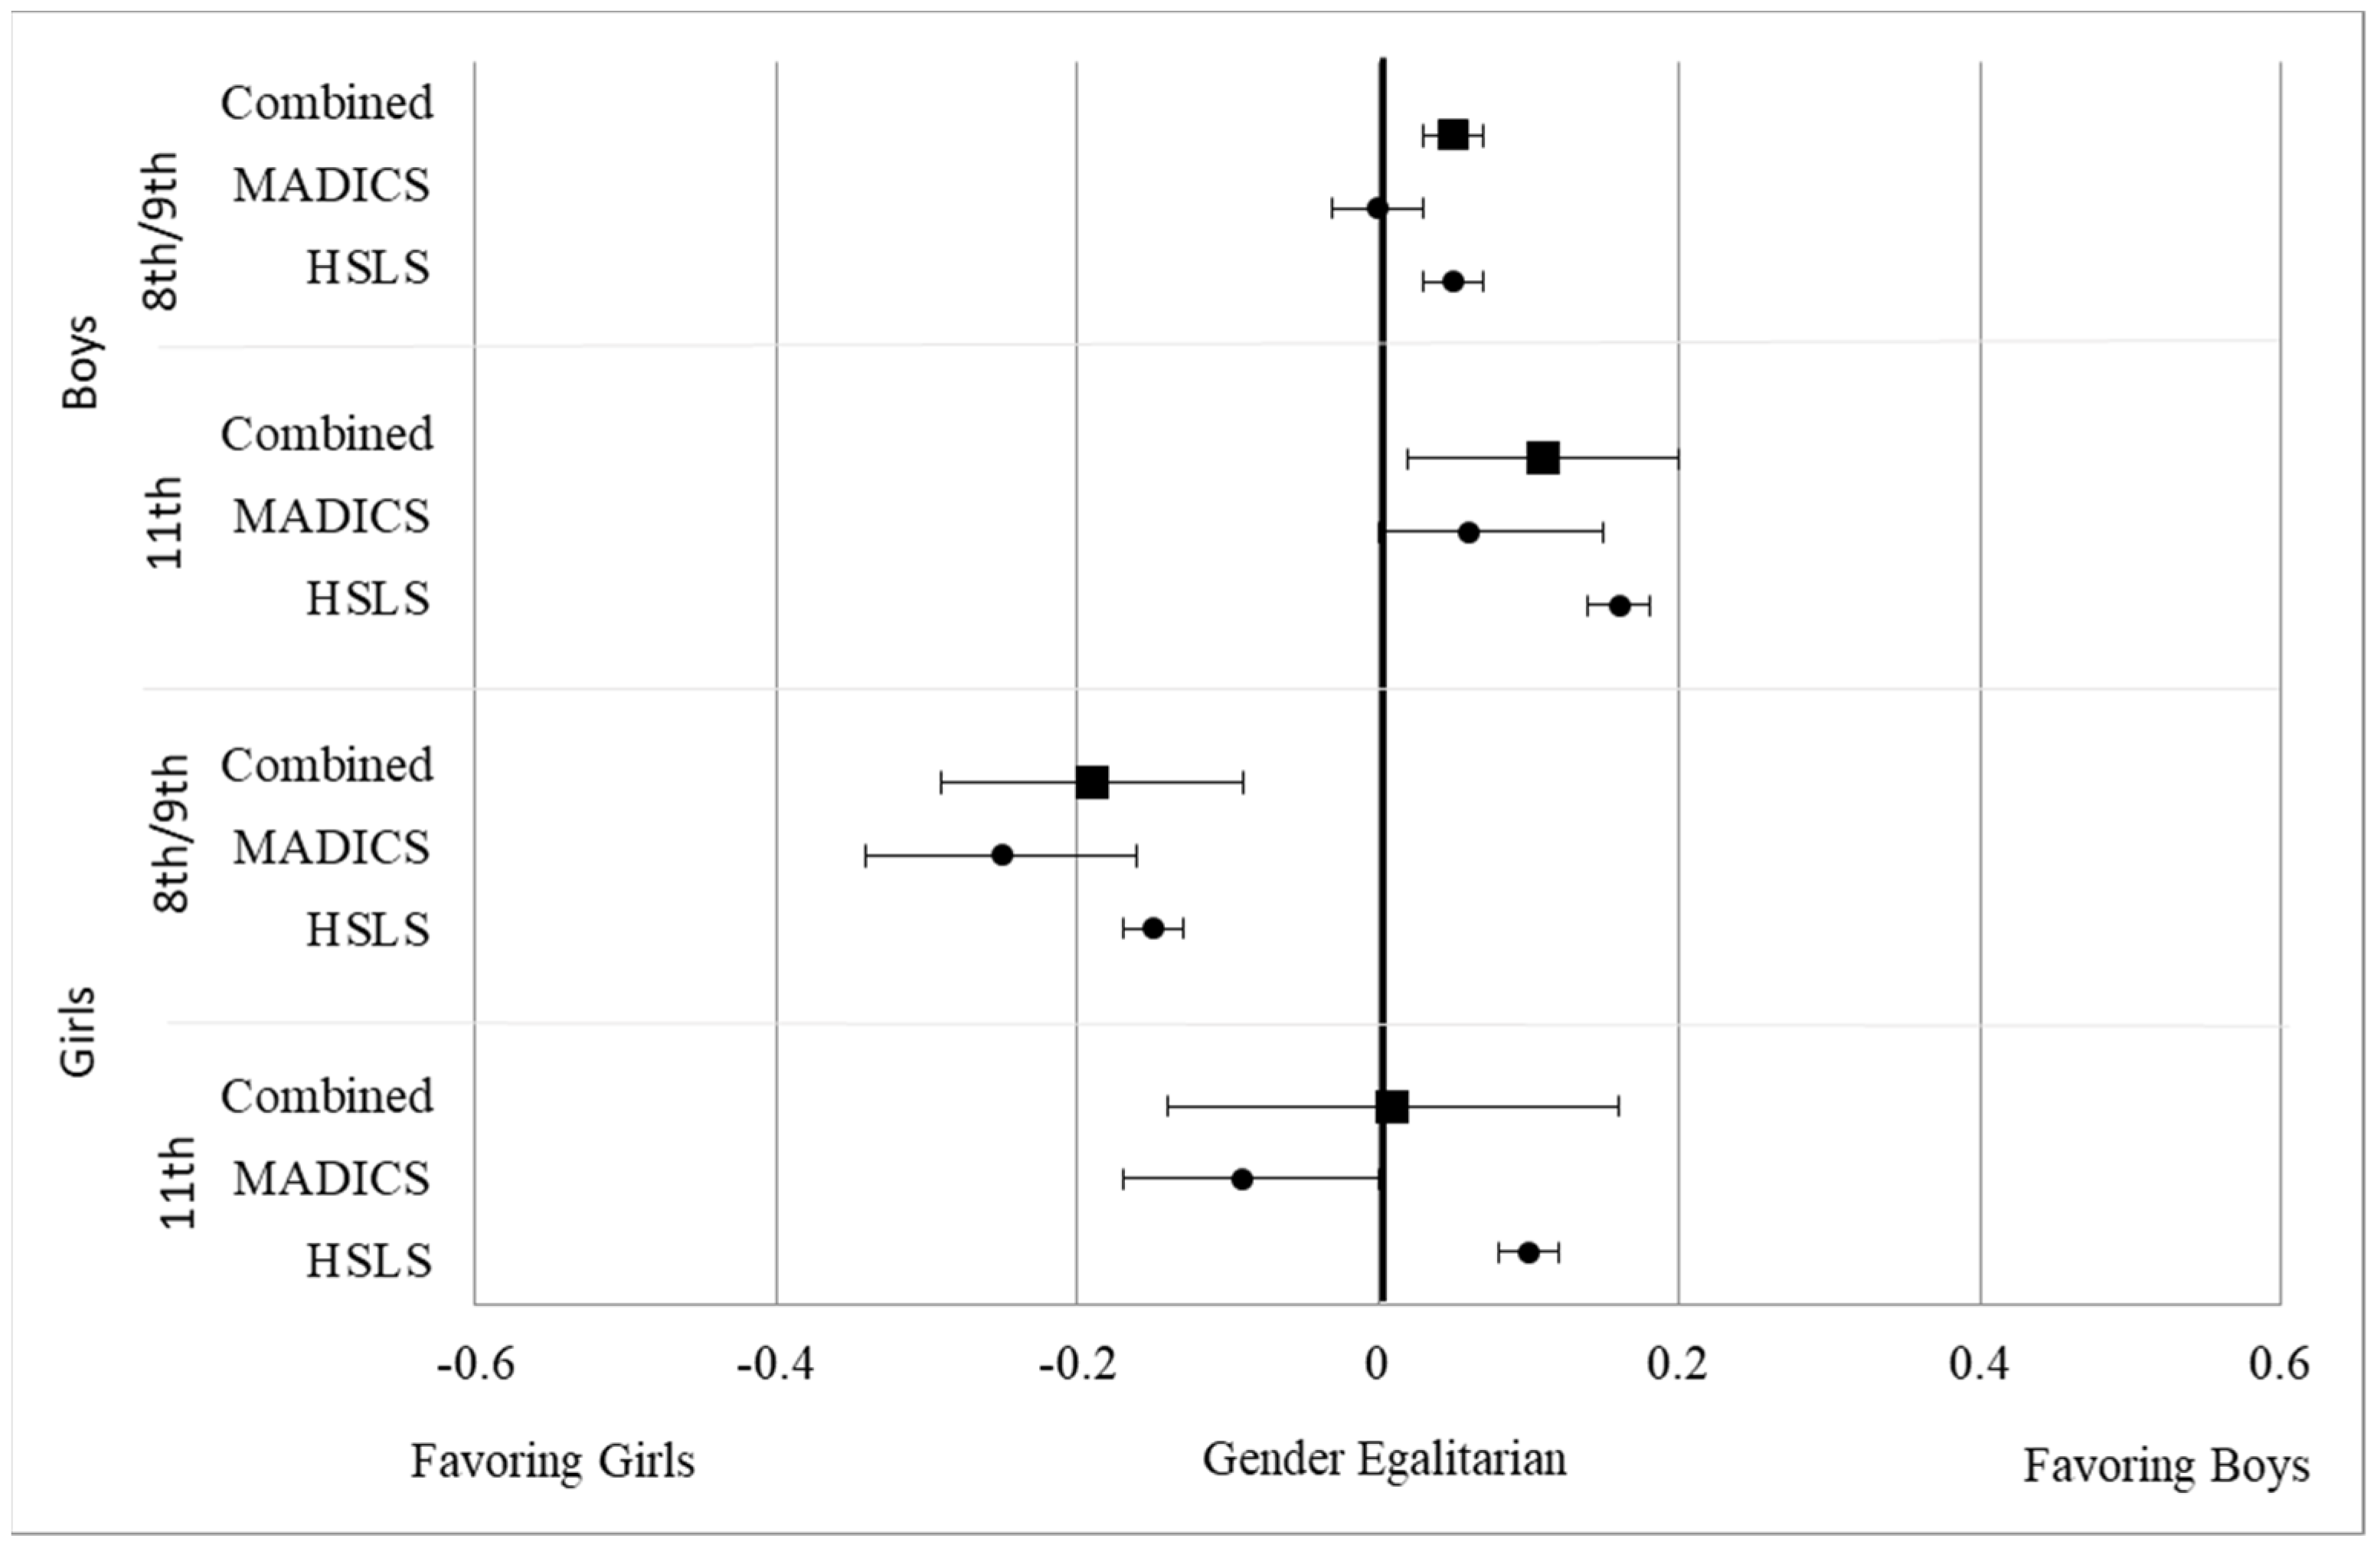

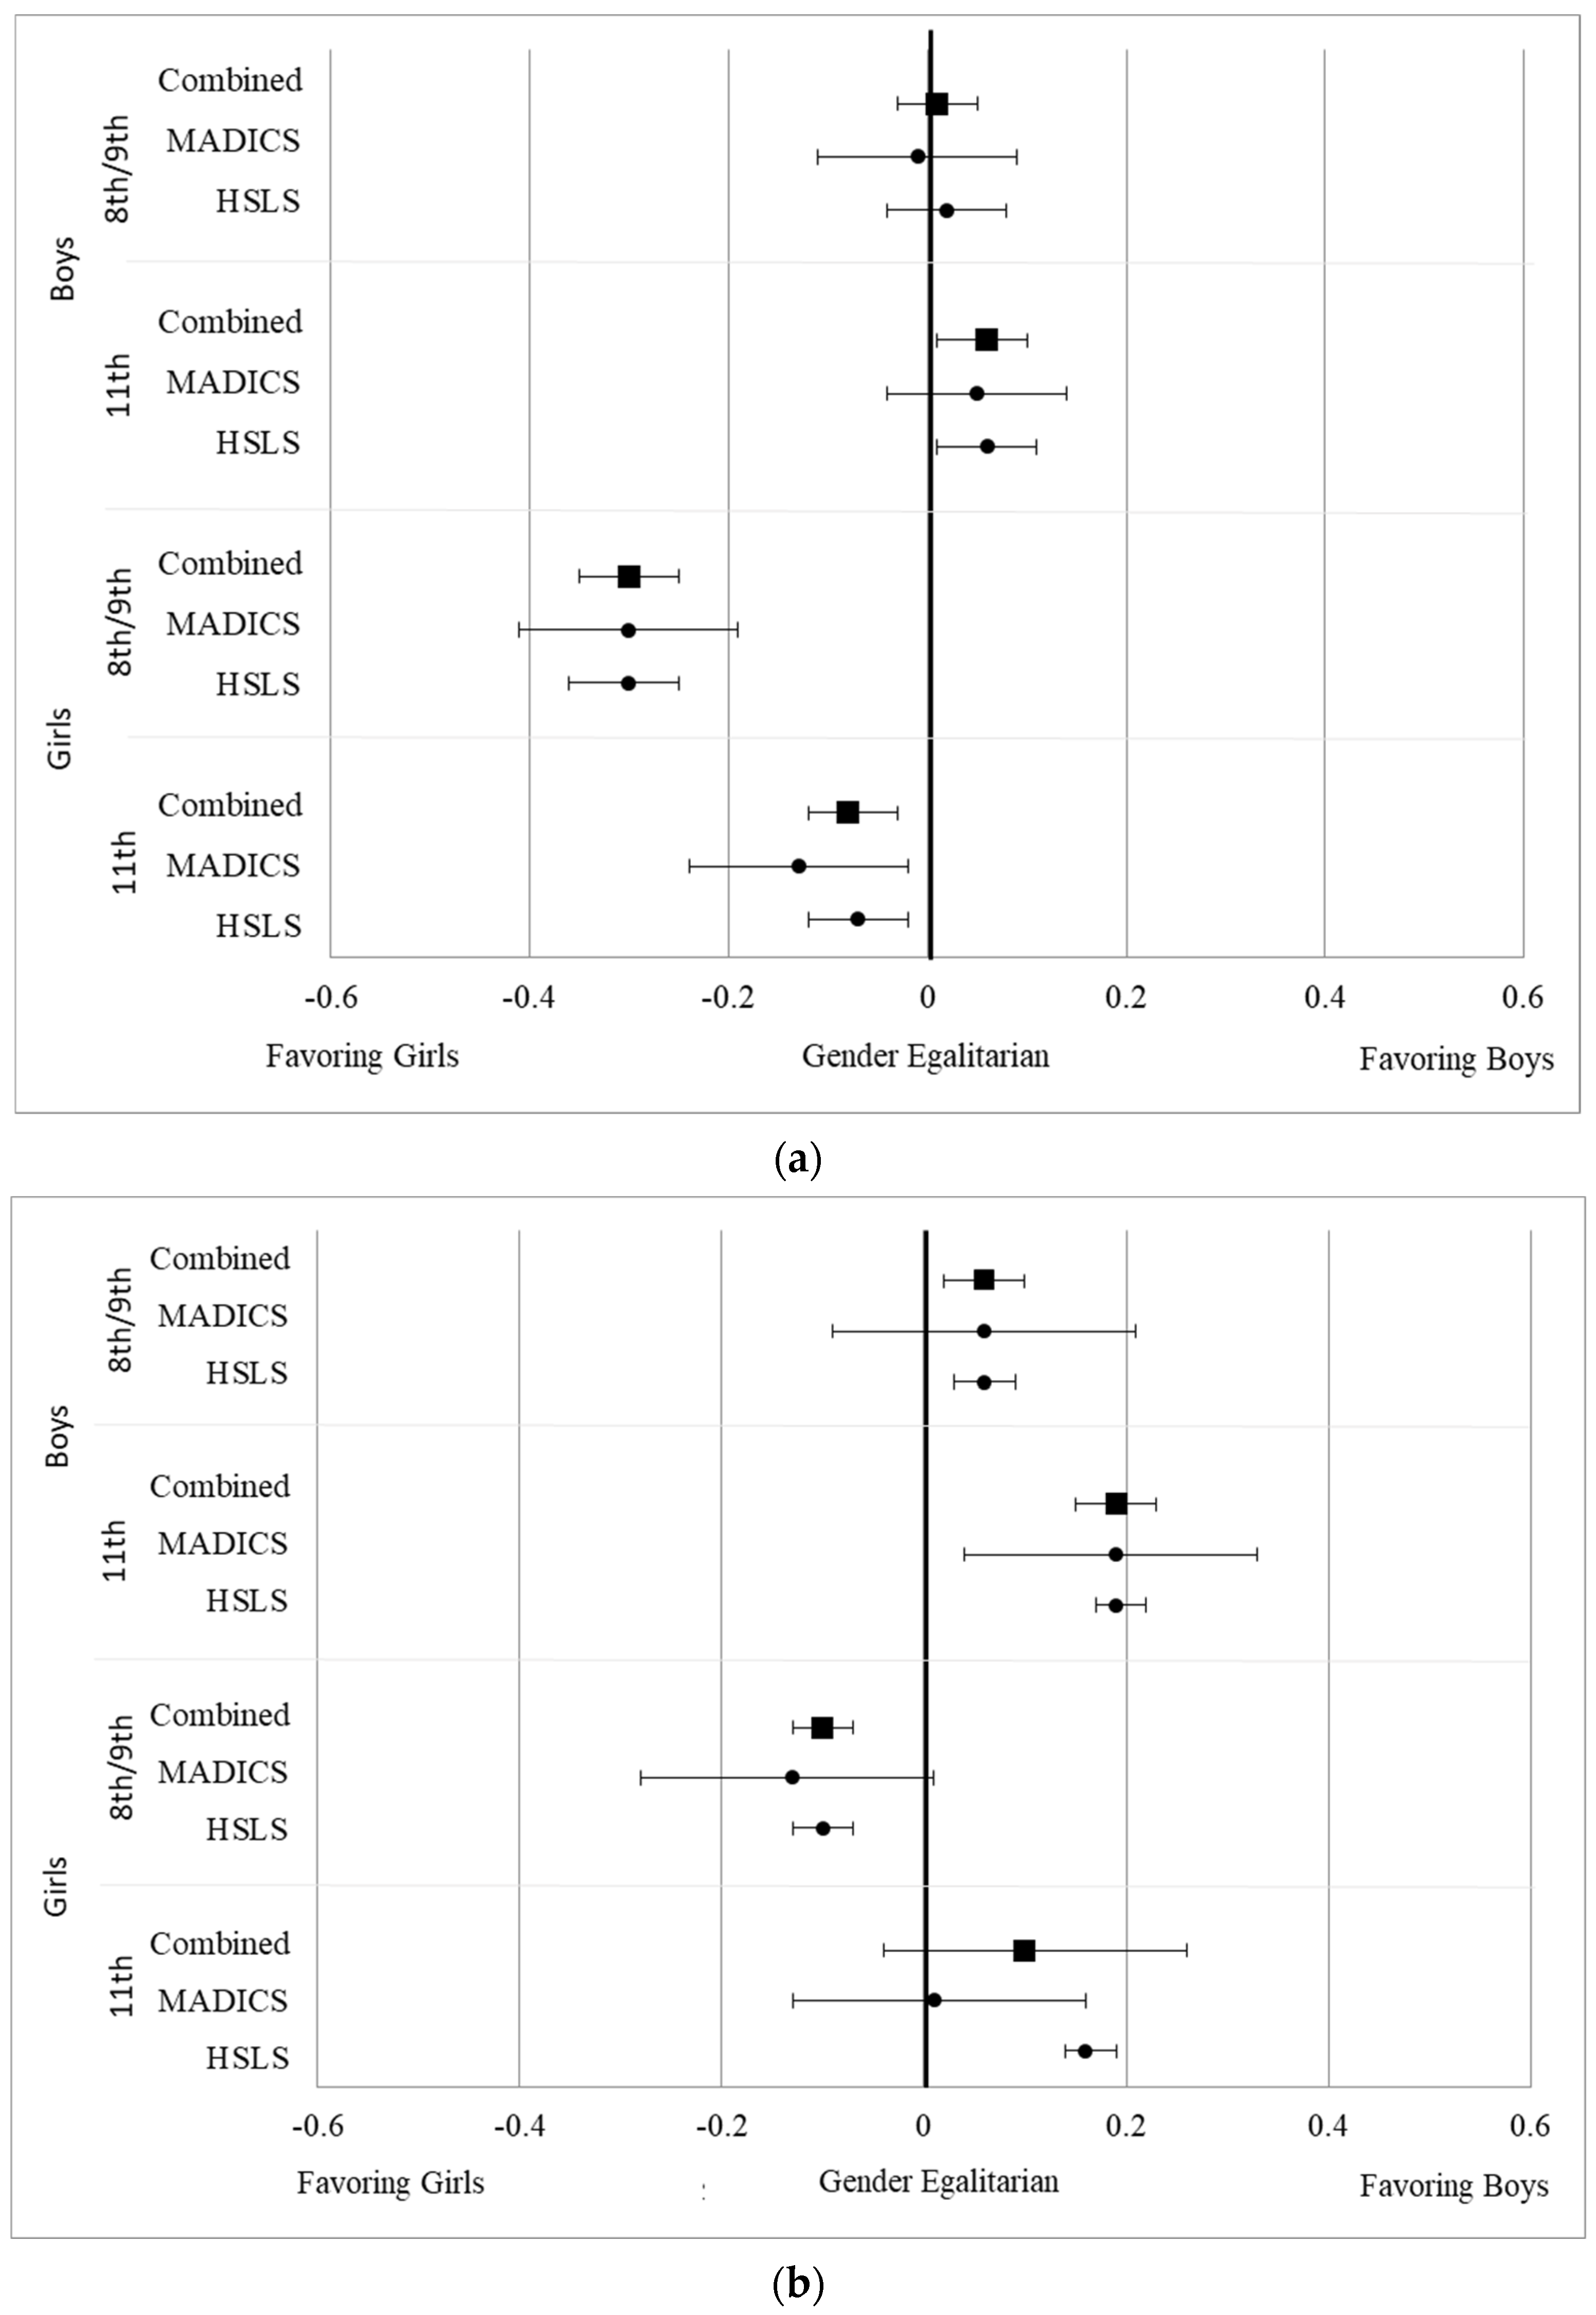
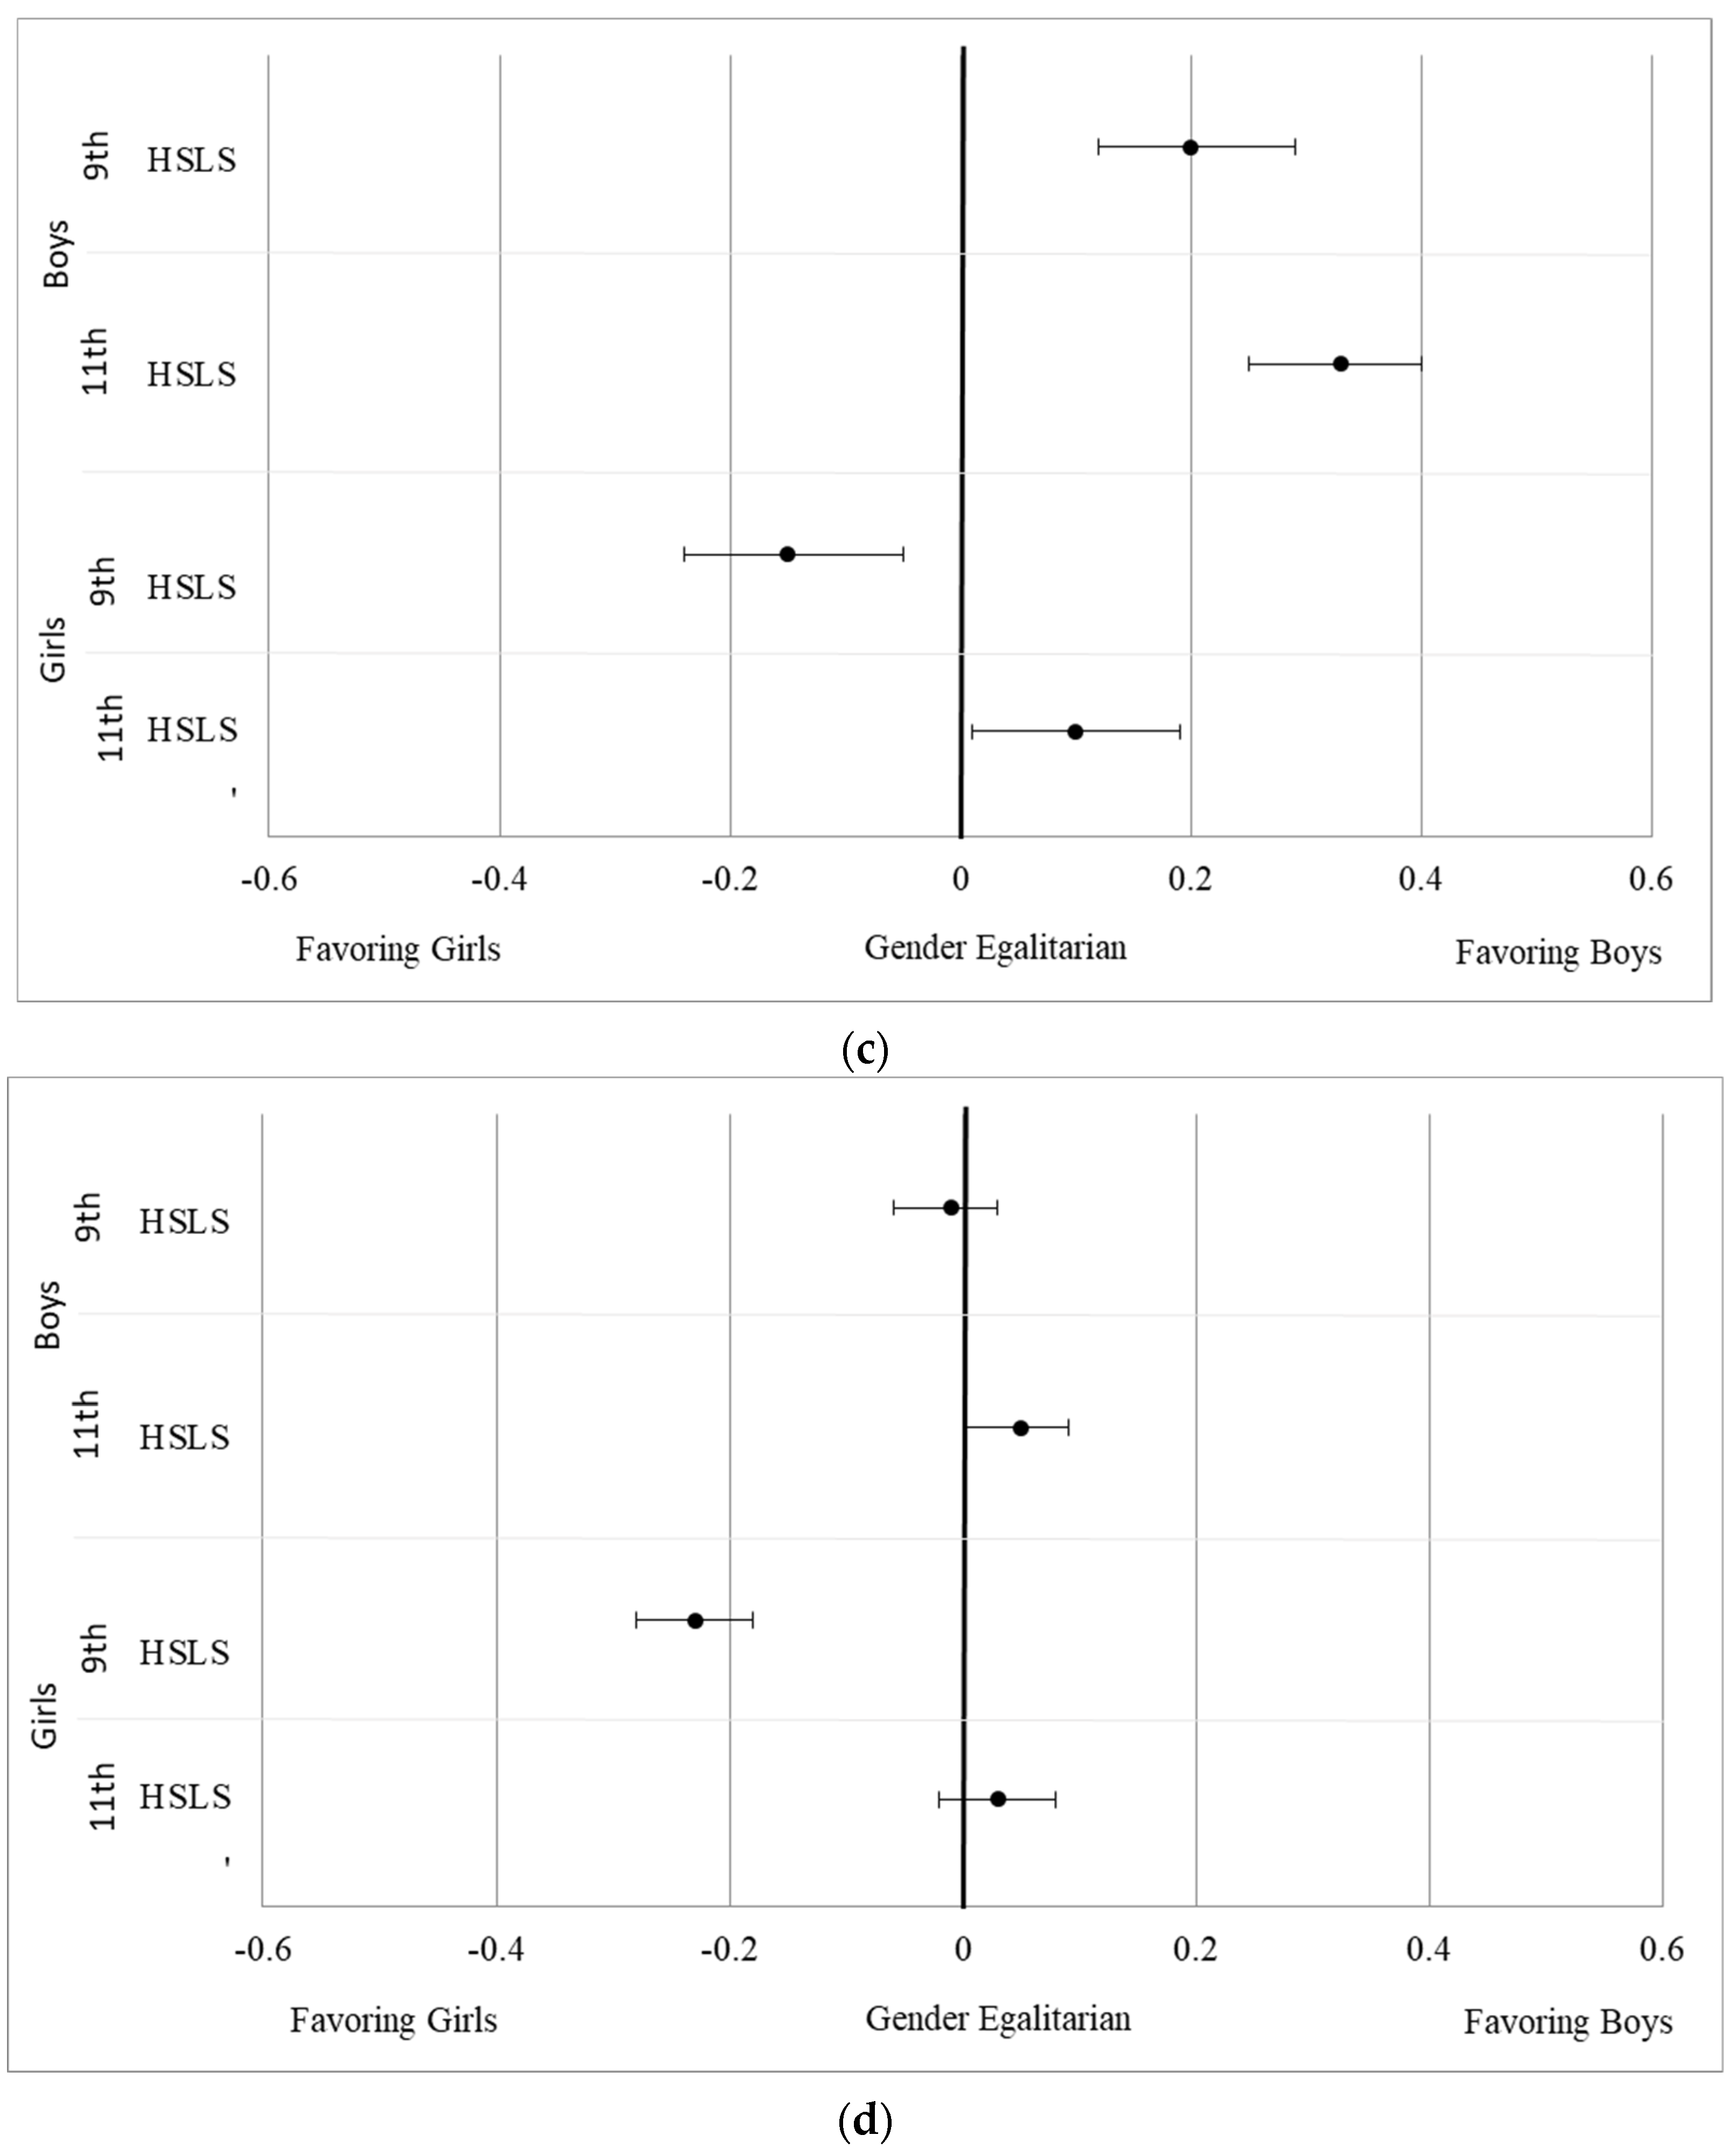
Disclaimer/Publisher’s Note: The statements, opinions and data contained in all publications are solely those of the individual author(s) and contributor(s) and not of MDPI and/or the editor(s). MDPI and/or the editor(s) disclaim responsibility for any injury to people or property resulting from any ideas, methods, instructions or products referred to in the content. |
© 2023 by the authors. Licensee MDPI, Basel, Switzerland. This article is an open access article distributed under the terms and conditions of the Creative Commons Attribution (CC BY) license (https://creativecommons.org/licenses/by/4.0/).