1. Introduction
There is a continued push toward the use of Science, Technology, Engineering and Mathematics (STEM) in today’s classrooms [
1,
2]. Despite this push, STEM integration in schools has not reached its potential. In a study that explored interdisciplinary learning in STEM, results showed that teachers are challenged in developing coherent, meaningful experiences for students [
3]. Their observations [
3] have been confirmed by a plethora of researchers who highlight the need for continued authentic STEM experiences for teachers emphasizing interdisciplinary content [
4,
5,
6]. While teachers generally value STEM, they often struggle with teaching interdisciplinary STEM lessons in meaningful ways [
7]. In addition to STEM challenges, teachers generally lack technological skills to support their students’ learning [
8,
9]. Investigating middle school science teachers (
n = 24) and their students technology experiences, researchers found that there was a lack of sufficient teacher training in technology integration and use [
10]. For decades, there have been a multitude of studies highlighting the lack of quality technology-based curricular experiences, likely due to teachers’ deficits in knowledge and skill [
11,
12,
13].
To address these two challenges—lack of meaningful interdisciplinary STEM experiences and the need for improved technology integration—Google’s Teachable Machine (TM) was used to support integrated technology and science lessons with middle school students and teachers (
https://teachablemachine.withgoogle.com (accessed on 22 March 2024)). TM is a computer vision technology that includes the analysis of visual data for the identification of objects, poses or sounds. Computer vision technology uses machine learning to evaluate input. Computer vision technology works by using algorithms and machine learning models to analyze and interpret visual data. This technology enables computers to interpret input, similar to how humans interpret visual input.
TM is a free web-based tool that can be used to create a machine learning classification model [
14]. The term model is used to describe a plethora of learning experiences. For example, in mathematics education, a model can be described as a bi-directional process that links common experiences in life to mathematics [
15]. There are at least five different approaches to models in mathematics [
16]. There are more examples of models in science education, including concept models and exploratory models [
17]. Models play a crucial role in helping learners make sense of scientific knowledge [
18] and supporting the development of scientific concepts [
19]. Regarding TM, we define our model as a classification model, which is different from traditional mathematics or science education models. Specifically, image classification models are developed using TM. “Image classification is the process of taking an input (like a photo or video stream) and outputting a class (like ‘plastic garbage’) or a probability that the input is a particular class (‘there’s a 90% probability that this image shows plastic garbage’)” [
20] (p. 1).
There are several benefits to using TM in the classroom. TM works by providing opportunities to analyze data without the need for explicit programing [
14]. In addition, the tool has the potential to support teachers and their students in making predictive decisions connected to the curriculum [
21]. TM can support students’ computational thinking skills [
22]. While TM in the K-12 classroom is growing, there are a limited number of resources for teachers and other educators (like caregivers) to motivate and inspire students regarding the use of TM [
23].
TM can be used across all K-12 grade levels to support STEM learning [
24]. TM has been used in early childhood education to support students’ attainment of goals; TM enhanced students’ learning experiences and supported their educational growth [
25]. At the middle school level, sixth graders co-designed with teachers using TM [
26]. Researchers found that TM is a “… feasible and mature tool for average users with limited or no previous experience on programming or related subjects” when working with sixth grade students (p. 310). Researchers examined TM with children age 3 to 13 (
n = 18) in an informal setting [
27]. They found that TM supported students’ understanding of how algorithms work. Students developed richer data literacy and conceptual understandings no matter what their grade level. TM was used as part of a professional development (PD) experience for high school teachers in STEM disciplines, including biology, chemistry, engineering, mathematics and physics [
28]. Results showed that teachers were more comfortable using TM compared to other technologies to support STEM lessons.
TM has a variety of uses. Importantly, at the K-12 level, students can be encouraged to participate in the integrative process of data collection and analysis. Irgens and colleagues highlight how TM can be used to help students use data to test and evaluate [
29]. When using TM, images (or sounds or poses) are uploaded to train a model. Other images (or sounds or poses) are used to test that model. Findings can be evaluated and the trained model can then be tested, adjusted, redesigned and retested—an iterative process should occur and is commonly recommended to promote critical thinking, design and evaluation [
30]. For example, when high school students designed and tested a model to create a solution to a problem, their critical thinking and problem-solving skills improved [
31]. TM is an efficient way for students from a variety of grade levels to build and test a model with specific features to promote critical thinking and iterative design adjustments [
29].
Capitalizing on TM strengths, TM content was used to contextualize STEM explorations. The objective of this research was centered around providing TM PD, then measuring its impact on in-service middle school teachers’ perceptions of science lessons after participation. The structure of TM science content is provided to contextualize the PD. The impact of this science content on in-service middle school teachers’ perceptions of traditional science lessons was explored, answering the following research question: how did computer vision PD that included TM impact middle school teachers’ perceptions of teaching science? Personal Construct Theory [
32] procedures were used to answer this question through pre- and post-PD hierarchical cluster analysis. Recommendations for future practice and research are described.
2. Overview of TM
TM has been used in a plethora of fields and settings because of its ease of use and intuitive nature [
14]. The most common deployment of TM has been for K-12 education, and several researchers have discussed TM in primary [
26,
33] and secondary [
24,
34] schools. In contrast to these previous works, our current research focuses on the use of TM for middle school science curricula, within the context of teacher PD, and assesses the impact of the PD through the use of Personal Construct Theory.
Outside of the school setting, TM has been leveraged as an actual tool in scientific research and applications. For example, TM was used to classify shorebirds and waterbirds. Researchers found that an evaluated TM model had a 100% accuracy rate in identifying birds, while some models that were evaluated were less accurate. They concluded that TM can be trained to recognize bird species and has the potential to evaluate extensive data [
35]. TM was used in the classification of melanoma cell images. Researchers used TM to develop a risk score for melanomas, training TM using 500 images to create a risk score for 331 different images that were uploaded and classified. TM was able to accurately predict prognosis for low- and high-risk groups. Researchers concluded that TM showed promise in considering melanoma risk using a slide image [
36]. In one final example, TM was used to determine a tooth-marked tongue or not [
37]. Using a database of tooth-marked tongues, 90% of the images were uploaded to train TM while the rest were used to test the accuracy of TM. The accuracy of TM was 92.1% for tooth-marked tongues, and 72.6% for non-tooth-marked tongues.
These three examples show how TM can be used across a plethora of science fields to support the identification, classification and/or diagnosis of images, and is not merely a “toy example” solely for educational purposes. The examples show that TM can be used in real scientific settings; TM has the potential to support the learning of science in the K-12 classroom as well. Students can use TM to investigate hypotheses about data (and the categories contained within the data) in an inquiry-based fashion. We focus specifically on the use of TM in the middle school classroom by providing an example of how to train TM specific to a geography lesson. Then, several lessons are presented that illustrate how TM can be used in a multitude of science fields at the middle school level.
2.1. Using TM in a Geography Lesson
TM can be used to train a computer to recognize images, sounds or images of humans with detected joint, limb and facial features collectively known as human poses. To train a computer to recognize images, pictures can be taken from the computer’s camera or uploaded into TM. For example, to train a computer to recognize a mountain or iceberg, images of both objects can be uploaded into the application. Audio as well as images of humans with detected skeletal poses can also be uploaded (i.e., from a webpage) or can be recorded directly using the computer’s microphone or camera. TM is fairly easy to use, is highly intuitive, and does not require background training [
38]. At least two classes are needed for categorization (e.g., iceberg vs. mountain), but more can be added to the interface depending on the use case.
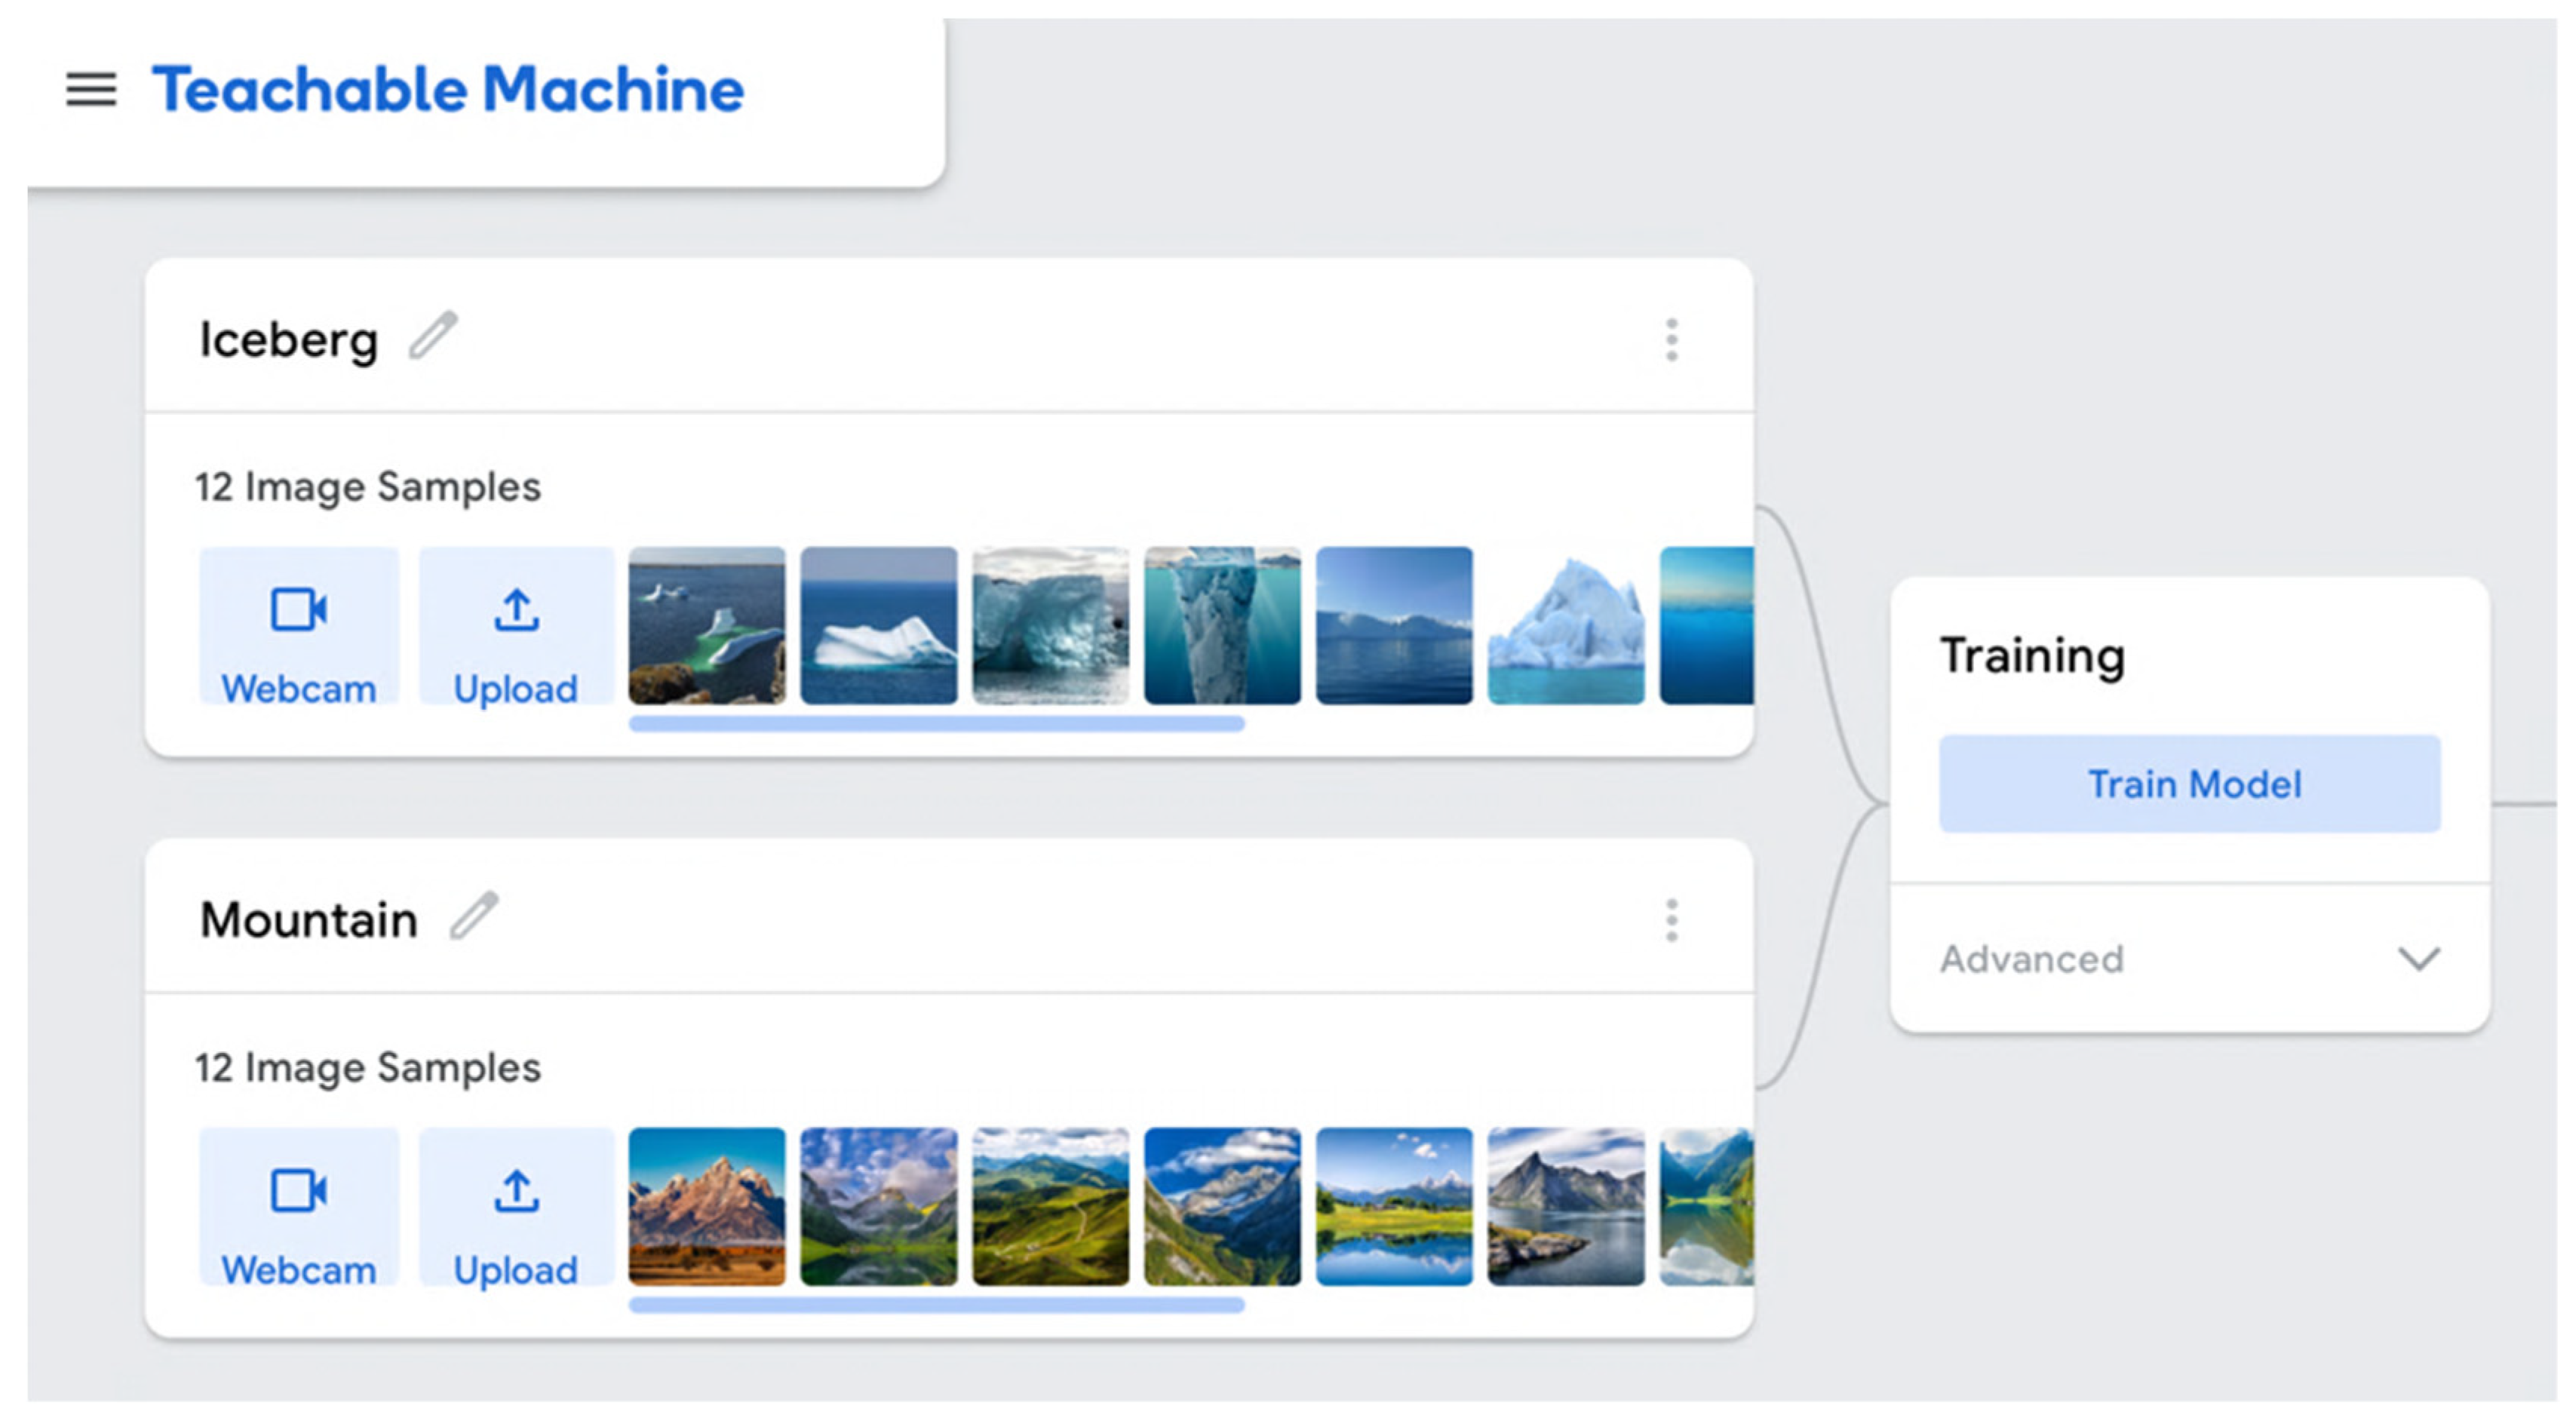
As images (or sounds) are entered or uploaded, the user labels the images corresponding to a category. For example, as images of mountains are uploaded, the machine must be told that the image is that of a mountain (and vice versa for an iceberg). The more images used to train TM, the more likely correct identification will occur. For example, if 12 images each of icebergs and mountains are uploaded, the machine is trained using those 24 images (see
Figure 1). If 1000 images are uploaded, the machine has more images to reference as it is trained.
Once the images are uploaded and the user has clicked “train model” to perform machine learning, the model can be tested for accuracy.
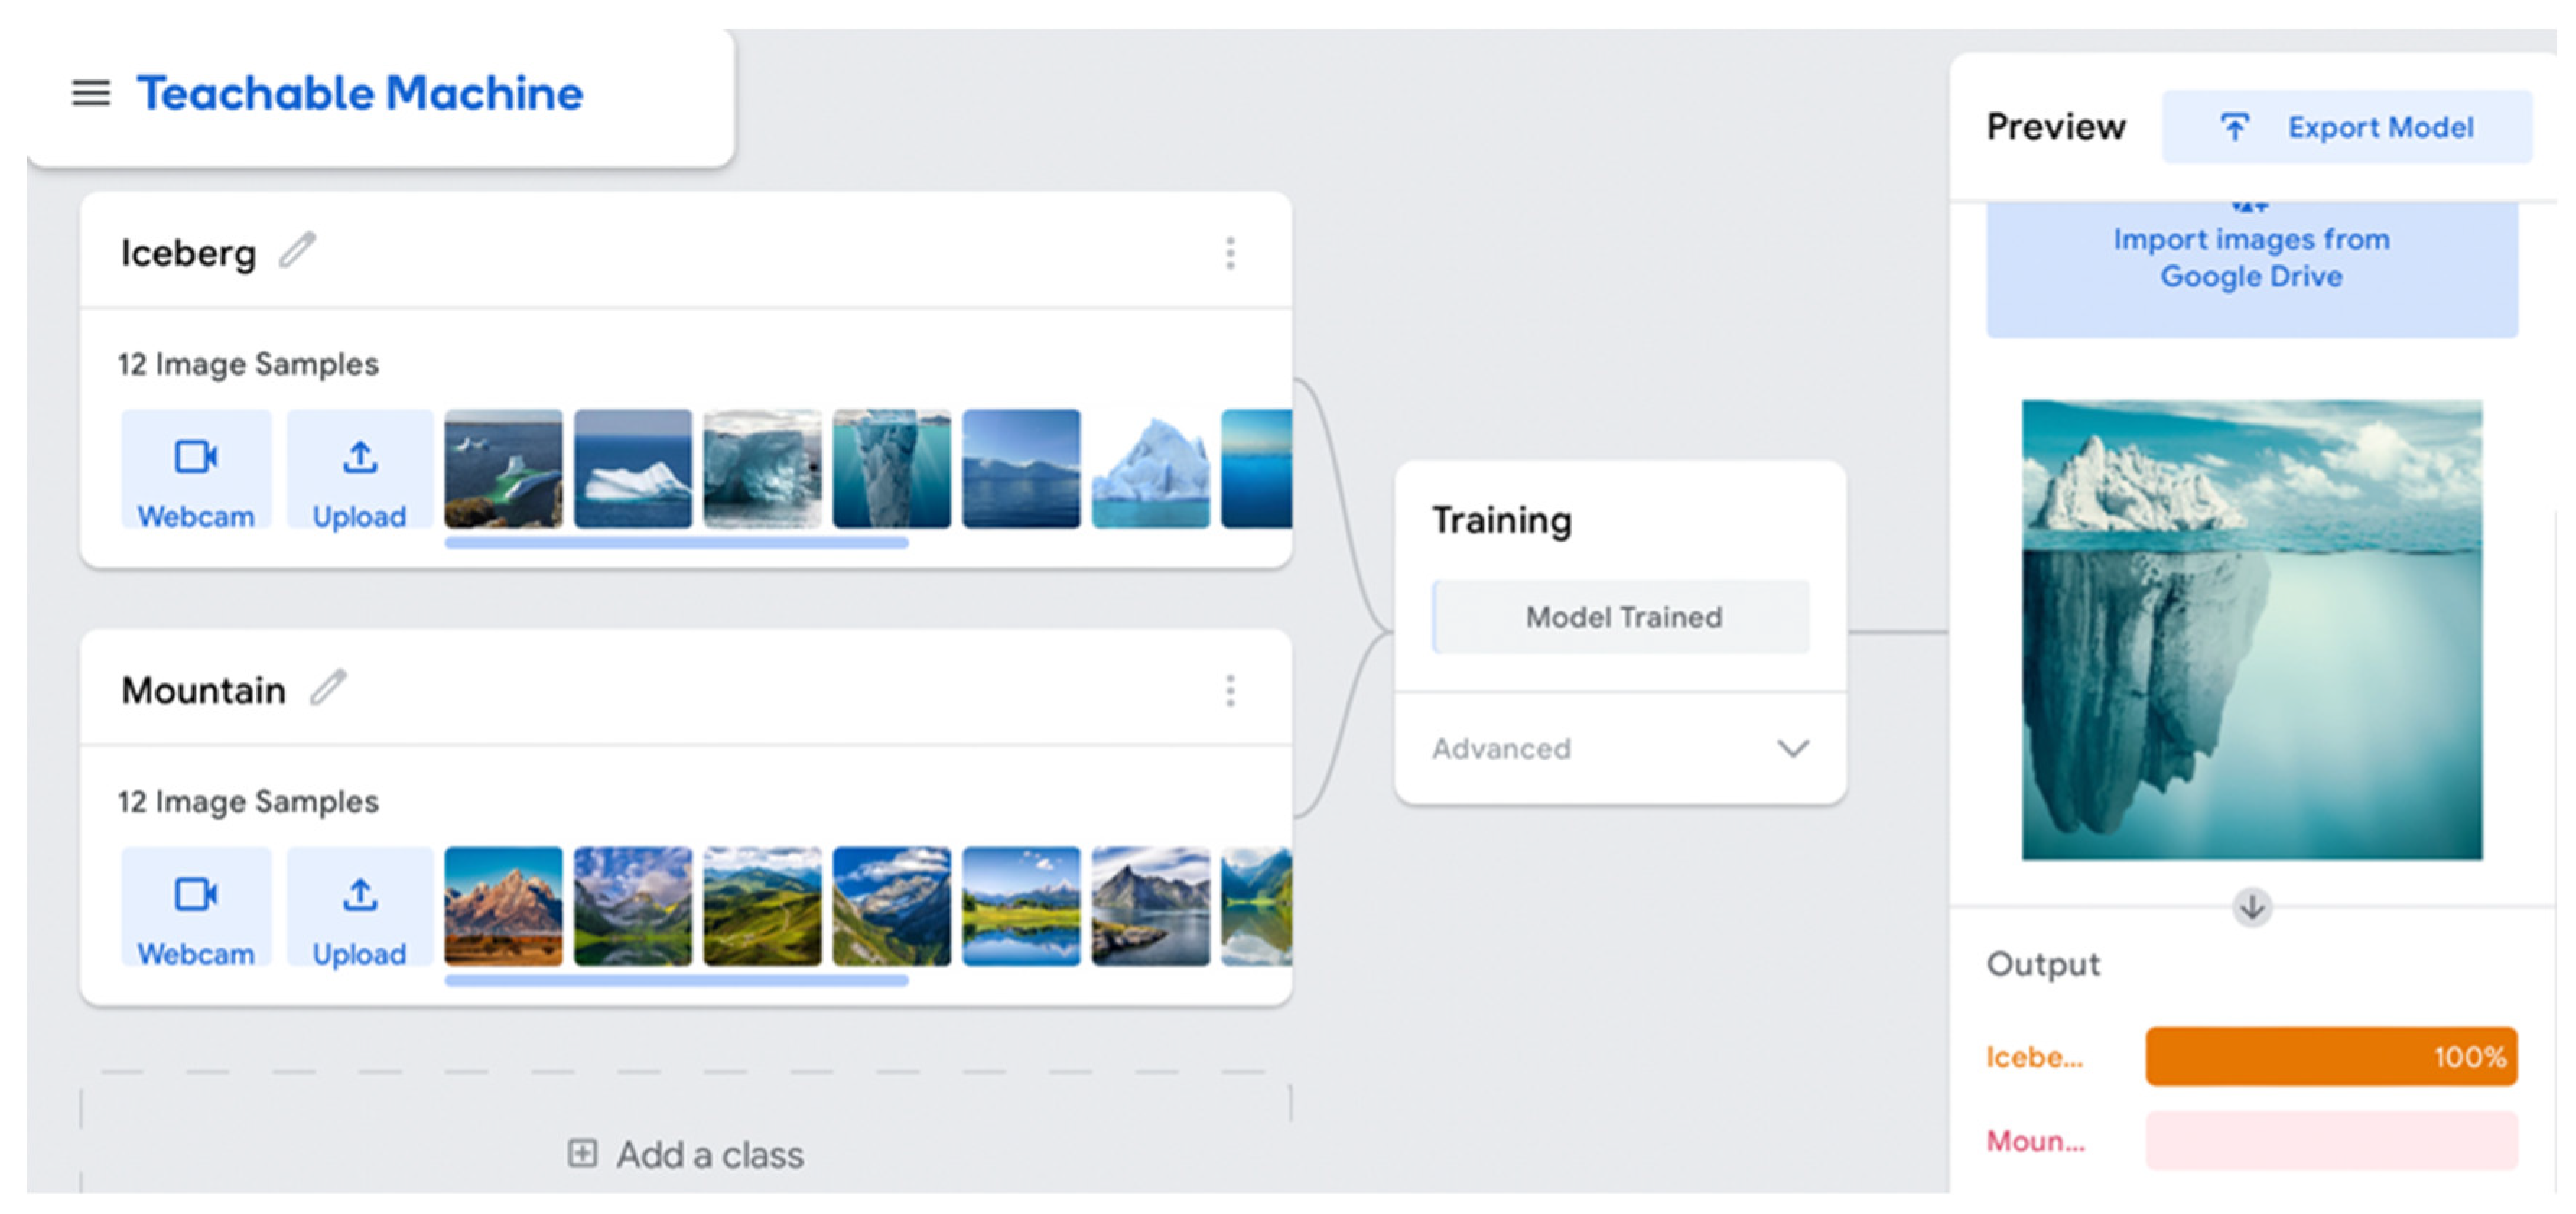
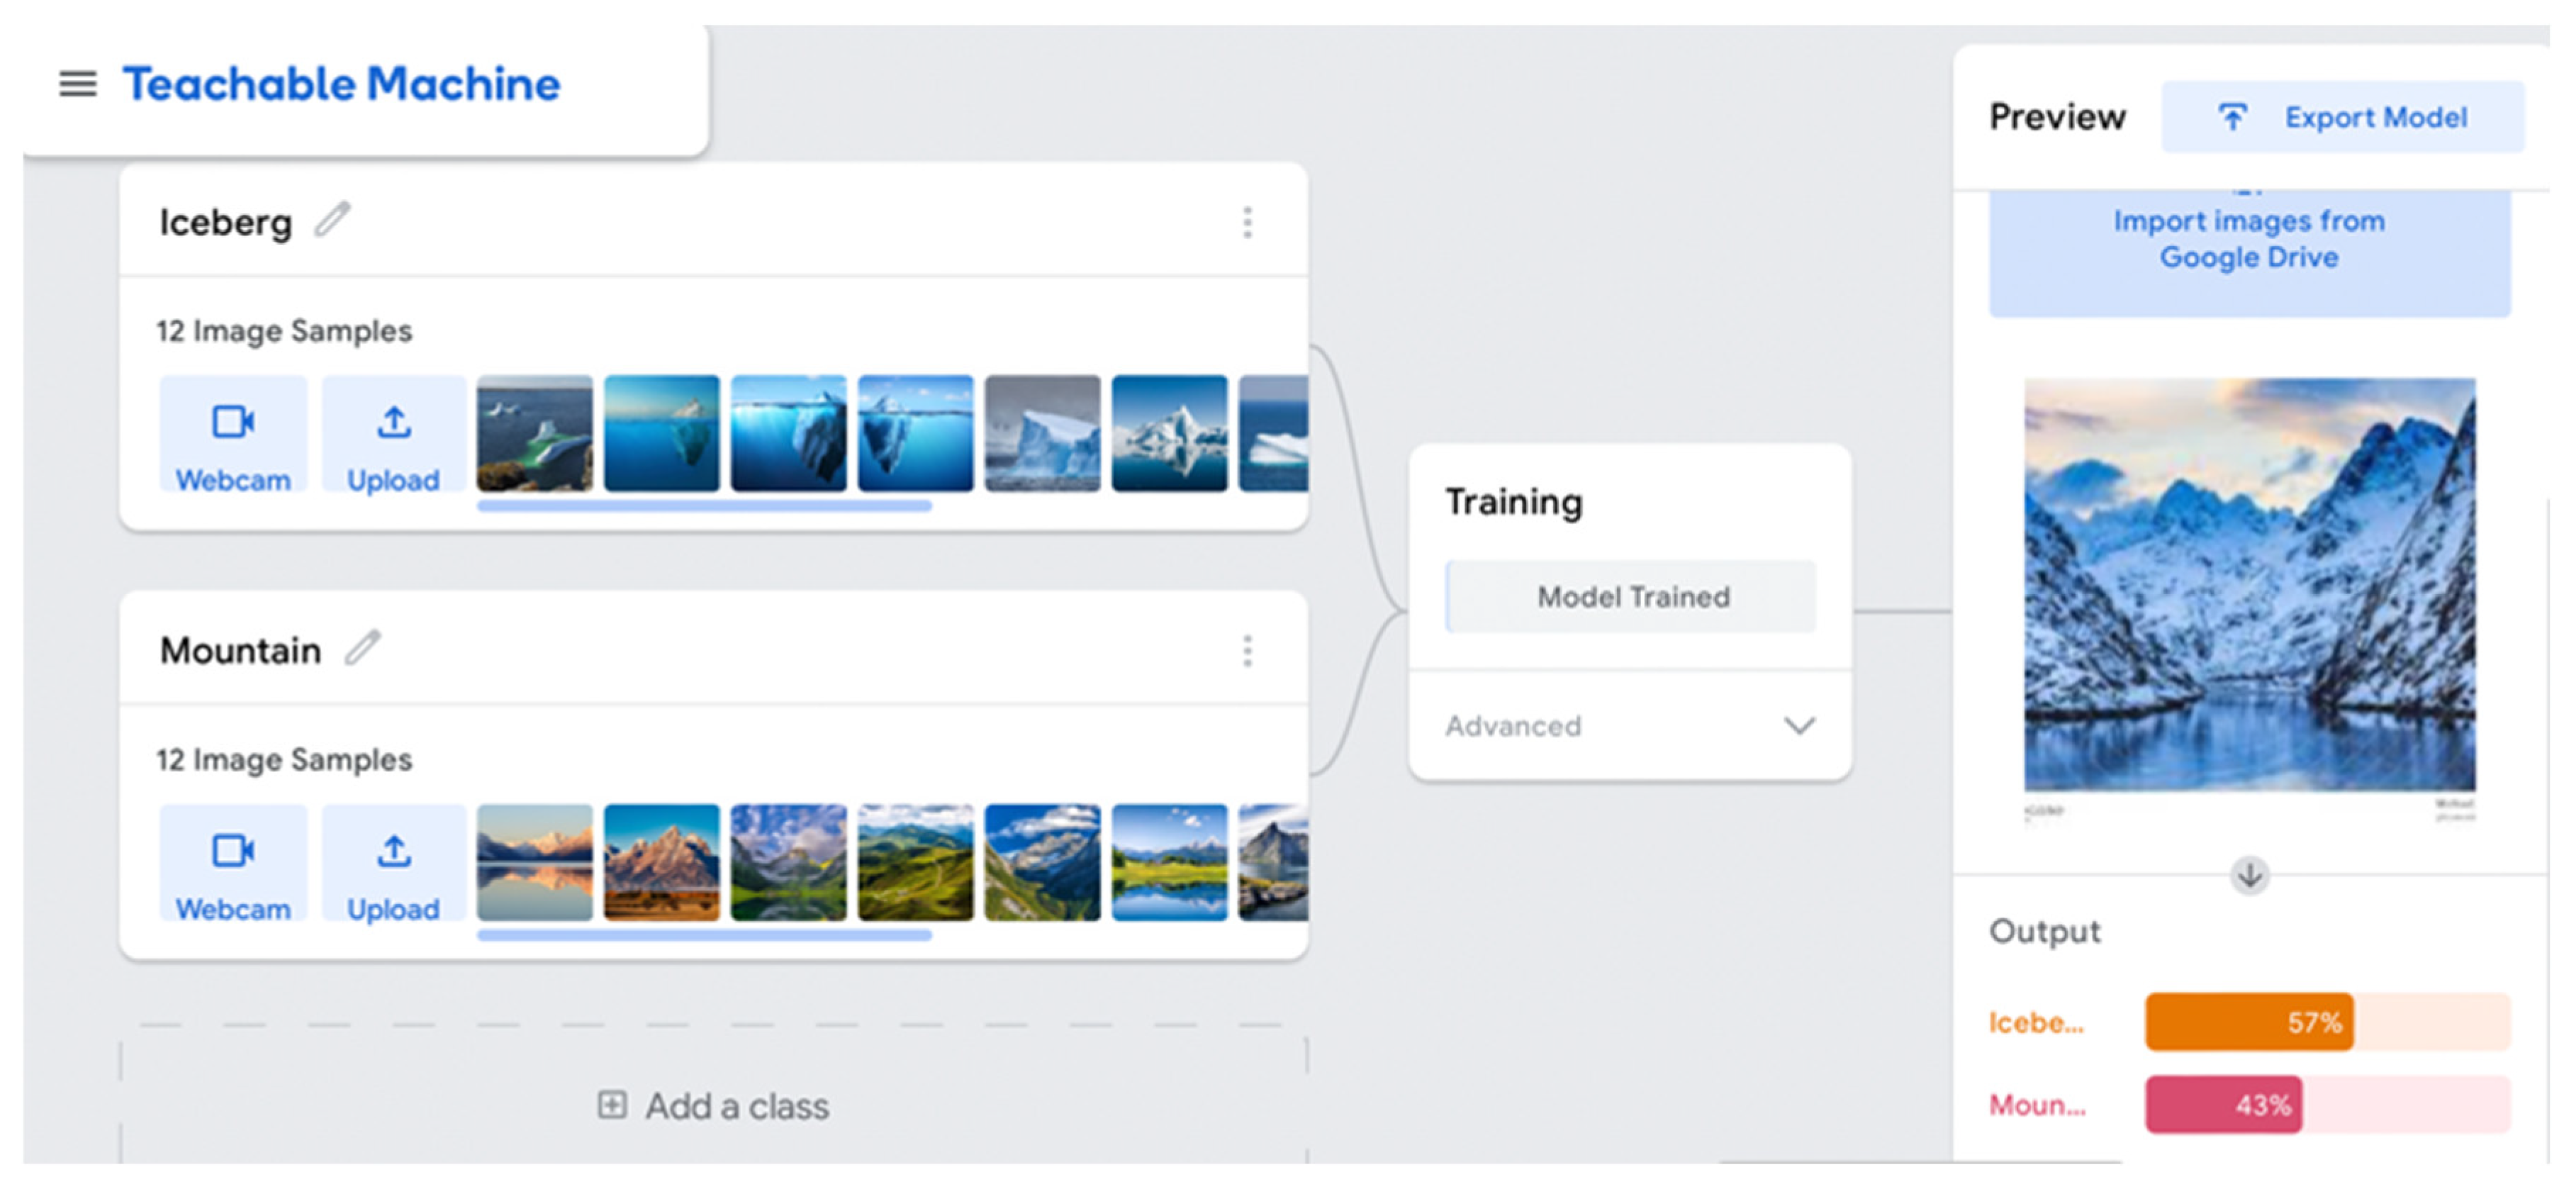
Figure 2 shows TM properly identifying an iceberg; to the right of the image, TM is estimating accuracy at 100%. However, the model is unsure of the uploaded image of an icy mountain reflected in water (
Figure 3) with an estimated accuracy of 57% for an iceberg and 43% for a mountain.
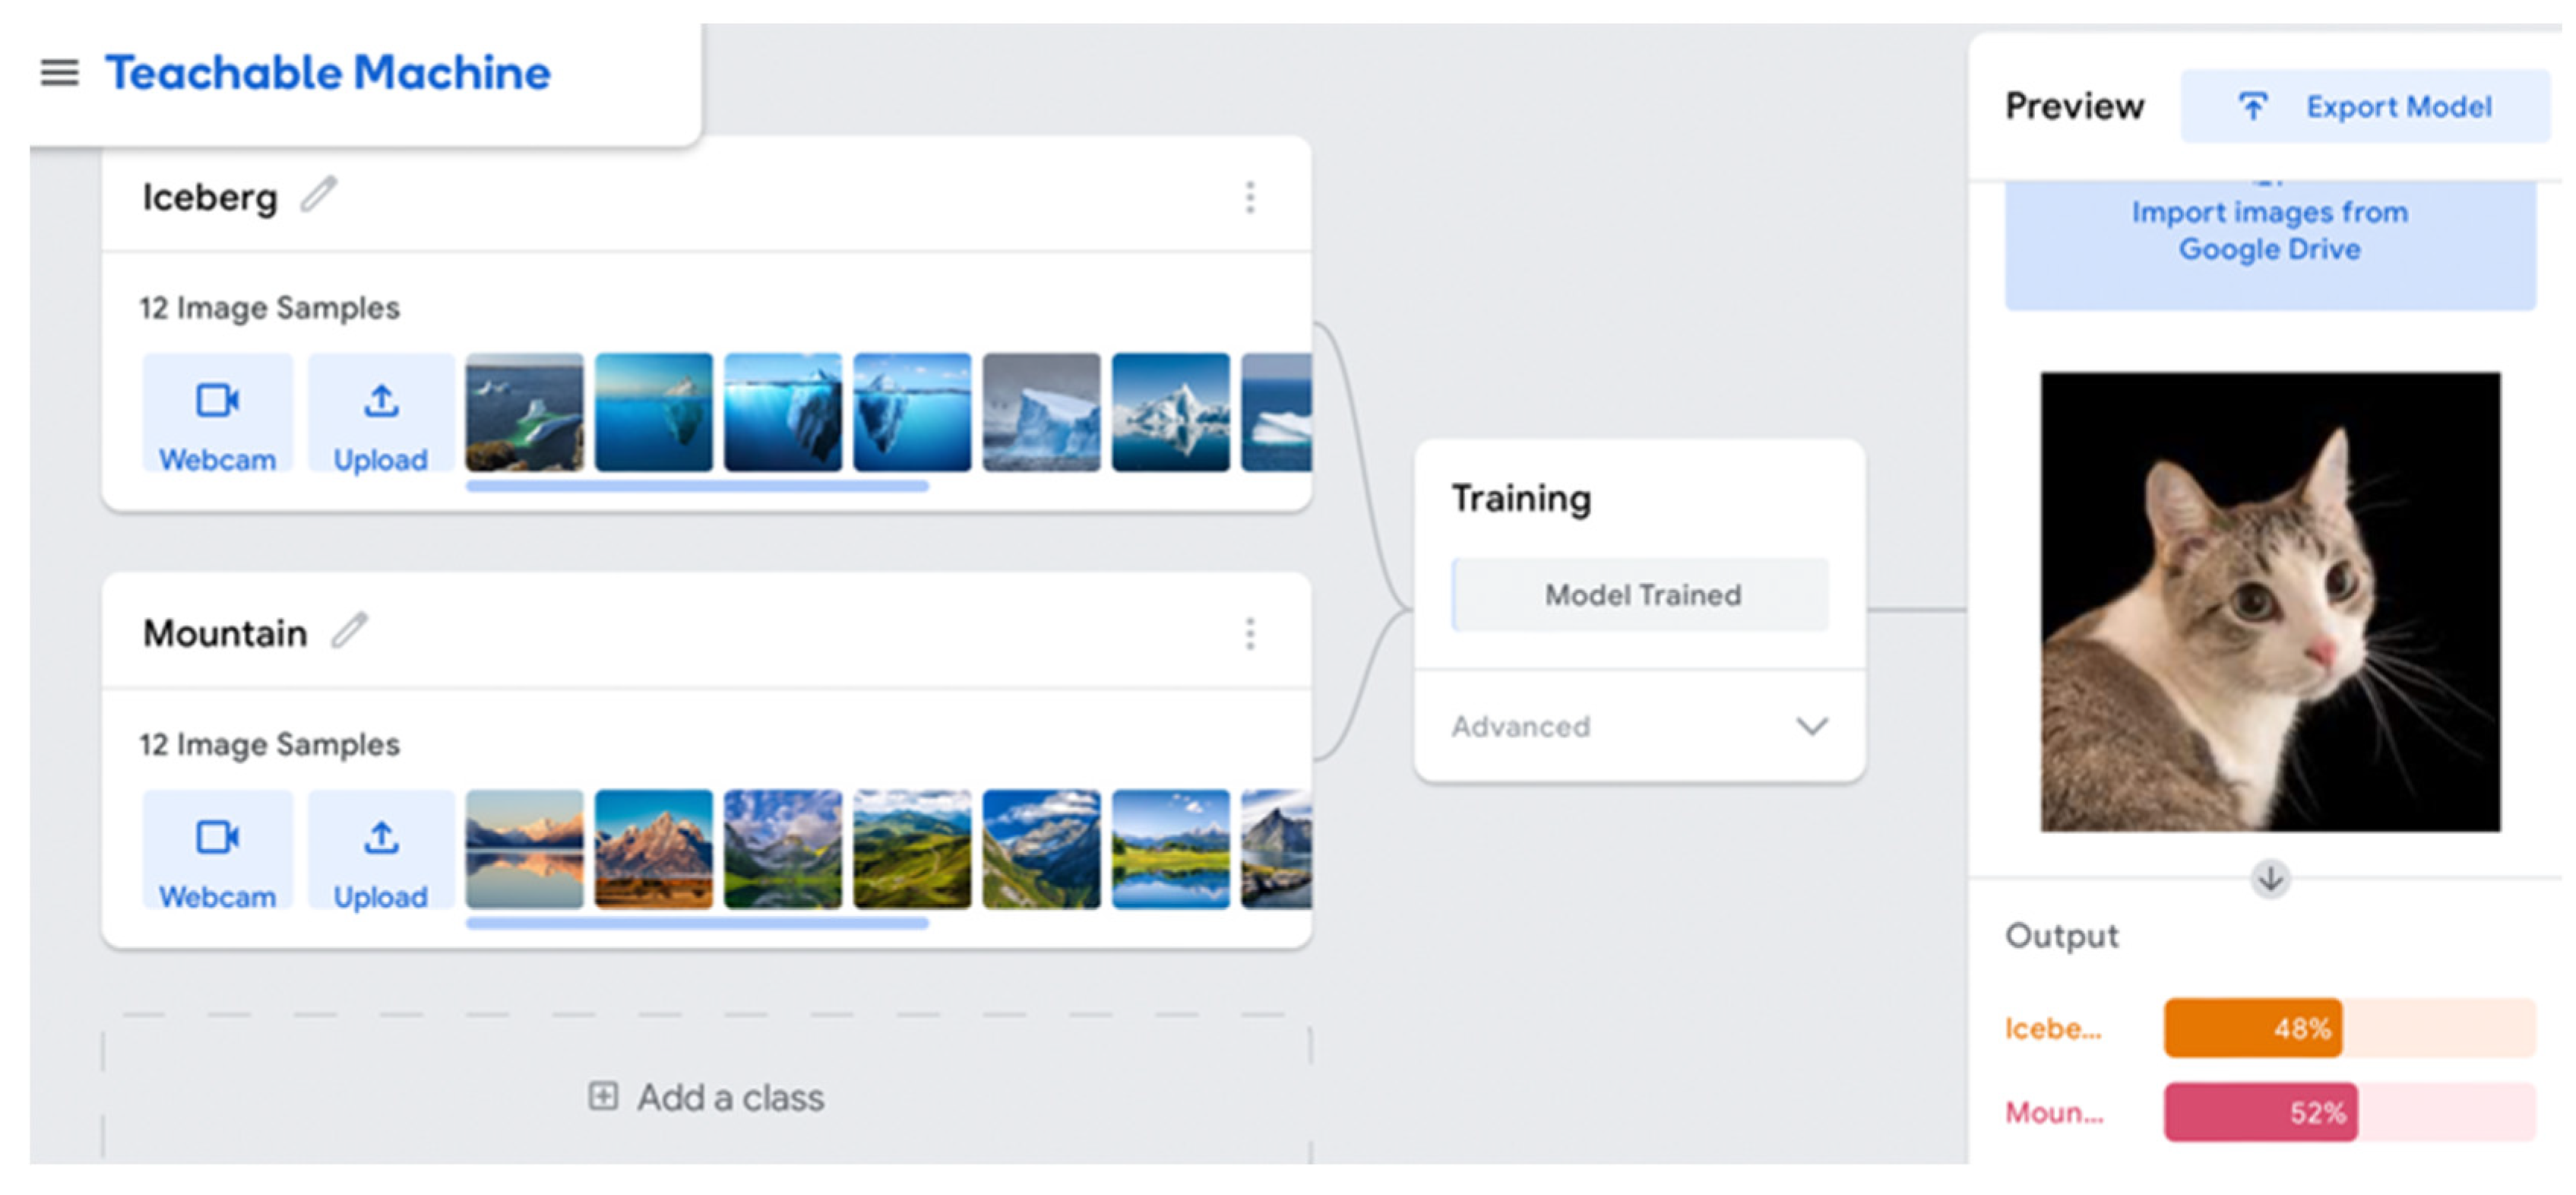
TM can only identify uploaded images based on the images used to train it. For example, if an image of a cat is uploaded, TM must identify whether it is an iceberg or a mountain (likely an approximate 50–50 identification as an iceberg or mountain) (see
Figure 4). When an example like this was shared with middle school students, they mistakenly concluded that the model “thinks” the cat is 48% iceberg and 52% a mountain. This misconception would need to be addressed. TM identifies a 48% likelihood that the image is an iceberg. There can be more than two categories as well, and this may help with the accuracy of identifying objects. If there was a third category of “neither an iceberg nor mountain” with corresponding uploaded images, percentages would certainly change. Students can be asked to make a conjecture regarding how a third “neither an iceberg nor mountain” category impacts TM’s accuracy.
The key to using TM with middle schoolers is not the play aspect; rather, the key is analysis as related to its identification of images. In the given iceberg/mountain activity, a connection to geographical features is critical. For example, students might be asked to describe what features of an iceberg distinguish it from a mountain. Can you find an imagine of a mountain with the features of an iceberg (or vice versa) that you think might confuse TM? Test your conjecture. Students can also be prompted to train TM to identify different types of icebergs and/or mountains. Conjectures, discussions and analysis should focus distinctly on the geographical features and what exactly the model is distinguishing to create the algorithm.
TM has been implemented in a variety of K-12 settings. TM was used to help primary school children design their own app [
26]. Researchers found that TM supported students’ development. However, there was a learning curve that needed to be considered. Generally, TM is easy to use and can support students in using neural networks without too many technological challenges. Nevertheless, there needs to be enough time dedicated to allow students to learn and explore. In a recent study, TM was used as part of artificial intelligence curriculum during a 30 h workshop with middle school students [
39]. Researchers found that their workshop supported student engagement, conceptual learning and students’ self-efficacy. TM was used in conjunction with other technology to support student learning and confidence in their ability to design using technology.
2.2. Moving beyond the Black-Box
One difficulty of using TM is the “black-box” nature of convolutional neural networks, the class of machine learning model used by TM. While neural networks are adept at supervised learning tasks such as classification, there is a lack of interpretability or ability to explain how the system comes to make its decision, and there is an active area of research to mitigate these issues [
40]. In the current version of TM, it is impossible to look under the hood to determine what characteristics or special features of the input data is being considered when the machine makes a decision. This may stymie students who cannot investigate deeper.
However, we argue that there is an interesting approach to mitigate this issue. Students can control the types of input data they enter into TM. Thus, dataset curation and changing one factor/characteristic of the data at a time and observing TM’s performance can help illustrate what features matter the most for classification. For example, students could try to ascertain whether color is an important cue for image classification by comparing TM performance for both color and black-and-white images. We argue that this type of investigative reasoning about data sources helps build rigorous scientific thinking skills.
2.3. Science Lessons Using TM
In relation to our science lessons, TM was used as part of a computer vision summer camp designed for middle school students while also attended by in-service teachers who participated in the same lessons, but in the form of PD [
41]. They attended in unison for about three hours per day. In the first week, the teachers watched project personnel teach the lessons, then participated in curriculum development for about two hours after the middle school students left. During the subsequent weeks, teachers designed and taught a lesson of their own design to a new group of middle school students. The summer camp and PD were part of a National Science Foundation (NSF) grant that emphasized the use of computer vision technologies.
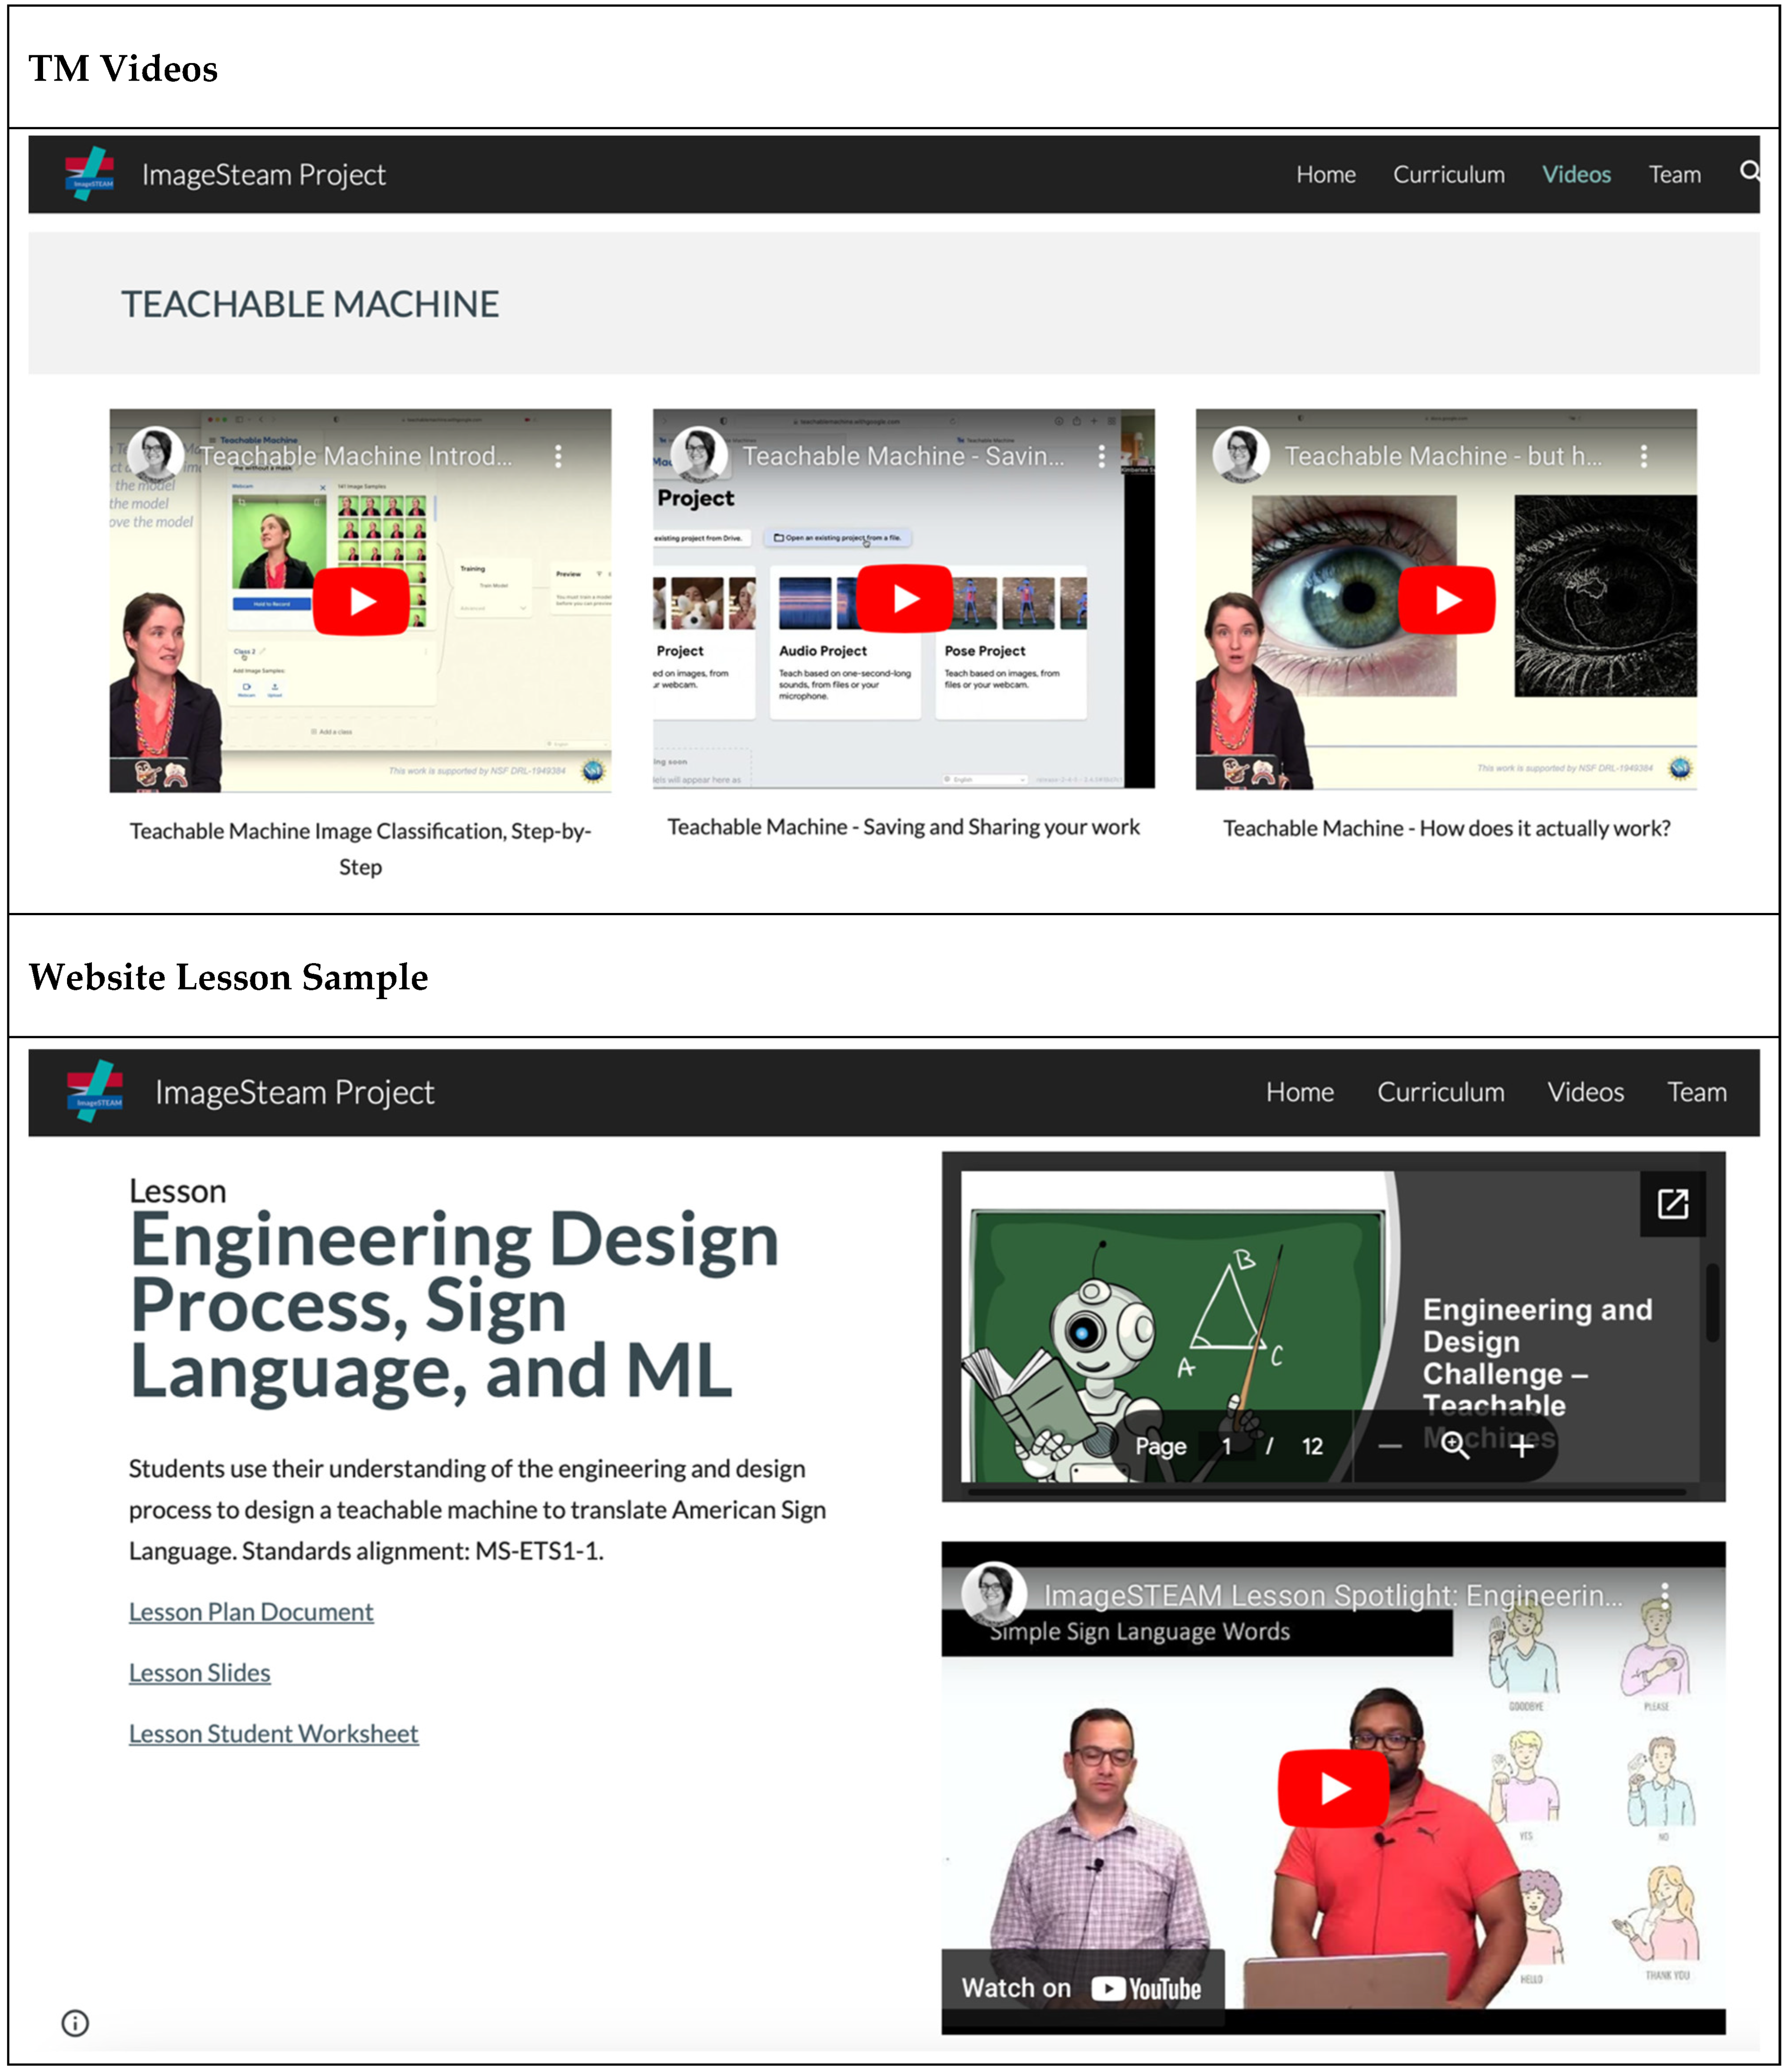
Initially, TM was introduced. The first activity involved using the computer’s camera to train the machine to identify whether or not someone was wearing a facemask (as related to the pandemic). How a beard, scarf, sunglasses and wearing a facemask on the chin impacted the model was also explored. As a group, middle school students were prompted to train TM to identify something of their choice. For example, TM was trained by students to identify the dab (a celebratory dance pose) and not the dab. Various students posed in front of the camera modeling the dab or another dance pose (e.g., the floss). After students were provided time to recognize how TM works, more STEM based activities were explored. Presented here are four lessons created by in-service teachers, highlighting the use of TM in science. Some of the lessons and supportive videos are available at the following URL
https://www.imagesteam.org (accessed on 24 March 2024) as an open-source curriculum (please see
Figure 5). While here we solely focus on science, our available lessons expand across a variety of subject areas and open-source technologies. Some of the topics include engineering/STEM, art and design, English language arts/social science and mathematics. Supplemental videos are also available including videos on the basics of digital images, image editing, computational cameras, machine learning, training and data, object classification and detection, three-dimensional worlds and other free online tools.
2.3.1. Cancer Cell Identification
One of the lessons used images of cancer cells and non-cancer cells. This was part of a lesson designed to teach students about cell mitosis and how unchecked mitosis leads to the formation of cancerous cells. TM was programed using a free online dataset of cancer cell images and non-cancer cell images taken from a microscope. Images were uploaded into TM in these two distinct categories. Then, cancer and non-cancer images that were not originally used to train TM were uploaded to test the accuracy of TM. The accuracy of the model for identifying images of cancer cells was tested through data collection. This lesson provoked important questions for discussions: (1) What is TM identifying as it categorizes cells? (2) How accurate was TM in identifying cancer cells? (3) What are the potential risks and potential benefits of using TM (rather than humans) to identify cancer cells? (4) Could TM trained to identify cancer cells replace a scientist or physician who identifies cancer cells? Are there any ethical or scientific concerns regarding this scenario?
2.3.2. Locations Hit by Hurricanes
Another lesson centered around training TM to recognize locations hit by Hurricane Harvey. The model was programmed to recognize flood-damaged locations using arial photographs of hurricane-damaged locations and non-hurricane-damaged locations in Texas after Hurricane Harvey. The machine was tested for accuracy by using the trained model to identify example and non-example images. Some discussion questions included the following: (1) What indicators is the trained model using to identify a hurricane location? (2) Was TM accurate? What kinds of images might improve TM’s accuracy? (3) Why would a trained model like this be helpful after a hurricane? (4) Could this hurricane/non-hurricane model be used for other natural disasters? Why or why not?
2.3.3. Sonar, Plate Tectonics and Machine Learning
In this lesson, students learned about plate tectonics and sonar in a lab involving ping pong balls and collaborative data collection. Students uploaded audio clips to TM emulating the ping of a sonar system at various distances (e.g., 3 feet and 6 feet away). They then trained the model to differentiate sounds based on the perceived distance. The lesson then concluded with illustrating how sonar can be used for mapping the seafloor and identifying convergent and divergent plate boundaries. Some discussion questions included the following: (1) What is the physical relationship between sound speed and distance traveled in sonar? (2) What is an algorithm and how is TM using one? (3) How can TM learn to differentiate between audio signals from different distances? (4) How does measuring the depth of the seafloor with sonar help our understanding of plate tectonics and boundaries?
2.3.4. Translucent, Transparent and Opaque
This lesson asked students to distinguish the differences between translucent, transparent and opaque materials and how light flows through each. The students partook in a lab where they shifted the transparency of water using juice or milk and compared the computer’s ability to see through it. Students used a glass of water diluted by varying amounts of juice or milk, captured images of the glass with their webcams, and uploaded them into TM. Students proceeded to train the machine learning model to identify the level of translucency (roughly categorized) present in the liquid. Some discussion questions included the following: (1) What are some observations about the liquid that help identify it as transparent/translucent/opaque? (2) How accurate was TM in identifying these properties? How would you make the model more accurate? (3) What are some applications you can think of where you might like to use this machine?
3. Theoretical Framework
Personal Construct Theory is a methodology commonly used to gain insight into people’s thinking. A key element of this theory is that individuals actively construct their own understanding of the world based on their unique experiences and perspectives [
42]. People’s narratives, perspectives and stories can be better understood through the theory [
43]. In the context of teacher education, this theory can help researchers gain insight regarding how teachers develop their beliefs, make curricular decisions and design instructional practices [
44,
45]. By examining how teachers construct their understanding of teaching and learning, researchers can explore the factors that influence teacher development. This understanding can then inform the design of more effective teacher education programs and interventions that support teachers.
We sought to examine the impact of using TM on middle school teachers’ perceptions of teaching science after participating in computer vision PD that included TM. Our research question was how did computer vision PD that included TM impact middle school teachers’ perceptions of teaching science? We used Personal Construct Theory [
32] in our investigation of the research question. This theory is advantageous because survey instrument constructs come from participants, not researchers [
46,
47], thereby reducing bias [
48].
4. Methods
There are a multitude of data collection and analysis techniques within Personal Construct Theory. For this research, we used the repertory grid technique, which is the most common technique [
49]. The structure of our data collection started with the evaluation of similarities and differences between an element through pairwise comparison, described in the Instrument Development section. Participants’ responses informed the creation of the repertory grid that included constructs (
n = 16). The constructs, rated on a Likert scale, were derived directly from the participants through pairwise comparisons, described in the Data Collection section. Then, dendrograms were created using statistical software, described in the Data Analysis section.
4.1. Participants
Participants were Arizona and Georgia middle school teachers in any subject area (e.g., mathematics, science, English, social science, media arts). A total of nineteen teachers participated in the program, ten were from Arizona and nine were from Georgia. The group consisted of twelve females (63%), six males (32%), and one non-binary individual (5%). Twelve of the teachers (63%) worked in Title I schools. The teachers had varying levels of experience, ranging from 1 to 23 years, with an average of 9–10 years in the classroom. In terms of ethnicity, the majority of teachers (63%) identified as white, followed by 15.7% as black or African American, 10.5% as multiple ethnicities and two teachers who preferred not to disclose their ethnicity. Initially, data were gathered from all 19 teachers; only the teachers who completed both the pre- and post-repertory grid were included in this analysis (n = 17). IRB approved this study; consent was received from all participants.
4.2. Instrument Development
For this particular study, PD was offered consecutively across years. In the initial pilot study, the instrument was created and administered to participants within a very short timeframe. Participants were asked to make pairwise comparisons, then researchers quickly used their responses to generate and administer a repertory grid. Data for the repertory grid were only collected from participants in Arizona because the Georgia PD started later in the summer and it was not possible to gather data from both participant groups at the same time. Through our pilot study, we felt that the participants were likely experiencing survey fatigue. They provided data regarding this study, as well as other data collection associated with the PD resulting in two days of data collection. Therefore, we decided to use the repertory grid developed during the previous year for this study to reduce the amount of data collected. While constructs were not researcher generated, they did not come from the participants (n = 17) in this study.
The participants completed a pairwise comparison to these prompts: How are middle school lessons in artificial intelligence the same as typical middle school science or mathematics lessons? How are middle school lessons in artificial intelligence different from typical middle school science or mathematics lessons? The instrument development technique is illustrated with a specific example. In response to the second prompt, a participant stated: “These lessons are different in that the teachers teaching them are not experts in the field of artificial intelligence. They may not have had experiences to draw from, and even a text book published in 2019 may be out dated.” We sought to extract constructs that were specifically related to middle school lessons. The constructs from this participant included the following: Traditional Science middle school classroom activities and lessons… “are taught by teachers with strong content knowledge” and “become quickly outdated.” Writing all constructs in a positive form (i.e., “teachers with strong content knowledge” versus “teachers teaching them are not experts”) makes comparisons of all constructs easier. Rephrasing of constructs to balance multiple responses also occurred. For example, one participant stated “I would expect them to be standards based”; another stated “standards are integrated”; and yet another said “it’s hard to tie to all standards.” Their responses yielded the construct “are tied to academic state standards.” Participant responses to this question resulted in 16 constructs, which were then used to form the repertory grid.
4.3. Data Collection and Analysis
The pre-repertory grid was completed at separate points because PD happened at different times during the summer in Arizona and Georgia. The pre-repertory grid was administered before any instruction occurred. Completing an online survey in Qualtrics, participants completed the repertory grid using the matrix format. They rated the constructs on a scale (i.e., strongly disagree, somewhat disagree, neither disagree or agree, somewhat agree, strongly agree). All prompts were force complete, so no missing data occurred if they completed the survey. At the completion of PD and after all instruction took place, the participants completed the post-repertory grid.
The data analysis included calculating descriptive statistics including the minimum, maximum, mean and standard deviation, as well as identifying cluster membership. The data were analyzed using SPSS software, and hierarchical cluster analysis was conducted using Ward’s Method [
50,
51]. The dendrograms were then examined, and the mean and standard deviation for each cluster were calculated based on the variables within that cluster.
5. Results
To answer our research question regarding how participation impacted middle school teachers’ perceptions of teaching science, we examined the constructs before they participated in TM lessons as a teacher and learner, and after they participated.
Table 1 includes the full construct included in the repertory grid as well as the descriptive statistics for each construct (pre- and post-). Pre-PD, the highest constructs had a mean of 4.47 and were “Traditional Science middle school classroom activities and lessons… Encourage tactile learning (Construct 8) and … Include specific vocabulary (Construct 12).” The construct with the lowest mean of 3.24 was “Traditional Science middle school classroom activities and lessons… Have many different potential solutions (Construct 10).” The highest post-PD construct had a mean of 4.57 and was “Traditional Science middle school classroom activities and lessons… Include specific vocabulary (Construct 12).” The construct with the lowest mean of 3.24 remained the same: “Traditional Science middle school classroom activities and lessons… Have many different potential solutions (Construct 10).” Most of the constructs saw an increase in mean values, including Constructs 1, 2, 4, 5, 7, 9, 11, 12, 13 and 16. Several constructs decreased in mean values, including Constructs 3, 6, 8, 14 and 15. Construct 10 had no movement regarding the pre- and post-PD mean.
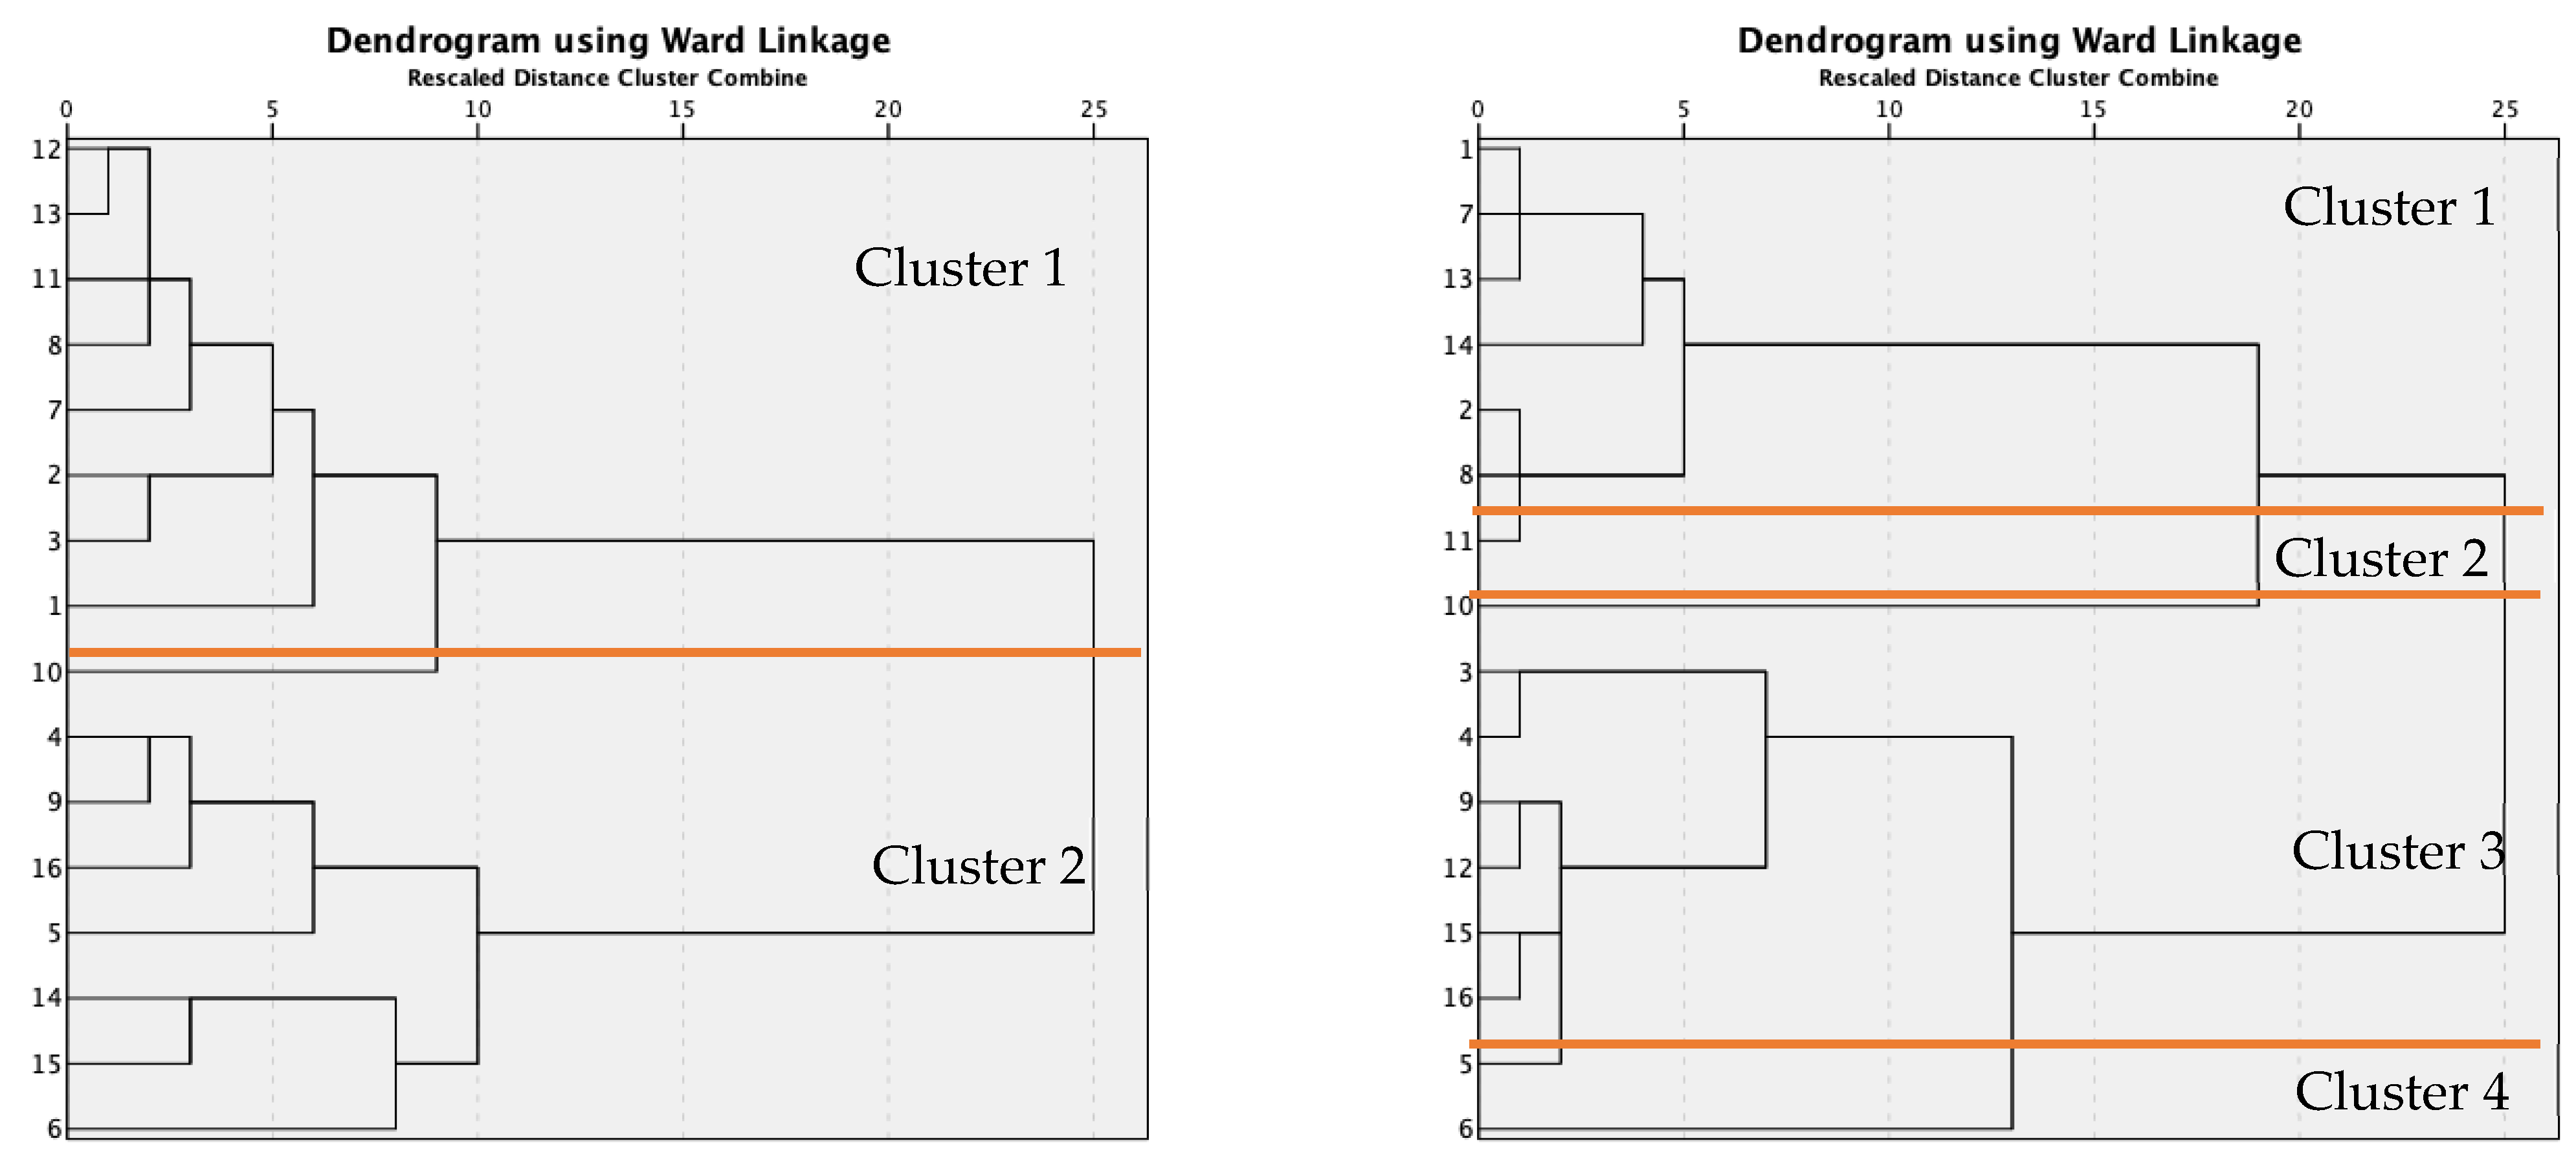
There was an increase in the number of clusters from pre- to post-PD.
Figure 6 shows the dendrograms of perceptions of traditional science lessons pre- and post-PD. To interpret clusters, constructs in the same clusters are similar to one another. Roughly speaking, the closer a construct is to another construct, the more similar they are perceived; the further the distance, the more dissimilar they are perceived [
52]. The lower the length of the bars connecting two constructs, the more similar the constructs are to one another. For example, Constructs 1, 7 and 13 were all part of a large mega-cluster in the teachers’ initial responses (labeled Cluster 1 in the left panel of
Figure 6). After the PD, these three autonomy-support related constructs moved closer to each other (see the top microcluster in the right panel of
Figure 6).
Table 2 highlights the differences in cluster means and standard deviations. Initially, there were two clusters with the constructs almost evenly distributed between them: Cluster 1 contained nine constructs, and Cluster 2 contained seven constructs. The means (rounded to the thousandths to highlight differences) were quite similar with only a 0.004 difference. The post-PD yielded four different clusters with more variation in the means across the clusters. There was much greater range between the constructs, from a low of 3.235 to a high of 4.294, a 1.059 difference.
After the PD, the teachers’ schemas related to science in the middle school classroom reorganized somewhat. Two constructs moved farther away from the original clusters: Constructs 6 (… Become quickly outdated, Cluster 2) and 10 (… Have many potential solutions, Cluster 4). The remaining constructs fell into two clusters, but these appear more coherently organized post-PD, with Cluster 1 featuring constructs related to student autonomy and experiential learning and Cluster 2 featuring constructs related to structure, procedures and expectations.
6. Discussion
The results are framed within Personal Construct Theory data collection and analysis techniques [
32,
49] previously described. Our cluster analyses of the repertory grids suggest that after participation in this middle school teaching workshop, teachers somewhat reorganized their schemas regarding teaching science. They understood a few features as being more distinct—the idea that some problems have many possible solutions and the observation that science lesson plans quickly become outdated. Moreover, after participation in this experiential PD that emphasized computer vision technology including TM, the teachers saw constructs related to students’ active engagement and intellectual autonomy as more tightly related and as more distinct from the set of constructs related to the constraints of structure and routine practices around teaching science.
Personal Construct Theory [
32] was developed to specifically measure people’s narratives and perspectives [
43]. The theory provides insight into how people construct their own understanding based on their unique experiences [
42] and provided insight into our participants’ thinking. Our results suggest a more complex or detailed dendrogram structure in relation to traditional science lessons. Our findings highlight changes in perspectives regarding how science lessons are constructed and taught. Pre-PD, participants’ descriptive statistics of the clusters were similar. The cluster means were uniformly high. However, post-PD, cluster descriptive statistics became more varied. Regarding the pre-PD clusters, both clusters had a mean of ≈3.9. This indicates little distinction between the clusters. Post-PD, cluster means had more variability, with means from ≈3.2 to ≈4.3. The number of clusters also changed from two to four. This variability indicates changes in thinking in relation to the constructs and associated clusters. Constructs were partitioned in a more nuanced and detailed manner.
6.1. Curricular Considerations
Based on the literature review and our experiences during the workshops, several curricular factors should be considered when designing TM middle school experiences. First, there is a learning curve that needs to be considered. While most students are likely familiar with technology, TM is probably new to teachers, and if it is not new, the science lens will likely be novel. There needs to be time to explore TM before delving into the design and creation of a TM model specific to a science curriculum [
26]. There also needs to be time to iteratively test and redesign their model to improve its accuracy as they participate in the design process [
53].
The use of TM can be a way to encourage students to think about careers in STEM [
39]. Class discussions of TM lessons, like those provided, should encourage students to consider how TM might be used to support classification in the real world—when classification of images or sounds might be used to support societal and/or scientific advancements. Early discussions about career opportunities can thrive after TM science lessons are explored.
TM can be up to 100% accurate [
35,
38]. However, there are influences on that accuracy. Lighting, picture quality, and distance from the camera can impact accuracy. For example, during our workshops, when images were uploaded with a similar scale, lighting and angle, accuracy improved. When images were scaled or angled differently, or when lighting was darker, TM was less accurate at identifying the image. Additionally, the meaning of TM’s percentage when classifying an image needs to be evaluated with students, as misconceptions of TM’s percentage occurred (previously discussed). TM’s learning rate is also an important consideration. The learning rate can be a part of a comprehensive evaluation of TM’s effectiveness in classification [
54]. Learners should be prompted to consider the number of images needed and the learning rate to assure the accuracy of TM. How TM’s developing algorithm is impacted by the learning rate should also be discussed.
Scientific data are often classified into two categories. We provided three contextualized examples earlier—waterbirds or shorebirds [
35], melanoma low risk or high risk [
36] and tooth-marked tongue or non-tooth-marked tongue [
37]. However, a binary classification system may not be the most effective for all scientific TM uses. When using TM in the classroom, it is important to emphasize the number of categorizations that might be needed to improve TM’s accuracy.
In our context, middle school teachers and middle school students learned the content together, in unison. They worked as a support for one another as they explored TM with guidance from university personnel in engineering and education fields. Dwivedi and colleagues also designed collectively with middle school students and adults working together and observed growth [
30]. When researchers, parents, community members and children explored and investigated TM together, experiences were positive and promising [
27]. We recommend continued efforts to include community partnerships as TM is explored. Collective learning and experimentation appear to enhance TM experiences.
6.2. Recommendations for Future Practice
With the continued advancements of technologies in the field of STEM, it is vital that teachers are provided with opportunities to experience how technologies like computer vision and machine learning can be fruitfully employed in the classroom. We recommend continued opportunities for both pre- and in-service teachers that are coordinated with university professionals. Because university professionals generally stay abreast of technological advancements, they are an excellent resource for providing training on new technologies. Few teacher education programs include machine learning technologies within their programs of study [
22]. We recommend a concerted focus on the integration of these technologies within teacher preparation programs of study. Lessons and curricula need to be developed and freely shared on a national scale. Access to high quality lessons should be provided to teachers and caregivers to guide their implementation of quality learning experiences. The seamless integration of computer vision and machine learning into STEM fields, particularly required content like mathematics and science, should be a priority to advance meaningful learning experiences. In addition, we recommend continued funding for grants and projects to provide learning opportunities for both teachers and their students across the full K-12 educational continuum, since this could also advance practice. Because of the novelty of TM, there are scant studies on its effectiveness in classroom settings. Researchers conducted a study on the feasibility of TM in the K-12 classroom and found that students and teachers appreciated the technology [
26]. Regardless, there are suggestions for its use in a variety of K-12 settings beyond Google’s TM, like robotics [
25,
55,
56]. We recommend continued opportunities for students and their teachers in grades K-12 with a concerted emphasis on empirical studies that measure how the technology impacts learning and development, moving beyond satisfaction studies.
6.3. Recommendations for Future Research
Computer vision and machine learning technologies are a relatively new frontier in relation to teaching and learning. There is a plethora of opportunities for research to advance the field. Short-term, the impact computer vision technology lessons have on attitudes, motivation and computational thinking should be researched with respect to both teachers and students. New, easy-to-use tools similar to TM can be developed for other machine learning tasks, such as image/audio generation and object detection/tracking, which would help enable new opportunities for middle school science integration. The key is that these tools require little-to-no programming for easy adoption. Our research has shown that exposure to computer vision technologies with in-service middle school teachers resulted in an improved understanding of artificial intelligence and computer vision features [
41,
57,
58]. Long-term, the impact of K-12 computer vision and machine learning experiences on students’ persistence in STEM fields should be explored.
6.4. Limitations
There are several limitations associated with this study. While data were collected across two states (Arizona and Georgia), the sample size of middle school teachers (n = 17) who participated in PD was relatively small. Moreover, this study focused specifically on the use of TM, but the PD included other computer vision technologies. Isolating the impact of TM on the participants’ thinking within the PD was impossible, as other computer vision technologies were used and modeled as part of the curriculum. Furthermore, the duration of the PD program only took place over the summer and was offered for two weeks to Georgia participants and three weeks for Arizona participants. There was no follow up during the academic year. The long-term impacts on teachers’ changes in thinking cannot be assumed or measured due to the limited PD experiences and data collection. The varying durations between Arizona and Georgia were another limitation. As previously discussed, the constructs for the repertory grid were gathered the year before. Ideally, constructs should come from the participants; our constructs came from the prior years’ participants. Finally, the study did not assess the effectiveness of the teachers’ use of TM on their students’ academic performance or engagement in science. Future research should aim to address these limitations and explore the wider impact of integrating TM in educational settings.


