3.1. Descriptive Statistics
To assess the results of motivation as measured by the instrument used, the responses of students who rated the use of each application as positive or very positive were compared. The results are shown in
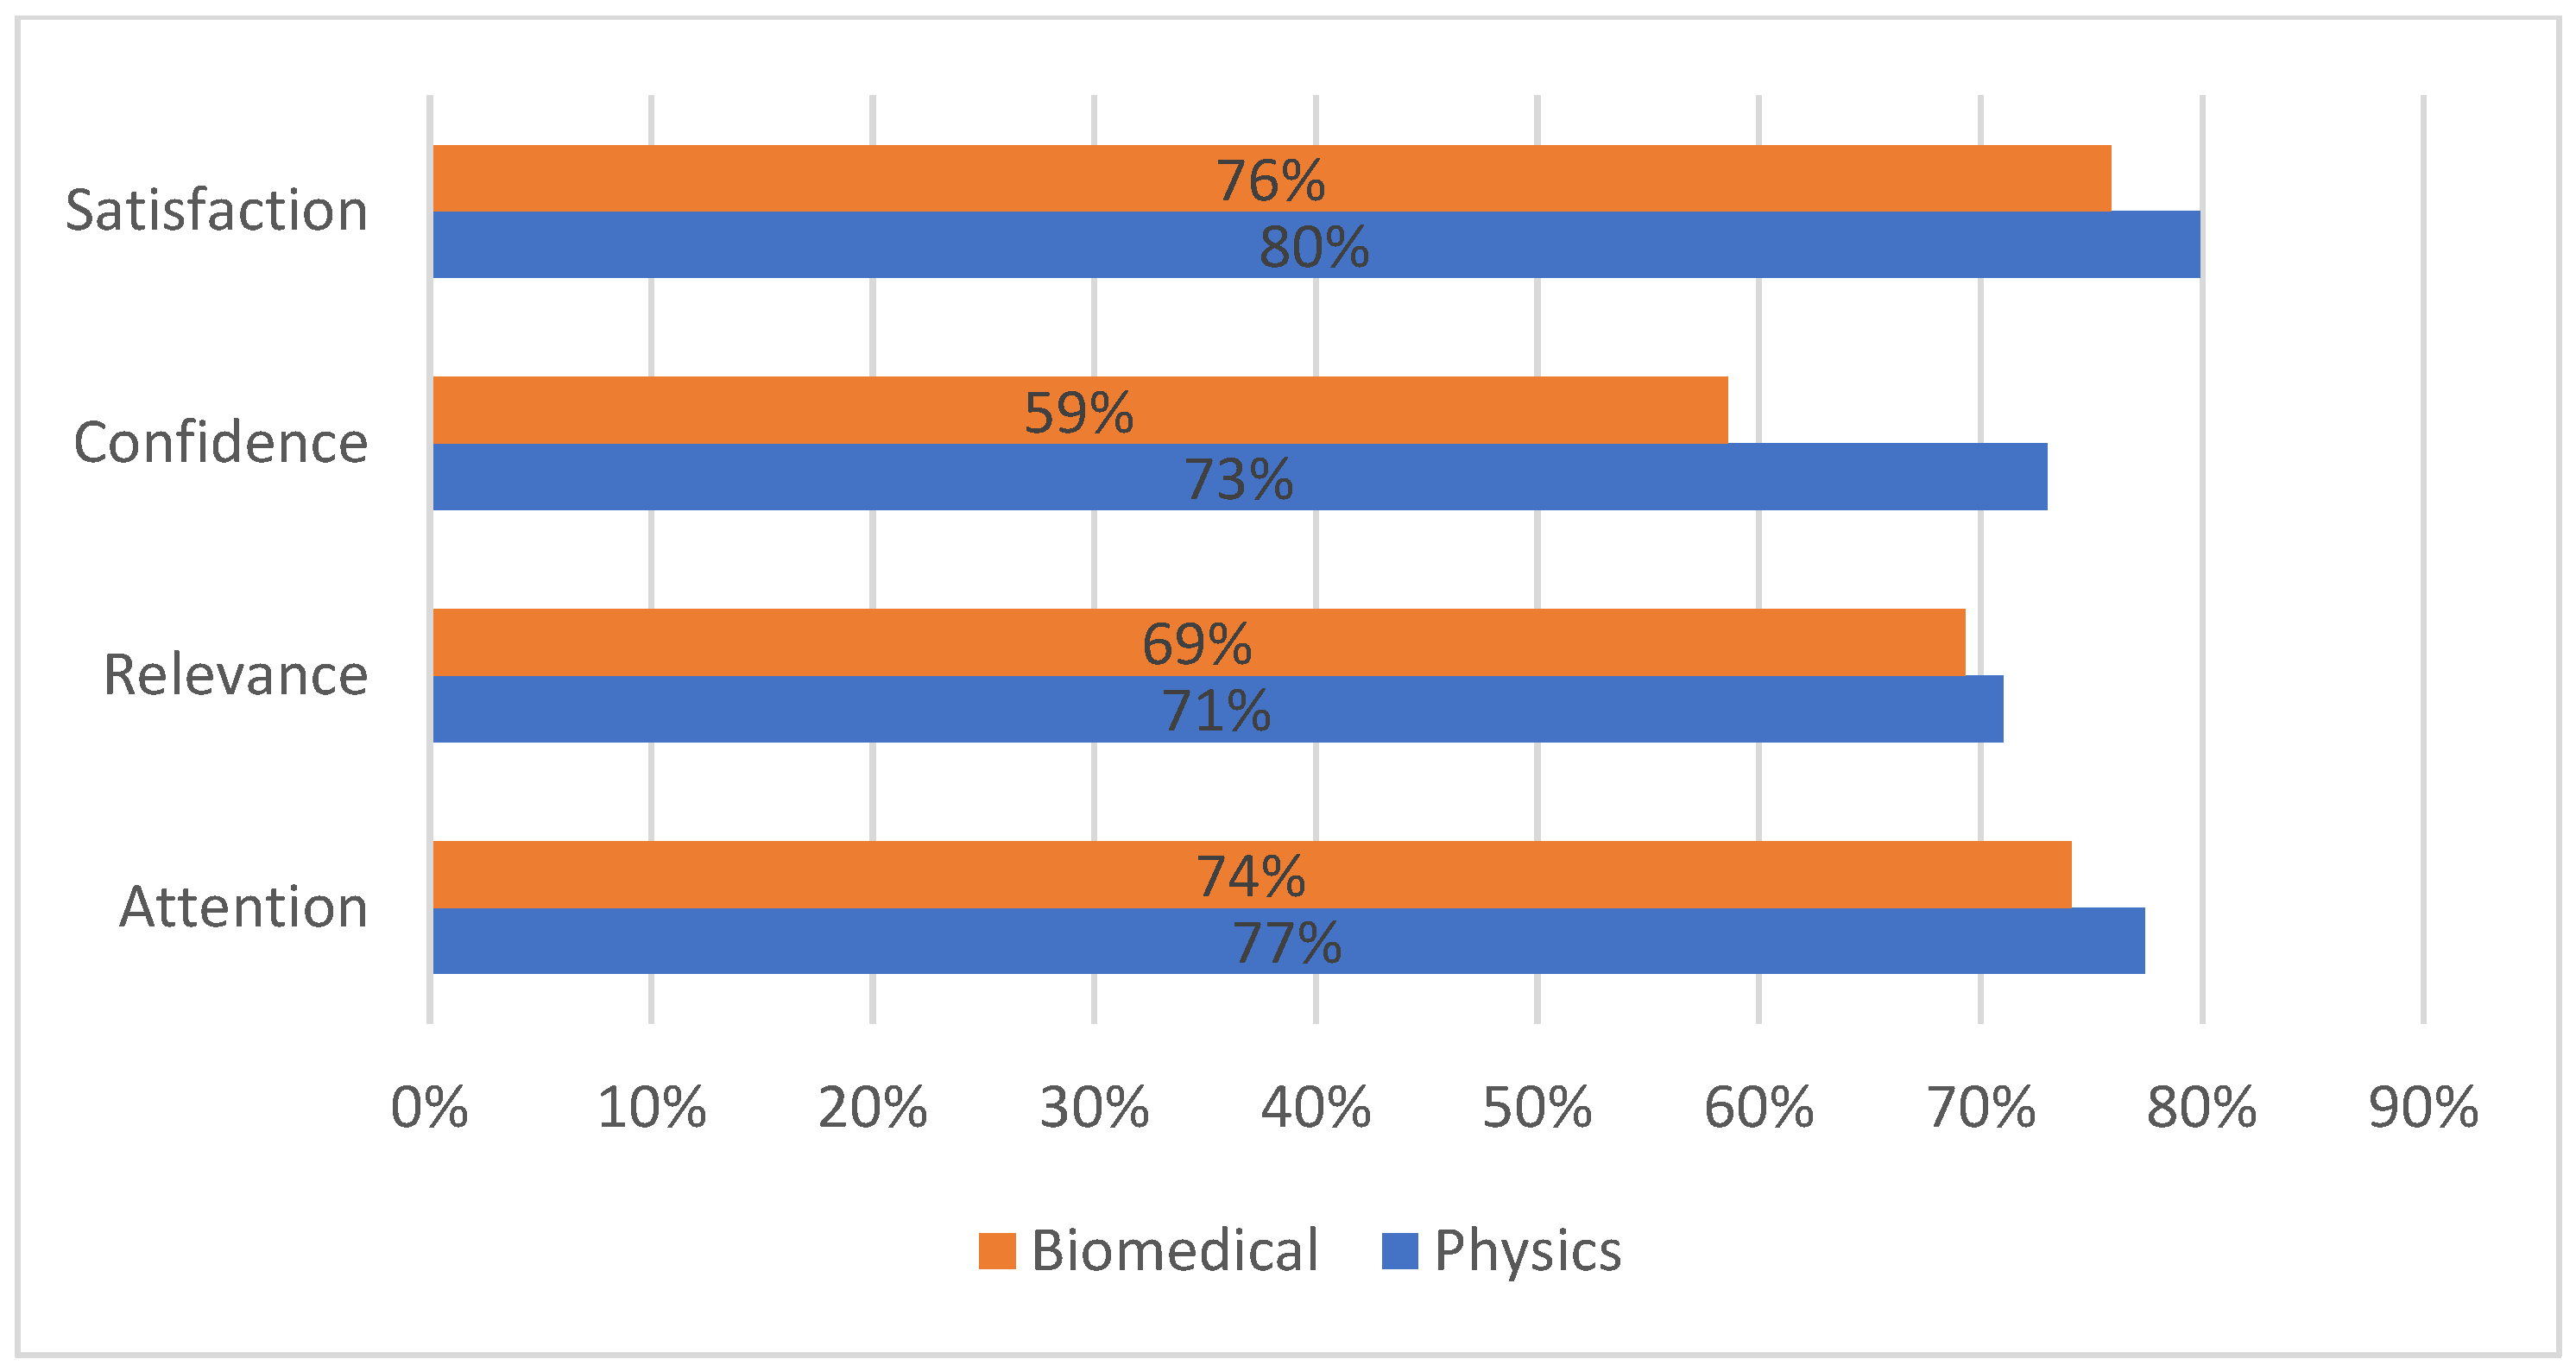
Figure 3. On average, 75% of the students in the physics course had a positive or very positive response to the application used in their course, while in the biomedical course, the response was 69.5%.
The results indicate that the level of satisfaction was higher for both courses, with 79.9% in physics and 75.9% in biomedicine. Across all dimensions, the physics course achieved the highest results. The lowest result was observed in the biomedical course, where 58.6% of students indicated confidence in using the application, compared to 73% of students in the physics course. The following sections will provide a more detailed analysis of each of the dimensions.
3.1.1. Attention
The dimension of attention refers to the ability of the experience to capture students’ attention. The items in the questionnaire are designed to evaluate the capacity of the educational material to capture and maintain students’ attention, as well as their interest in the content presented. These items include assessments of the visual appeal and organization of the materials, the quality and style of the writing, and whether elements such as the variety of materials and surprises in the learning process contributes to greater engagement. The results for this dimension are presented in
Table 2.
The results show that in both the biomedical and physics courses, the majority of students had positive experiences with the material presented. A high percentage of responses—74.1% in the biomedical course and 77.4% in the physics course—were rated as positive or very positive, indicating strong acceptance of both the teaching method and content in these courses.
The percentage of negative and very negative responses was considerably low, with only 10.7% in the biomedical course and 8.8% in the physics course, reinforcing the perception that the educational experience was largely favorable. However, the biomedical course showed a slightly higher proportion of students who were undecided or neutral, which may suggest variability in how different aspects of the course were received or indicate possible areas of uncertainty that could be explored for future improvements.
3.1.2. Relevance
Relevance refers to the students’ perception of the usefulness of the experience in achieving a better understanding of the course content. The relevance items in the questionnaire are designed to evaluate how students perceive the connection between the lesson material and their prior knowledge, personal interests, and practical applicability. These items aim to capture various dimensions of relevance that can influence motivation and effective learning.
The results from the biomedical and physics courses indicate that the majority of students positively valued the relevance of the material presented in their respective lessons. In the biomedical course, 69.3% of the responses were positive or very positive regarding the relevance of the content, while in physics, this figure slightly increased to 71%. Both courses had a minority of negative responses, with 10.8% in biomedical and 7.4% in physics, highlighting potential areas for improving the alignment of the content with students’ needs and expectations. Additionally, a considerable percentage of students in both courses maintained a neutral opinion—19.9% in biomedical and 21.6% in physics. The results are displayed in
Table 3.
These findings underscore the importance of continually evaluating and adjusting educational materials to maximize their relevance and connection with students across different academic disciplines, thereby fostering greater student engagement and satisfaction.
3.1.3. Confidence
Confidence refers to the students’ assurance when interacting with the application, enabling them to successfully complete the assigned activity. The items used to evaluate confidence in the questionnaire are designed to measure students’ perceptions of their ability to understand and manage the educational material presented in the lessons. These items address both the students’ initial reactions to the material and their confidence in learning as they progress through the lesson.
When combining the percentages of positive and very positive responses, they amount to 58.6% for the biomedical course and 73% for the physics course out of the total responses. The negative and very negative responses account for 15.5% in the biomedical course and 10.8% in the physics course. The percentage of students with a neutral opinion was higher in biomedicine, reaching 25.9%, compared to 16.2% in physics. The responses are presented in
Table 4.
The very positive responses differ between the two subjects, with greater acceptance among physics students. Neutral responses are more prevalent in the biomedical course, while the overall negative and very negative results are more favorable in the physics course. For the confidence dimension, there is a positive trend; however, the individual responses show less similarity compared to the patterns observed in the previous two dimensions. In this dimension, the difference was more pronounced, with the physics course scoring 14.4% higher.
3.1.4. Satisfaction
Satisfaction refers to the joy or delight that students experience when participating in the activity. These items focus on evaluating the students’ affective experience with the educational material, which is crucial for understanding not only the educational effectiveness of the content but also its emotional impact on students. This understanding is essential for designing motivating and enriching learning experiences. When combining the percentages of positive and very positive responses, they amount to 75.9% for the biomedical course and 79.9% for the physics course out of the total responses. The negative and very negative responses account for 8.4% in the biomedical course and 4.9% in the physics course. The percentage of students with a neutral opinion was similar in both courses. The responses are presented in
Table 5.
The positive responses were the most frequent among students in both courses, with neutral responses being similarly valued in both. The very negative responses represented a small percentage. These results highlight a generally positive reception of the lesson design and content in both fields of study, with a stronger inclination toward positive responses in the physics course.
The results of the descriptive statistics show that the responses for the four dimensions of the ARCS model were very favorable, as the highest values are in the very positive range and the lowest values are in the very negative range. When each dimension is analyzed separately, it is observed that the majority of very positive responses fall within the satisfaction dimension for both courses. Conversely, a higher number of very negative responses are found in the confidence dimension. Considering that satisfaction is associated with intrinsic motivation and confidence is related to extrinsic motivation according to Keller’s model, it can be inferred that students enjoy the experience, but may lack confidence in their ability to successfully complete the activity, especially in the biomedical course. The higher number of very negative responses is less frequent in the satisfaction dimension and more prevalent in the confidence dimension. In the case of physics, the results were higher across all four dimensions, particularly in satisfaction. Moreover, the dimension with the most significant difference compared to the biomedical group was confidence.
3.2. Inferential Statistics
This section presents the analysis of differences to determine whether there were significant variations in the four dimensions analyzed. Student’s t-test was used for the following comparisons: (1) comparison of motivation between the two courses using the two applications; (2) comparison of motivation by gender in the physics course; (3) comparison of motivation by gender in the biomedical course; (4) comparison of motivation among females when using the two different types of applications; and (5) comparison of motivation among males when using the two different types of applications.
3.2.1. Comparison of Motivation between the Two Courses with Two Applications
In this section, the responses of male and female students who used the Epic Roller Coasters application in the physics course were compared to the total responses of students who used the Human Anatomy application. The results are presented in
Table 6.
For the dimension of attention, the mean (M) for the total students in the physics course was 4.17 with a standard deviation (S.D.) = 0.65, while in the biomedical course, it was M = 4.09 with S.D. = 0.72. Student’s t-test produced a p-value of p = 0.663, which is greater than the confidence interval of 0.05. Therefore, it can be assumed that the means of the samples are not significantly different.
For relevance, the mean in the physics course was 4.08 with S.D. = 0.57, and in the biomedical course, the mean was M = 3.96 with a standard deviation of S.D. = 0.66. Student’s t-test yielded a t-value of 0.65 with p = 0.518, which is greater than the confidence interval of α = 0.05. Thus, it is inferred that the means are not significantly different.
For confidence, the mean in the physics course was 4.03 with S.D. = 0.67, and in the biomedical course, it was M = 3.67 with S.D. = 0.72. Student’s t-test produced a t-value of 1.85 with p = 0.071. Given these data and a confidence interval of α = 0.05, it is assumed that the samples show significant statistical differences.
In the case of satisfaction, this dimension had the highest means in both the physics and biomedical courses. In the physics course, this was M = 4.24 with S.D. = 0.61, and in the biomedical course, it was M = 4.15 with S.D. = 0.81. Student’s t-test yielded a t-value of 0.45 with p = 0.654, leading us to infer that there are no significant differences between the samples.
3.2.2. Comparison of Motivation by Gender in the Physics Course
For each dimension of the ARCS model, the responses of female students were compared to those of male students who used the Epic Roller Coasters application in the physics course. The results are presented in
Table 7.
For the attention dimension, the mean for female students was 4.31 with a standard deviation (S.D.) of 0.41, and for male students, it was M = 3.99 with an S.D. of 0.86. Student’s t-test yielded a value of −1.16 with p = 0.268, which is greater than the confidence interval of α = 0.05. Therefore, it cannot be assumed that there are significant differences between the means of the samples.
Regarding relevance, the means are very similar, with a mean of 4.22 and S.D. = 0.51 for female students, and M = 3.89 and S.D. = 0.62 for male students. Student’s t-test yielded a value of 1.42 with p = 0.172, indicating no significant difference in the means of the sample responses.
In the case of confidence, the mean for female students in the physics course was 4.08 with S.D. = 0.57, and for male students, it was M = 3.95 with S.D. = 0.82. Student’s t-test produced a value of 0.46 with p = 0.652, suggesting that the means of the samples do not differ significantly.
Lastly, for satisfaction, the mean for female students was 4.27 with S.D. = 0.57, and for male students, it was M = 4.20 with S.D. = 0.68. Student’s t-test yielded a value of 0.28 with p = 0.785, indicating that the means of the samples do not exhibit significant differences.
3.2.3. Comparison of Motivation by Gender in the Biomedical Course
This section presents the results comparing the responses of female students to those of male students when both used the human anatomy application in the biomedical sciences course. The results are summarized in
Table 8.
In the attention dimension, the mean for female students in the biomedical sciences course was 4.34 with S.D. = 0.64, while for male students, it was M = 3.74 with S.D. = 0.70. Student’s t-test yielded a value of 2.24 with p = 0.036. Based on these values, it is inferred that there are significant differences between the means of the samples.
For relevance, the mean for female students was 4.16 with S.D. = 0.65, while for male students, it was M = 3.69 with S.D. = 0.60, which is lower than that of the female students. Student’s t-test yielded a value of 1.90 with p = 0.071, which is greater than the confidence interval of α = 0.05; therefore, there are no significant differences between the means of the samples.
In the case of confidence, the mean for female students was 3.95 with S.D. = 0.51, while for male students, it was M = 3.29 with S.D. = 0.81, which is lower than that of the female students. Student’s t-test yielded a value of 2.38 with p = 0.031, which is less than the confidence interval of α = 0.05, indicating that there is a significant statistical difference between the means of the samples.
Finally, for satisfaction, the mean for female students was 4.47 with S.D. = 0.55, while for male students, it was M = 3.71 with S.D. = 0.93. Although the mean for male students was lower, the standard deviation was higher than that of female students. Student’s t-test yielded a value of 2.39 with p = 0.030, which is less than the confidence interval of α = 0.05, allowing us to infer that there is a significant difference between the samples for the values obtained in this dimension.
3.2.4. Comparison of Motivation in the Female Gender When Using the Two Applications
In this section, the responses from female students who used the Epic Roller Coasters application in their physics course are compared with those from female students who used the Human Anatomy application in their biomedical sciences course. The results are shown in
Table 9.
For the attention dimension, the mean of the responses from female students in the physics course was 4.31 with S.D. = 0.41, while in the biomedical sciences course, it was M = 4.34 with S.D. = 0.64. Student’s t-test yielded a value of −0.17 with p = 0.868, indicating that there are no significant differences between the samples.
In the case of relevance, the mean for the physics course was 4.22 with S.D. = 0.51, and for the biomedical sciences course, it was M = 4.16 with S.D. = 0.65. Student’s t-test produced a value of 0.24 with p = 0.813, suggesting that there are no significant differences between the samples.
For confidence, the means in both courses were very similar. In the physics course, the mean was 4.08 with S.D. = 0.57, and in the biomedical sciences course, it was M = 3.95 with S.D. = 0.51. Student’s t-test yielded a value of 0.68 with p = 0.503, indicating no significant differences between the samples.
Lastly, in the satisfaction dimension, the means were the highest, with M = 4.27 with S.D. = 0.57 for the physics course and M = 4.47 with S.D. = 0.55 for the biomedical sciences course. Student’s t-test produced a value of −0.98 with p = 0.337, indicating that there are no significant differences between the samples.
3.2.5. Comparison of Motivation in the Male Gender When Using the Two Applications
In this case, the responses from male students who used the Epic Roller Coasters application in their physics course are compared with those from male students who used the Human Anatomy application in their biomedical sciences course. The results are shown in
Table 10.
For the attention dimension, the mean for the physics course was 3.99 with S.D. = 0.86, while for the biomedical sciences course, it was M = 3.74 with S.D. = 0.70. The t-value was 0.72 with p = 0.478, indicating no significant difference in responses between the two courses.
For relevance, the physics course had a mean of 3.89 with S.D. = 0.62, and the biomedical sciences course had a mean of 3.69 with S.D. = 0.60. The t-value from Student’s t-test was 0.75 with p = 0.465, suggesting no significant differences in responses between the subjects.
In terms of confidence, the responses for the physics course had a mean of 3.95 with S.D. = 0.82, while for the biomedical sciences course, it was M = 3.29 with S.D. = 0.81. The t-value was 1.90 with p = 0.073, indicating no significant difference in responses between the two courses.
Lastly, for satisfaction, the mean response for the physics course was 4.20 with S.D. = 0.63, and in the biomedical sciences course, it was M = 3.71 with S.D. = 0.93. The t-value from Student’s t-test was 1.39 with p = 0.181, suggesting no significant differences in responses between the subjects.
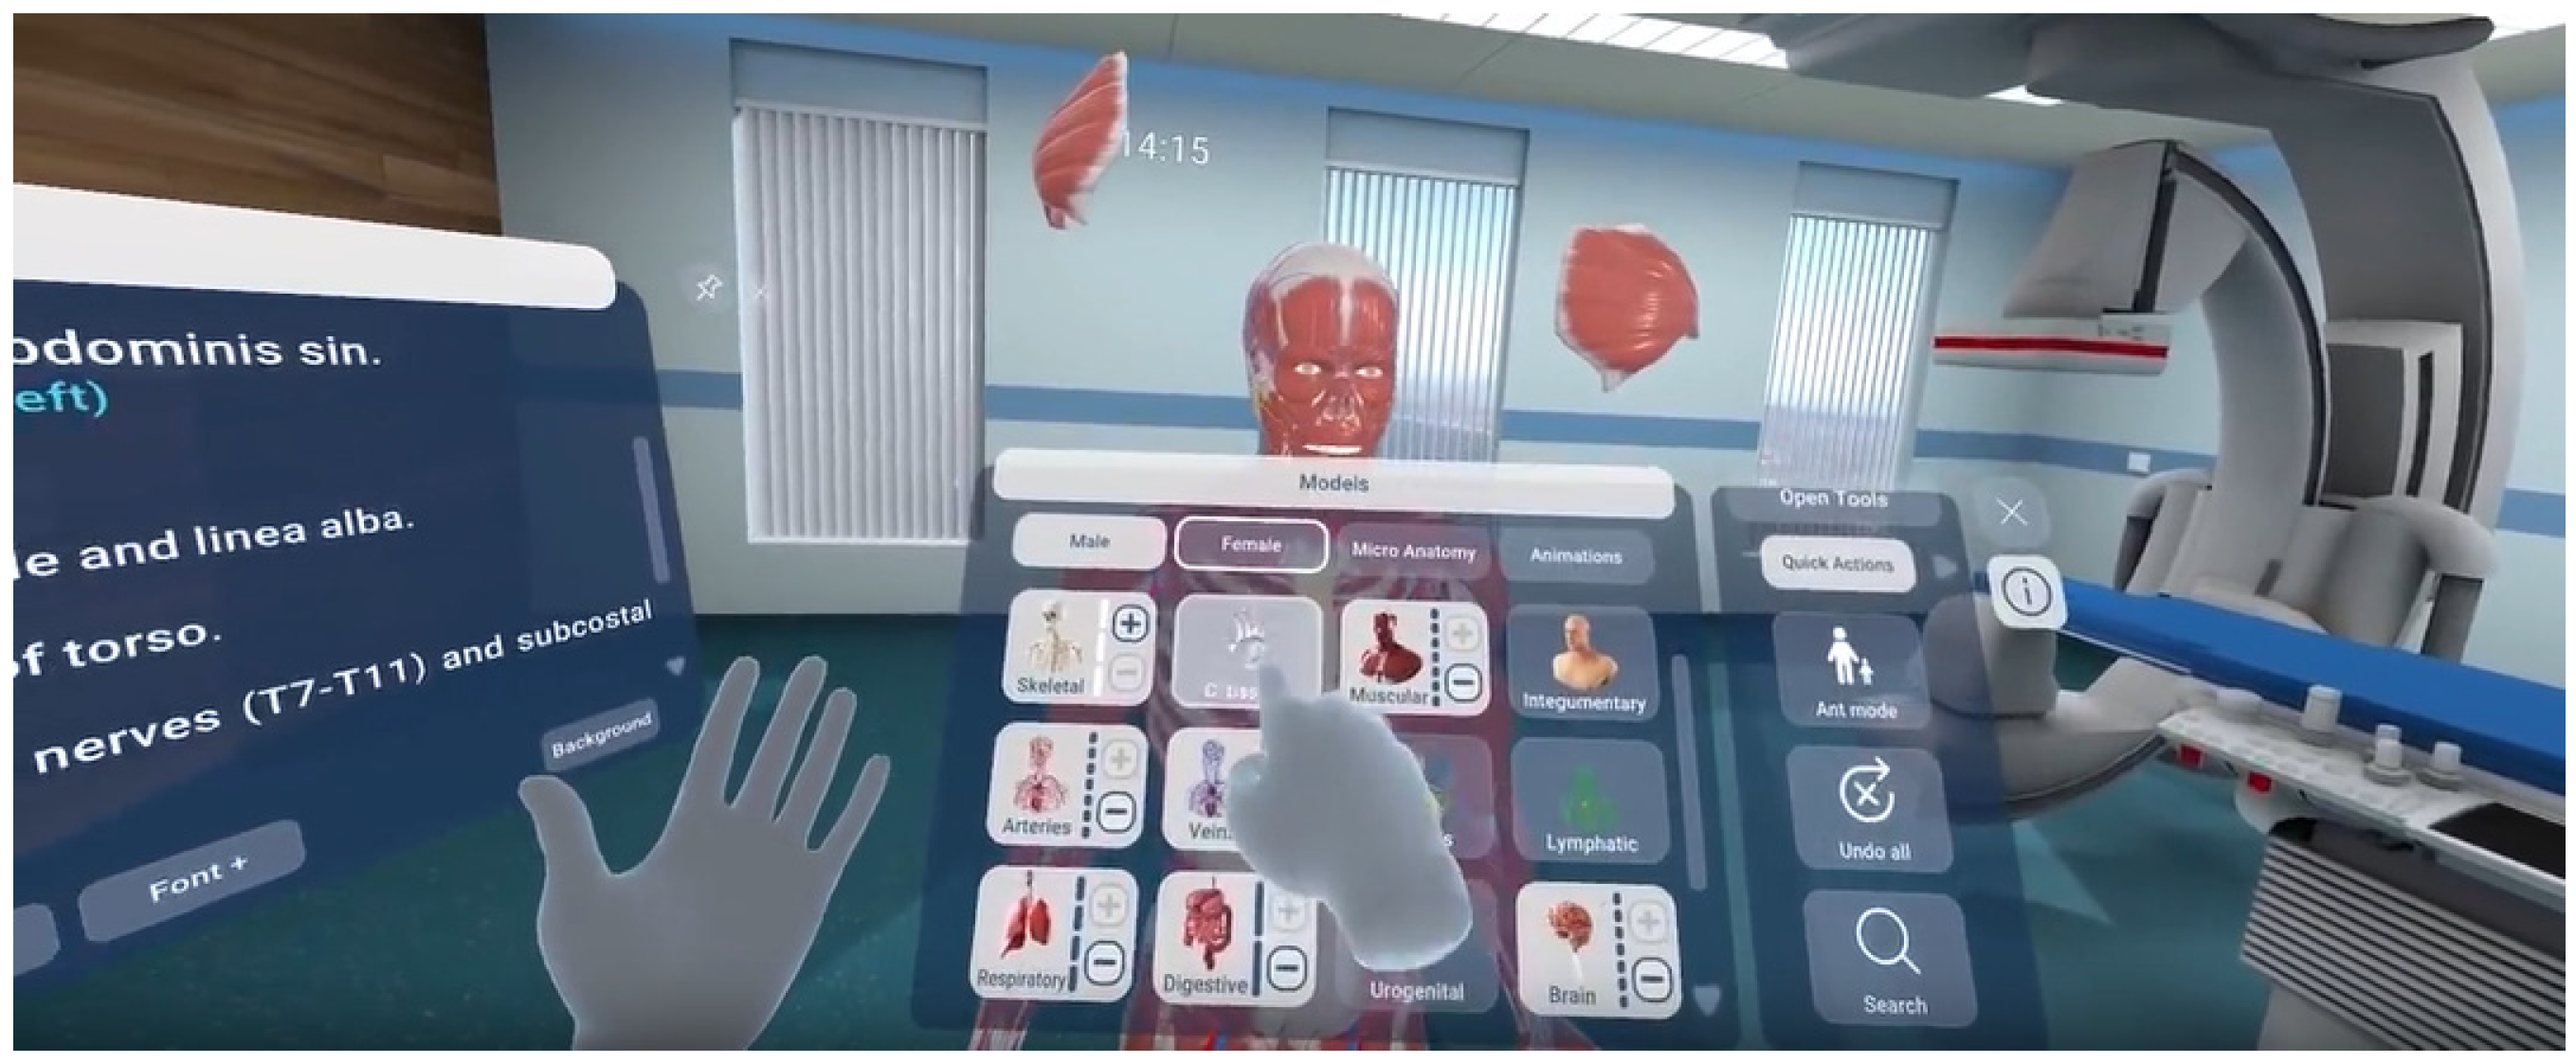
In the experience, 64 GB Oculus Go Virtual Reality headsets were used, loaded with the applications Epic Roller Coasters and Human Anatomy. In the physics course, the Epic Roller Coasters application was utilized to achieve learning outcomes. The application offers a predefined trajectory with predetermined timing.


