Abstract
The research examined how different profiles of emotional intelligence (attention, clarity, and emotional regulation) act as protective or risk factors against cyber-victimization, taking into account individual and behavioral variables such as gender, sexual orientation, self-esteem, social anxiety, Internet risk, and parental control among high school students (11–18 years). A simulated sample was used, which was derived from an experimental sample of 1908 subjects (50.7% girls). Statistical equivalence was ensured between the two samples, and a multilevel analysis was conducted using the emotional intelligence profiles as the grouping variable. The results showed that the variability in emotional intelligence profiles predicted 96.7% of the variability of cyber-victimization. Factors that increase this likelihood include excessive interpersonal attention and low emotional regulation, higher social anxiety, offline victimization, older age, high parental supervision, and low self-esteem. In addition, being male and heterosexual is associated with a lower risk of cyber-victimization than being female and non-heterosexual. In general, it is suggested that protective measures against cyber-victimization should warn about the risk of Internet use, avoid paternalistic behavior by adults, and reduce rumination or excessive attention to the opinions of others.
1. Introduction
The relationship between emotional intelligence and cyber-victimization is extensively documented in the scientific literature [1]. According to Martínez-Monteagudo et al. [2], cyber-victimization (CBV) affects 3–6% of adolescents, which Calmaestra et al. [3] specify as 9.8% as cyber-victims, 3% as cyber-aggressors, and 6.1% as both cyber-victim and cyber-aggressors.
Cyber-victimization is the act of harassing, intimidating, impersonating, or bullying another person through digital media such as the Internet or social networking communication applications and can be occasional or reiterative [4]. The intention of the harasser is to do harm, and he or she does so from a position of power [5,6] that feeds back with increasing popularity [7].
It can have different levels of severity and include insults, defamation, publication of compromising photos or videos without consent, or impersonation of others [8]. Cyber-victimization is a stressor with serious health implications [9], especially in adolescents [5].
Cyber-victimization has been explained by individual variables such as gender or sexual orientation [10,11], age [12], self-esteem and social anxiety [13,14], Internet risk behaviors [15] or parental control [16], and it partly explains lower academic performance [17,18].
Traditional bullying and cyber-bullying are two related but different phenomena, which when they concur in a mixed format have particularly negative consequences at the emotional level [19]. Those who suffer cyber-bullying and other forms of bullying between peers present greater problems of social and normative adjustment than their equals [20]. Their combination can generate a perception of continued harassment in which the victim does not find a safe environment, leading to great emotional distress [21], and even feelings of shame and guilt [19].
Cyber-bullying is related to risk perception and the performance of online behaviors [22]. Mickewright et al. [23] found a positive association between better risk perception and higher emotional intelligence.
Emotional intelligence is one of the factors explaining the severity of perceived cyber-bullying and its psychological implications for victims [24]. Emotional intelligence is a risk or protective factor against cyber-victimization [25].
Martínez-Martínez et al. [26] found that low emotional intelligence scores predicted a higher likelihood of cyber-victimization and lower academic achievement [27]. A high level of emotional intelligence would act as a protector against school violence and positively influence academic success [17].
One of the most widely used tools to measure emotional intelligence in Spain and Latin America is the Trait-Meta-Moods Scale-24 (TMMS-24) [28,29,30]. It is a test based on the model of Salovey and Mayer [31] to assess emotional intelligence.
It defines emotional intelligence as a composite ability that allows recognizing and manifesting emotions, understanding them, and adjusting actions to promote internal and external bonds with others [32].
It is not designed to provide an overall score, but rather for each of its component factors (attention, clarity, and emotional regulation), with their levels of measurement (low, adequate, and excessive) [33].
Among the studies in which cyber-victimization is related to the emotional intelligence factors proposed in TMMS-24, we find that of Guerra-Bustamante et al. [34] with adults between 21 and 62 years old. They analyzed the relationship between cyber-bullying profiles and factors of attention, clarity, and regulation. It was performed independently for each emotional intelligence factor in relation to the victim, aggressor, and victim–aggressor profiles. They identified, in the case of cyber-bullying victims, a profile of excessive attention, low emotional clarity, and regulation, and for the victim–aggressor profile, excessive emotional attention and low understanding of their emotions. They concluded that inadequate clarity was the factor with the highest predictive capacity for the three profiles analyzed.
Martínez-Monteagud et al. [2] found that higher levels of understanding (clarity) and regulation decrease the likelihood of being victims, aggressors, or victim–aggressors of cyber-victimization.
Considering the factorial structure of the TMMS-24, each of the twenty-seven clusters resulting from the cross-stratification of the three factors (attention, clarity, and emotional regulation), with the three categories of each factor (low, adequate, and excessive) were considered as emotional intelligence profiles. We will call these clusters emotional intelligence strata (EI-strata) or latent EI profiles [35].
If part of the variability in cyber-victimization is due to differences in emotional intelligence profiles, we propose to find out the differences in the relationships between the individual variables with cyber-victimization within each of the EI-strata.
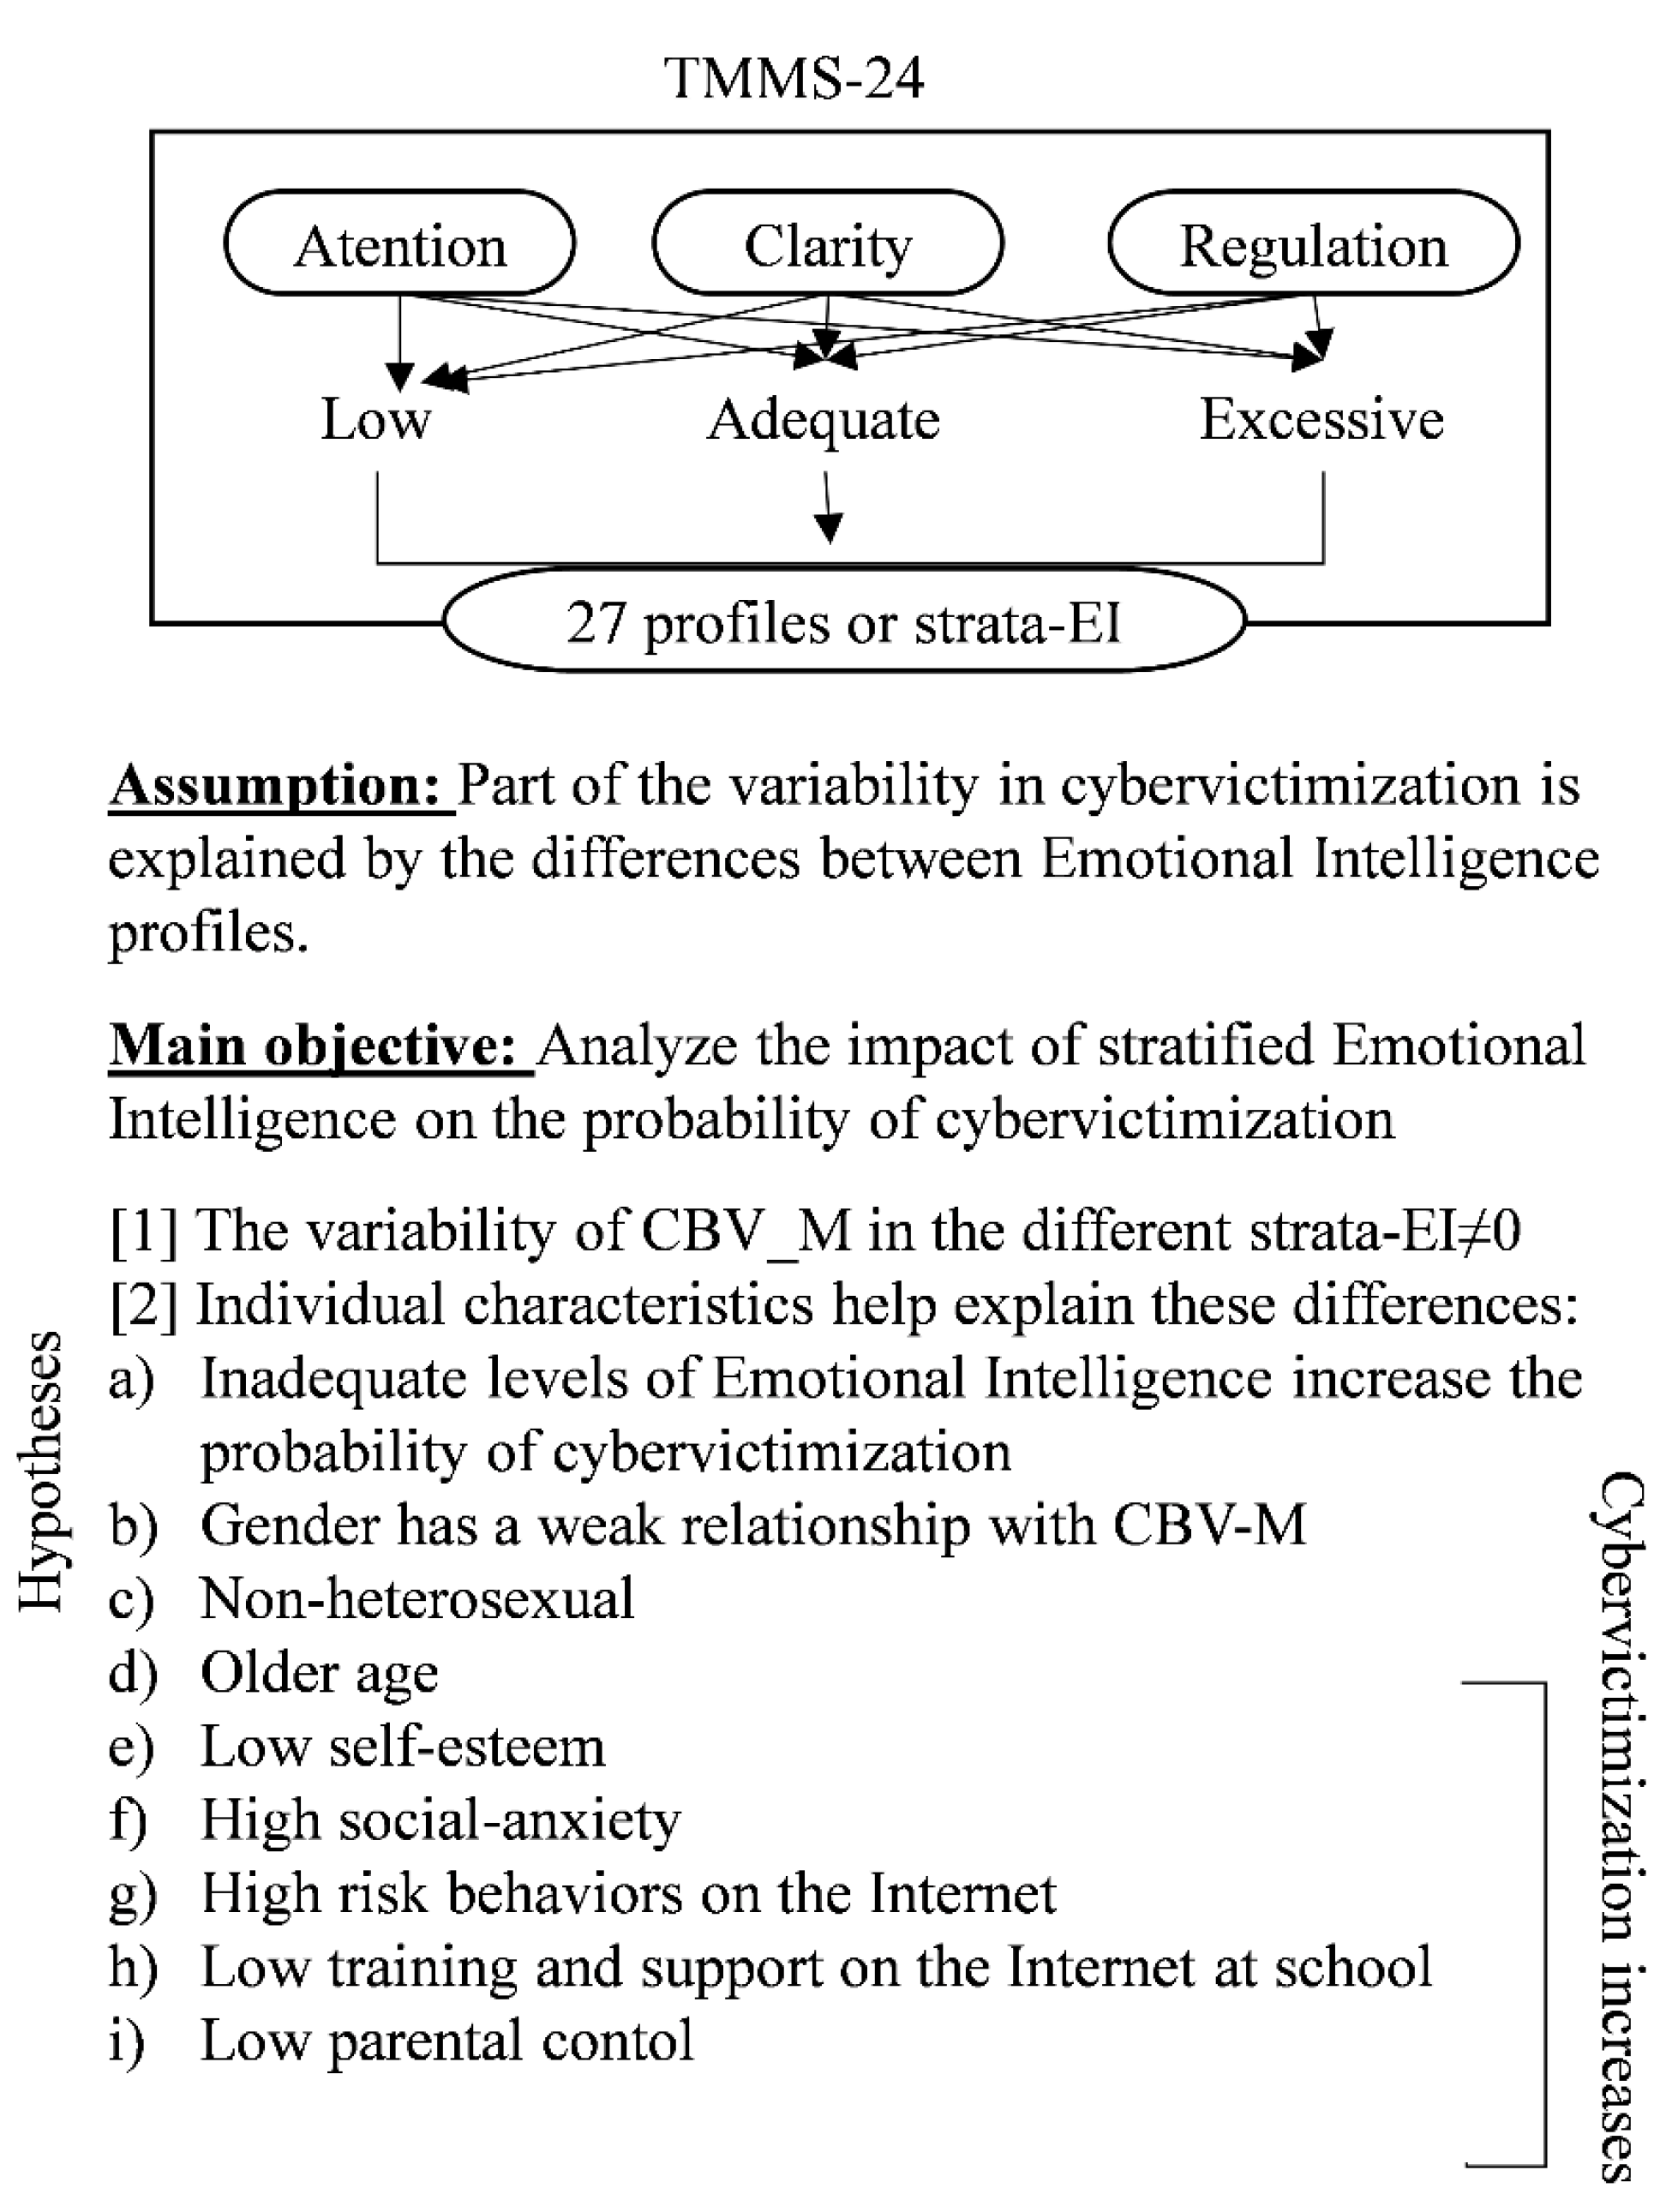
The objective of this research was to analyze the impact of stratified emotional intelligence on the likelihood of suffering cyber-victimization, considering the effect of different individual variables in the analysis (Figure 1).
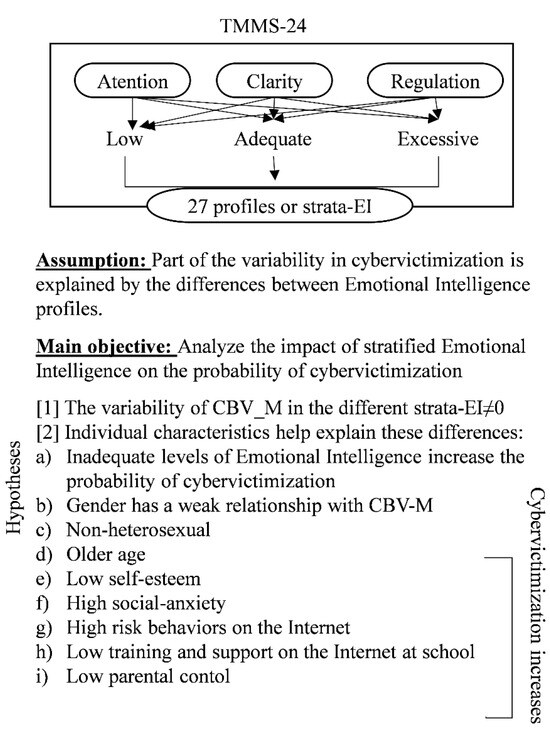
Figure 1.
Research objective.
The following hypotheses were started:
- The variability of average cyber-victimization across EI-strata is significant and non-zero. Different emotional intelligence profiles imply different levels of cyber-victimization risk.
- This difference can be explained by the individual characteristics of the subjects. According to previous evidence, the following was expected:
- 2.1
- Inadequate levels of emotional intelligence increase the probability of cyber-victimization [25].
- 2.2
- Gender is related to the degree of cyber-victimization [36].
- 2.3
- Cyber-victimization increases when gender orientation is non-heterosexual [37].
- 2.4
- Between the ages of 11 and 18, older youth are more likely to be cyber-victims.
- 2.5
- Low self-esteem increases the risk of cyber-victimization
- 2.6
- High social anxiety increases risk of being cyber-victimized
- 2.7
- The risk of cyber victimization increases with risky Internet behavior.
- 2.8
- Low parental control increases likelihood of cyber-victimization
2. Materials and Methods
2.1. Participants and Procedures
A total of 1908 students (50.7% girls) of Compulsory Secondary Education (CSE) from Almeria (Spain), between 11 and 18 years, participated in the study (M = 13.65; SD = 1.36).
They belonged to 4 Educational Centers selected according to their convenience, which are based on having agreed to participate in the study.
Regarding the level of education, 28.2% (539) were in the first year of secondary education, 28.8% (550) were in the second year, 22.1% (422) were in the third year, and 20.8% (397) were in the fourth year. In terms of sexual orientation, 4.9% of respondents identified themselves as non-heterosexual. The information was collected during the months of January and February 2024. All CSE students who provided parental consent were evaluated at each participating center. The tests were administered during class time. Teachers were present.
With the amount of data in the original sample, it was not possible to analyze cyber-victimization by emotional intelligence strata (some strata had very few cases) [38].
The Simulate Active Dataset was added to the SPSSv.29 utilities (Extensions > Extension Hub > Simulate Active Dataset) to generate a sample equivalent to the original. Simulated sample distribution was calculated using multivariate correlations and contingency tables for each selected variable.
The objective was to construct a statistically representative sample of the empirical sample that would be sufficient to perform the multilevel analysis based on the cross-stratification of the variables that make up the construct of emotional intelligence (TMMS-24).
The Simulate Active Dataset utility generated a simulation plan that allows you to replicate the process of constructing simulated data from empirical data using SPSS (File > Open > Empirical Dataset > Analyze > Simulation > Open a Simulation Plan).
It was later verified that both samples were statistically equivalent. To assess data quality, the distributions of the observed and imputed data were compared [39]. For scale variables, means, standard deviations, and maximum and minimum values were compared, and for categorical variables, the percentages of each category were compared (Table 1).

Table 1.
Comparison of descriptive statistics of the primary sample and the simulation sample.
The difference of typed means was calculated for the scale variables and the difference of percentages was calculated for the categorical variables (Table 2).
Table 2.
Formulas to calculate differences in standardized mean differences and differences in proportions [40].
In both mean differences (scale variables) and percentage differences (categorical variables), the values were close to zero, and in all cases, the confidence intervals contained the null value (no significant differences) (Table 3).
Table 3.
Calculation of standardized mean differences and differences of proportions.
To ensure sampling equivalence, the two-dimensional distribution of the relationship between the dependent variable (mean cyber-victimization) and the different independent variables was compared through their regression coefficients (slope and constant) (Table 4). Bivariate correlation analysis was performed on the slopes and intercepts of the primary and simulate sample with a Pearson correlation of 0.948 (Sig. 0.000) for slopes and 0.999 (Sig. 0.000) for intercepts. Each sample is statistically equivalent.
Table 4.
Comparison of regression coefficients of the reference sample and the synthetic sample. CBV-Average as dependent variable.
The simulated sample consisted of 50,000 cases representative of a population aged 11 to 18 years (mean: 13.65; SD: 1.36), which was divided into 23,905 boys and 24,095 girls.
2.2. Instruments
2.2.1. Emotional Intelligence
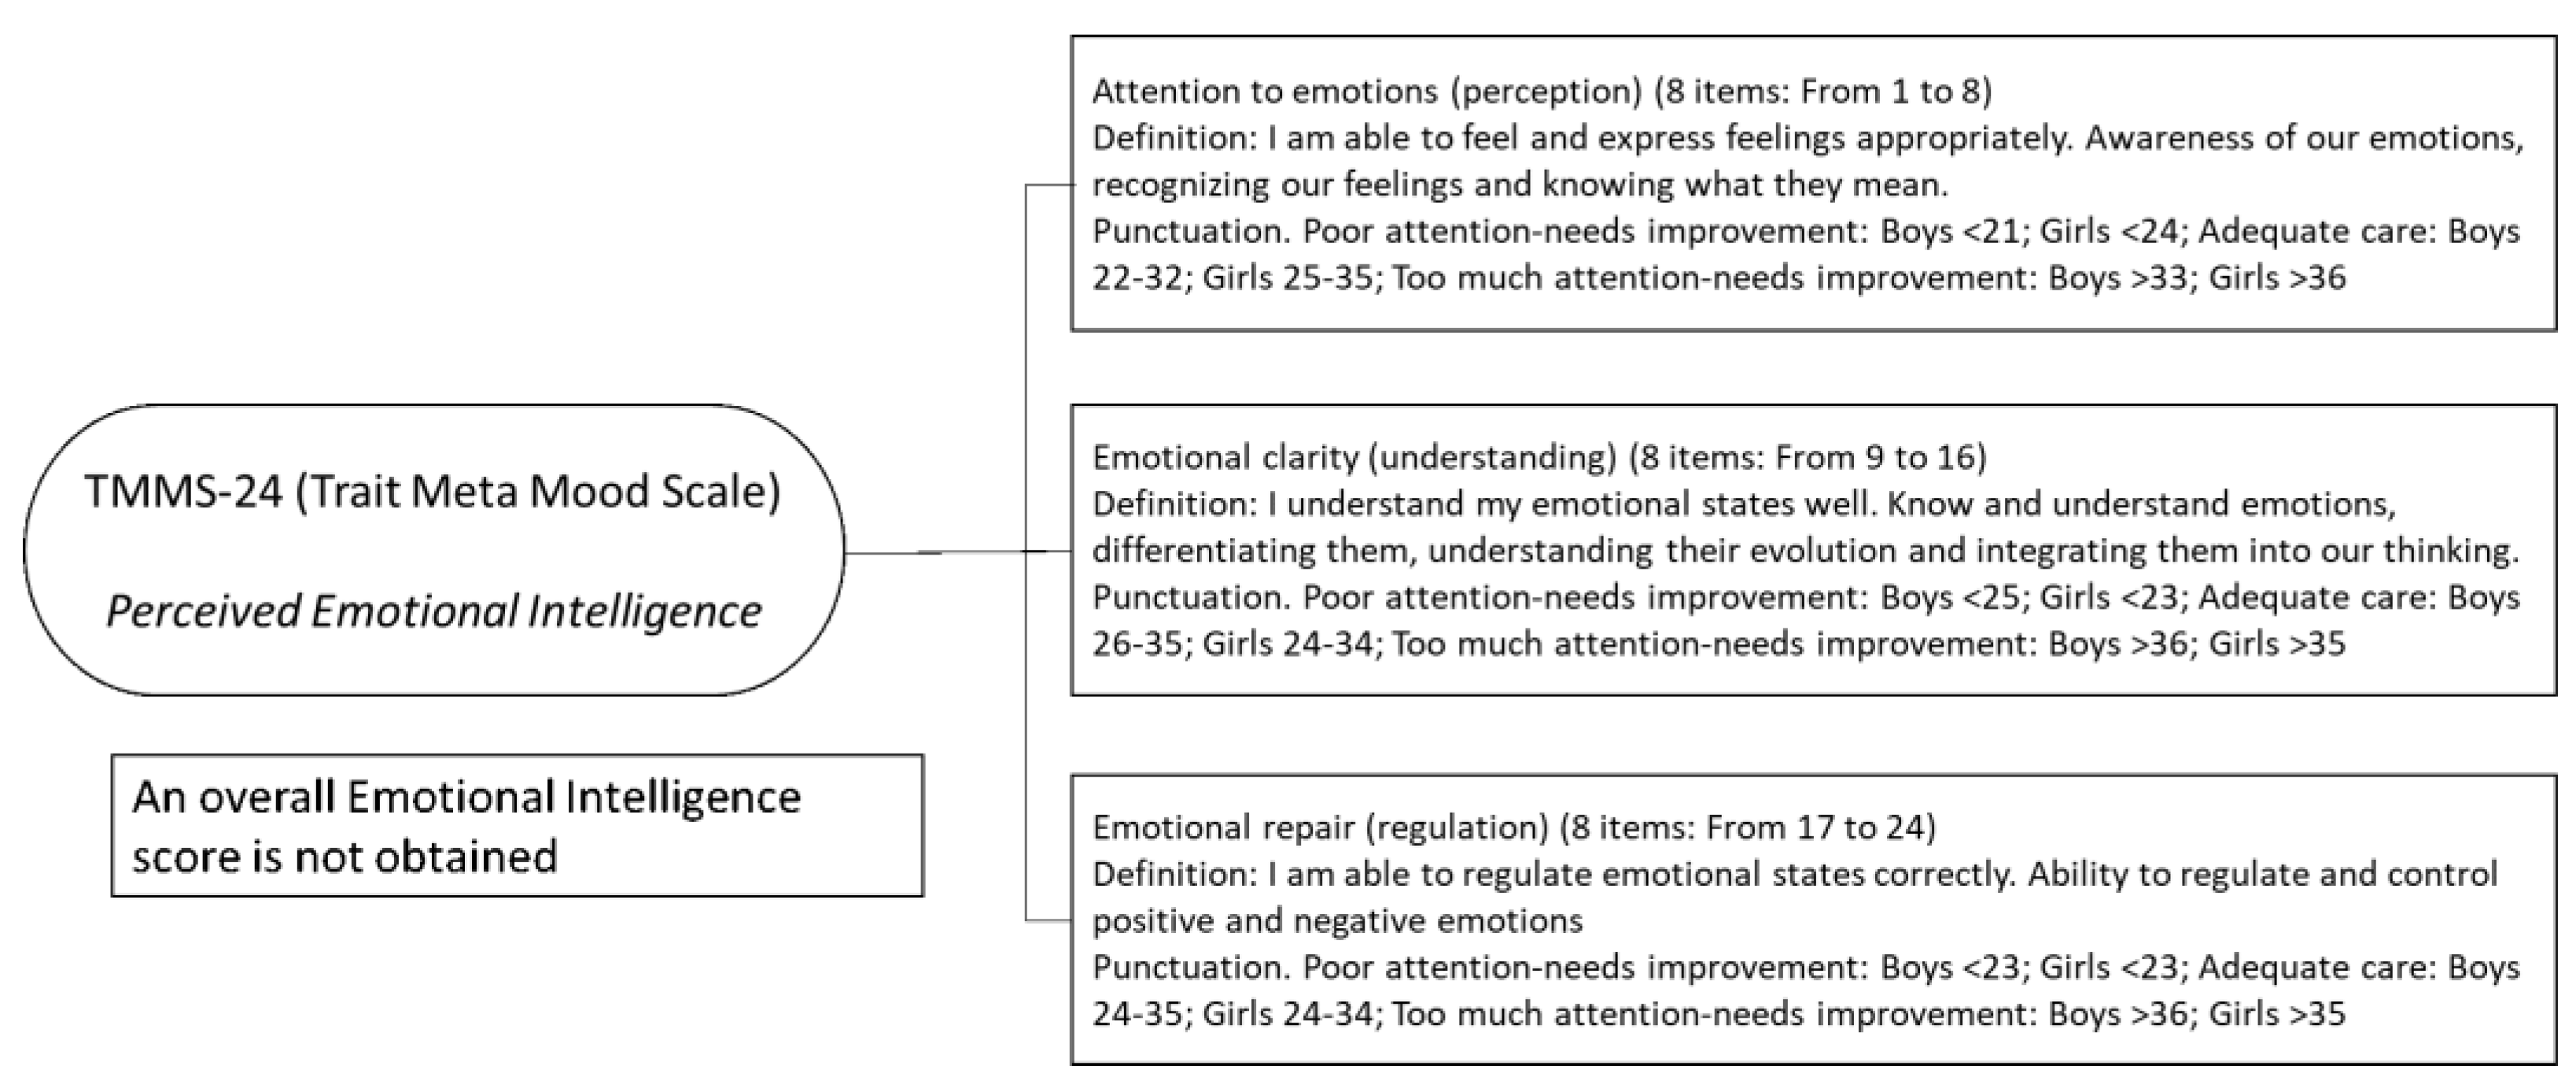
The Trait Meta-Mood Scale-24 (TMMS-24) [29] (Fernández-Berrocal et al., 2004) was used, which assesses perceived intrapersonal emotional intelligence based on three dimensions: attention to emotions, emotional clarity, and emotional regulation (Figure 2).
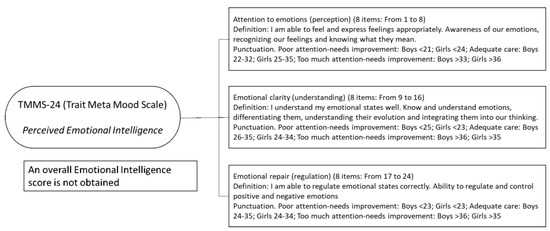
Figure 2.
TMMS-24 (Trait Meta-Mood Scale) [28].
The test is based on the idea that emotional intelligence involves recognizing and expressing emotions, understanding them, and adapting them to promote connections both internally and with others [32].
It consists of three factors:
- (a)
- Emotional awareness (perception) (8 items: 1 to 8). This refers to the ability to experience and communicate emotions appropriately. That is, it involves a deep understanding of one’s own emotions, identifying feelings and understanding their meaning (α = 0.86).
- (b)
- Emotional clarity (understanding) (8 items: 9 to 16). This means understanding the emotional state. It involves recognizing and understanding emotions, distinguishing between them, understanding how they change over time, and integrating them coherently into thinking (α = 0.84).
- (c)
- Emotional regulation (8 items: 17 to 24). This is the ability to effectively manage emotional states. It means the ability to regulate and maintain control over positive and negative emotions (α = 0.83).
Each factor is categorized based on the score and gender (boy/girl) into low, adequate, and excessive:
For the dimension attention to emotions (emotional awareness), low attention needs to improve: boys < 21, girls < 24; adequate attention: boys 22–32, girls 25–35; too much attention-needs improvement: boys > 33, girls > 36.
In the case of emotional clarity, low clarity needs to be improved: boys < 25, girls < 23; adequate clarity: boys 26–35, girls 24–34; too much clarity needs improvement: boys > 36, girls > 35.
Regarding emotional regulation, low regulation needs improvement: boys < 23, girls < 23; adequate regulation: boys 24–35, girls 24–34; too much regulation needs improvement: boys > 36, girls > 35.
The Pearson correlation value for the test–retest after four weeks was found to be between 0.60 and 0.83 [29].
The test does not provide a global sum score of the factors that make it up, but it does offer the possibility to consider adequate global emotional intelligence (adequate attention and adequate emotional clarity and adequate emotional regulation) or one that needs improvement.
2.2.2. Cyber-Victimization
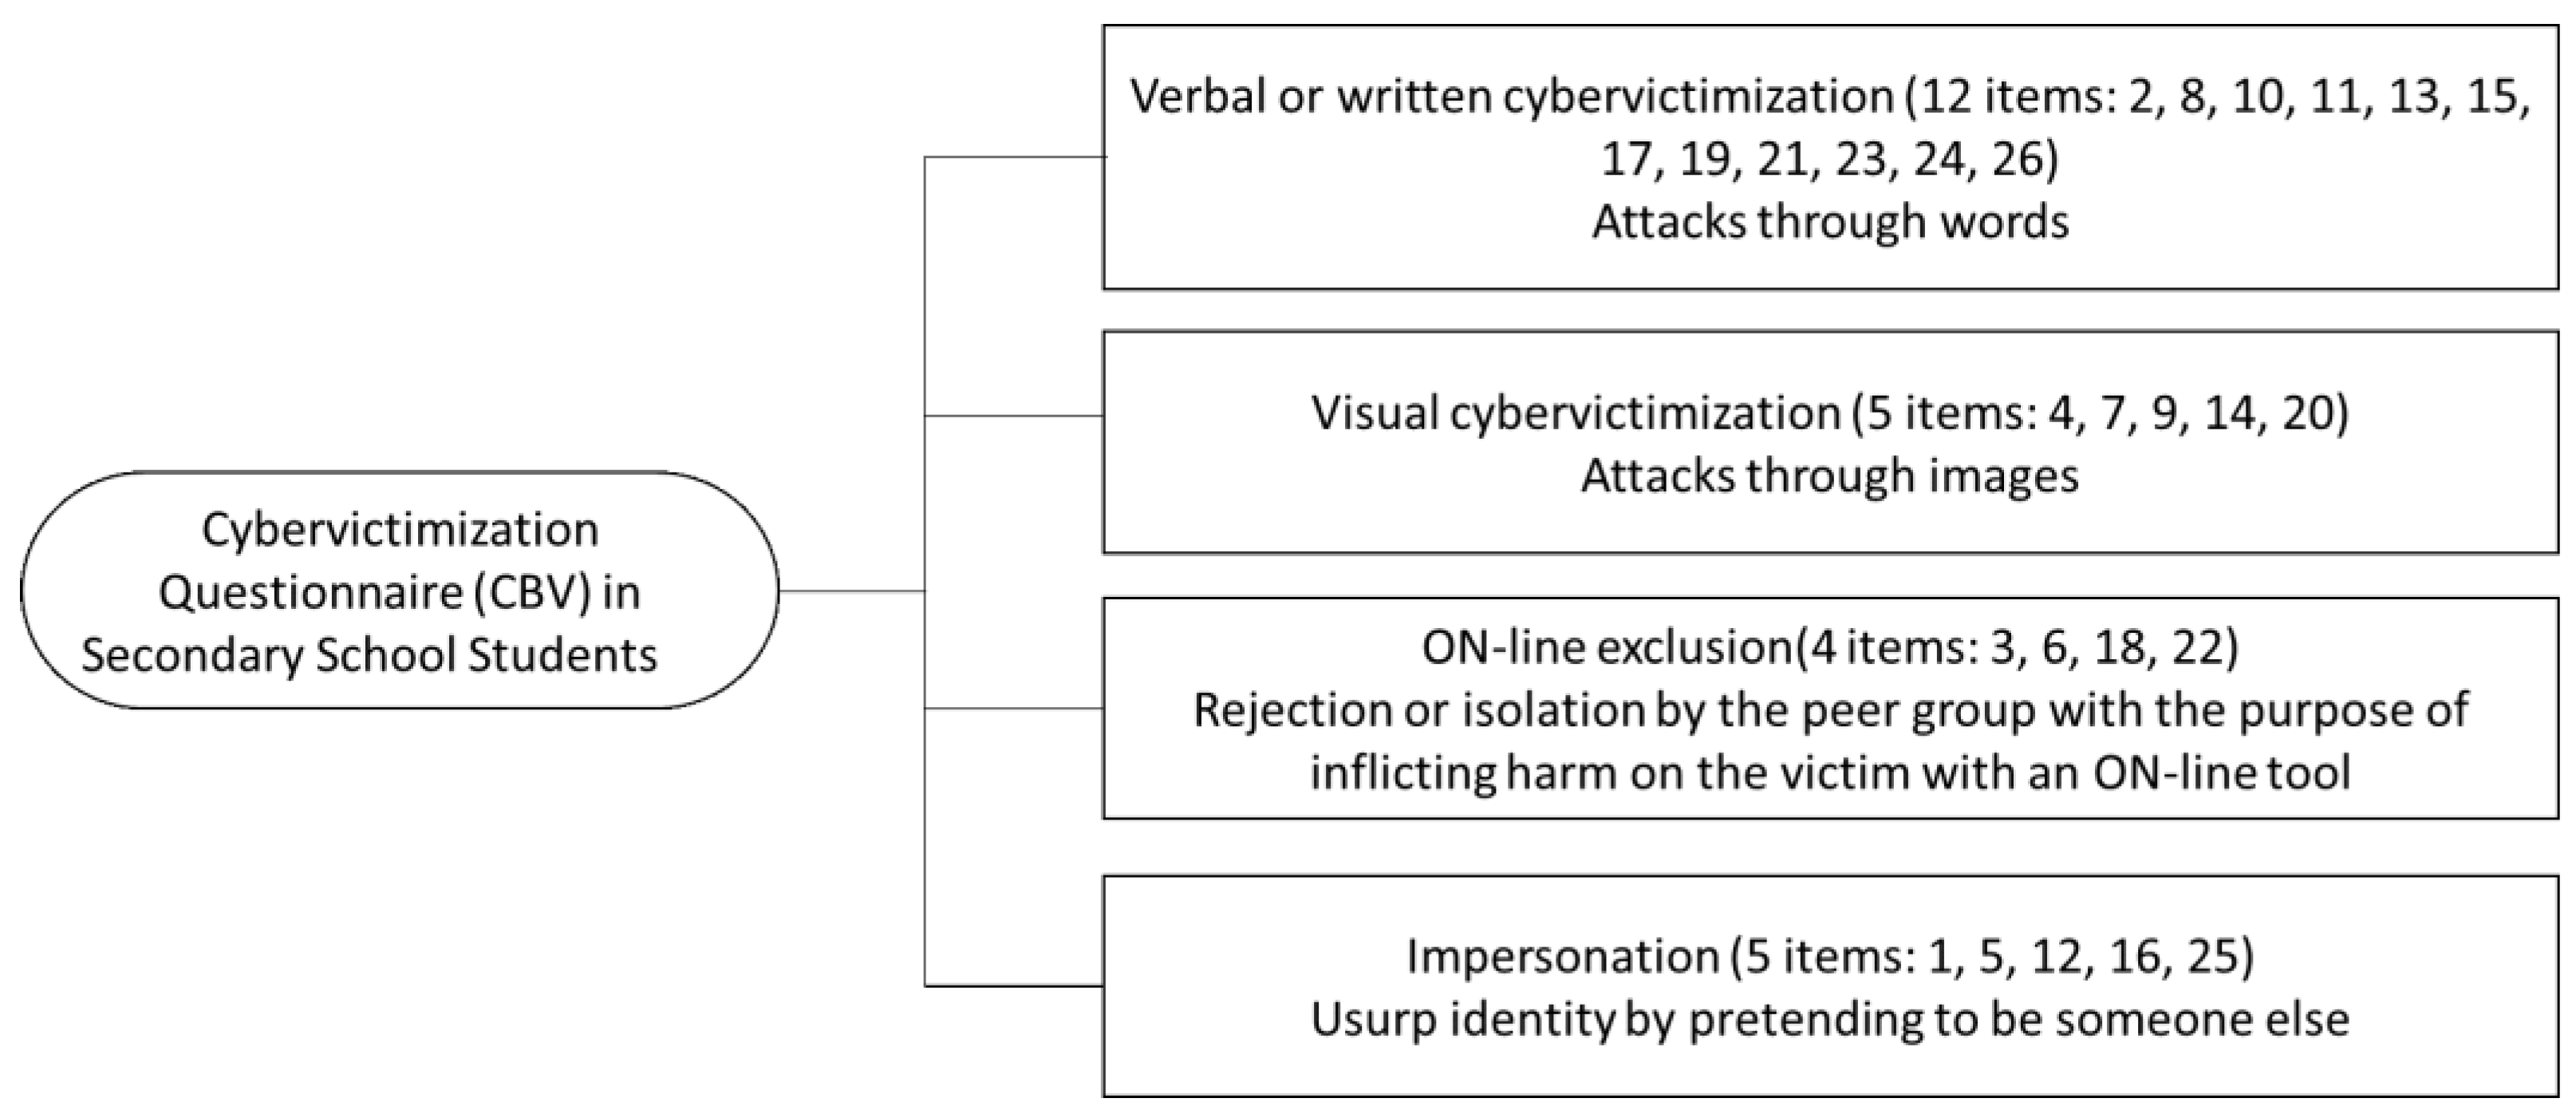
To measure this variable, the Cyber-Victimization Questionnaire for high school students by Alvarez-García et al. [4,41] refers to situations of aggression using technological means of social communication (Figure 3).
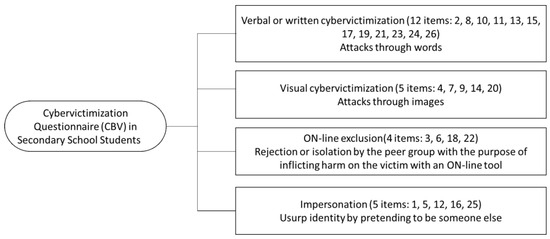
Figure 3.
Cyber-Victimization Questionnaire [4].
The instrument consists of 26 items related to four factors:
- (a)
- Verbal or written cyber-victimization (12 items: 2, 8, 10, 11, 13, 15, 17, 19, 21, 23, 24, 26). This refers to verbal attacks.
- (b)
- Online exclusion (4 items: 3, 6, 18, 22). Exclusion or isolation by peers using online media for the purpose of harming the victim.
- (c)
- Impersonation (5 items: 1, 5, 12, 16, 25). Assuming another person’s identity with the intent to deceive and cause harm.
The global score of the questionnaire was calculated by aggregating the partial scores of each factor [4] (p. 36)
The Severity Cyber-Victimization variable was created with three categories: (a) no cyber-victimization (for those who answered “never” to all items), (b) occasional cyber-victimization, direct score greater than 0 and less than 41, (c) severe cyber-victimization, direct score greater than or equal to 41 [41] (p. 231).
2.2.3. Risk Factors Questionnaire for Cyber-Victimization [41]
The questionnaire consists of 34 items measured on a 4-point Likert scale (from 1—completely false to 4—completely true). It is a self-report instrument that explores the respondent’s habits that can be considered risk or protective factors for cyber-victimization.
Specifically, they relate to 6 factors: Parental Control, Self-Esteem, Offline Victimization, Education and Support at School, Shyness and Social Anxiety, and Risky Behavior on the Internet (Figure 4).
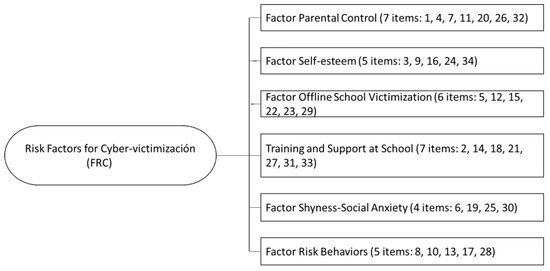
Figure 4.
Risk Factors for Cyber-Victimization [41].
2.2.4. Peer Bullying Questionnaire–Bullying Behavior Scale [42]
It is a self-report questionnaire consisting of two scales, a harassment behavior scale and a gender harassment behavior scale.
In our case, only the bullying scale was used. It consists of 39 items measured on a 3-point Likert scale (1: never, 3: many times). It is divided into 7 factors or subscales (Figure 5), making it possible to obtain a global score of peer bullying.
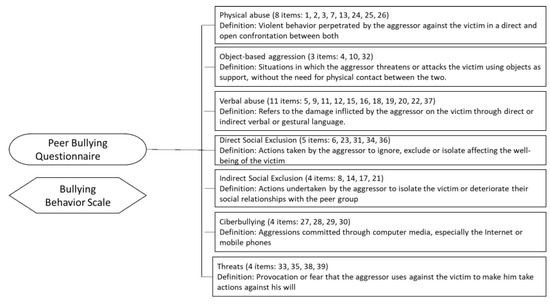
Figure 5.
Peer Bullying Questionnaire–Bullying Behavior Scale [42].
2.3. Variables
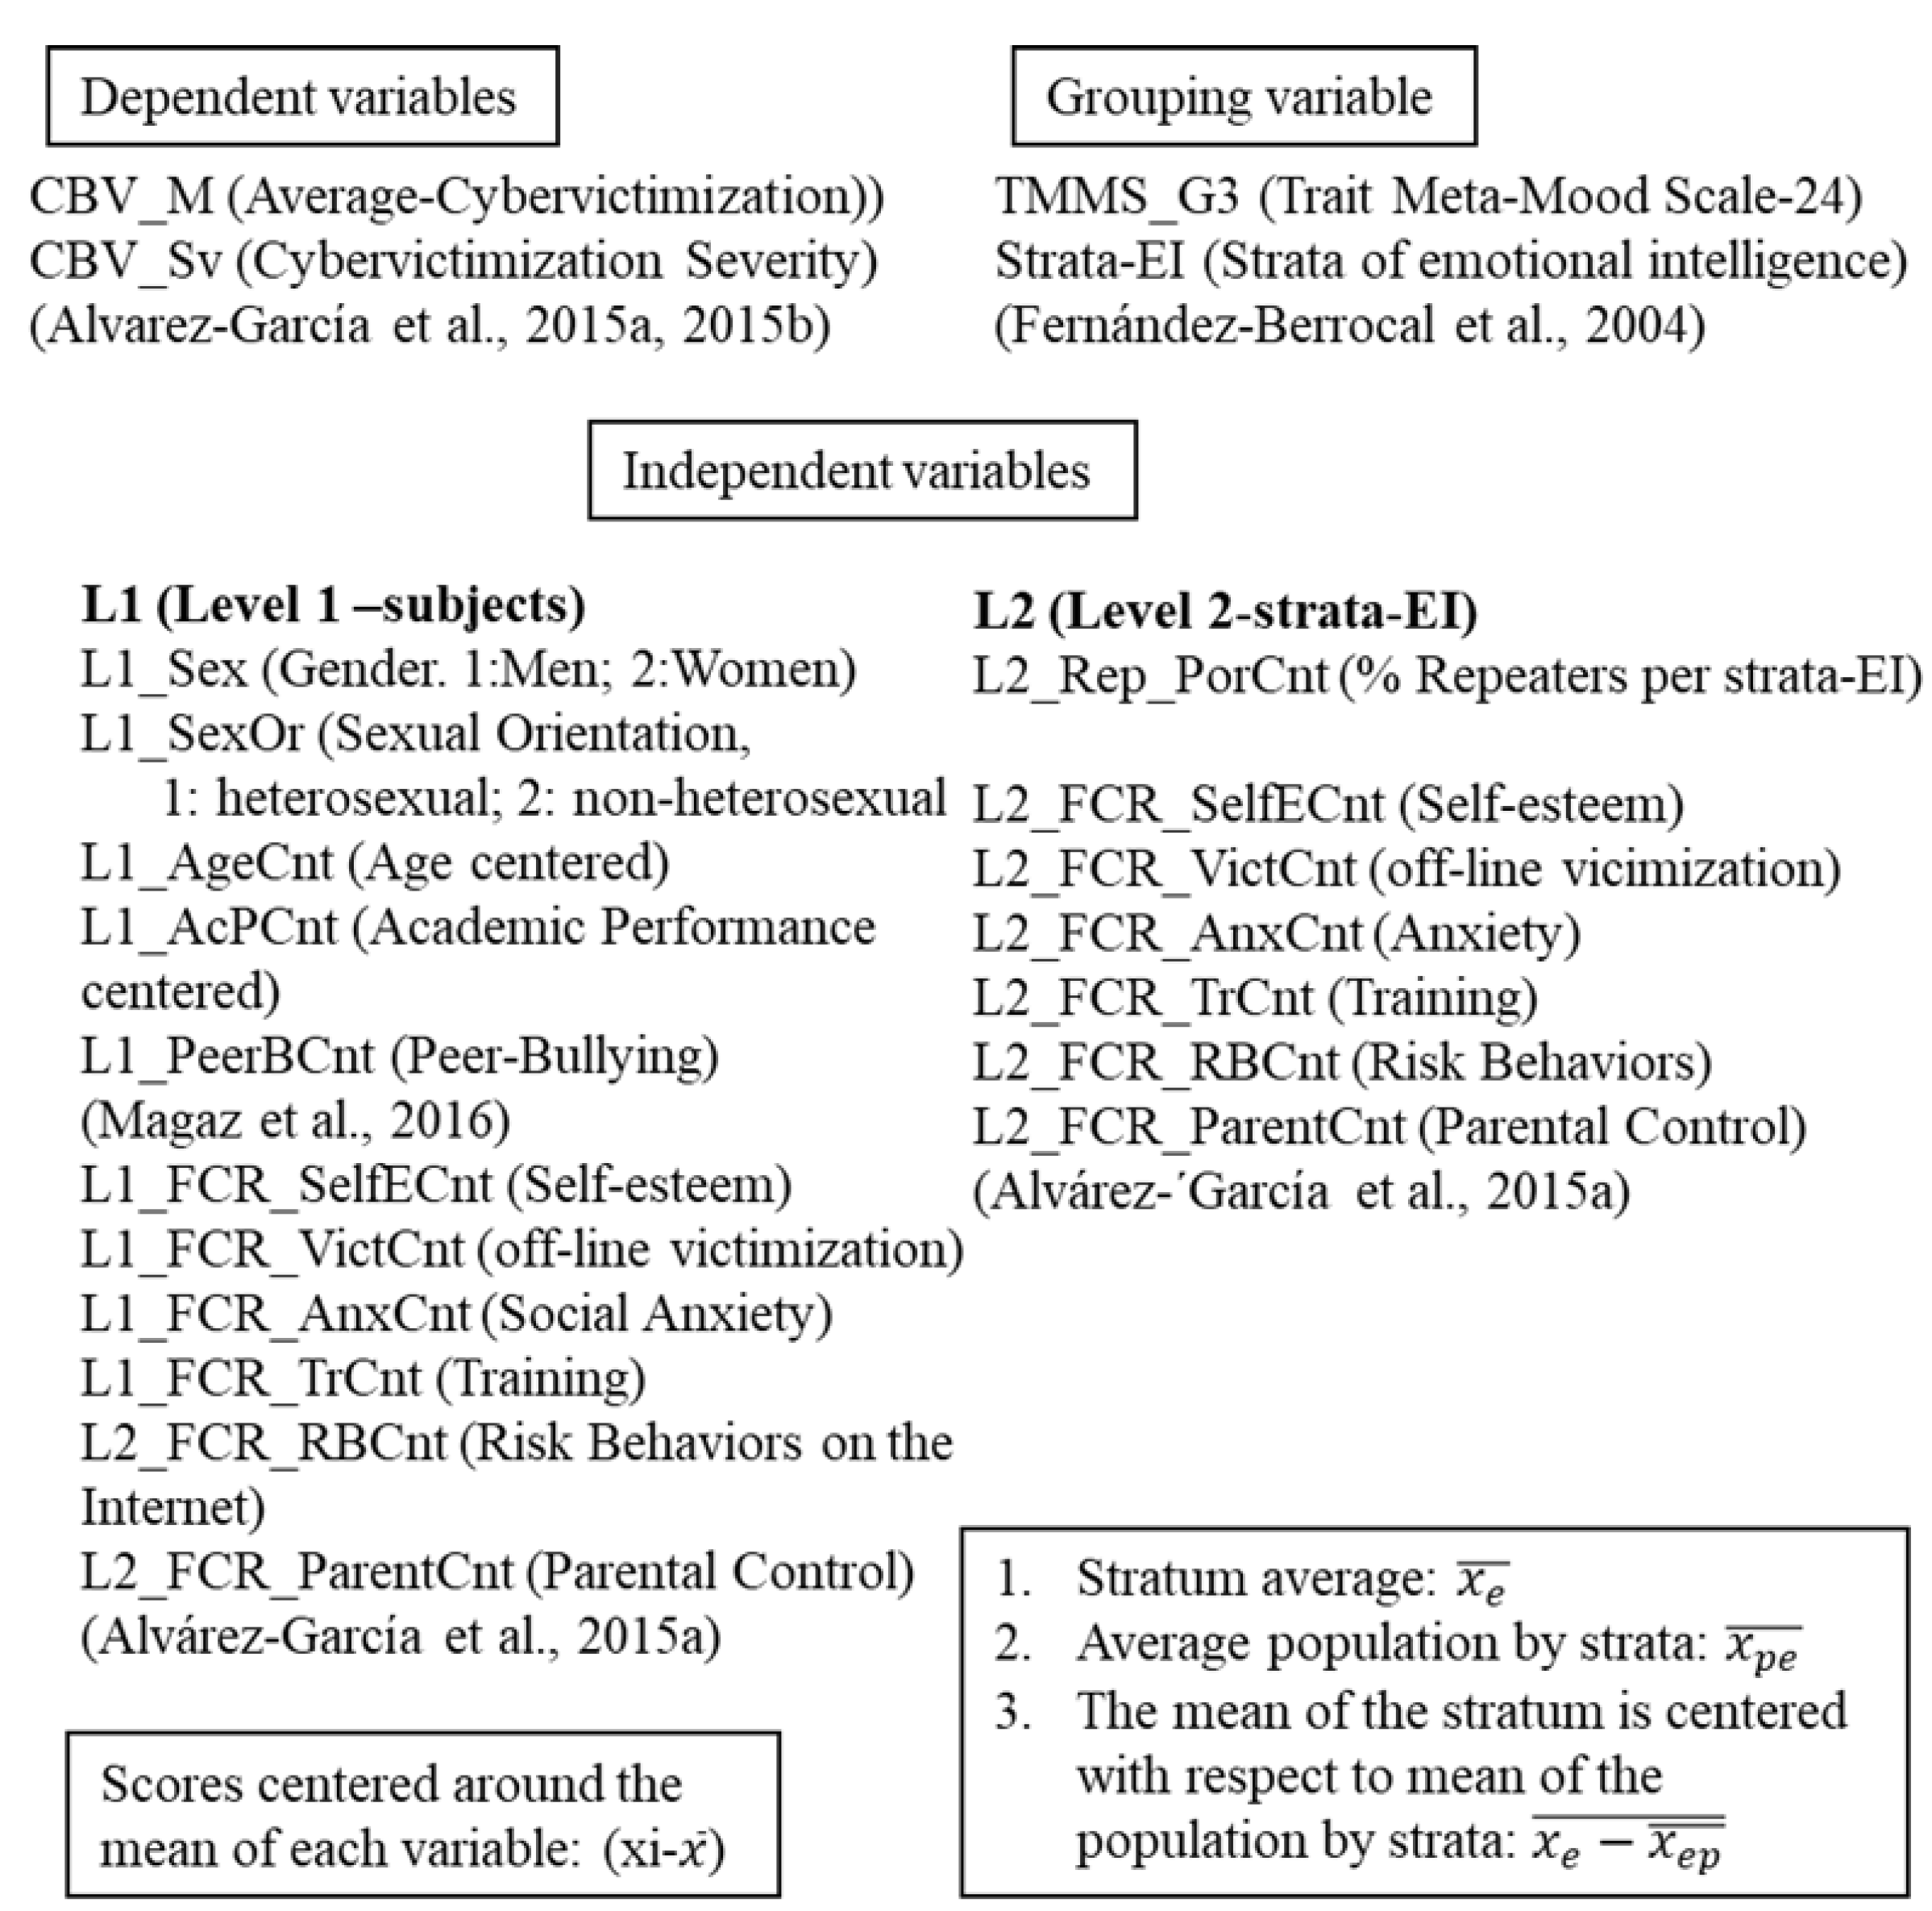
The sociodemographic variables considered were sex (1: male, 2: female), sexual orientation (1: heterosexual, 2: non-heterosexual), and age (age-centered), and the school variables were final performance or grade-centered and whether any grade had been repeated.
For variables related to emotional intelligence (EI), the reference was the Trait Meta-Mood Scale (TMMS-24) [29]. Categorization was performed according to the author´s indications, considering score and gender. The TMMS-24 test does not offer a global sum score of its component factors, so a latent variable was generated, which was formed by the intersections of the categories of each one of the factors. Thus, we would have for the case of too much emotional attention (3), adequate emotional clarity (2), and poor regulation (1), category 321 (Appendix A). Each of the 27 categories of this variable made up the level 2 subjects in the multilevel model. That is, individuals (level 1) were nested according to the corresponding EI-strata (Figure 6).

Figure 6.
Variables [4,29,41,42].
The variables of Parental Control, Self-Esteem, Off-line Victimization, Training-Support regarding Internet Risks, Shyness–Social Anxiety, and Internet Risk Behaviors were estimated with the Álvarez-García et al. [4] risk factor questionnaire, following the indications that the authors detailed for each subscale [41].
At level 1, scores were centered with respect to the mean of each factor. For level 2, variables were constructed with the group scores centered [43,44]. The mean value of the factor in each stratum was subtracted from the mean value of all strata.
For the measurement of peer bullying, the reference was the Bullying Questionnaire in Primary and Secondary Education by Magaz et al. [42].
Regarding cyber-victimization (dependent variable), the reference test was the Cyber-Victimization Questionnaire of Álvarez-García et al. [4]. The total score corresponds to the sum of the scores of each factor, calculating its mean value for each case (CBV_M).
From the mean cyber-victimization scores (CBV_M), the variable Severity Cyber-Victimization was created with two categories, occasional for mean scores less than 1.57 (direct scores less than 41), and severe, for mean scores greater than 1.57 (direct scores greater than 41) (p. 231) [41].
2.4. Statistical Analysis
2.4.1. Statistical Description of the Variables and Justification for Cross-Stratification
The descriptive statistics of the subject-level variables were indicated in Table 1, as well as the estimators and regression intercepts of each independent variable with respect to mean cyber-victimization (CBV_M) in Table 4.
The use of cross-stratification of emotional intelligence factors was justified with the calculation of mean values for each Emotional Intelligence-strata (linear mixed model).
2.4.2. Analysis Procedure
Unconditional Means Model or Null Model
First, the unconditional means model (model 0) was calculated in which only the dependent variable (mean cyber-victimization) and the variation in its mean values in the EI-strata were considered.
The Wald-Z statistic, the Intraclass Correlation Coefficient (ICC) and the Design Effect (Deff) were calculated to estimate how much variance in the cyber-victimization mean variable is explained by belonging to an Emotional Intelligence-strata [45,46].
The Wald-Z statistic is the ratio of the estimator to its standard-error ( [47,48], assuming that if p-value < 0.05, it is possible to reject the null effect hypothesis of the EI-strata variable.
The Intraclass Correlation Coefficient (ICC) is the ratio of the level 2 variance to the sum of the level 1 and level 2 variances, “measuring the degree of similarity within the same group” (p. 289) [46].
In SPSS, it can be calculated from the covariance parameter estimates (variance EI-strata ~s2 level 2; residuals~s2 level 1).
The ICC was used to estimate the Design Effect (Deff) [49,50], defining the design effect as “ the ratio of the variance of the actual sample (p. 258) [51]. ICC ≠ 0 and Deff > 2 [52] were taken as criteria for determining the multilevel analysis advantage.
Importance of Predictive Variables in Cyber-Victimization
Conceptually, the variables gender, sexual orientation, age, and academic performance were appropriate for level 1, and the mean percentage of repeaters per stratum was appropriate for level 2.
We had doubts for the variables related to risk factors and peer harassment. It was not possible to consider them simultaneously as level 1 and level 2 because of the multicollinearity problems involved (by definition, one is a linear combination of the others) [53].
Their importance in predicting mean cyber-victimization as subject-level (L1) and EI-strata level (L2) variables was determined through neural network analysis. A random number was generated for replication purposes (set seed = 9,191,947).
The dependent variable used was mean cyber-victimization, and the independent variables were, on the one hand, L2_FCR_Self-Esteem-Centered, L2_FCR_Off-Line-Victimization Centered, L2_FCR_Social-Anxiety Centered, L2_FCR_Risk-Behaviors-Internet Centered, L2_FCR_Parental-Control Centered, L2_FCR_Training Centered, and L2_Peer-Bullying Centered; on the other hand, L1_FCR_Parental-Control Centered, and L1_Peer-Bullying Centered. The sample was divided into 62.5% training, 25% test, and 12.5% reserve. The training was performed on minibatches, and the automatic architecture selection function was used as the output layer [54]
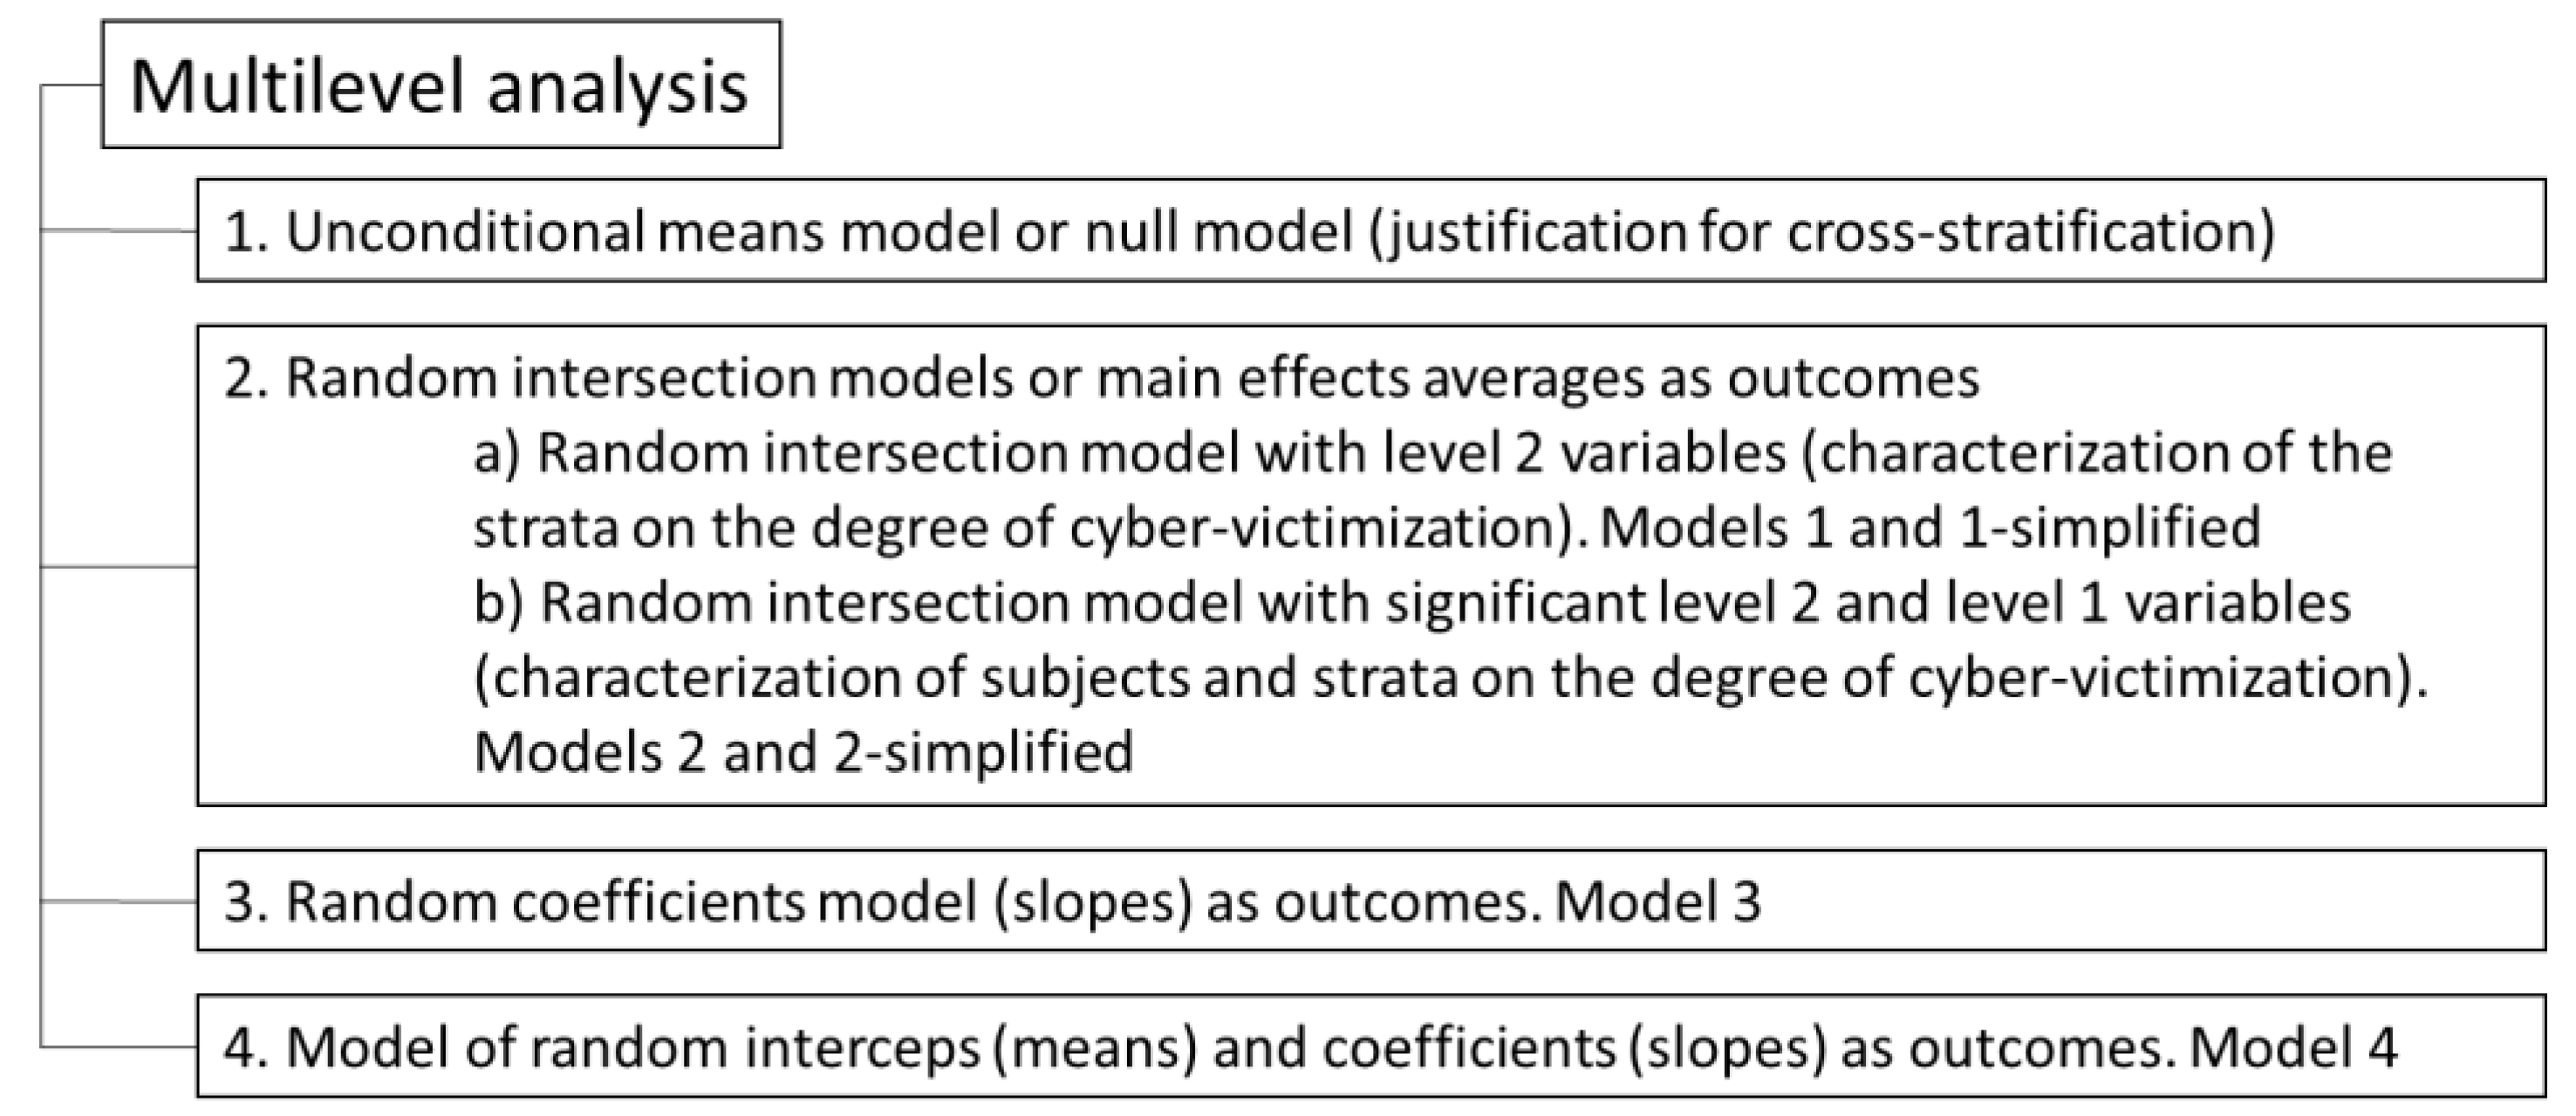
Random Intersection Models or Main Effects Averages as Outcomes
Four models were generated. One model of random intersections with all level-2 variables (model 1), another with the significant level-2 variables found in model 1 (model 1-simplified), a third with significant level-2 variables, together with the level-1 variables (model 2), and a fourth model (model 2- simplified) with the significant level-2 and level-1 variables from model 2 (Figure 7).
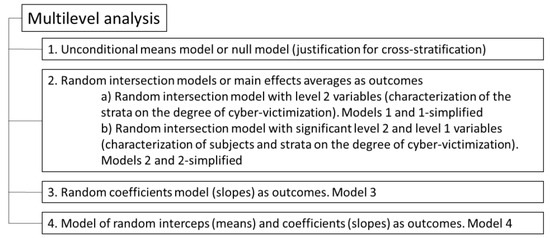
Figure 7.
Multilevel analysis models.
The variables social anxiety and parental control were not significant at level 2. We explored including the corresponding level-1 variables in the 2-simplified model, which did not improve the fit indicators of the model and decreased the ICC. A separate multilevel model was chosen, which analyzed only the variables related to risk factors in cyber-victimization [4].
Model of Random Coefficients (Slope) as Outcomes
In the previous models, the significant predictor variables (level 1 and level 2) were considered as fixed effects. The only coefficient that varied randomly from stratum to stratum was the constant or intercept (β0j).
The variables age, peer bullying and academic performance were tested subject centered (L1), with unstructured covariance type, to explain the variability of slopes [55]. Only the variable peer bullying (model 3) was significant.
Model of Random Interceps (Meanss) and Coefficients (Slopes) as Outcomes
Using the variables that were significant in the random intersection model as main effects (model 2-simplified) and the variable peer harassment that was significant in the random coefficients model (model 3), a new model was developed that accounted for the randomness of stockings and earrings (model 4).
With the variables that were significant in model 3, model 4 was developed (model with random means and slopes as outcomes).
2.4.3. Measurement of Changes in Reporting Criteria
We calculated the likelihood ratio (G20-j = Deviance null-model; Deviance model-4) between each of the models generated and the null-model [56], and the estimate of the significance value of this value in a Chi-square distribution from the difference between degrees of freedom of each model (number of parameters: 1) [57].
2.4.4. Characterization of the EI-Strata
It was based on model 4. The characterization of EI-strata was performed by segmenting the data by the variable TMMS-G3 (EI-strata) and performing regression analysis with the variables involved at level 2. Since the variable L2_FCR_Self-Esteem Centered is the mean of L1_FCR_Self-Esteem Centered for each EI-strata, the level 2 variable was substituted for the level-1 variable for this calculation.
Stratum 222 (adequate attention, clarity, and emotional regulation) was analyzed as well as those with higher and lower levels of average cyber-victimization. It was observed that the lower the number of cases, the lower the accuracy, and it was not possible to make predictions for those with the lowest number of cases (e.g., 313 with 19 cases).
The values of the standardized estimators were used as a reference to assess the importance of each variable in the relationship of each EI-strata to cyber-victimization.
The assumption of multicollinearity was tested with the Variance Inflation Factor (VIF) test or proportion of the variability of the i-th variable in relation to the rest of the independent variables [58]. It was taken as a criterion that values lower than 10 (tolerance greater than 0.1) do no entail multicollinearity problems [59], and the Durbin–Watson test was used to detect an autocorrelation of the residuals (they must be independent), assuming that values between 1.5 and 2.5 indicate independence of the errors [60].
3. Results
3.1. Justification for Cross-Stratification (TMMS-G3)
The statistical description of the predictor variables for each of the EI-strata showed that the cases with low attention, clarity, and regulation were not those with the least parental control, with a mean of 13.64 (mean between strata: 13.94); their average academic-performance, 5.5, was among the lowest (mean between strata: 6.05), they presented low levels of self-esteem and support formation, and high levels of off-line victimization, while the cases of the stratum with adequate values of attention, clarity and regulation (222) were characterized by having values very close to the total means in all variables.
On the other hand, the analysis of the ICCs showed that the variables self-esteem (0.161), risk behavior (0.124), anxiety (0.111), and peer bullying (0.118) contributed the most variability to the EI-strata (Table 5).
Table 5.
Mean values of the independent variables by EI-strata.
3.2. Unconditional Means Model
The average cyber-victimization in relation to the emotional intelligence profile of the participants was different from zero [Hypothesis 1], finding statistically significant differences in the levels of cyber-victimization, both at level 2 (emotional intelligence profile) and level 1 (subjects).
Cyber-victimization varied significantly across Emotional Intelligence-strata. The Intraclass Correlation Coefficient (1.363/(1.363 + 0.046) = 0.967 ≈ Pseudo-R squared) indicated that of the total variability in cyber-victimization could be largely explained by the emotional intelligence profile (stratum) (Table 6).
Table 6.
Results of the unconditional mean model.
The multilevel analysis is justified by using the Emotional Intelligence-strata (attention, clarity, and emotional regulation) as subjects.
3.3. Importance of Independent Variables in Cyber-Victimization
The normalized significance of the variables cyber-victimization risk factors [41] and peer bullying [42] was determined using neural network analysis.
The peer bullying variable had a normalized significance of 100% for level 1, and self-esteem (100%), off-line victimization (92.9%) and anxiety–timidity (78.1%) had better levels for level 2 (Table 7). Variables related to risk factors for cyber-victimization were assigned as level-2 variables, and peer bullying was assigned as a level-1 variable.
Table 7.
Importance of independent variables in average cyber-victimization.
3.4. Random Intersection Models or Main Effects Averages as Outcomes
With the null or unconditional mean model, we inferred the level of cyber-victimization based on emotional intelligence profiles. But cyber-victimization could be explained by (a) the characteristics of the strata, (b) the characteristics of the subjects that make up each stratum, as well as by (c) the joint effect of both.
(a) Random intersection model with L2 variables (characterization of the strata on the degree of cyber-victimization) (models 1 and 1-simplified).
In the strata characteristics analysis model with all level-2 predictor variables (model 1), the variables L2_FCR_Training Centered and L2_FCR_Risk-behaviors Centered did not have significant t-values, eliminating them from the explanatory model of the effects of level-2 variables (model 1-simplified). In the 1-simplified model, a positive association with cyber-victimization was found in the variable’s percentage of repeaters, victimization, social anxiety, and parental control. And there was a negative or protective association of self-esteem with cyber-victimization
(b) Random intersection model with significant L2 and L1 variables (characterization of subjects and strata on the degree of cyber-victimization) (models 2 and 2-simplified).
To the 1-simplified model (significant L2 variables), level-1 variables (L1_Sex, L1_Sexual-Orientation, L1_Age-Centered, L1_Academic-Performance Centered, and L1_Peer-Bullyng Centered) were added, forming model 2. The only level-2 variable that remained significant was self-esteem-L2 with t-value (estimator: −0.0012/standard error: 0.003) of 16.41 (Sig. < 0.001).
The variation in the residuals between model 0 and model 2 was calculated: (model 0 residuals − model 2 residuals)/model 0 residuals.
We found that the decrease in residuals in the estimates of the covariance parameters between model 0 and the simplified model 2 was 34.7% [(0.046–0.030)/0.046 = 0.75] (Table 8).
Table 8.
The 2-simplified random intersection (mean) model characterizing average-cyber-victimization at the EI-strata (L2) and subject (L1) levels.
3.5. Model of Random Coefficients (Slopes) as Outcomes (Model 3)
Of the three possible variables to use as random effects (peer bullying, academic performance, and centered-age), it was peer bullying that best explained the variances in slopes between strata.
For the null model, the peer-bullying variable was included as a random effect and fixed effect (model 3).
Estimation of the two fixed-effects parameters indicated (a) that the constant or intercept or population mean cyber-victimization estimate based on centered peer-bullying scores was 00 = 1.157, and (b) that the coefficient associated with the variable L1_PeerBCnt or mean of all slopes was 10 = 0.015.
That is, for every point that peer bullying increased, the mean cyber-victimization increased 0.015. The p-value (<0.001) associated with the t-statistic indicated that the population slope is non-zero and that there is a positive association between peer bullying and cyber-victimization.
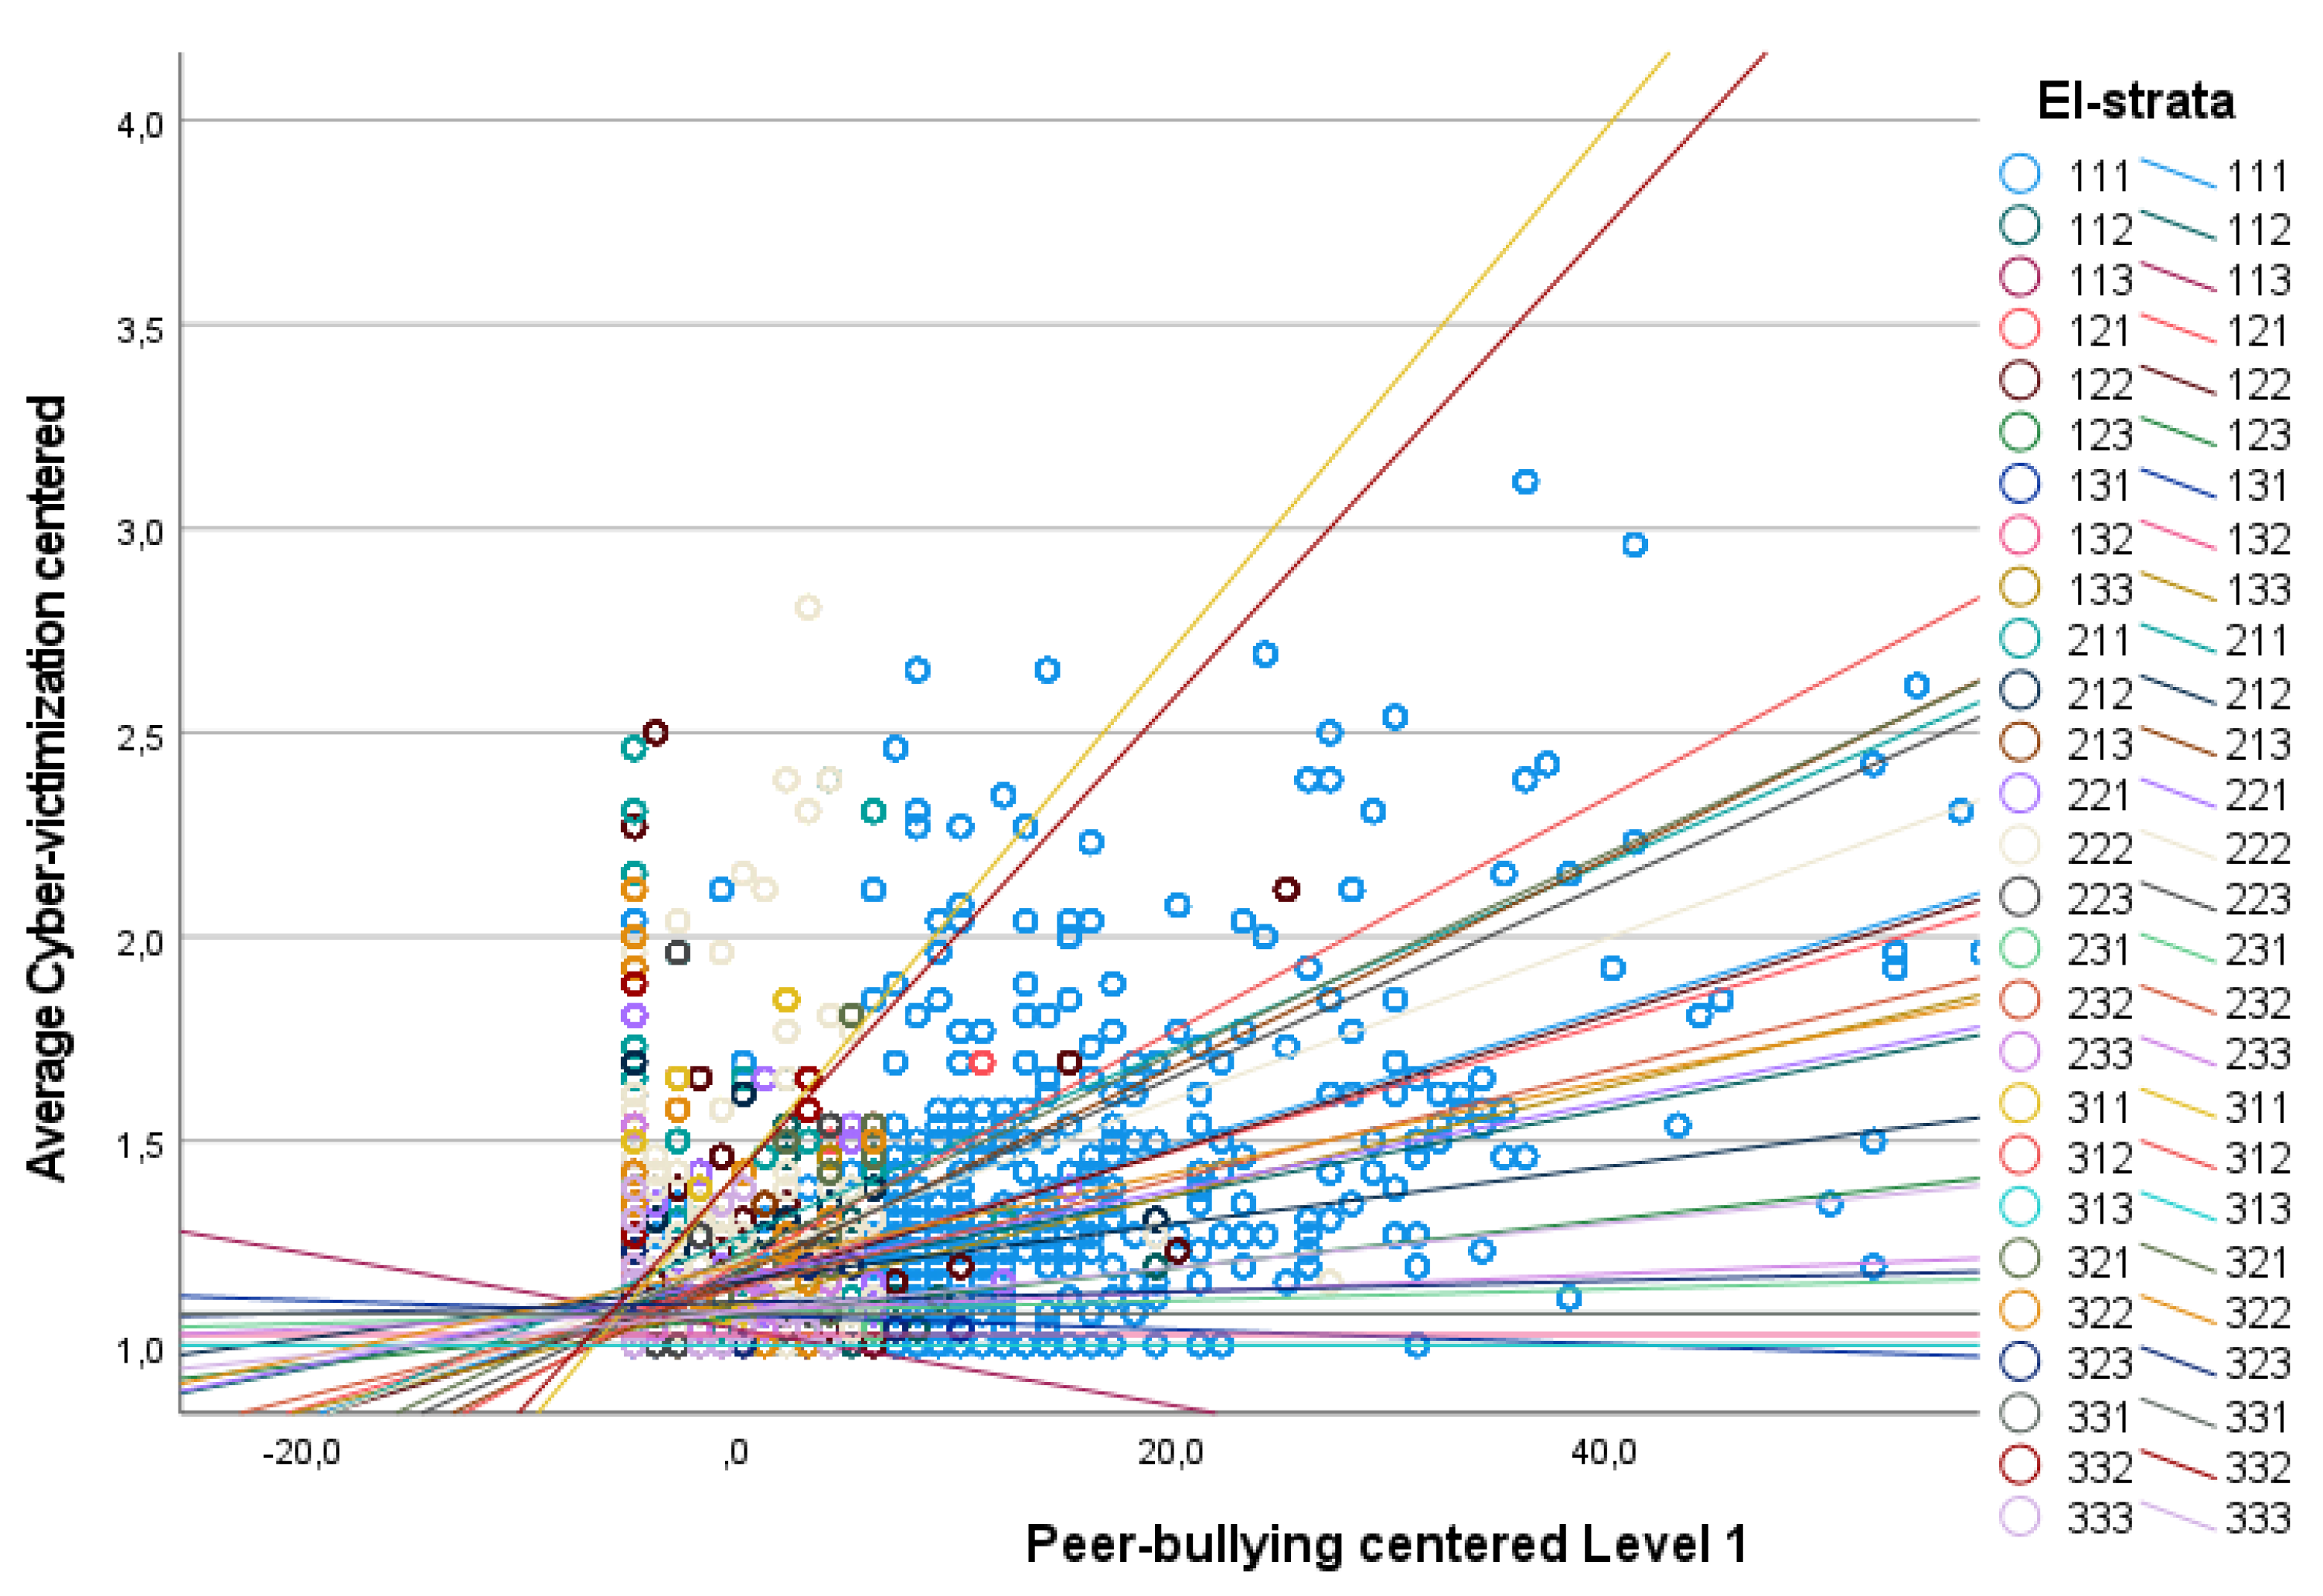
In this regard, it was relevant to note that the influence of the peer-bullying variable had different implications depending on the EI-strata.
For example, for cases in stratum 113 (low attention, low clarity, and high regulation), the initial cyber-victimization is higher (1.44), but when there is peer bullying, cyber-victimization tends to decrease (YCBV_M = 1.44 − 0.01× X Peer-Bullying), while for others, such as 222 (adequate attention, adequate clarity, and adequate regulation; YCBV_M = 0.34 + 0.02× X Peer-Bullying), or 332 (high attention, high clarity, and adequate regulation; YCBV_M = −1.12 + 0.06× X Peer-Bullying), the initial position (Peer-Bullying Cnt = 0) is lower, but when there is peer bullying, cyber-victimization tends to increase (Figure 8).
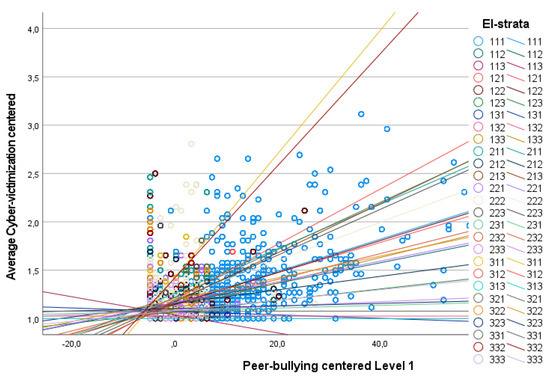
Figure 8.
Cyber-victimization x peer-bullying regression equations (level 1) by emotional intelligence-stratum.
3.6. Model of Random Intersections (Averages) and Coefficients (Slopes) as Outcomes
Both intercepts (model 2-simplified) and coefficients (model 3) varied between EI-strata. A model has been created to explain this variation based on the previous two models (model 4).
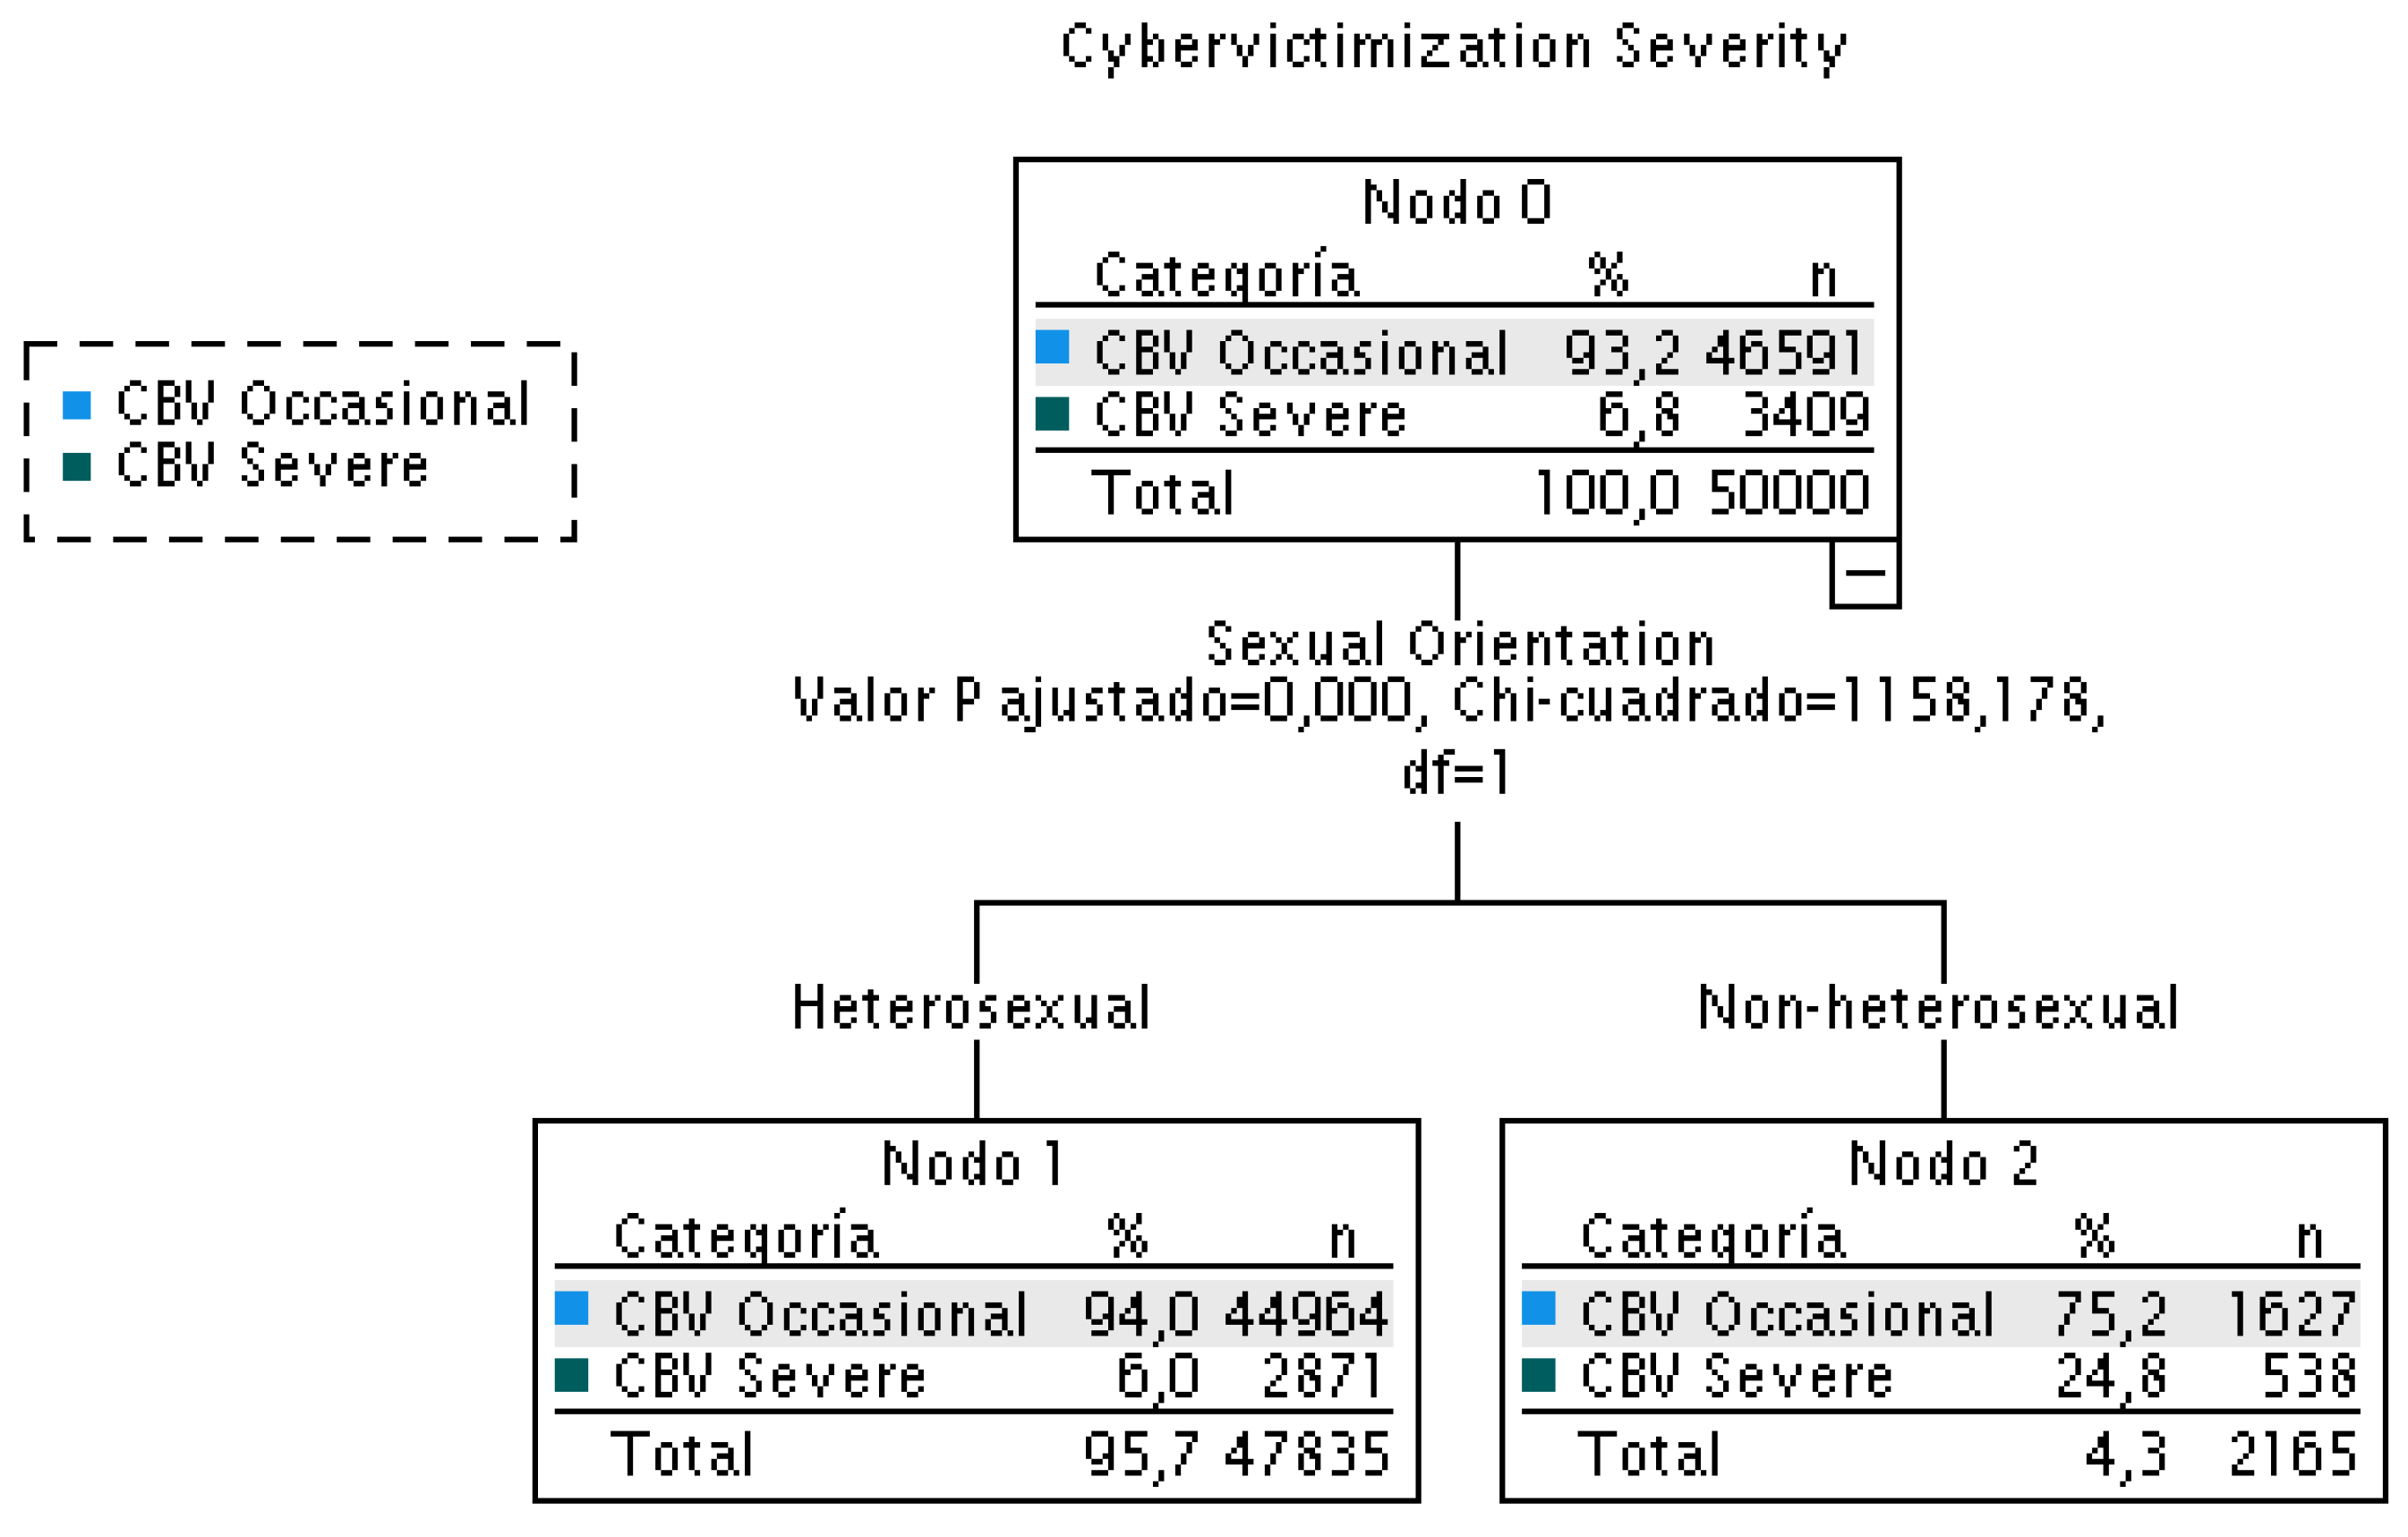
It was observed that the average cyber-victimization was higher for non-heterosexual cases than for heterosexual cases, observing that 6.0% of heterosexuals suffered severe cyber-victimization compared to 24.8% of non-heterosexuals (Figure 9).
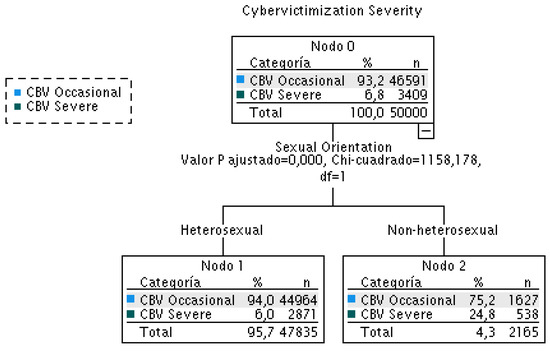
Figure 9.
Sexual orientation by cyber-victimization severity classification tree.
Model 4 could be improved with the sexual orientation variable (L1_SexOr). A new model was created from model 4, adding two interactions (gamma coefficients 11 and 12) (L1_Sexual Orientation * L1_Peer-Bullying Centered, and L1_Peer-Bullying Centered * L2_FCR Self-Esteem Centered) to the five main effects: one at level 1 (L1_Sex, L1_Sexual Orientation, L1_Age-Centered, L1_Academic Performance Centered, and L1_Peer-Bullying Centered) and one at level 2 (L2_FCR_Self-Esteem Centered) (model 4).
No significance was found for the level-1 variables: gender and sexual orientation. Meanwhile, significance was found for self-esteem centered (level 2), and age-centered (level 1), academic performance (level 1), and peer bullying (level 1) (Table 9).
Table 9.
Model 4 with intercepts (fixed effects and interactions) and random coefficients as outcomes characterizing average-cyber-victimization at the level of strata (L2) and subjects (L1).
3.7. Characterization of the Emotional Intelligence-Strata (EI)
The analysis focused on the stratum with adequate levels of emotional intelligence (222), which was not the stratum with the most cyber-victimization [Hypothesis 2.a], as well as the EI-strata that demonstrated higher and lower of average cyber-victimization.
In stratum 222, out of 5951 cases, 4.21% showed severe cyber-victimization. Suffering from peer bullying (βL1_PeerBCnt = 0.31) and age (βL1_AgeCnt = 0.24) had the greatest weight, with a mean VIF of 1.03 and Durbin–Watson value of 1.74. Neither gender nor sexual orientation was significant.
The strata with the highest average cyber-victimization were 111, 332, 321, and 211.
For stratum 111 (low attention, clarity, and regulation), a high level of average cyber-victimization was confirmed, also for those in whom attention was excessive, with peer bullying being the variable with the greatest weight in predicting an increase in cyber-victimization.
In the case of stratum 311, gender (βL1_Sex = −0.41) and sexual orientation (βL1_Sexual-Orientation = −0.40) were relevant, with women and non-heterosexuals experiencing greater cyber-victimization. They were the strata with the highest percentage of severe cyber-victimization (19.41% for 111, and 13.23 for 311).
In the case of stratum 332 (high attention, high clarity, and adequate regulation), cyber-victimization was lower for non-heterosexuals.
Those with lower average cyber-victimization were 132, 123, 133, 333, 113, 213, and 233.
It was found that they had in common a high level of emotional regulation, and that gender and sexual orientation were of little relevance, being non-significant for strata 113, 123, 132, 133, and 213.
In the case of stratum-IE 113, peer bullying had a negative standardized, resulting in the variable with the most weight (βL1_Peer-Bullying-Cnt = −0.61).
The behavior or peer bullying was different from the rest of the EI-strata, where in general, as the amount of peer-bullying increased, the amount of cyber-victimization also increased.
Similarly, for the age variable, in the case of stratum 113, the higher the age, the lower the cyber-victimization, while in the rest of the strata, cyber-victimization increased with increasing age (11–18 years).
In this stratum (113), the regression equation for risk factors in cyber-victimization (independent variables) and average cyber-victimization (dependent variable) had an R2 value of 0.954.
Training in the educational center on Internet risks had a protective role, and contrary to expectations, greater parental control meant an increase in cyber-victimization.
4. Discussion
The differences between profiles (strata) of emotional intelligence explained up to 96.7% of the variability in cyber-victimization. Both the Design-Effects statistic (Deff = 105.83) and the ICC of the unconditional model of means (ICC = 0.967), as well as the scatterplot (Figure 8), allowed us to accept that the average cyber-victimization in relation to the emotional intelligence profile is different from zero [hypothesis 1], which justified the multilevel analysis [61].
The level 2 random means model (1-simplified model) found a positive association between the variables percentage of repeaters in EI-strata, victimization, social anxiety, and parental control, and negative or protective self-esteem against cyber-victimization [hypothesis 2].
In the model that included both level 1 and level 2 random means (2-simplified model), only the self-esteem variable remained significant at level 2. A decrease of 34.7% was observed in the estimation of the residuals of the covariance parameters with respect to the null models with a proportion of variance explained for levels 1 and 2 of 75%.
The positive association between peer bullying and cyber-victimization was tested in the random slopes model (model 3). Without taking other predictor variables into account, for each point of peer bullying, cyber-victimization increased by 0.015.
In model 4 (Table 9), it was found that the prediction of cyber-victimization for the i-th case in the j-th EI-strata () results from (1) the average cyber-victimization of the EI-strata when all independent variables are set to 0.
The significance level (Sig. < 0.001) enabled us to conclude that there was a statistically significant difference between the average cyber-victimization within the population and mean peer bullying centered score of zero, (2) L2_FCR_Self-Esteem-Centered = −0.044 (Sig = 0.001), that is, for cases with a mean peer bullying centered score of zero (L1_Peer-Bullying-Centered = 0), self-esteem was negatively ( and significantly related to average cyber-victimization (Sig. = 0.001).
The value of the regression coefficient indicated that the average cyber-victimization of subjects with average peer bullying scores decreased by 0.044 points for each point that self-esteem increased (the interaction between self-esteem and peer bullying was significant with p-value 0.005), (3) L1_Sex = 0.10 (Sig < 0.001); therefore, the male gender was positively related, at a small (, but significant level (Sig. < 0.001), to predicted cyber-victimization for women.
The estimator is related to the category of boys. That is, it is lower for the category of girls (which was taken as a reference and assigned a value of 0 for cyber-victimization), (4) L1_Sexual-Orientation = −0.039 (Sig < 0.001); heterosexual orientation was negatively ( and significantly (Sig. < 0.001) related to predicted cyber-victimization for non-heterosexuals.
That is, it is lower for the heterosexual category (which was used as a reference for the non-heterosexual category, assigning a value of 0 for cyber-victimization), (5) L1_Age-Centered = 0.019 (Sig < 0.001), for cases with a centered mean score for peer bullying (L1_Peer-Bullying-Centered = 0), age was positively ( and significantly (Sig. < 0.001) related to the mean score for cyber-victimization.
The value of the regression coefficient indicates that the average cyber-victimization increased by 0.019 for each year, (6) L1_Academic-Performance-Centered = −0.008 (Sig < 0.001), academic performance (controlling for peer bullying) was related to average cyber-victimization at a small, negative = −0.008), and significant level (sig. < 0.001). For every point increase in average academic performance, average cyber-victimization decreased by −0.008, (7) L1_Peer-Bullying-Centered = 0.019 (Sig < 0.001), peer bullying is related to average cyber-victimization . This value refers to the average self-esteem centered on EI-strata (L2_FCR_Self-Esteem-Centered = 0). That is, for similar self-esteem levels, peer bullying increases cyber-victimization by 0.019, (8) (L2_FCR_Self-Esteem-Cnt *L1_Peer-Bullying- Cnt) = −0.007 (Sig. = 0.005), the interaction between self-esteem and peer bullying was significant (Sig. = 0.005), with self-esteem counteracting the influence of peer bullying on average-cyber-victimization from 0.019 to −0.007. Each point increase in self-esteem means that for similar levels of peer-bullying, the average-cyber-victimization decreases by 136.84%, (9) (L1_Sexual-Orientation *L1_Peer-Bullying-Cnt) = −0.002 (Sig. < 0.001), the interaction between heterosexual orientation and peer bullying was significant (Sig. < 0.001). For similar levels of peer-bullying, heterosexual orientation reduced average cyber-victimization by 110.52% compared to non-heterosexual orientation, controlling for self-esteem (L2_FCR_Self-Esteem-Cnt = 0), (10) the conditional or residual variance between subjects (variability between slopes) was estimated to be UN[1,1] = 0.005 (Sig. = 0.002), (11) the conditional or residual variance between EI-strata (variability between slopes) was found to be practically zero, indicating that the independent variables included in the model achieved an excellent prediction of the differences between EI-strata ( UN[2,2] = 5.52 × 10⁻⁵, Sig. = 0.003), and (12) variability within each stratum-IE (level 1 random errors) was 0.046 (Sig. 0.000).
The analysis of model 4 and its use for the analysis of each of the EI-strata independently allowed us to conclude that gender had its greatest weight for stratum 311 (β = −0.323) with a protective effect for boys compared to girls and 321 (β = −0.274), i.e., cyber-victimization was lower for girl’s tan for boys.
In the case of 311, being heterosexual is a protective factor against not being heterosexual (β = −0.323). That is, in the case of stratum 311, one of the strata with the highest cyber-victimization, being boys and heterosexual, reduces the risk of cyber-victimization, while being girl and non-heterosexual significantly predisposes to cyber-victimization.
In the case of stratum 111, both gender and sexual orientation had a weak, although significant, relationship with average cyber-victimization (βsex = −0.019; βorientation_sexual = 0.0056).
For sexual orientation, being heterosexual is a protective factor for all strata [62], especially for those with higher levels of cyber-victimization, as in the case of 311 (β3114 = −0.039).
In general, the higher the age (11–18), the higher the cyber-victimization. This was particularly the case in the strata with higher levels of regulation (β213 = 0.555, β133 = 0.396, β323 = 0.386, β333 = 0.315, y β233 = 0.296), although in the case of 113, it was a protective factor (β113 = −0.484).
Self-esteem functioned as a protective factor against cyber-victimization. There was no clear pattern in its relationship with the three stratification factors of emotional intelligence (attention, clarity, and regulation). The greatest protective weight of self-esteem was found in strata 232, 132, and 311 (β232 = −0.313, β132 = −0.282, y β113 = −0.253). This aspect is relevant to stratum 311, with the highest levels of severe cyber-victimization, for which self-esteem is the relevant protective factor.
Shyness–social anxiety (βL1_FCR_Social-Anxiety-Cnt = −0.006; Sig. < 0.001) and internet risk behaviors (βL1_FCR_Risk-Behaviors-Internet-Cnt = 0.015; Sig 0.00) had a small weight on cyber-victimization as fixed effects at the subject level and were not significant at the EI-strata, which is consistent with Romera et al. [63] finding that “social anxiety did not significantly affect victimization” (p. 114).
Although Martinez-Martinez et al. [26] found that “EI (emotional intelligence) is a protector against bullying”, our study shows that having a profile in which both emotional attention, emotional clarity, and emotional regulation are adequate (222) does not guarantee protection against cyber-victimization.
It was evident that each profile or emotional intelligence stratum had its own peculiarities in terms of predisposition to cyber-victimization and the weight that the variables gender, sexual orientation, academic performance, or risk factors had in cyber-victimization, and that in general, levels of excessive interpersonal attention and low emotional regulation are predictors of cyber-victimization [2,64].
It is necessary to propose actions aimed at protecting non-heterosexual people from cyber-victimization [65], especially in the case of girls, considering the need to strengthen self-esteem and emotional regulation.
In general, protective measures against cyber-victimization should warn about the risk of internet use, avoid paternalistic behaviors by adults to protect minors, and reduce rumination behaviors or excessive attention to the opinion that others have of us [66].
Limitations of this work include the self-reported nature of the primary data, which implies biases that could be amplified by the simulate sample, and its cross-sectional nature.
Presumably, membership in an EI stratum is transitory. We do not know the possibilities of transit and the elements that might facilitate change toward profiles with higher levels of emotional regulation.
The methodological approach used deserves special attention: first, by generating simulated data from the mathematical model representing the experimental data; secondly, with a proposed analysis of the relationship between identity and representativeness of the simulated data generated. Subsequently, the procedure of intersectional stratification of the sample is explained, as well as the analysis procedure based on the comparison of the symmetric structures resulting from the stratification process.
It has been shown that the use of simulated data and their evaluation, as well as the use of stratified categorical variables as subjects of multilevel analysis, are useful tools for identifying differences in the patterns followed by the predictor variables of cyber-victimization according to different emotional intelligence profiles.
Funding
The work is part of the Research Project of the Ministry of Science and Innovation (Spain): Hate Speeches in the online relationships of adolescents from Western Almeria (DIS-ODIO) (PID2021-127113OB-100).
Institutional Review Board Statement
The study was conducted in accordance with the Declaration of Helsinki and approved by the Ethics Committee of University of Almeria (UALBIO2022/015 -22/12/2023).
Informed Consent Statement
Informed consent was obtained from all subjects involved in the study.
Data Availability Statement
Dataset and data simulation plan. https://figshare.com/s/fd93e6749521994c956c (accessed 29 May 2024).
Conflicts of Interest
The author declares no conflicts of interest.
Appendix A
* SCRIPT categorization TMMS-24 [29] based on individual item scores. Independent Variable: Emotional Intelligence**
* Encoding: UTF-8.
***Three dimensions: ***
***(DIMENSION 1) TMMS ATTENTION TO EMOTIONS (PERCEPTION)***
***(1) TMMS_Attention. Categories: (1) Poor attention (Men <= 21; Women < 24); (2) Adequate care (Men 22–32; Women 25–35***
**(3) Too much attention (men <= 33; Women <= 36)***
***We create variable grn --> sum of items***
DATASET ACTIVATE DataSet1
COMPUTE TMMS_At = TMMS241 + TMSS242 + TMMS243 + TMMS244 + TMMS245 + TMMS246 + TMMS247 + TMMS248.
VARIABLE LABELS TMMS_At ‘TMMS_Attention_Sum’.
EXECUTE.
***We create variable TMMS_AtR with indicated categories***
***(1) Little attention MEN: Sex = 1 & TMMS_At <= 21***
IF (SEX = 1 & TMMS_At <= 21) TMMS_AtR = 1.
VARIABLE LABELS TMMS_AtR ‘TMMS_Attention_Sum’.
EXECUTE.
***(2) Adequate attention MEN: Sex 1 & (TMMS_At >= 22 & TMMS_At <= 32)**
IF (SEX = 1 & (TMMS_At >= 22 & TMMS_At <= 32)) TMMS_AtR = 2.
VARIABLE LABELS TMMS_AtR ‘TMMS_Attention_Sum’.
EXECUTE.
***(3) Too much attention MEN: Sex 1 & TMMS_At >= 33**
IF (SEX = 1 & TMMS_At >= 33) TMMS_AtR = 3.
VARIABLE LABELS TMMS_AtR ‘TMMS_Attention_Sum’.
EXECUTE.
***(1) Little attention WOMEN: Sex 2 & TMMS_At <= 24***
IF (SEX = 2 & TMMS_At <= 24) TMMS_AtR = 1.
VARIABLE LABELS TMMS_AtR ‘TMMS_Attention_Sum’.
EXECUTE.
***(2) Adequate care WOMEN: Sex 2 & (TMMS_At >= 25 & TMMS_At <= 35)**
IF (SEX = 2 & (TMMS_At >= 25 & TMMS_At <= 35)) TMMS_AtR = 2.
VARIABLE LABELS TMMS_AtR ‘TMMS_Attention_Sum’.
EXECUTE.
***(3) Too much attention WOMEN: Sex 2 & TMMS_At >= 36**
IF (SEX = 2 & TMMS_At >= 36) TMMS_AtR = 3.
VARIABLE LABELS TMMS_AtR ‘TMMS_Attention_Sum’.
EXECUTE.
***We create the variable TMMS_AtR2: Recoded attention (2 cat)***
It will have two categories: (1): Adequate care; (2) Care must improve***
RECODE TMMS_AtR (1 = 2) (2 = 1) (3 = 2) INTO TMMS_AtR2.
VARIABLE LABELS TMMS_AtR2 ‘Atención recod (2 cat)’.
EXECUTE.
***(DIMENSION 2) CLARIDAD EMOCIONAL (COMPRENSIÓN)***
*** (2) TMMS_Clarity. Categories: (1) Poor clarity (Men <= 25; Women: <= 23); (2) Adequate clarity (Men 26–35; Women 24–34***
***(3) Too much clarity (Men >= 36; Women >= 35)***
***We create variable TMMS_Cl --> sum of items***
DATASET ACTIVATE ConjuntoDatos1.
COMPUTE TMMS_Cl = TMMS249 + TMMS2410 + TMMS2411 + TMMS2412 + TMMS2413 + TMMS2414 + TMMS2415 + TMMS2416.
VARIABLE LABELS TMMS_Cl ‘TMMS_Clarity_Sum’.
EXECUTE.
***We create TMMS_ClR variable with indicated categories***
***(1) Poor clarity MEN: Sex = 1 & TMMS_Cl <= 25***
IF (SEX = 1 & TMMS_Cl <= 25) TMMS_ClR = 1.
VARIABLE LABELS TMMS_ClR ‘TMMS_Clarity_Sum’.
EXECUTE.
***(2) Adequate clarity MEN: Sex 1 & (TMMS_Cl >= 26 & TMMS_Cl <= 35)**
IF (SEX = 1 & (TMMS_Cl >= 26 & TMMS_Cl <= 35)) TMMS_ClR = 2.
VARIABLE LABELS TMMS_ClR ‘TMMS_Clarity_Sum’.
EXECUTE.
***(3) Too much clarity MEN: Sex 1 & TMMS_Clt> = 36**
IF (SEX = 1 & TMMS_Cl >= 36) TMMS_ClR = 3.
VARIABLE LABELS TMMS_ClR ‘TMMS_Clarity_Sum’.
EXECUTE.
***(1) Poor clarity WOMEN: Sex 2 & TMMS_Cl <= 23***
IF (SEX = 2 & TMMS_Cl <= 24) TMMS_ClR = 1.
VARIABLE LABELS TMMS_ClR ‘TMMS_Clarity_Sum’.
EXECUTE.
***(2) Adequate clarity WOMEN: Sex 2 & (TMMS_Cl >= 24 & TMMS_At <= 34)**
IF (SEX = 2 & (TMMS_Cl >= 24 & TMMS_Cl <= 34)) TMMS_ClR = 2.
VARIABLE LABELS TMMS_ClR ‘TMMS_Clarity_Sum’.
EXECUTE.
***(3) Too much clarity WOMEN: SEX 2 & TMMS_Cl >= 35**
IF (SEX = 2 & TMMS_Cl >= 35) TMMS_ClR = 3.
VARIABLE LABELS TMMS_ClR ‘TMMS_Clarity_Sum’.
EXECUTE.
***We create the variable TMMS_ClR2: Recoded Clarity (2 cat)***
It will have two categories: (1): Adequate clarity; (2) Clarity needs to improve***
RECODE TMMS_ClR (1 = 2) (2 = 1) (3 = 2) INTO TMMS_ClR2.
VARIABLE LABELS TMMS_ClR2 ‘Clarity recod (2 cat)’.
EXECUTE.
***(DIMENSION 2) EMOTIONAL CLARITY (UNDERSTANDING)***
*** (2) TMMS_Clarity. Categories: (1) Poor clarity (Men <= 25; Women: <= 23); (2) Adequate clarity (Men 26–35; Women 24–34***
***(3) Too much clarity (Men >= 36; Women >= 35)***
***We create variable TMMS_Rg --> sum of items***
DATASET ACTIVATE ConjuntoDatos1.
COMPUTE TMMS_Rg = TMMS2417 + TMMS2418 + TMMS2419 + TMMS2420 + TMMS2421 + TMMS2422 + TMMS2423 + TMMS2424.
VARIABLE LABELS TMMS_Rg ‘TMMS_Regulation_Sum’.
EXECUTE.
***We create variable TMMS_RgR with indicated categories***
***(1) Little regulation MEN: SEX = 1 & TMMS_Rg< = 23***
IF (SEX = 1 & TMMS_Rg <= 23) TMMS_RgR = 1.
VARIABLE LABELS TMMS_RgR ‘TMMS_Regulation_Sum’.
EXECUTE.
***(2) Adequate regulation MEN: SEX 1 & (TMMS_Rg >= 24 & TMMS_Rg <= 35)**
IF (SEX = 1 & (TMMS_Rg >= 24 & TMMS_Rg <= 35)) TMMS_RgR = 2.
VARIABLE LABELS TMMS_RgR ‘TMMS_Regulation_Sum’.
EXECUTE.
***(3) Too much regulation MEN: SEX 1 & TMMS_Rg >= 36**
IF (SEX = 1 & TMMS_Rg >= 36) TMMS_RgR = 3.
VARIABLE LABELS TMMS_RgR ‘TMMS_Regulation_Sum’.
EXECUTE.
***(1) Little regulation WOMEN: SEX 2 & TMMS_Rg <= 24***
IF (SEX = 2 & TMMS_Rg <= 23) TMMS_RgR = 1.
VARIABLE LABELS TMMS_RgR ‘TMMS_Regulation_Sum’.
EXECUTE.
***(2) Adequate clarity WOMEN: SEX 2 & (TMMS_Rg >= 24 & TMMS_Rg <= 34)**
IF (SEX = 2 & (TMMS_Rg >= 24 & TMMS_Rg <= 34)) TMMS_RgR = 2.
VARIABLE LABELS TMMS_RgR ‘TMMS_Regulation_Sum’.
EXECUTE.
***(3) Too much regulation WOMEN: SEX 2 & TMMS_Rg >= 35**
IF (SEX = 2 & TMMS_Rg >= 35) TMMS_RgR = 3.
VARIABLE LABELS TMMS_RgR ‘TMMS_Regulation_Sum’.
EXECUTE.
***We create the variable TMMS_RgR2: Recoded regulation (2 cat)***
It will have two categories: (1): Adequate clarity; (2) Clarity needs to improve***
RECODE TMMS_RgR (1 = 2) (2 = 1) (3 = 2) INTO TMMS_RgR2.
VARIABLE LABELS TMMS_RgR2 ‘Regulación recod (2 cat)’.
EXECUTE.
***We create the variable TMMS_G: General Perceived Emotional Intelligence**
***Two categories: (1) Adequate Emotional Intelligence: Adequate Attention & Adequate Clarity & Adequate Regulation***
***(2) Improve Emotional Intelligence (other situations) ***
***We create variable TMMS_1: Cross stratification***
***We create variable TMMS_G = TMMS_1 without empty spaces***
***We created variable TMMS_R = TMMS_G with two categories: (1) Adequate Emotional Intelligence: Stratum 111 and, (2) Improve Emotional Intelligence: rest strata***
COMPUTE TMMS_1 = CONCAT (TMMS_AtR2, TMMS_ClR2, TMMS_RgR2).
VARIABLE LABELS TMMS_1 ‘TMMS_1’.
EXECUTE.
STRING TMMS_G (A24).
COMPUTE TMMS_G = REPLACE (TMMS_1, “ “,”“).
VARIABLE LABELS TMMS_G ‘TMMS_1’.
EXECUTE.
RECODE TMMS_G (‘111’ = 1) (ELSE = 2) INTO TMMS_GR.
VARIABLE LABELS TMMS_GR ‘TMMS_Gener_Rec’.
EXECUTE.
References
- Rueda, P.; Pérez-Romero, N.; Cerezo, M.V.; Fernández-Berrocal, P. The role of Emotional Intelligence in Adolescent Bullying: A Systematic Review. Psicol. Educ. 2022, 28, 53–59. [Google Scholar] [CrossRef]
- Martínez-Monteagudo, M.C.; Delgado, B.; García-Fernández, J.M.; Rubio, E. Cyberbullying, Aggressiveness, and Emotional Intelligence in Adolescence. Int. J. Environ. Res. Public Health 2019, 16, 5079. [Google Scholar] [CrossRef] [PubMed]
- Calmaestra, J.; Rodríguez-Hidalgo, A.J.; Mero-Delgado, O.; Solera, E. Cyberbullying in Adolescents from Ecuador and Spain: Prevalence and Differences in Gender, School Year and Ethnic-Cultural Background. Sustainability 2020, 12, 4597. [Google Scholar] [CrossRef]
- Alvarez-García, D.; Dobarro, A.; Núñez, J.C. Validez y fiabilidad del Cuestionario de cibervictimización en estudiantes de Secundaria. Aula Abierta 2015, 43, 32–38. [Google Scholar] [CrossRef]
- Nixon, C.L. Current perspectives: The impact of cyberbullying on adolescent health. Adolesc. Health Med. Ther. 2022, 5, 143–158. [Google Scholar] [CrossRef]
- Pérez-Gómez, M.A.; Echazarreta-Soler, C.; Audebert, M.; Sánchez-Miret, C. El ciberacoso como elemento articulador de las nuevas violencias digitales: Métodos y contextos. Commun. Pap. 2020, 9, 43–58. [Google Scholar] [CrossRef]
- Wiertsema, M.; Vrijen, C.; Van-der-Ploeg, R.; Sentse, M.; Kretschmer, T. Bullying perpetration and social status in the peer group: A meta-analysis. J. Adolesc. 2023, 95, 34–55. [Google Scholar] [CrossRef]
- Perren, S.; Corcoran, L.; Cowie, H.; Dehue, F.; García, D.J.; Mc Guckin, C.; Sevcikova, A.; Tsatsou, P.; Völlink, T. Tackling Cyberbullying: Review of Empirical Evidence Regarding Successful Responses by Students, Parents, and Schools. Int. J. Confl. Violence 2012, 6, 283–293. [Google Scholar] [CrossRef]
- Cañas, E.; Estévez, E.; Martínez-Monteagudo, M.C.; Delgado, B. Emotional adjustment in victims and perpetrators of cyberbullying and traditional bullying. Soc. Psychol. Educ. 2020, 23, 917–942. [Google Scholar] [CrossRef]
- Angoff, H.D.; Barnhart, W.R. Bullying and Cyberbullying among LGBQ and Heterosexual Youth from an Intersectional Perspective: Findings from the 2017 National Youth Risk Behavior Survey. J. Sch. Violence 2021, 20, 274–286. [Google Scholar] [CrossRef]
- Garaigordobil, M.; Larrain, E. Bullying and cyberbullying in LGBT adolescents: Prevalence and effects on mental health. Comun. 2020, 62, 79–90. [Google Scholar] [CrossRef]
- Patchin, J.W.; Hinduja, S. Cyberbullying Among Tweens in the United States: Prevalence, Impact, and Helping Behaviors. J. Early Adolesc. 2021, 42, 027243162110367. [Google Scholar] [CrossRef]
- Lei, H.; Mao, W.; Cheong, C.M.; Wen, Y.; Gui, Y.; Cai, Z. The relationship between self-esteem and cyberbullying: A meta-analysis of children and youth students. Curr. Psychol. 2020, 39, 830–842. [Google Scholar] [CrossRef]
- Núñez, A.; Álvarez-García, D.; Pérez-Fuentes, M.C. Anxiety and self-esteem in cyber-victimization profiles of adolescents. Comunicar 2021, 67, 43–54. [Google Scholar] [CrossRef]
- Zhu, C.; Huang, S.; Evans, R.; Zhang, W. Cyberbullying Among Adolescents and Children: A Comprehensive Review of the Global Situation, Risk Factors, and Preventive Measures. Front. Public Health 2021, 9, 634909. [Google Scholar] [CrossRef]
- Martín-Criado, J.M.; Casas, J.A.; Ortega-Ruíz, R.; Del-Rey, R. Parental supervision and victims of cyberbullying: Influence of the use of social networks and online extimacy. Rev. Psicodidáctica 2021, 26, 161–168. [Google Scholar] [CrossRef]
- Martínez-Martínez, A.M.; Roith, C.; Aguilar-Parra, J.M.; Manzano-León, A.; Rodríguez-Ferrer, J.M.; López-Liria, R. Relationship between Emotional Intelligence, Victimization, and Academic Achievement in High School Students. Soc. Sci. 2022, 11, 247. [Google Scholar] [CrossRef]
- Wright MF& Wachs, S. The buffering effect of parent social support in the longitudinal associations between cyber polyvictimization and academic outcomes. Soc. Psychol. Educ. 2021, 24, 1145–1161. [Google Scholar] [CrossRef]
- Carmona-Rojas, M.; Ortega-Ruíz, R.; Romera-Félix, E.M. Bullying and cyberbullying, what do they have in common and what not? A latent class analysis. Analls Psychol. 2023, 39, 435–445. [Google Scholar] [CrossRef]
- Ortega, R.; Elipe, P.; Mora-Merchán, J.A.; Genta, M.L.; Brighi, A.; Guarini, A.; Smith, P.K.; Thopson, F.; Tippett, N. The Emotional Impact of Bullying and Ciberbullying on Victims: A European Cross-National Study. Aggress. Behav. 2012, 38, 342–356. [Google Scholar] [CrossRef]
- Quintana-Orts, C.; Rey, L.; Chamizo-Nieto, M.T.; Worthington, E.L. A Serial Mediation Model of the Relationship between Cybervictimization and Cyberaggression: The Role of Stress and Unforgiveness Motivations. Int. J. Environ. Res. Public Health 2020, 17, 7966. [Google Scholar] [CrossRef] [PubMed]
- Graham, R.; Wood, F.R. Associations between cyberbullying victimization and deviant health risk behaviors. Soc. Sci. J. 2019, 56, 183–188. [Google Scholar] [CrossRef]
- Micklewright, D.; Parry, D.; Robinson, T.; Deacon, G.; Renfree, A.; St Clair Gibson, A.; Matthews, W.J. Risk perception influences athletic pacing strategy. Med. Sci. Sports Exerc. 2015, 47, 1026–1037. [Google Scholar] [CrossRef] [PubMed]
- Quintana-Orts, C.; Rey, L.; Mérida-López, S.; Extremera, N. What bridges the gap between emotional intelligence and suicide risk in victims of bullying? A moderated mediation study. J. Affect. Disord. 2019, 245, 798–805. [Google Scholar] [CrossRef]
- García, L.; Quintana-Orts, C.; Rey, L. Cibervictimización y satisfacción vital en adolescentes: La inteligencia emocional como variable mediadora. Rev. Psicol. Clín. Niños Adolesc. 2020, 7, 38–45. [Google Scholar] [CrossRef]
- Martínez-Martínez, A.M.; López-Liria, R.; Aguilar-Parra, J.M.; Trigueros, R.; Morales-Gazquez, M.J.; Rocamora-Pérez, P. Relationship between Emotional Intelligence, Cybervictimization, and Academic Performance in Secondary School Students. Int. J. Environ. Res. Public Health 2020, 17, 7717. [Google Scholar] [CrossRef]
- Menabò, L.; Skrzypiec, G.; Slee, P.; Guarini, A. Victimization and cybervictimization: The role of school factors. J. Adolesc. 2024, 96, 598–611. [Google Scholar] [CrossRef]
- Extremera, N.; Fernández-Berrocal, P. Emotional Intelligence as predictor of mental, social, and physical health in university students. Span. J. Psychol. 2006, 9, 45–51. [Google Scholar] [CrossRef]
- Fernández-Berrocal, P.; Extremera, N.; Ramos, N. Validity and reliability of the Spanish modified version of the Trait Meta-Mood Scale. Psychol. Rep. 2004, 94, 751–755. [Google Scholar] [CrossRef]
- González, R.; Custodio, J.B.; Abal, F.J.P. Psychometric properties of the Trait Meta-Mood Scale-24 in Argentinian university students. Psicogente 2020, 23, 1–26. [Google Scholar] [CrossRef]
- Salovey, P.; Mayer, J.D. Emotional Intelligence. Imagin. Cogn. Personal. 1990, 9, 185–211. [Google Scholar] [CrossRef]
- Mestre, J.M.; Guil, R.; Lopes, P.N.; Salovey, P.; Gil-Olarte, P. Emotional Intelligence and social and academic adaptation to school. Psicothema 2006, 18, 112–117. [Google Scholar] [PubMed]
- Taramuel-Villacreces, J.A.; Zapata-Achi, V.H. Aplicación del test TMMS-24 para el análisis y descripción de la Inteligencia Emocional considerando la influencia del sexo. Rev. Publicando 2017, 4, 162–181. [Google Scholar]
- Guerra-Bustamante, J.; Yuste-Tosina, R.; López-Ramos, V.M.; Mendo-Lázaro, S. The Modelling Effect of Emotional Competence on Cyberbullying Profiles. Ann. Psychol. 2021, 37, 202–209. [Google Scholar] [CrossRef]
- Grommisch, G.; Hinton, J.D.X.; Hollenstein, T.; Koval, P.; Gleeson, J.; Kuppens, P.; Lischetzke, T. Modeling Individual Differences in Emotion Regulation Repertoire in Daily Life With Multilevel Latent Profile Analysis. Emotion 2020, 20, 1462–1474. [Google Scholar] [CrossRef] [PubMed]
- Lozano-Blasco, R.; Quilez-Robres, A.; Latorre-Cosculluela, C. Sex, age and cyber-victimization: A meta-analysis. Comput. Hum. Behav. 2023, 139, 107491. [Google Scholar] [CrossRef]
- Ojeda, M.; Espino, E.; Elipe, P.; Del-Rey, R. Even if they don’t say it to you, is hurts too: Internalized homonegativity in LGTBQ+ cyberbullying among adolescents. Comunicar 2023, 75, 21–34. [Google Scholar] [CrossRef]
- Evans, C.R.; Willians, D.R.; Onnela, J.P.; Subramanian, S.V. A multilevel approach to modeling health inequalities at the intersection of multiple social identities. Soc. Sci. Med. 2018, 203, 64–73. [Google Scholar] [CrossRef]
- Giuffrè, M.; Shung, D.L. Harnessing the power of synthetic data in healthcare: Innovation, application, and privacy. npj Digit. Med. 2023, 6, 186. [Google Scholar] [CrossRef]
- Botella-Ausina, J.; Sánchez-Meca, J. Meta-Análisis en Ciencias Sociales y de la Salud; Síntesis: Madrid, Spain, 2015. [Google Scholar]
- Alvarez-Garcia, D.; Nuñez-Perez, J.C.; Dobarro-Gonzalez, A.; Rodriguez-Perez, C. Factores de riesgo asociados a la cibervictimización en la adolescencia. Int. J. Clin. Health Psychol. 2015, 15, 226–235. [Google Scholar]
- Magaz, A.M.; Chorot, P.; Santed, M.A.; Valiente, R.M.; Sandín, B. Evaluación del bullying como victimización: Estructura, fiabilidad y validez del Cuestionario de Acoso entre Iguales (CAI). Rev. Psicopatol. Psicol. Clín. 2016, 21, 77–95. [Google Scholar] [CrossRef]
- Enders, C.K.; Tofighi, D. Centering Predictor Variables in Cross-Sectional Multileve Models: A New Look at and Old Issue. Psychol. Methods 2007, 12, 121–138. [Google Scholar] [CrossRef]
- Peugh, J.L.; Enders, C.K. Using the SPSS Mixed Procedure to Fit Cross-Sectional and Longitudinal Multilevel Models. Educ. Psychol. Meas. 2005, 65, 717–741. [Google Scholar] [CrossRef]
- Austin, P.C.; Merlo, J. Intermediate and advanced topics in multilevel logistic regression analysis. Stat. Med. 2017, 36, 3257–3277. [Google Scholar] [CrossRef] [PubMed]
- Martínez-Garrido, C.; Murillo, F.J. Programas para la realización de Modelos Multinivel. Un análisis comparativo entre MLwiN, HLM, SPSS y Stata. REUNIDO 2014, 14, 1–24. [Google Scholar] [CrossRef]
- Arango-Botero, D.; Hernández-Barajas, F.; Valencia-Arias, A. Misspecification in Generalized Linear Mixed Models and Its Impact on the Statistical Wald Test. Appl. Sci. 2023, 13, 977. [Google Scholar] [CrossRef]
- Huang, S.; Valdivia, D.S. Wald χ2 Test for Differential Item Functioning Detection with Polytomous Items in Multilevel Data. Educ. Psychol. Meas. 2023, 84, 530–548. [Google Scholar] [CrossRef]
- Murthen, B.O.; Satorra, A. Complex Sample Data in Structural Equation Modeling. Sociol. Methodol. 1995, 25, 267–316. [Google Scholar] [CrossRef]
- Peugh, J.L. A practical guide to multilevel modelling. J. Sch. Psychol. 2010, 48, 85–112. [Google Scholar] [CrossRef]
- Kish, L. Survey Sampling; John Wiley & Sons: New York, NY, USA, 1965. [Google Scholar] [CrossRef]
- Lai, M.H.C.; Kwok, O. Examining the Rule of Thumb of Not Using Multilevel Modeling: The “Design Effect Smaller Than Two” Rule. J. Exp. Educ. 2015, 83, 423–438. [Google Scholar] [CrossRef]
- Shieh, Y.-Y.; Fouladi, R.T. The Effect of Multicollinearity on Multilevel Modeling Parameter Estimates and Standard Errors. Educ. Psychol. Meas. 2003, 63, 951–985. [Google Scholar] [CrossRef]
- Aggarwal, C.C. Neural Networks and Deep Learning; Springer: Cham, Switzerland, 2018. [Google Scholar] [CrossRef]
- Pardo, A.; Ruiz, M.A.; San-Martín, R. Cómo ajustar e interpretar modelos multinivel con SPSS. Psicothema 2007, 19, 308–321. [Google Scholar] [PubMed]
- Pardo-Merino, A.; Ruiz-Diaz, M.A. Análisis de Datos en Ciencias Sociales y de la Salud III; Síntesis: Madrid, Spain, 2012. [Google Scholar]
- Alvarez-Cáceres, R. Estadística Multivariante y No Paramétrica con SPSS: Aplicación a las Ciencias de la Salud; Diaz de Santos: Madrid, Spain, 1995. [Google Scholar]
- Constante-Amores, A.; Florenciano-Martínez, E.; Navarro-Asensio, E.; Fernández-Mellizo, M. Factores asociados al abandono universitario. Educ. XX1 2021, 24, 17–44. [Google Scholar] [CrossRef]
- Field, A. Discovering Statistics Using SPSS for Window: Advanced Techniques for the Beginner; Sage: New York, NY, USA, 2000. [Google Scholar]
- Pardo, A.; San-Martín, R. Análisis de Datos en Ciencias Sociales y de la Salud II; Síntesis: Madrid, Spain, 2010. [Google Scholar]
- Álvarez-García, D.; Núñez, A.; Pérez-Fuentes, M.C.; Vallejo, G. Efecto del grupo-clase sobre la cibervictimización en estudiantes de Secundaria: Un análisis multinivel. Rev. Educ. 2022, 397, 153–178. [Google Scholar] [CrossRef]
- Elipe, P.; Muñoz, M.O.; Del Rey, R. Homophobic Bullying and Cyberbullying: Study of a Silenced Problem. J. Homosex. 2018, 65, 672–686. [Google Scholar] [CrossRef]
- Romera, E.M.; Luque, R.; Ortega-Ruiz, R.; Gómez-Ortiz, O.; Camacho, A. Positive Peer Perception, Social Anxiety and Classroom Social Adjustment as Risk Factors in Peer Victimization: A Multilevel Study. Psicothema 2022, 34, 110–116. [Google Scholar] [CrossRef]
- Arrivillaga, C.; Rey, L.; Extremera, N. Perfil emocional de adolescentes en riesgo de un uso problemático de internet. Rev. Psicol. Clín. Niños Adolesc. 2021, 8, 47–53. [Google Scholar] [CrossRef]
- Gámez-Guadix, M.; Incera, D. Homophobia is online: Sexual victimization and risk on the internet and mental health among bisexual, homosexual, pansexual, asexual, and queer adolescents. Comput. Hum. Behav. 2021, 119, 106728. [Google Scholar] [CrossRef]
- Liu, M.; Ren, S. Moderating Effect of Emotional Intelligence on the Relationship between Rumination and Anxiety. Curr. Psychol. 2018, 37, 272–279. [Google Scholar] [CrossRef]


Disclaimer/Publisher’s Note: The statements, opinions and data contained in all publications are solely those of the individual author(s) and contributor(s) and not of MDPI and/or the editor(s). MDPI and/or the editor(s) disclaim responsibility for any injury to people or property resulting from any ideas, methods, instructions or products referred to in the content. |
© 2024 by the author. Licensee MDPI, Basel, Switzerland. This article is an open access article distributed under the terms and conditions of the Creative Commons Attribution (CC BY) license (https://creativecommons.org/licenses/by/4.0/).