Abstract
Contemporary education systems face the challenge of fostering academic achievement while also keeping students engaged and maintaining their well-being. Previous research has shown that student well-being, school engagement, and academic achievement are related. However, both student well-being and school engagement tend to decline over the school years, particularly after the transition to secondary school. To investigate how the three constructs are reciprocally related over time, the present study employed a longitudinal random intercept cross-lagged panel model using data from N = 757 Swiss students over three years of lower secondary school. The results revealed reciprocal between-person effects between student well-being, school engagement, and academic achievement across measurement points. Unexpected within-person effects between the measurement points were found. The findings suggest that students with higher well-being are also more engaged and achieve higher grades, but the associations between the constructs may be influenced by third variables.
1. Introduction
In today’s educational landscape and regarding future educational goals, it is crucial to broaden our perspective on educational success. While academic achievement has long been considered the primary indicator of school success, there is a growing recognition that a more holistic approach to education is needed (OECD, 2023). This approach complements students’ cognitive development with their socio-emotional and motivational development, with students’ well-being and school engagement as essential factors for sustainable learning and personal development (Upadyaya & Salmela-Aro, 2021). Previous studies illustrated significant associations between student well-being, school engagement, and academic achievement (Kwok & Fang, 2021; Wong & Liem, 2022; Morinaj & Hascher, 2022). A recent meta-analysis confirmed large average correlations of school engagement with both well-being and academic achievement (Wong et al., 2024). Causal relationships have been found between all three constructs, with positive effects of student well-being on school engagement, and from school engagement to academic achievement (Kang & Wu, 2022), as well as from school engagement to well-being indicators (Raniti et al., 2022). These associations are of particular interest in the secondary school context, because both student well-being (Virtanen et al., 2019) and school engagement (Widlund et al., 2021) tend to decline after the transition to secondary school. Additionally, the role of students’ socioeconomic status (SES) in these relationships has to be considered, since previous research has shown its connection with student well-being (Alivernini et al., 2020), school engagement (Archambault et al., 2022), and academic achievement (OECD, 2023). Although there is evidence for the relations between student well-being, school engagement, and academic achievement, the body of research on reciprocal relationships between the three variables is meager and rarely covers the whole span of lower secondary school. Also, comparison of results is limited since many studies did not use school-specific measures of well-being.
To address this research gap, the present study aimed at investigating the longitudinal relationships between student well-being, school engagement, and academic achievement in lower secondary school using multidimensional, context-specific measures for the constructs, and an advanced methodological approach, namely Random Intercept Cross-lagged Panel Modeling (RI-CLPM). By adopting a multidimensional approach for student well-being and school engagement, the present study also helps to identify the key dimensions of student well-being and school engagement related to each other and to academic achievement. Using longitudinal data further allows us to investigate the direction of effects over time. Our results can inform researchers and practitioners by guiding intervention design, enhancing school practices, and providing schools with the knowledge necessary to focus on fostering both students’ well-being and academic achievement, using evidence-based strategies that will help all students thrive.
1.1. Student Well-Being
In recent years, there has been a tremendous increase in the body of literature documenting the important role of well-being in the school context. As scientific interest in well-being increased, so did the ways in which it was defined and conceptualized (Hossain et al., 2023). While there is no consensus on the definition of well-being, most scholars agree on the multidimensional nature of the construct and the coexistence of positive and negative aspects. One of the earlier approaches to a multidimensional understanding of well-being came from Diener (1984), who coined the term subjective well-being. According to Diener, subjective well-being consists of a cognitive component that includes life satisfaction and an affective component that includes positive and negative emotions (Diener & Sim, 2024). While this definition takes into account the multidimensional nature of the construct and the coexistence of positive and negative aspects, it focuses mainly on general evaluations of one’s life. This model was later complemented by Ryff’s (1989) psychological well-being framework, which contains six dimensions: self-acceptance, purpose in life, environmental mastery, positive relationships, autonomy, and personal growth. This framework does not consider emotional states, but rather the human need for meaning, accomplishment, and social relatedness, as foundations for well-being. Combining both lines of research, Grob et al. (1996) then developed a framework containing both cognitive and affective evaluations, as well as aspects related to human strivings. They further included the physical domain into their framework and noted that well-being is not just the presence of positive or the absence of negative aspects, but rather a result of the balance between both. Thus, they identified six well-being dimensions: enjoyment, positive attitudes, self-concept, problems, physical complaints, and worries.
Although this model accounts for the multidimensional nature of the construct, it does not consider the specificity of the school context. However, an individual’s well-being may vary relative to different areas of life. For instance, an adolescent’s general life satisfaction may not necessarily reflect their satisfaction with school (Maechel et al., 2023). Inspired by Grob’s conceptualization of general well-being, Hascher (2004) developed a multidimensional model of student well-being that defines it as the predominance of positive emotions and cognitions over negative emotions and cognitions in relation to school, people in school, and the school context. This model includes six dimensions, whereby three dimensions consider positive aspects of school life, and three dimensions consider its negative aspects: (1) enjoyment in school, (2) positive attitudes toward school, (3) positive academic self-concept, (4) worries in school, (5) physical complaints in school, and (6) social problems in school.
1.2. School Engagement
School engagement, akin to student well-being, is considered a multidimensional construct and characterized by multiple and ambiguous definitions (Salmela-Aro et al., 2021). Scholars exhibit divergent perspectives on the dimensions that constitute school engagement, as well as on the way these dimensions should be conceptualized (Reeve et al., 2025). Fredricks et al. (2004) posit that this conceptual ambiguity stems from the fact that various sub-constructs such as interest or effort fall under the umbrella of school engagement. Studies differ in their emphasis on sub-constructs, depending on the research focus. Fredricks et al. (2004) argue that a school engagement measure intended to predict broader outcomes, such as academic achievement, should encompass a range of these subconstructs, albeit at a superficial level, instead of focusing only on a certain aspect. Consequently, they propose a conceptualization that partitions school engagement into three components: (1) cognitive, (2) behavioral, and (3) emotional engagement (Fredricks, 2022). According to this conceptual framework, cognitive engagement signifies commitment and effort directed towards school-related matters, including the willingness to invest additional time and effort in mastering complex academic tasks and acquiring challenging skills. Behavioral engagement encompasses participation in academic and social activities associated with the school curriculum. Emotional engagement includes affective reactions towards teachers, classmates, and school-related events. This conceptualization of school engagement integrates behavior, cognition, and affect, thereby forming a “metaconstruct“ (Fredricks et al., 2004, p. 60). In the present study, we adhere to this multicomponent conceptualization as it covers the multiple facets of school engagement and because it facilitates our investigation of differential associations between school engagement components, student well-being dimensions, and academic achievement.
1.3. The Relationship Between Student Well-Being, School Engagement, and Academic Achievement
Student well-being seems to positively influence academic achievement (Kiuru et al., 2020). Simultaneously, student well-being can be regarded as an outcome of successful learning experiences and academic performance (Kleinkorres et al., 2020). Thus, the relationship between student well-being and academic achievement is most likely reciprocal (Kaya & Erdem, 2021). However, direct links between student well-being and academic achievement are rarely reported (Amholt et al., 2020), suggesting an influence of further variables, one of them being school engagement. Increases in school engagement have been linked to improvements in academic outcomes (Lei et al., 2018) and reductions in school absenteeism and drop-out (Archambault et al., 2022). Conversely, academic success is considered a source of school engagement, demonstrating a reciprocal relationship between the two constructs as well (Widlund et al., 2023). While research on the simultaneous relationships between all three constructs is still scarce, previous studies suggest a cycle of mutual reinforcement over time (Appleton et al., 2008; Kwok & Fang, 2021; Wong et al., 2024). A rationale for this cycle can be drawn from two theoretical models: broaden-and-build theory (Fredrickson, 2001) and self-determination theory (SDT; Ryan & Deci, 2000).
The broaden-and-build theory posits that positive emotions, a key component of well-being, broaden an individual’s thought-action repertoire and allow them to build lasting resources (Fredrickson, 2001). Positive emotions like enjoyment or contentment expand attention, cognition, and action, leading to more flexible and creative thinking and more engaged learning. By building resources, such as improved learning skills, positive emotions enhance an individual’s capacity for future success, including academic achievement. The theory also suggests that positive emotions can trigger an upward spiral towards enhanced well-being, because the acquired strategies and broadened mindset enable adaptive coping strategies (Fredrickson, 2013). Negative emotions, conversely, narrow one’s thought-action repertoire, impeding learning processes and diminishing academic achievement (Gumora & Arsenio, 2002).
SDT focuses on the basic psychological needs of autonomy, competence, and relatedness, which are essential for intrinsic motivation, personality growth, social development, and well-being (Deci & Ryan, 2008). Well-being can be seen as an outcome of basic need satisfaction (Niemiec et al., 2006), and basic need satisfaction serves as a resource for motivation, which can enhance school engagement (Skinner et al., 2008) and subsequent academic achievement (Taylor et al., 2014). Additionally, academic achievement may increase well-being by fulfilling the need for competence (Bücker et al., 2018), creating an adaptive cycle. Conversely, when the basic needs are not met, lower well-being (Vansteenkiste & Ryan, 2013), disengagement (Earl et al., 2023), and lower academic achievement (Wang et al., 2019) may result. Thus, both the broaden-and-build theory and self-determination theory (SDT) highlight critical pathways linking student well-being, school engagement, and academic achievement. While the broaden-and-build theory emphasizes the role of positive emotions in expanding cognitive and behavioral capacities to foster academic success, SDT underscores the satisfaction of basic psychological needs as foundational for well-being and engagement. Together, these theories suggest that student well-being and school engagement interact dynamically to influence academic achievement, which in turn affects future well-being and school engagement.
In summary, theory and research suggest reciprocal associations between student well-being, school engagement, and academic achievement. However, the roles of specific student well-being dimensions and school engagement components in these associations are unclear. No prior study has simultaneously investigated the longitudinal associations between all six student well-being dimensions and all three school engagement components to assess their dependence of and impact on academic achievement. Given the multi-dimensionality of these constructs, research on the possible variety of associations among the dimensions is necessary to understand these complex relations.
2. The Present Study
Research shows that secondary education is a vulnerable phase of student development characterized by increasing achievement pressure and a decline in student well-being (Virtanen et al., 2019) and school engagement (Widlund et al., 2021). Given the lack of studies investigating the longitudinal relationships between well-being, school engagement, and academic achievement of secondary school students, the aim of the present study was to investigate the longitudinal relationships between student well-being, school engagement, and academic achievement in lower secondary school, using a three-wave RI-CLPM. Based on prior research, we posed the following hypotheses:
H1.
The positive student well-being dimensions are positively associated with school engagement and academic achievement across measurement points.
H2.
The negative student well-being dimensions are negatively associated with school engagement and academic achievement across measurement points.
H3.
School engagement is positively associated with academic achievement across measurement points.
H4a.
The positive student well-being dimensions at one measurement point positively predict school engagement and academic achievement at the next measurement point.
H4b.
School engagement at one measurement point positively predicts the positive student well-being dimensions and academic achievement at the next measurement point.
H4c.
Academic achievement at one measurement point positively predicts the positive student well-being dimensions and school engagement at the next measurement point.
H5a.
The negative student well-being dimensions at one measurement point negatively predict school engagement and academic achievement at the next measurement point.
H5b.
School engagement at one measurement point negatively predicts the negative student well-being dimensions at the next measurement point.
H5c.
Academic achievement at one measurement point negatively predicts the negative student well-being dimensions at the next measurement point.
3. Material and Methods
3.1. Participants and Procedure
The present study has a longitudinal, quantitative design. The data were collected using self-report surveys on three measurement points. The study participants were Swiss secondary school students who took part in the three-wave longitudinal research project “Well-being in School in Switzerland” (WESIR, 2021–2025). The Swiss National Science Foundation (SNSF) and the Ethics Review Panel of the University of Bern have approved this study after careful examination of the entire study design and instruments in the student questionnaire. Prior to the first survey wave, written consent for students’ participation in this study was obtained from their parents. Students were informed that their participation was voluntary and were assured that the information they provided is confidential. Participants filled out an online survey during regular school lessons using devices (Laptops or Tablets) provided by the schools. Both a teacher and a member of the research team was present in the classroom during the survey. The survey was conducted annually between January and April 2022–2024 in Grade 7 (t1), Grade 8 (t2), and Grade 9 (t3). Forty-six classes from 17 schools participated at t1, with a total N of 756 students. The principal of one school decided to discontinue participation after the first survey wave, leading to the drop-out of three classes. Thus, 43 classes participated at t2, with a total N of 720 students. After the second survey wave, seven teachers withdrew their classes from participation. Thus, 36 classes with a total N of 585 students participated at t3. Although some students changed classes between survey waves, these were a minority compared to the total sample (13 changes at t2, 28 changes at t3). New students also entered the classes between survey waves (33 new students at t2, 44 new students at t3). An overview of the sample characteristics for each survey wave is presented in Table 1. R. J. A. Little’s (1988) Missing Completely at Random (MCAR) test for the survey variables was found nonsignificant [χ2 (570) = 568.68, p = 0.508], suggesting that there is no relationship between missingness and the observed data. We therefore kept the total sample of N = 756 students for analysis. Missing values were handled using Full Information Maximum Likelihood (FIML).

Table 1.
Sample characteristics.
3.2. Measures
3.2.1. Student Well-Being
Student Well-Being was measured with the 19-item Student Well-Being Questionnaire (SWBQ; Hascher, 2007), which includes three positive and three negative dimensions: (1) positive attitudes toward school (PAS, 3 items; e.g., “I like to go to school”), (2) enjoyment in school (EIS, 3 items; e.g., “In the past few weeks, I experienced joy because a teacher was friendly to me”), (3) positive academic self-concept (PASC, 3 items; e.g., “I don’t have problems with meeting the school requirements”), (4) worries in school (WIS, 3 items; e.g., “In the past few weeks, I was worried about my school grades”), (5) physical complaints in school (PCS, 4 items; e.g., “In the past few weeks, I had a severe headache during class”), and (6) social problems in school (SPS, 3 items; e.g., “In the past few weeks, I had problems with my classmates”). Responses were indicted on a 6-point Likert scale ranging from 1 = never/disagree to 6 = very often/agree. The internal reliability of the SWBQ subscales as indicated by McDonald’s ω ranged from 0.71 to 0.90 across the three time points (see Table 2).
Table 2.
Descriptive statistics for dimensions of Student Well-being, School engagement, and students’ GPA at three time points.
3.2.2. School Engagement
School engagement was assessed using the 19-item School Engagement Scale (Fredricks et al., 2005), comprising three subscales: (1) cognitive engagement, (ENGC, 8 items; e.g., “I check my schoolwork for mistakes”), (2) behavioral engagement (ENGB, 5 items; e.g., “I pay attention in class”), (3) emotional engagement (ENGE, 6 items; e.g., “I feel excited by my work at school”). Responses were indicated on a 5-point Likert scale ranging from 1 = never to 5 = all of the time. The internal reliability of the subscales as indicated by McDonald’s ω ranged from 0.79 to 0.86 (see Table 2).
3.2.3. Academic Achievement
Students’ academic achievement was measured using grade point average (GPA), which was computed based on students’ grades in mathematics, German (school language), French (first foreign language), English (second foreign language), nature and technology, and history received from teachers at the end of each school year. The school grades varied from 1 (the lowest achievement level) to 6 (the highest achievement level), indicating that a higher score represents a better grade. Likely due to the selective school system, not all schools provided the grade reports for the eighth and ninth grade, resulting in an amount of missing data of 41% for t2 and 51% for t3.
3.2.4. Socioeconomic Status
Socioeconomic status was operationalized as economic, social, and cultural status (ESCS) using the PISA 2022 framework (OECD, 2023). ESCS is an index of highest parental occupation, highest parental education, and various household possessions such as the number of books at home.
3.3. Data Analysis
Preliminary to the main analysis, we checked all student well-being dimensions and school engagement components for measurement invariance in order to assess whether the latent variables were stable over time and could thus be compared over the three measurement points (T. D. Little, 2013). We followed a sequential procedure with increasing restrictiveness. First, we assessed configural invariance using a model where all parameters were freely estimated. To assess metric invariance, we constrained the factor loadings to be equal over the three measurement points. We then assessed scalar invariance by additionally constraining the intercepts to be equal over time. We tested measurement invariance by comparing the fit indices (i.e., CFI and RMSEA) between the models. A change in ΔCFI < 0.01 and a change in ΔRMSEA < 0.015 was set as limit for acceptance of measurement invariance (Chen, 2007).
After establishing measurement invariance, we ran a measurement model containing the six latent factors of the SWBQ dimensions and three latent factors of school engagement components for all three measurement points. Model fit was evaluated based on the comparative fit index (CFI; optimal values > 0.90), root mean square error of approximation (RMSEA; optimal values < 0.08), and standardized root mean square residual (SRMR; optimal values < 0.08) (T. D. Little, 2013).
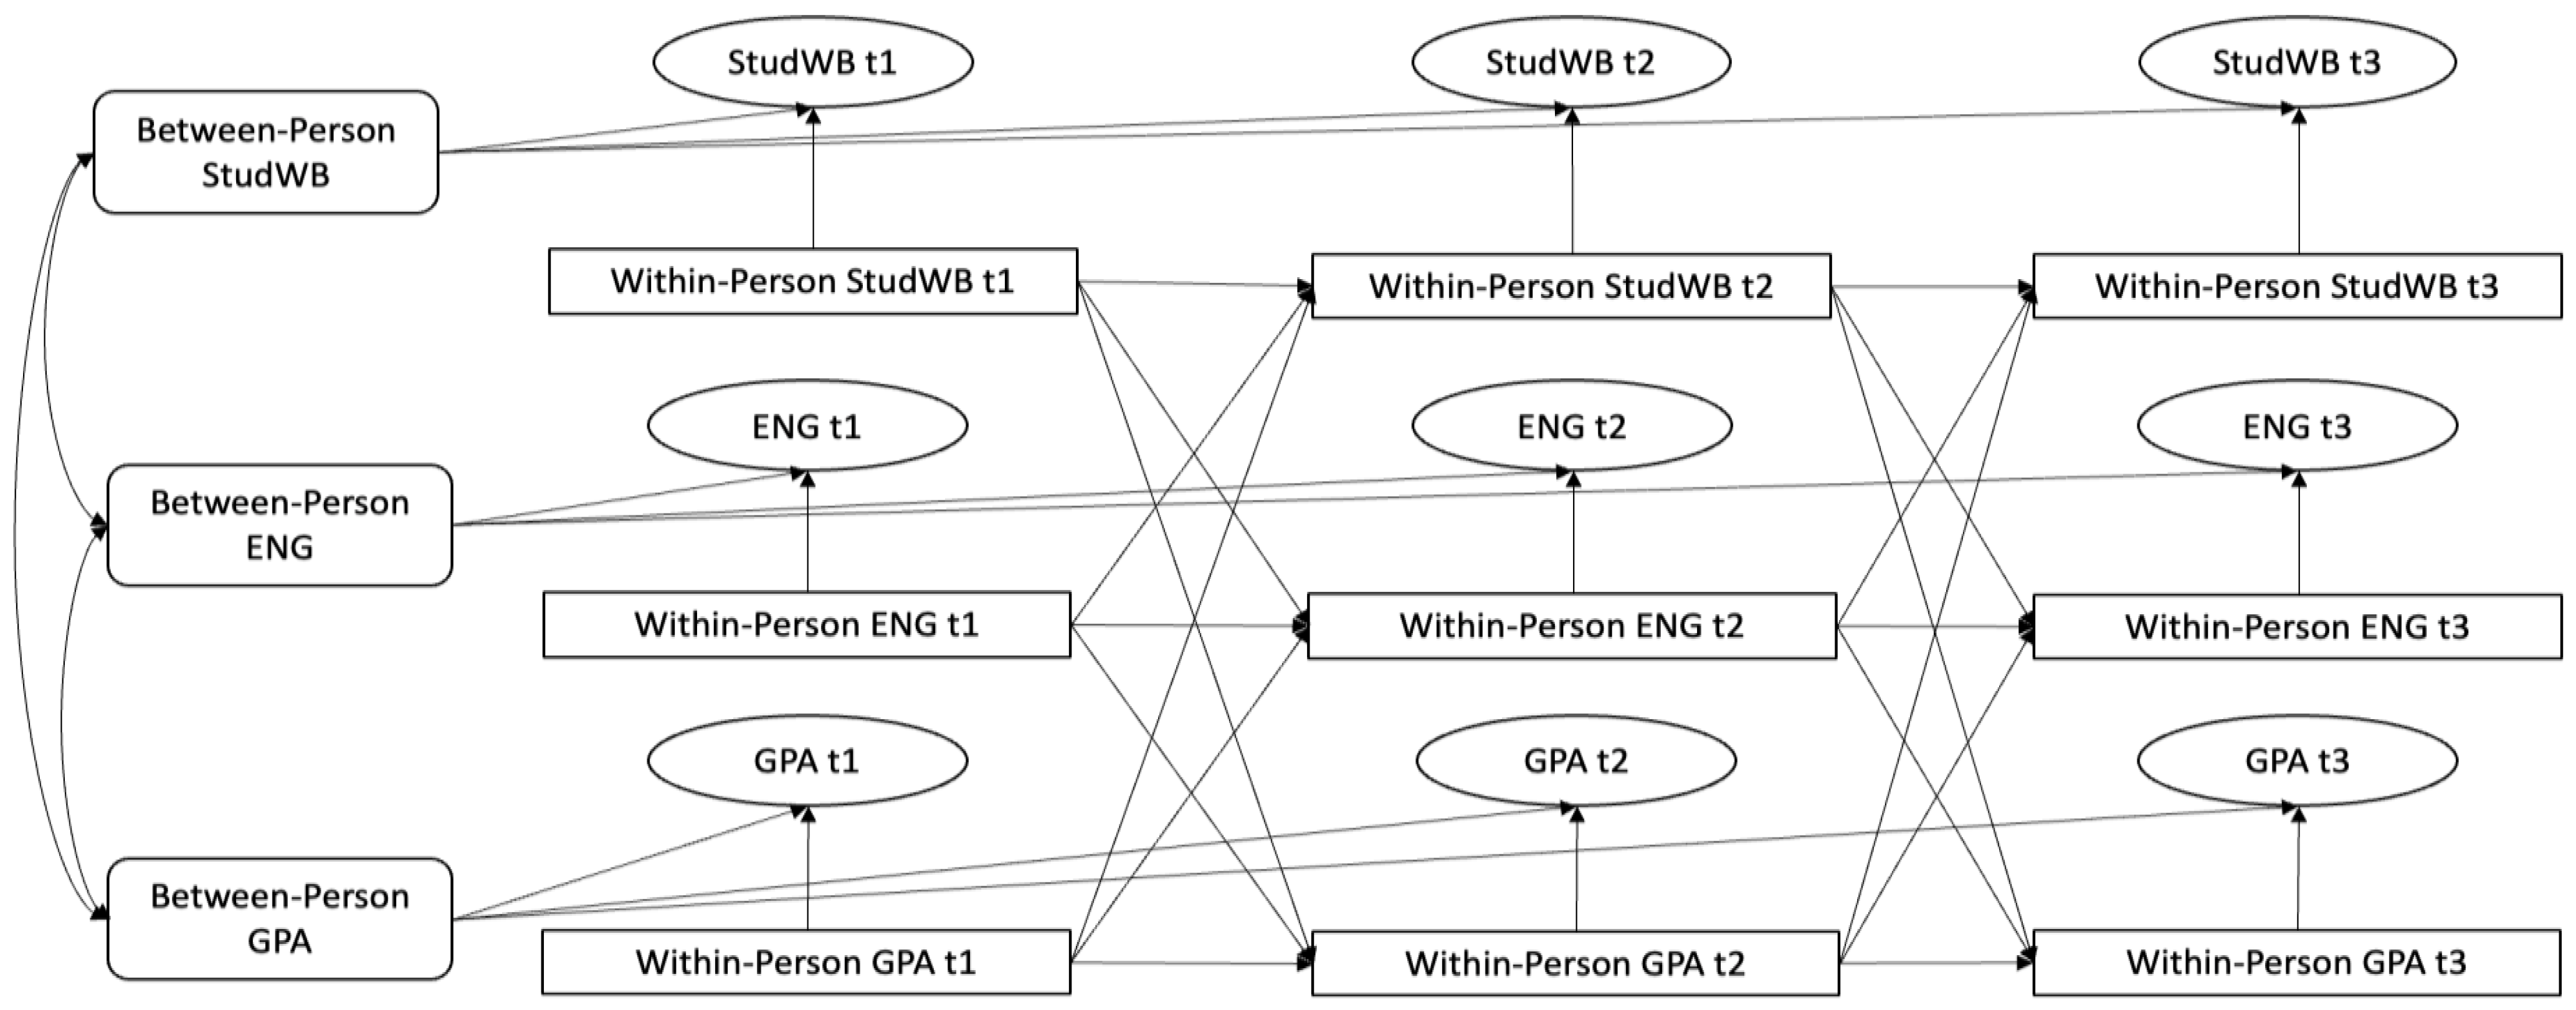
Once the measurement model was accepted, we used the best fitting factor structure for our main analysis. To analyze the longitudinal associations between student well-being dimensions, school engagement components, and students’ GPA, we applied a three-wave multiple indicator random intercept cross-lagged panel model (RI-CLPM; Mulder & Hamaker, 2021). In such a model, longitudinal data are decomposed into stable trait-like between-person differences and temporal within-person dynamics (see Figure 1). Following the modeling strategy described by Mulder and Hamaker (2021), we specified the higher-order random intercepts for each construct across all measurement points to model the proportion of the latent variables that are time-invariant (between-person effects) and included the lagged effects between the within-person centered latent variables to model their relationships over time (within-person effects). The correlations between the random intercepts reflect stable between-person relationships between student well-being, school engagement, and academic achievement. Autoregressive paths represent the within-person carry-over effects, indicating how deviations from individuals’ expected scores at one measurement point predict future deviations in the same variables. Cross-lagged paths indicate whether a deviation from a person’s expected score at one measurement point predicts a future deviation in their expected score on another variable. Again, model fit was accepted if CFI > 0.90, RMSEA < 0.08, and SRMR < 0.08.

Figure 1.
Random intercept cross-lagged panel model of the relationship between student well-being (StudWB), school engagement (ENG), and students’ grade point average (GPA) across three waves with one-year time lags. The model contains three random intercepts (between-person StudWB, between-person ENG, and between-person GPA) that reflect time-invariant trait-like between-person differences. Time-varying state-like within-person dynamics are illustrated by autoregressive paths between the latent factors of StudWB, ENG, and GPA across waves (within-person StudWB, within-person ENG, and within-person GPA) and cross-lagged paths between the three latent factors. Observed indicators to measure StudWB and ENG are omitted for simplicity.
Data preparation, descriptive statistics, and regression analyses were conducted in R 4.2.2 (R Core Team, 2020). Measurement invariance testing and RI-CLPM analyses were conducted in MPlus 8.10 (Muthén & Muthén, 1998–2017). Data were exported from R to MPlus and results back to R using the MPlusAutomation package (Hallquist & Wiley, 2018). To account for the hierarchical data structure (students within classes), we used the “type = complex” command in MPlus, which adjusts standard errors to account for the nested structure of the data. We used the class membership at t1 as clustering variable.
4. Results
Table 2 shows the descriptive statistics for all variables at all three measurement points. The intercorrelations are presented in Table A1 in the Appendix A.
At least metric invariance could be established for all student well-being dimensions and school engagement components, except for behavioral engagement (see Table 3). We therefore tested a model of partial invariance for this component by constraining the factor loadings of three items to be equal across measurement points, while freeing up the other two item loadings. This model did not yield a significantly worse fit than the configural model. Therefore, we assumed partial metric invariance for the latent behavioral engagement variable and at least metric invariance for all other latent variables in the measurement model.
Table 3.
Model fit statistics for the tests of longitudinal measurement invariance of the student well-being dimensions and school engagement components.
Next, we calculated a measurement model containing all student well-being dimensions and school engagement components. This model did not optimally fit the data (CFI = 0.89, RMSEA = 0.28, SRMR = 0.65). An inspection of the correlation matrix revealed high intercorrelations between the positive well-being dimensions and the emotional engagement component (see Table A1 in the Appendix A). Due to possible confounding effects between these variables, we also tested a model excluding the emotional engagement component. This model fit the data significantly better (CFI = 0.91, RMSEA = 0.26, SRMR = 0.61). We therefore specified the RI-CLPM without including the emotional engagement component.
This RI-CLPM had a good fit for the data (CFI = 0.91, RMSEA = 0.26, SRMR = 0.65). Significant between-person effects, autoregressive and cross-lagged paths are demonstrated in Table 4. The significant between-person associations between positive student well-being dimensions, school engagement components, and students’ GPA were moderate to strong and positive, demonstrating that students reporting more positive attitudes toward school, more enjoyment in school, and higher levels of academic self-concept across the measurement waves exhibited higher cognitive and behavioral engagement, as well as higher GPA scores. The significant between-person associations between negative student well-being dimensions, behavioral engagement, and students’ GPA were small to moderate and negative, demonstrating that students reporting more worries, physical complaints, and social problems in school exhibited lower behavioral engagement and lower GPA scores across the measurement waves. Unexpectedly, the between-person association between physical complaints in school and cognitive engagement was positive. Behavioral engagement was significantly and strongly associated with students’ GPA, while the between-person association between cognitive engagement and students’ GPA was nonsignificant. Students’ socioeconomic status was positively associated with positive academic self-concept, behavioral engagement, and GPA, and negatively associated with all three negative student well-being dimensions.
Table 4.
Standardized parameter estimates for the cross-lagged panel model of the relationship between dimensions of student well-being, school engagement and students’ GPA.
On the within-person level, GPA at t1 positively predicted GPA at t2. Positive academic self-concept at t1 negatively predicted GPA at t2, and positive academic self-concept at t2 negatively predicted cognitive engagement at t3. In other words, students with a positive academic self-concept above their average at t1 had significantly lower GPA scores at t2, while students with a positive academic self-concept above their average at t2 had significantly lower cognitive engagement at t3.
5. Discussion
The present study aimed at investigating the longitudinal relationships between student well-being, school engagement, and academic achievement over the three years of lower secondary school in Switzerland. Findings on these relationships are important because both student well-being and school engagement tend to decline during secondary education. A differential view on the mechanics between those constructs can help identify crucial buffering factors against this decline.
Our analyses showed some expected, but also surprising results. As hypothesized (H1), the positive student well-being dimensions were positively associated with school engagement components and academic achievement across measurement points.
H2 could be partially accepted as the negative student well-being dimensions were negatively associated with school engagement and academic achievement across measurement points, with one exception: physical complaints in school showed a positive relationship with cognitive engagement. This finding might be explained through several mechanisms: First, both cognitive engagement and physical complaints could be a symptom of overcommitment. While students who show an excessive commitment to school seem to be more cognitively engaged (Lin & Muenks, 2022), they are also at a greater risk of developing physical complaints because of stress (Laftman et al., 2015). A second possible explanation is that there are two qualitatively different kinds of cognitive engagement with their own origins and outcomes. Greene (2015) differentiates between deep and shallow cognitive engagement: While deep cognitive engagement is induced by mastery goal orientation and characterized by adaptive self-regulated learning strategies, shallow cognitive engagement is induced by performance goal orientation and characterized by superficial and ineffective learning strategies. It has been shown that students with a performance goal orientation experience more performance pressure (Church et al., 2001), and that both performance pressure and performance goal orientation is linked to more school-related physical complaints (Murberg & Bru, 2004; Randall et al., 2019).
H3 could also be partially accepted, as behavioral engagement was positively associated with academic achievement across measurement points. This finding is consistent with prior studies who found the strongest associations between school engagement and academic achievement in the behavioral component (for a meta-analysis see Wong et al., 2024). Conversely, the association between cognitive engagement and academic achievement was nonsignificant. This unexpected finding could also be explained by the relationship between goal orientation and cognitive engagement style: Although both deeply and shallowly engaged students experience cognitive engagement, only the former seems to be positively related to academic achievement (Greene, 2015). Since the scale we used to assess cognitive engagement does not differentiate between deep and shallow engagement forms, this assumption remains to be tested.
On the within-person level, only a few cross-lagged associations could be found and those were contrary to our expectations, leading to a rejection of H4–H6. Above-average positive academic self-concept at t1 negatively predicted to academic achievement at t2. This finding is contrary to our hypotheses and requires an explanation. Possibly, it may result from the so-called “overconfidence effect”. According to this effect, students tend to overestimate their academic performance because they do not rely on their previous achievement when predicting their future school success (Geraci et al., 2023). This overconfidence seems to be stronger for students with lower competences, while those with higher competence even tend to underestimate their abilities (“Dunning-Kruger effect”; Kruger & Dunning, 1999). This effect has been found consistently across multiple countries (Yang Hansen et al., 2024). However, it is also possible that the students in our study did base their assessment of self-concept on their previous achievement, but that this assessment was biased. Our study began after the transition from primary to secondary education when students enter a new school setting. Students’ ratings of their academic self-concept at t1 might have been especially biased because it was assessed during their first year of secondary school, months before they received their first annual grade report in this new school setting. Therefore, students probably based their estimations on their performance during primary school. This would also explain why the effect was no longer observed between t2 and t3.
Above-average positive academic self-concept at t2 negatively predicted cognitive engagement at t3, which is also not in line with our hypotheses. Again, this effect could be due to different cognitive engagement styles: it is possible that students with a higher academic self-concept are more oriented toward mastery goals and thus pursue more deep and less shallow cognitive engagement strategies. Indeed, prior studies found stronger effects of academic self-concept on mastery goal orientation compared to performance goal orientation (Pérez et al., 2012; Seaton et al., 2017). Interestingly, a study from Portugal found similar effects, in that the younger adolescents from their sample with high self-concept also expressed high cognitive engagement, while the older adolescents with high self-concept displayed lower levels of cognitive engagement (Veiga et al., 2015). The authors explain their findings with the rising importance of peer acceptance and the devaluation of school-related efforts during adolescence.
Additionally, for students’ socioeconomic status, we found positive relationships with positive academic self-concept, behavioral engagement, and academic achievement, and negative relationships with the negative student well-being dimensions. These findings are in line with previous studies which documented higher student well-being (Alivernini et al., 2020), school engagement (Archambault et al., 2022), and school success (OECD, 2023) for students from more advantaged socioeconomic backgrounds. Our results suggest that students with a lower SES are at a greater risk of having negative feelings and attitudes towards school as well as being less engaged. These negative effects of social background may be due to a lack of resources at home, such as a quiet learning environment and adults who can give academic support (Thomson, 2018). Without these resources, students may struggle more with school tasks and perceive school as strenuous, diminishing their well-being and engagement (Y. Li & Lerner, 2011).
5.1. Implications for Theory and Practice
We mostly found positive relationships between student well-being, cognitive engagement, and academic achievement on the between-person level. While these effects were in line with our expectations, we found some counter-intuitive effects on the within-person level. This has several implications: From a theoretical perspective, our results lend support to the multidimensional conception of the constructs. The differential effects show that not all dimensions of student well-being are equally related to school engagement, and student well-being dimensions and school engagement components differ in their association with academic achievement. Further, the results imply that, while student well-being and school engagement are intertwined and related to academic achievement, their relations in secondary education might be influenced by earlier school experiences in primary education. Both constructs are probably evolving over the entire school career, mutually reinforcing each other, as well as influenced by third variables, such as the fulfillment of basic needs. Future studies could investigate how differences in well-being and engagement at the beginning of school emerge and how they are related to their development over time.
For school practice, the first and foremost insight of our study is that those students who feel better at school are also those who are more engaged and achieve better grades. This means that students’ well-being is not just a nice-to-have attribute, but crucial to their academic success. A school environment that provides students opportunities to broaden their interests, build on their skills, and respects their needs for competence, autonomy, and relatedness enables them to strive for their full potential. Second, the most important engagement component for academic success seems to be behavioral engagement. Encouraging students to participate in learning activities can be an effective lever for their achievement. Teachers can contribute to students’ behavioral engagement by providing goal-relevant feedback and emphasizing mastery-oriented achievement goals instead of performance-oriented goals (Putwain et al., 2018). Such an approach could also foster adaptive learning strategies and lead to deep rather than shallow cognitive engagement (Greene, 2015). Third, cognitive engagement may increase physical complaints in school. While the reasons for this association are unclear and need more research, educators should be aware that high cognitive engagement might have potential negative side-effects. An overemphasis on academic outcomes and performance goal orientation can lead to heightened stress, and in turn to more physical complaints (Laftman et al., 2015; Murberg & Bru, 2004; Randall et al., 2019). Fourth, our findings suggest that students may not be very accurate in assessing their own abilities, especially at the beginning of secondary school. Regular formative feedback during the school year could help them gauge their abilities and progress, therefore attaining a realistic academic self-concept (Miller & Lavin, 2007). Fifth, it is important that schools take special care of students with lower SES and ensure that they compensate for the resources those students might lack at home. Fostering these students’ school engagement is crucial, because it can serve as a buffer from the negative effects of low SES on academic achievement (L. Li et al., 2022).
5.2. Strengths and Limitations
The strengths of the present study lie in the multidimensional conceptualization of the constructs, the longitudinal design, and the statistical modeling which differentiates between- and within-level effects. However, there are also a few limitations: First, all measures of student well-being and school engagement relied on self-reports, which pose the risk of bias and social desirability. Future studies could add other informant sources, such as teacher perceptions of school engagement or observations of classroom behavior, to corroborate the validity of the school engagement measures. Second, our originally proposed model including all three school engagement dimensions did not fit the data well. We therefore had to exclude the emotional engagement component, which shares some overlap with the positive student well-being dimensions. Studies with a bigger sample size could test different competing models, for example including emotional engagement as a mediator between well-being and the other engagement components. Third, our measure of behavioral engagement was only partially invariant over measurement points. It is not clear whether this invariance stems from a change in the importance of certain items relative to the factor, or whether it is merely an artifact of the different measurement occasions. Further studies using diverse samples could determine whether this effect is generalizable to the secondary school setting or is exclusive to our sample. Fourth, three measurement points are the bare minimum for a RI-CLPM (Mulder & Hamaker, 2021) and student well-being and school engagement might fluctuate throughout the school year. Adding more measurement points could paint a more fine-grained picture of the relationship between the variables and might reveal dynamics beyond those appearing in a one-year interval.
6. Conclusions
Prior evidence suggests reciprocal relations between student well-being, school engagement, and academic achievement. In this study, we employed a multidimensional, longitudinal approach, using a six-dimensional well-being measure and a three-component school engagement instrument. We collected data from Swiss students over the three years of lower secondary education and analyzed the data using a RI-CLPM. The results revealed differential associations between the student well-being dimensions and the school engagement components, as well as with academic achievement. For the school engagement components, only behavioral engagement was directly related to achievement. The results support the idea of the multidimensionality and the interdependence of the constructs. Across all three measurement points, students with higher well-being scores also reported higher school engagement and had better grades. Well-being and academic achievement do therefore not exclude each other but are rather two sides of the same coin. As the OECD (2015, p. 4) put it, “academic achievement that comes at the expense of students’ well-being is not a full accomplishment”.
Author Contributions
Conceptualization, J.S.; methodology, J.S.; formal analysis, J.S.; investigation, J.S., K.S. and J.M.; data curation, J.S. and K.S.; writing—original draft preparation, J.S.; writing—review and editing, K.S., J.M. and T.H.; supervision, J.M. and T.H.; project administration, J.S., K.S., J.M. and T.H.; funding acquisition, J.M. and T.H. All authors have read and agreed to the published version of the manuscript.
Funding
This work was supported by the Swiss National Science Foundation [grant number 100019_197299].
Institutional Review Board Statement
This study was conducted in accordance with the Declaration of Helsinki and approved by the Ethics Committee of the University of Bern (protocol code 2021-08-00005, 18 August 2021).
Informed Consent Statement
Informed consent was obtained from all subjects involved in the study.
Data Availability Statement
The datasets presented in this article are not readily available because the data are part of an ongoing study.
Conflicts of Interest
The authors declare no conflicts of interest. The funders had no role in the design of the study; in the collection, analyses, or interpretation of data; in the writing of the manuscript; or in the decision to publish the results.
Appendix A
Table A1.
Correlations for dimensions of student well-being, school engagement, and students’ GPA.
Table A1.
Correlations for dimensions of student well-being, school engagement, and students’ GPA.
| Variable | 1 | 2 | 3 | 4 | 5 | 6 | 7 | 8 | 9 | 10 | 11 | 12 | 13 | 14 | 15 |
| 1. PASt1 | |||||||||||||||
| 2. EISt1 | 0.61 ** | ||||||||||||||
| 3. PASCt1 | 0.34 ** | 0.25 ** | |||||||||||||
| 4. WISt1 | −0.14 ** | −0.09 * | −0.33 ** | ||||||||||||
| 5. PCSt1 | −0.15 ** | −0.09 ** | −0.26 ** | 0.53 ** | |||||||||||
| 6. SPSt1 | −0.21 ** | −0.13 ** | −0.14 ** | 0.27 ** | 0.38 ** | ||||||||||
| 7. ENGCt1 | 0.34 ** | 0.32 ** | 0.23 ** | 0.01 | 0.03 | −0.06 | |||||||||
| 8. ENGBt1 | 0.43 ** | 0.37 ** | 0.35 ** | −0.25 ** | −0.26 ** | −0.23 ** | 0.19 ** | ||||||||
| 9. ENGEt1 | 0.68 ** | 0.55 ** | 0.34 ** | −0.22 ** | −0.28 ** | −0.29 ** | 0.45 ** | 0.45 ** | |||||||
| 10. GPAt1 | 0.20 ** | 0.18 ** | 0.40 ** | −0.19 ** | −0.20 ** | −0.07 | 0.03 | 0.35 ** | 0.19 ** | ||||||
| 11. PASt2 | 0.53 ** | 0.40 ** | 0.25 ** | −0.07 | −0.12 ** | −0.13 ** | 0.28 ** | 0.33 ** | 0.47 ** | 0.21 ** | |||||
| 12. EISt2 | 0.44 ** | 0.48 ** | 0.17 ** | −0.04 | −0.07 | −0.12 ** | 0.23 ** | 0.34 ** | 0.41 ** | 0.16 ** | 0.66 ** | ||||
| 13. PASCt2 | 0.23 ** | 0.18 ** | 0.50 ** | −0.20 ** | −0.22 ** | −0.09 * | 0.16 ** | 0.33 ** | 0.26 ** | 0.35 ** | 0.34 ** | 0.30 ** | |||
| 14. WISt2 | −0.11 ** | −0.12 ** | −0.16 ** | 0.49 ** | 0.42 ** | 0.22 ** | 0.00 | −0.20 ** | −0.18 ** | −0.06 | −0.09 * | −0.06 | −0.23 ** | ||
| 15. PCSt2 | −0.10 * | −0.12 ** | −0.16 ** | 0.36 ** | 0.59 ** | 0.26 ** | 0.07 | −0.26 ** | −0.20 ** | −0.16 ** | −0.25 ** | −0.16 ** | −0.19 ** | 0.59 ** | |
| 16. SPSt2 | −0.14 ** | −0.08 | −0.13 ** | 0.21 ** | 0.30 ** | 0.39 ** | 0.01 | −0.27 ** | −0.12 ** | −0.16 ** | −0.20 ** | −0.11 ** | −0.13 ** | 0.30 ** | 0.48 ** |
| 17. ENGCt2 | 0.27 ** | 0.26 ** | 0.16 ** | 0.10 * | 0.13 ** | 0.05 | 0.50 ** | 0.20 ** | 0.30 ** | 0.08 | 0.39 ** | 0.37 ** | 0.23 ** | 0.16 ** | 0.12 ** |
| 18. ENGBt2 | 0.30 ** | 0.26 ** | 0.28 ** | −0.10 * | −0.16 ** | −0.15 ** | 0.21 ** | 0.53 ** | 0.31 ** | 0.23 ** | 0.45 ** | 0.40 ** | 0.38 ** | −0.10 ** | −0.25 ** |
| 19. ENGEt2 | 0.48 ** | 0.40 ** | 0.25 ** | −0.13 ** | −0.19 ** | −0.20 ** | 0.31 ** | 0.38 ** | 0.56 ** | 0.18 ** | 0.77 ** | 0.62 ** | 0.37 ** | −0.16 ** | −0.27 ** |
| 20. GPAt2 | 0.19 ** | 0.15 ** | 0.33 ** | −0.11 * | −0.18 ** | −0.11 * | 0.04 | 0.34 ** | 0.16 ** | 0.80 ** | 0.26 ** | 0.18 ** | 0.45 ** | −0.06 | −0.15 ** |
| 21. PASt3 | 0.40 ** | 0.34 ** | 0.17 ** | −0.05 | −0.09 | −0.10 * | 0.19 ** | 0.34 ** | 0.38 ** | 0.19 ** | 0.54 ** | 0.40 ** | 0.25 ** | −0.06 | −0.19 ** |
| 22. EISt3 | 0.32 ** | 0.38 ** | 0.10 * | −0.01 | −0.03 | −0.10 * | 0.21 ** | 0.20 ** | 0.35 ** | 0.08 | 0.39 ** | 0.42 ** | 0.22 ** | −0.10 * | −0.11 * |
| 23. PASCt3 | 0.10 * | 0.20 ** | 0.26 ** | −0.13 ** | −0.15 ** | −0.10 * | 0.11 * | 0.27 ** | 0.19 ** | 0.22 ** | 0.25 ** | 0.17 ** | 0.38 ** | −0.15 ** | −0.22 ** |
| 24. WISt3 | 0.04 | −0.01 | −0.11 * | 0.40 ** | 0.38 ** | 0.18 ** | −0.02 | −0.11 * | −0.13 ** | −0.01 | −0.01 | 0.00 | −0.17 ** | 0.42 ** | 0.35 ** |
| 25. PCSt3 | −0.09 | −0.06 | −0.11 * | 0.27 ** | 0.45 ** | 0.28 ** | 0.06 | −0.20 ** | −0.18 ** | −0.16 ** | −0.12 ** | −0.06 | −0.20 ** | 0.31 ** | 0.48 ** |
| 26. SPSt3 | −0.10 * | −0.09 * | −0.06 | 0.20 ** | 0.27 ** | 0.29 ** | 0.03 | −0.24 ** | −0.20 ** | −0.15 ** | −0.15 ** | −0.09 * | −0.11 * | 0.12 ** | 0.25 ** |
| 27. ENGCt3 | 0.19 ** | 0.15 ** | 0.16 ** | 0.08 | 0.07 | −0.05 | 0.39 ** | 0.09 * | 0.21 ** | 0.07 | 0.27 ** | 0.19 ** | 0.11 * | 0.06 | 0.08 |
| 28. ENGBt3 | 0.27 ** | 0.25 ** | 0.14 ** | −0.07 | −0.10 * | −0.16 ** | 0.18 ** | 0.48 ** | 0.30 ** | 0.18 ** | 0.32 ** | 0.28 ** | 0.24 ** | −0.10 * | −0.22 ** |
| 29. ENGEt3 | 0.39 ** | 0.35 ** | 0.19 ** | −0.13 ** | −0.17 ** | −0.21 ** | 0.23 ** | 0.33 ** | 0.48 ** | 0.16 ** | 0.50 ** | 0.36 ** | 0.26 ** | −0.16 ** | −0.25 ** |
| 30. GPAt3 | 0.15 ** | 0.09 | 0.25 ** | −0.08 | −0.12 * | −0.11 * | 0.04 | 0.30 ** | 0.17 ** | 0.62 ** | 0.26 ** | 0.14 ** | 0.34 ** | −0.06 | −0.13 ** |
| 31. ESCS | 0.00 | 0.01 | 0.16 ** | −0.15 ** | −0.22 ** | −0.06 | 0.06 | 0.07 | 0.04 | 0.22 ** | 0.10 * | 0.00 | 0.26 ** | −0.16 ** | −0.17 ** |
| Variable | 16 | 17 | 18 | 19 | 20 | 21 | 22 | 23 | 24 | 25 | 26 | 27 | 28 | 29 | 30 |
| 17. ENGCt2 | 0.04 | ||||||||||||||
| 18. ENGBt2 | −0.34 ** | 0.36 ** | |||||||||||||
| 19. ENGEt2 | −0.28 ** | 0.45 ** | 0.52 ** | ||||||||||||
| 20. GPAt2 | −0.13 ** | 0.14 ** | 0.29 ** | 0.21 ** | |||||||||||
| 21. PASt3 | −0.10 * | 0.28 ** | 0.33 ** | 0.51 ** | 0.23 ** | ||||||||||
| 22. EISt3 | 0.02 | 0.26 ** | 0.24 ** | 0.44 ** | 0.12 * | 0.64 ** | |||||||||
| 23. PASCt3 | −0.17 ** | 0.13 ** | 0.23 ** | 0.25 ** | 0.32 ** | 0.44 ** | 0.36 ** | ||||||||
| 24. WISt3 | 0.22 ** | 0.10 * | −0.04 | −0.09 * | 0.00 | 0.04 | 0.04 | −0.02 | |||||||
| 25. PCSt3 | 0.28 ** | 0.13 ** | −0.12 ** | −0.15 ** | −0.20 ** | −0.16 ** | −0.09 * | −0.17 ** | 0.57 ** | ||||||
| 26. SPSt3 | 0.29 ** | 0.04 | −0.16 ** | −0.18 ** | −0.12 * | −0.19 ** | −0.07 | −0.08 * | 0.35 ** | 0.56 ** | |||||
| 27. ENGCt3 | 0.07 | 0.49 ** | 0.17 ** | 0.28 ** | 0.14 ** | 0.32 ** | 0.31 ** | 0.16 ** | 0.20 ** | 0.22 ** | 0.23 ** | ||||
| 28. ENGBt3 | −0.18 ** | 0.27 ** | 0.52 ** | 0.34 ** | 0.31 ** | 0.45 ** | 0.36 ** | 0.43 ** | −0.09 * | −0.29 ** | −0.33 ** | 0.21 ** | |||
| 29. ENGEt3 | −0.13 ** | 0.26 ** | 0.28 ** | 0.61 ** | 0.22 ** | 0.70 ** | 0.62 ** | 0.36 ** | −0.09 * | −0.23 ** | −0.22 ** | 0.45 ** | 0.44 ** | ||
| 30. GPAt3 | −0.15 ** | 0.15 ** | 0.28 ** | 0.26 ** | 0.75 ** | 0.28 ** | 0.16 ** | 0.40 ** | 0.00 | −0.21 ** | −0.09 | 0.16 ** | 0.41 ** | 0.27 ** | |
| 31. ESCS | −0.11 ** | 0.03 | 0.04 | 0.08 * | 0.31 ** | 0.04 | 0.09 * | 0.08 | −0.05 | −0.07 | 0.00 | 0.09 | −0.02 | 0.07 | 0.19 ** |
PAS = positive attitudes to school; EIS = enjoyment in school; PASC = positive academic self-concept; WIS = worries in school, PCS = physical complaints in school; SPS = social problems in school; ENGC = cognitive engagement; ENGB = behavioral engagement; ENGE = emotional engagement; GPA = grade point average; ESCS = index of economic, social, and cultural status; t1 = wave 1; t2 = wave 2; t3 = wave 3. ** p < 0.01; * p < 0.05.
References
- Alivernini, F., Cavicchiolo, E., Manganelli, S., Chirico, A., & Lucidi, F. (2020). Students’ psychological well-being and its multilevel relationship with immigrant background, gender, socioeconomic status, achievement, and class size. School Effectiveness and School Improvement, 31(2), 172–191. [Google Scholar] [CrossRef]
- Amholt, T. T., Dammeyer, J., Carter, R., & Niclasen, J. (2020). Psychological well-being and academic achievement among school-aged children: A systematic review. Child Indicators Research, 13(5), 1523–1548. [Google Scholar] [CrossRef]
- Appleton, J. J., Christenson, S. L., & Furlong, M. J. (2008). Student engagement with school: Critical conceptual and methodological issues of the construct. Psychology in the Schools, 45(5), 369–386. [Google Scholar] [CrossRef]
- Archambault, I., Janosz, M., Olivier, E., & Dupéré, V. (2022). Student engagement and school dropout: Theories, evidence, and future directions. In A. L. Reschly, & S. L. Christenson (Eds.), Handbook of research on student engagement (pp. 331–355). Springer International Publishing. [Google Scholar] [CrossRef]
- Bücker, S., Nuraydin, S., Simonsmeier, B. A., Schneider, M., & Luhmann, M. (2018). Subjective well-being and academic achievement: A meta-analysis. Journal of Research in Personality, 74, 83–94. [Google Scholar] [CrossRef]
- Chen, F. F. (2007). Sensitivity of goodness of fit indexes to lack of measurement invariance. Structural Equation Modeling: A Multidisciplinary Journal, 14(3), 464–504. [Google Scholar] [CrossRef]
- Church, M. A., Elliot, A. J., & Gable, S. L. (2001). Perceptions of classroom environment, achievement goals, and achievement outcomes. Journal of Educational Psychology, 93(1), 43. [Google Scholar] [CrossRef]
- Deci, E. L., & Ryan, R. M. (2008). Facilitating optimal motivation and psychological well-being across life’s domains. Canadian Psychology/Psychologie Canadienne, 49(1), 14. [Google Scholar] [CrossRef]
- Diener, E. (1984). Subjective well-being. Psychological Bulletin, 95(3), 542. [Google Scholar] [CrossRef]
- Diener, E., & Sim, J. H. (2024). Happiness/subjective well-being. In A. Scarantino (Ed.), Emotion theory: The routledge comprehensive guide (pp. 199–217). Routledge. [Google Scholar]
- Earl, S. R., Taylor, I. M., Meijen, C., & Passfield, L. (2023). Trajectories in cognitive engagement, fatigue, and school achievement: The role of young adolescents’ psychological need satisfaction. Learning and Individual Differences, 101, 102248. [Google Scholar] [CrossRef]
- Fredricks, J. A. (2022). The Measurement of student engagement: Methodological advances and comparison of new self-report instruments. In A. L. Reschly, & S. L. Christenson (Eds.), Handbook of research on student engagement (pp. 597–616). Springer International Publishing. [Google Scholar] [CrossRef]
- Fredricks, J. A., Blumenfeld, P., Friedel, J., & Paris, A. (2005). School engagement. In K. A. Moore, & L. H. Lippman (Eds.), What do children need to flourish? (pp. 305–321) Springer Science; Business Media. [Google Scholar]
- Fredricks, J. A., Blumenfeld, P. C., & Paris, A. H. (2004). School engagement: Potential of the concept, state of the evidence. Review of Educational Research, 74(1), 59–109. [Google Scholar] [CrossRef]
- Fredrickson, B. L. (2001). The role of positive emotions in positive psychology. The broaden-and-build theory of positive emotions. The American Psychologist, 56(3), 218–226. [Google Scholar] [CrossRef]
- Fredrickson, B. L. (2013). Positive emotions broaden and build. In Advances in experimental social psychology (Vol. 47, pp. 1–53). Elsevier. [Google Scholar] [CrossRef]
- Geraci, L., Kurpad, N., Tirso, R., Gray, K. N., & Wang, Y. (2023). Metacognitive errors in the classroom: The role of variability of past performance on exam prediction accuracy. Metacognition and Learning, 18(1), 219–236. [Google Scholar] [CrossRef] [PubMed]
- Greene, B. A. (2015). Measuring cognitive engagement with self-report scales: Reflections from over 20 years of research. Educational Psychologist, 50(1), 14–30. [Google Scholar] [CrossRef]
- Grob, A., Wearing, A., Little, T., & Wanner, B. (1996). Adolescents’ well-being and perceived control across 14 sociocultural contexts. Journal of Personality and Social Psychology, 71(4), 785–795. [Google Scholar] [CrossRef] [PubMed]
- Gumora, G., & Arsenio, W. F. (2002). Emotionality, emotion regulation, and school performance in middle school children. Journal of School Psychology, 40(5), 395–413. [Google Scholar] [CrossRef]
- Hallquist, M. N., & Wiley, J. F. (2018). MplusAutomation: An r package for facilitating large-scale latent variable analyses in mplus. Structural Equation Modeling: A Multidisciplinary Journal, 25(4), 621–638. [Google Scholar] [CrossRef]
- Hascher, T. (2004). Wohlbefinden in der schule. Waxmann Verlag. [Google Scholar]
- Hascher, T. (2007). Exploring students’ well-being by taking a variety of looks into the classroom. Hellenic Journal of Psychology, 4, 331–349. [Google Scholar]
- Hossain, S., O’Neill, S., & Strnadova, I. (2023). What constitutes student well-being: A scoping review of students’ perspectives. Child Indicators Research, 16(2), 447–483. [Google Scholar] [CrossRef]
- Kang, X., & Wu, Y. (2022). Academic enjoyment, behavioral engagement, self-concept, organizational strategy and achievement in EFL setting: A multiple mediation analysis. PLoS ONE, 17(4), e0267405. [Google Scholar] [CrossRef]
- Kaya, M., & Erdem, C. (2021). Students’ well-being and academic achievement: A meta-analysis study. Child Indicators Research, 14(5), 1743–1767. [Google Scholar] [CrossRef]
- Kiuru, N., Wang, M. T., Salmela-Aro, K., Kannas, L., Ahonen, T., & Hirvonen, R. (2020). Associations between adolescents’ interpersonal relationships, school well-being, and academic achievement during educational transitions. Journal of Youth and Adolescence, 49(5), 1057–1072. [Google Scholar] [CrossRef] [PubMed]
- Kleinkorres, R., Stang, J., & McElvany, N. (2020). A longitudinal analysis of reciprocal relations between students’ well-being and academic achievement. Journal for Educational Research Online, 12, 114–165. [Google Scholar] [CrossRef]
- Kruger, J., & Dunning, D. (1999). Unskilled and unaware of it: How difficulties in recognizing one’s own incompetence lead to inflated self-assessments. Journal of Personality and Social Psychology, 77(6), 1121. [Google Scholar] [CrossRef] [PubMed]
- Kwok, S. Y. C. L., & Fang, S. (2021). A cross-lagged panel study examining the reciprocal relationships between positive emotions, meaning, strengths use and study engagement in primary school students. Journal of Happiness Studies, 22(3), 1033–1053. [Google Scholar] [CrossRef]
- Laftman, S. B., Modin, B., Ostberg, V., Hoven, H., & Plenty, S. (2015). Effort-reward imbalance in the school setting: Associations with somatic pain and self-rated health. Scandinavian Journal of Public Health, 43(2), 123–129. [Google Scholar] [CrossRef]
- Lei, H., Cui, Y., & Zhou, W. (2018). Relationships between student engagement and academic achievement: A meta-analysis. Social Behavior and Personality: An International Journal, 46(3), 517–528. [Google Scholar] [CrossRef]
- Li, L., Valiente, C., Eisenberg, N., Spinrad, T. L., Johns, S. K., Berger, R. H., Thompson, M. S., Southworth, J., Pina, A. A., Hernández, M. M., & Gal-Szabo, D. E. (2022). Longitudinal relations between behavioral engagement and academic achievement: The moderating roles of socio-economic status and early achievement. Journal of School Psychology, 94, 15–27. [Google Scholar] [CrossRef]
- Li, Y., & Lerner, R. M. (2011). Trajectories of school engagement during adolescence: Implications for grades, depression, delinquency, and substance use. Developmental Psychology, 47(1), 233–247. [Google Scholar] [CrossRef]
- Lin, S., & Muenks, K. (2022). Perfectionism profiles among college students: A person-centered approach to motivation, behavior, and emotion. Contemporary Educational Psychology, 71, 102110. [Google Scholar] [CrossRef]
- Little, R. J. A. (1988). A test of missing completely at random for multivariate data with missing values. Journal of the American Statistical Association, 83(404), 1198–1202. [Google Scholar] [CrossRef]
- Little, T. D. (2013). Longitudinal structural equation modeling. Guilford Press. [Google Scholar]
- Maechel, L., Steinmayr, R., Christiansen, H., & Wirthwein, L. (2023). On the association between students’ (domain-specific) subjective well-being and academic achievement—Disentangling mixed findings. Current Psychology, 42(35), 30825–30839. [Google Scholar] [CrossRef]
- Miller, D., & Lavin, F. (2007). “But now I feel I want to give it a try”: Formative assessment, self-esteem and a sense of competence. The Curriculum Journal, 18(1), 3–25. [Google Scholar] [CrossRef]
- Morinaj, J., & Hascher, T. (2022). On the relationship between student well-being and academic achievement: A longitudinal study among secondary school students in switzerland. Zeitschrift Für Psychologie, 230, 201–214. [Google Scholar] [CrossRef]
- Mulder, J. D., & Hamaker, E. L. (2021). Three extensions of the random intercept cross-lagged panel model. Structural Equation Modeling: A Multidisciplinary Journal, 28(4), 638–648. [Google Scholar] [CrossRef]
- Murberg, T. A., & Bru, E. (2004). School-related stress and psychosomatic symptoms among norwegian adolescents. School Psychology International, 25(3), 317–332. [Google Scholar] [CrossRef]
- Muthén, L. K., & Muthén, B. O. (1998–2017). Mplus user’s guide (8th ed.). Muthén & Muthén. [Google Scholar]
- Niemiec, C. P., Lynch, M. F., Vansteenkiste, M., Bernstein, J., Deci, E. L., & Ryan, R. M. (2006). The antecedents and consequences of autonomous self-regulation for college: A self-determination theory perspective on socialization. Journal of Adolescence, 29(5), 761–775. [Google Scholar] [CrossRef]
- OECD. (2015). Do teacher-student relations affect students’ well-being at school? (PISA in Focus 50). OECD. [Google Scholar] [CrossRef]
- OECD. (2023). PISA 2022 results (volume II): Learning during—And from—Disruption. PISA, OECD Publishing. [Google Scholar] [CrossRef]
- Pérez, P. M., Costa, J.-L. C., & Corbí, R. G. (2012). An explanatory model of academic achievement based on aptitudes, goal orientations, self-concept and learning strategies. The Spanish Journal of Psychology, 15(1), 48–60. [Google Scholar] [CrossRef]
- Putwain, D. W., Symes, W., Nicholson, L. J., & Becker, S. (2018). Achievement goals, behavioural engagement, and mathematics achievement: A mediational analysis. Learning and Individual Differences, 68, 12–19. [Google Scholar] [CrossRef]
- Randall, E. T., Shapiro, J. B., Smith, K. R., Jervis, K. N., & Logan, D. E. (2019). Under pressure to perform: Impact of academic goal orientation, school motivational climate, and school engagement on pain and somatic symptoms in adolescents. The Clinical Journal of Pain, 35(12), 967–974. [Google Scholar] [CrossRef]
- Raniti, M., Rakesh, D., Patton, G. C., & Sawyer, S. M. (2022). The role of school connectedness in the prevention of youth depression and anxiety: A systematic review with youth consultation. BMC Public Health, 22(1), 2152. [Google Scholar] [CrossRef]
- R Core Team. (2020). R: A language and environment for statistical computing. R Foundation for Statistical Computing. Available online: https://www.R-project.org/ (accessed on 20 December 2024).
- Reeve, J., Basarkod, G., Jang, H.-R., Gargurevich, R., Jang, H., & Cheon, S. H. (2025). Specialized purpose of each type of student engagement: A meta-analysis. Educational Psychology Review, 37(1), 13. [Google Scholar] [CrossRef]
- Ryan, R. M., & Deci, E. L. (2000). Self-determination theory and the facilitation of intrinsic motivation, social development, and well-being. American Psychologist, 55(1), 68–78. [Google Scholar] [CrossRef]
- Ryff, C. D. (1989). Happiness is everything, or is it? Explorations on the meaning of psychological well-being. Journal of Personality and Social Psychology, 57(6), 1069. [Google Scholar] [CrossRef]
- Salmela-Aro, K., Tang, X., Symonds, J., & Upadyaya, K. (2021). Student engagement in adolescence: A scoping review of Longitudinal studies 2010–2020. Journal of Research on Adolescence, 31(2), 256–272. [Google Scholar] [CrossRef]
- Seaton, M., Parker, P., Marsh, H. W., Craven, R. G., & Yeung, A. S. (2017). The reciprocal relations between self-concept, motivation and achievement: Juxtaposing academic self-concept and achievement goal orientations for mathematics success. In Noncognitive psychological processes and academic achievement (pp. 59–82). Routledge. [Google Scholar]
- Skinner, E., Furrer, C., Marchand, G., & Kindermann, T. (2008). Engagement and disaffection in the classroom: Part of a larger motivational dynamic? Journal of Educational Psychology, 100, 765–781. [Google Scholar] [CrossRef]
- Taylor, G., Jungert, T., Mageau, G. A., Schattke, K., Dedic, H., Rosenfield, S., & Koestner, R. (2014). A self-determination theory approach to predicting school achievement over time: The unique role of intrinsic motivation. Contemporary Educational Psychology, 39(4), 342–358. [Google Scholar] [CrossRef]
- Thomson, S. (2018). Achievement at school and socioeconomic background—An educational perspective. NPJ Science of Learning, 3(1), 5. [Google Scholar] [CrossRef]
- Upadyaya, K., & Salmela-Aro, K. (2021). Positive youth development through student engagement: Associations with well-being. In D. Radosveta, & N. Wiium (Eds.), Handbook of positive youth development (pp. 361–374). Springer International Publishing. [Google Scholar] [CrossRef]
- Vansteenkiste, M., & Ryan, R. M. (2013). On psychological growth and vulnerability: Basic psychological need satisfaction and need frustration as a unifying principle. Journal of Psychotherapy Integration, 23(3), 263–280. [Google Scholar] [CrossRef]
- Veiga, F. H., García, F., Reeve, J., Wentzel, K., & Garcia, O. (2015). When adolescents with high self-concept lose their engagement in school//cuando se pierde la motivación escolar de los adolescentes con mejor autoconcepto. Revista de Psicodidactica/Journal of Psychodidactics, 20(2), 305–320. [Google Scholar] [CrossRef]
- Virtanen, T. E., Vasalampi, K., Torppa, M., Lerkkanen, M. K., & Nurmi, J. E. (2019). Changes in students’ psychological well-being during transition from primary school to lower secondary school: A person-centered approach. Learning and Individual Differences, 69, 138–149. [Google Scholar] [CrossRef]
- Wang, C., Hsu, H.-C. K., Bonem, E. M., Moss, J. D., Yu, S., Nelson, D. B., & Levesque-Bristol, C. (2019). Need satisfaction and need dissatisfaction: A comparative study of online and face-to-face learning contexts. Computers in Human Behavior, 95, 114–125. [Google Scholar] [CrossRef]
- Widlund, A., Tuominen, H., & Korhonen, J. (2021). Development of school engagement and burnout across lower and upper secondary education: Trajectory profiles and educational outcomes. Contemporary Educational Psychology, 66, 101997. [Google Scholar] [CrossRef]
- Widlund, A., Tuominen, H., & Korhonen, J. (2023). Reciprocal effects of mathematics performance, school engagement and burnout during adolescence. British Journal of Educational Psychology, 93(1), 183–197. [Google Scholar] [CrossRef] [PubMed]
- Wong, Z. Y., & Liem, G. A. D. (2022). Student engagement: Current state of the construct, conceptual refinement, and future research directions. Educational Psychology Review, 34(1), 107–138. [Google Scholar] [CrossRef]
- Wong, Z. Y., Liem, G. A. D., Chan, M., & Datu, J. A. D. (2024). Student engagement and its association with academic achievement and subjective well-being: A systematic review and meta-analysis. Journal of Educational Psychology, 116(1), 48. [Google Scholar] [CrossRef]
- Yang Hansen, K., Thorsen, C., Radišić, J., Peixoto, F., Laine, A., & Liu, X. (2024). When competence and confidence are at odds: A cross-country examination of the Dunning–Kruger effect. European Journal of Psychology of Education, 39(2), 1537–1559. [Google Scholar] [CrossRef]
Disclaimer/Publisher’s Note: The statements, opinions and data contained in all publications are solely those of the individual author(s) and contributor(s) and not of MDPI and/or the editor(s). MDPI and/or the editor(s) disclaim responsibility for any injury to people or property resulting from any ideas, methods, instructions or products referred to in the content. |
© 2025 by the authors. Licensee MDPI, Basel, Switzerland. This article is an open access article distributed under the terms and conditions of the Creative Commons Attribution (CC BY) license (https://creativecommons.org/licenses/by/4.0/).