Article

Boosting Active Learning Through a Gamified Flipped Classroom: A Retrospective Case Study in Higher Engineering Education

Department of Mechanical and Structural Engineering and Materials Science, University of Stavanger, 4021 Stavanger, Norway
Educ. Sci. 2025, 15(4), 430; https://doi.org/10.3390/educsci15040430
Submission received: 17 January 2025 / Revised: 21 March 2025 / Accepted: 24 March 2025 / Published: 28 March 2025
(This article belongs to the Special Issue Technology-Enhanced Education for Engineering Students)

Abstract

:
Active learning and associated techniques such as flipped classes have been demonstrated to have positive impacts on student learning and performance. Active learning faces several challenges when learners apply weak learning styles. Weak learning might happen when a student is not motivated to carry out any pre-class content activity, actively participate in the class activity, or reflect and reinforce the learned content during and after the class. This study explores how a gamified flipped classroom affects active learning performance and learning outcomes. The case is related to a technical course in the Maintenance Engineering Field, which is well known for a high rate of misunderstanding and low learning outcomes. It is found that sequential game-boosting activities in the flipped classroom have managed to level up students’ learning outcomes by explaining almost all concepts with low levels of misconceptions.

1. Introduction

Active learning has been shown to have positive impacts on student learning and performance Doolittle et al. (2023); Guimarães and da Silva Lima (2021); Michael (2006); Prince (2004). Bonwell and Eison (1991) defined active learning as anything that “involves students in doing things and thinking about the things they are doing”. This definition and its associated practices offer advantages to students, teachers, institutions, and society. The application of knowledge through problem-solving and case studies allows students to practice and reinforce their learning, leading to better retention Lavi and Bertel (2024). Active learning emphasizes analysis, evaluation, and creativity, leaving lower-order cognitive tasks for pre-class work Asok et al. (2016); Miyachi et al. (2016). Active learning not only improves cognitive outcomes, but also develops additional skills such as teamwork, problem-solving, and leadership de Menéndez et al. (2019); Gleason et al. (2011), as well as critical thinking Nelson and Crow (2014). Active learning provides flexibility in teaching, as it can be adapted according to the needs and levels of participation of the students Torralba and Doo (2020). Teachers, with the help of active learning, can gain insight into student comprehension Fazio (2020) and address individual challenges or understanding gaps during class Otegui and Raimondi (2024). Active learning has also transformed the attitudes and teaching behaviors of staff White et al. (2016). At the institutional level, active learning increases course completion, as a meta-analysis study Freeman et al. (2014) found that active learning increased average examination scores by approximately 6% and reduced the likelihood of failing by 1.5 times compared to traditional lecturing. For society, active learning as a strategy is observed to have a valuable role in improving the adaptability of students’ careers Hui et al. (2021). Moreover, active learning narrows achievement gaps for under-represented students Theobald et al. (2020).
Despite the potential benefits in improving student engagement, performance, and learning outcomes and the increasing trend in the use of active learning Limaymanta et al. (2021); Martella et al. (2021), active learning presents several challenges, including pedagogical aspects (student preparation, higher-order thinking), practical aspects (workload, resources, learning environment collaboration, and communication), and institutional (institutional support and cultural resistance) aspects. Among the practical obstacles, there is the limited time available to cover the entire content of the discipline in the classroom, the need for time to develop the strategy before its application, the difficulty in implementing the method in large classes, the idea teachers have about being good lecturers themselves, and the lack of resources, materials, and support equipment Konopka et al. (2015). In fact, student resistance and low rates of instructor persistence with active learning have gained increased attention from the academic community Owens et al. (2020). Active learning often requires pre-class study Emily et al. (2021), which can increase the study workload for students. Moreover, it requires cognitive effort to perform high-order thinking in the classroom Deslauriers et al. (2019), which might contrast with the passive listener role that students are used to Konopka et al. (2015). The flipped classroom is a prominent example of active learning Collado-Valero et al. (2021). Although the flipped classroom model has proven its effectiveness in enhancing student learning, several challenges hinder effective learning, including time constraints, low motivation for pre-class work, insufficient guidance outside of class, concerns about quality with recorded lectures, and limited access to technological resources and the adoption of the flipped classroom Baig and Yadegaridehkordi (2023).
By employing diverse instructional strategies, leveraging technology, and incorporating robust evaluation methods, educators can effectively address these challenges and enhance student engagement Mercan and Varol Selçuk (2024); Nguyen et al. (2021). For example, flipped classrooms have been shown to increase the achievement of learning outcomes when quizzes are included in their design van Alten et al. (2019). Another example is the model ’Fail, Flip, Fix, and Feed’ Kapur et al. (2022), in which students are first asked to participate in the generation of solutions to novel problems, even if they fail to generate the correct solutions, before receiving instructions. The use of technology, such as robots, which is related to active learning strategies, can contribute to better outcomes in mathematics education Lopez-Caudana et al. (2020). Research indicates that interactive approaches such as games can improve active learning Göksün and Gürsoy (2019); Halachev (2024); Hassan et al. (2019); Kutergina (2017); Zhang et al. (2024). For example, active learning was used through a problem-based collaborative learning methodology, using Kahoot!, a game-based learning platform that demonstrated a statistically significant increase in student conceptual understanding and exam performance, according to their individual perceptions of active participation and time spent in active learning Ting et al. (2019). The effectiveness of gamified learning can be influenced by dynamic elements such as narrative, progress, and relationships; mechanics elements like rules, challenges, cooperation, and coordination; and game components like badges, points, leaderboards, and levels Jabbar and Felicia (2015); Werbach and Hunter (2012). It should be noted that notable enhancements in terms of learning outcomes have been observed due to gamified learning without a corresponding increase in the intrinsic motivation of students Ferriz-Valero et al. (2020). The facilitation of the gamification approach, the types of badges, and technical issues are identified as factors that can limit the influence of the gamified learning approach Ding (2018). In another study Kyewski and Krämer (2018), the badges had less impact on motivation and performance than is commonly assumed.
More exploration of the specific needs and challenges facing students and educators in gamified learning is required Mercan and Varol Selçuk (2024). At the University of Stavanger, a course on condition monitoring and predictive maintenance combines several emerging technical concepts and techniques that usually confuse students and affect their learning performance and outcome. As part of the enhancement plan for this course, the course was transformed into a project-based course to enable students to gain job-required skills, and the classes were transformed into flipped classrooms to perform an active learning approach. In Figure 1, the three stages of flipped classroom technique are illustrated, including student preparedness (pre-class study) and student engagement in the class, followed by a reflection and assessment of learning outcomes after the class. In spring 2023, the interactive gamified whiteboard was introduced to enhance engagement and the level of understanding. However, the improvements in the understanding level and misconception rate were not satisfactory, based on the results after assessing the concept assignment. In spring 2024, as shown in Figure 1, the same gamified flipped classroom workshops were conducted, and the level of understanding and the misconception rate were more satisfactory. This difference triggered this study to examine the methods, results and discussions to explain the higher level of understanding observed in 2024.
Several speculations came to mind, such as students being more engaged and motivated in 2024 compared to 2023, studying more, or the gamified flipped classroom being more effective this round. Therefore, the main research question in this study is “What are the key aspects that influenced the learning outcome in 2024 compared to 2023?” This study covered and analyzed the following aspects: (1) learning outcomes in completing the post-class assignment, (2) student self-study performance, (3) student profiles, (4) gamified flipped classroom performance, and (5) course evaluation survey. A retrospective case study is conducted to analyze these five listed aspects. In the following section, active learning, blended learning, the flipped classroom, and gamified learning are explained. Later, the course of interest is described. Then, in Section 3, the results of the case are analyzed and discussed. The paper concludes with conclusions on novel practices that can be applied to the flipped classroom with the game-boosting learning technique.

2. Materials and Methods

In this section, the basic theoretical background is provided on active, blended and gamified learning. Later, detailed descriptions of the course and gamified flipped classroom materials and setup are provided, followed by the detailed methodology.

2.1. Active Learning

Active learning practices are affected by the adapted definition and the applied strategy Driessen et al. (2020). Bonwell and Eison (1991) have coined the most common definition of active learning as anything that “involves students in doing things and thinking about the things they are doing”. Prince (2004) has defined active learning as any “instructional method that engages” students in the learning process. Graffam (2007) stated that “for learning to be active, learners need not only to do something, but also to reflect on what they are doing”. Felder and Brent (2009) defined active learning in comparison to traditional lecturing as anything related to the course that students are asked to do other than simply watching and listening to a lecture and taking notes. Freeman et al. (2014) defined active learning as a higher-order, collectively engaging thinking mechanism. They defined active learning as anything that engages students in the process of learning through activities and/or discussion in class, as opposed to passively listening to an expert, and often involves group work. Several studies Doolittle et al. (2023); Driessen et al. (2020) aimed to analyze the definition of active learning and emerging practices. In summary, Doolittle et al. (2023) highlighted that active learning can be defined in various ways as interacting (engagement), group work, scaffolding (constructivism), application, and problem-solving. The most common definition of active learning was “interacting/engaging” with the material and the second most common categorized definition was “not lecturing/listening”, followed by “group work”. It was also found the most frequently represented strategy categories from the surveys were discussion (34%), group work (29%), and meta-cognition (45%). In terms of active learning strategies, a combination of the following strategies can be applied: problem-based learning/problem solving, flipped classroom/inverted classroom, small groups/group work, team-based learning, discussions, case-based learning, simulations, games/board games, project-based learning, clickers, Q&A/questioning, debates, etc. Nguyen et al. (2021) present a summary list of specific explanation, facilitation and planning strategies as follows: (1) establish expectations; (2) explain the purpose; (3) approach students to assist and provide feedback and direction to students during the activity and monitor students or teams who need help with the activity; (4) encourage students and create a supportive classroom environment; (5) design appropriate activities that involve participation and balancing difficult and time-consuming activities; (6) create group policies; (7) align the course and ensure that the activity connected with lecture, homework, or other forms of assessment; and (8) review student feedback by encouraging students to give feedback related to an activity to update and improve the course.

2.2. Blended Learning

In addition, the COVID-19 pandemic has impacted and required active learning techniques to accommodate the online environment including virtual simulations, online collaboration tools, and interactive multimedia Maldonado-Trapp and Bruna (2024). University courses moved more toward hybrid or blended learning to provide engaging learning opportunities to students by combining a face-to-face medium of instruction with online learning opportunities. Blended learning, as defined by Dziuban et al. (2004), is an instructional method that includes the efficiency and socialization opportunities of the traditional face-to-face classroom with the digitally enhanced learning possibilities of the online mode of delivery. Sala et al. (2024) highlighted that the adoption of blended learning strategies in the engineering field increases student engagement in the learning process, provides additional flexibility to their educational path, and allows them to acquire the necessary skills to be competitive in the job market and in the industry. Kumar et al. (2021) stated that blended learning is a hybrid and intermediate stage between in-classroom instructions and the delivery of the content in a fully online mode. Bozkurt (2022) highlighted that blended learning offers learning experiences that involve the different factors shaping each modality, such as time, space, path, and pace, through sequential or parallel designs. However, it was observed that the main concern was the efficiency and effectiveness of the online modality, which can hinder the blending of the two modalities by the neglect shown to the on-site modality Bozkurt (2022). It can be concluded that blended learning is often an effective enabler of active learning strategies, as long as it involves active learning and balances online and on-site activities.

2.3. Flipped Classroom Learning

Active learning is often combined with flipped classrooms Collado-Valero et al. (2021); Emily et al. (2021). Flipped learning is defined Bergmann and Sams (2012) as a teaching method in which “what is traditionally done in class is now done at home and what is traditionally done as homework is now completed in class”. Flipped classrooms are an effective way to motivate students as they use technology Tomas et al. (2019); Yıldız et al. (2022) and improve student engagement and satisfaction Wang and Zhu (2019). Time constraints, low motivation for pre-class work, insufficient guidance outside class, quality concerns with recorded lectures, and limited access to technological resources and the adoption of the flipped classroom are the main challenges that flipped classrooms are facing Baig and Yadegaridehkordi (2023). Learning management systems contribute significantly to the support of flipped classroom learning and make it more effective Baig and Yadegaridehkordi (2023). Employing diverse instructional strategies, leveraging technology, and incorporating robust evaluation methods can also effectively address these challenges and enhance student engagement Nguyen et al. (2021).

2.4. Gamified Learning

The key challenges facing modern education are often attributed to the lack of participation and motivation of students to actively participate in the learning process Li et al. (2023). One potential solution to address this issue involves the utilization of game elements Kiryakova et al. (2014). Deterding et al. (2011) defined gamification as the use of elements from games (e.g., points, badges, leader boards, and challenges) in non-gaming environments. It is important to distinguish gamification from game-based learning. Gamification utilizes components of games in real-world situations, while game-based learning employs full-featured games to provide skill or knowledge Dahalan et al. (2024). Several studies Landers (2014); Zaric et al. (2021) explain that gamification does not directly affect learning but could be a mediator or moderator agent. Landers (2014) explained that gamified learning can be a mediator when the instructor uses it to encourage learning behavior, e.g., to engage and increase the student’s motivation to affect the learning outcome. However, it can be a moderator when the instructor utilizes it to directly increase the learning outcome, e.g., by playing the game several times. Faiella and Ricciardi (2015) highlight that there is wide agreement about the need for customization of gamified learning to address the various student profiles that make up the class. Eight key considerations for designing effective gamified learning experiences and customizing the gamified learning have been extracted An (2020): (1) incorporating meaning; (2) emphasizing user-centred design; (3) integrating challenges, personalization and feedback; (4) providing choices and fostering autonomy; (5) balancing the risks and benefits of extrinsic rewards; (6) encouraging social interaction and a sense of relatedness; (7) addressing the dynamics of competition versus cooperation; and (8) viewing failure as a valuable learning opportunity.
There are digital tools that are transforming interactive classrooms by fostering collaboration, supporting various pedagogical approaches, enhancing both in-person and remote learning experiences, and engaging students and teachers. For example, Miro is an online whiteboard platform that offers a versatile environment for sharing in real-time and multimedia interaction, making it a valuable tool for educational settings Brandao et al. (2021); Chan et al. (2023); Jing and Canter (2023); Johnson (2022). However, Miro, as with any tool, comes with a learning curve and requires some time to become familiar with Chan et al. (2023).

2.5. The Course of Interest

The course of interest in this study is the “Condition Monitoring and Predictive Maintenance” course, which is a 10 European Credit Transfer and Accumulation System (ECTS1) and has the code IAM540. The author has been teaching this course since 2017 and has continuously updated it. It is a master-level course, provided as a compulsory subject for the industrial asset management study program, as an elective subject for several study programs and exchange students, and as an open-to-the-public single course. This course has three sets of learning objectives, described in Table 1: (1) knowledge and concepts, (2) skills, and (3) general competence and attitude. The course was updated with several updates in terms of teaching setup, learning activities, and assessment methods. In 2016, the course was offered as a 5-study point course (ECT) and a traditional lecture-based course with a final exam (multiple choice and descriptive questions). This course setup was maybe good for assessing the knowledge outcomes but not the skill and competence outcomes.
In the following subsections, the course historical background, course setup (modules and timeline), concept assignment, gamified flipped classroom, game boards, and game-playing approach are described.

2.5.1. Course Historical Background

Since 2017, several updates have been made to improve learning outcomes using various emerging teaching, learning, and assessment activities, as illustrated in Table 2. The first update was to transform the course into a project-based learning course to enable students to gain the required skills and competency in this discipline. The course project was used some years ago as an assessment method rather than a learning method. So, it was mostly performed at the end of the course and the learning was not aligned with the project, at least from a time perspective. Project-based learning was selected because there is a clear curriculum that should be covered and there is a clear work process and methods that graduate students are expected to perform in the industry later. The course project had to follow specific project tasks; however, to some extent, problem-based learning was also merged into the course project, where a group of students selected a specific case (industrial system or equipment) and explored new monitoring concepts. There were two critical issues to be handled in the next round of the course: (1) students had a lack of skills in analyzing any industrial system and understanding how it works and is constructed and maintained, and (2) there are several concepts that require students to experience them using professional instrumentation and software to gain better understanding and skills.
Therefore, in 2018, the course merged two more learning activities. The first learning activity is the system analysis skills, in which the student has to analyze any industrial system in a systematic and systemic manner (holistic, lifecycle, interfaces). The second activity was to conduct the condition monitoring laboratory, where a new fault simulator test rig was installed at the asset lab at the University of Stavanger and was equipped with a commercial monitoring system. Although the course was still open for single-course students and as an elective course for several study programs, the number of students decreased to 85 in 2018, as the course project started to be more demanding and it seemed that there were other elective courses that were easier to complete. The students performed much better in this course round as systems thinking and analysis skills were embedded in the course project, and more hands-on skills were also gained in laboratory experiments. However, there were some procrastination issues related to student groups and group performance; some students were taking this course as a compulsory course and some are taking it as an elective course or as exchange students.
In 2019, to avoid project procrastination, the project was partitioned into three parts. The students had to submit each part one time and would receive informative written feedback to improve their understanding and grade. Moreover, the compendium, which was based on several chapters and scientific papers appended, was required to be upgraded with more job-embedded content to support the course project in a more practical way. To produce job-embedded content, work processes, methods, and worksheets were extracted from industrial partners and embedded into the lecture notes.
In 2020, and due to the COVID-19 pandemic, the course content was streamed and recorded. The pandemic affected the course project performance as students had to work remotely and we had to assess individual performance in a more robust manner. Thus, in 2021, two assessment activities were added: (1) a concept assignment to assess the student’s understanding of the main concepts and principles and (2) a reflection assignment to assess the individual student’s understanding of the project work, results, and performance. In 2022, a new set of animated videos was created to shorten the recorded videos, and the lecture notes were transformed into a new course compendium.
In 2023 and 2024, a new version of the course was introduced, as the course expanded to 10 ECTs. The expansion was to accommodate several needs as follows: (1) provide more time for students who always express that the project of the course is time-consuming and too much for the 5 ECT course, (2) add new and up-to-date software and technologies required to learn the predictive maintenance module, and (3) offer more teaching time to enable active learning with an interactive digital learning environment (Miro board Miro (2024)). In the Norwegian context, five study points (ECTs) are about five hours of learning per week, including teaching hours and student learning. This practically means that you have two hours of lecturing per week, which is not enough to flip the classroom and perform active learning. With a course of 10 ECTs, the course can have a four-hour lecture and six hours of learning per week. The course evaluation (performed at the end of the semester) shows that students spend approximately 10 h per week, which is a good indication that the course content and projects are in line with the student’s capacity.

2.5.2. Course Setup

The purpose of the course is to enable students to gain the knowledge and skills required for professional condition monitoring engineers. Therefore, students are expected to perform the following tasks: (1) study the course compendium (lecture notes) and perform the concept assignment that counts for 20%; (2) learn signal analysis and perform the laboratory assignment, which counts for 20%; (3) work in a group and carry out the course project together with your group member or alone; (4) present orally the course project (not graded); (5) submit the course project report, which counts for 30%; and (6) perform the reflection assignment that counts for 30%.
The course timeline is designed to start with a traditional introduction lecture in which objectives, modules, assignments, and expectations are clarified, followed by four workshops where the gamified flipped classrooms are conducted weekly, as described in Table 3. Each workshop is approximately three hours (45 min sections and a 15 min break). Meanwhile, students are expected to study the introduction chapter (39 pages) and view 14 videos. In 2024, 26 students registered for the course, and 20 students were active either physically or remotely, with one student who joined one month late.

2.5.3. Gamified Flipped Classroom

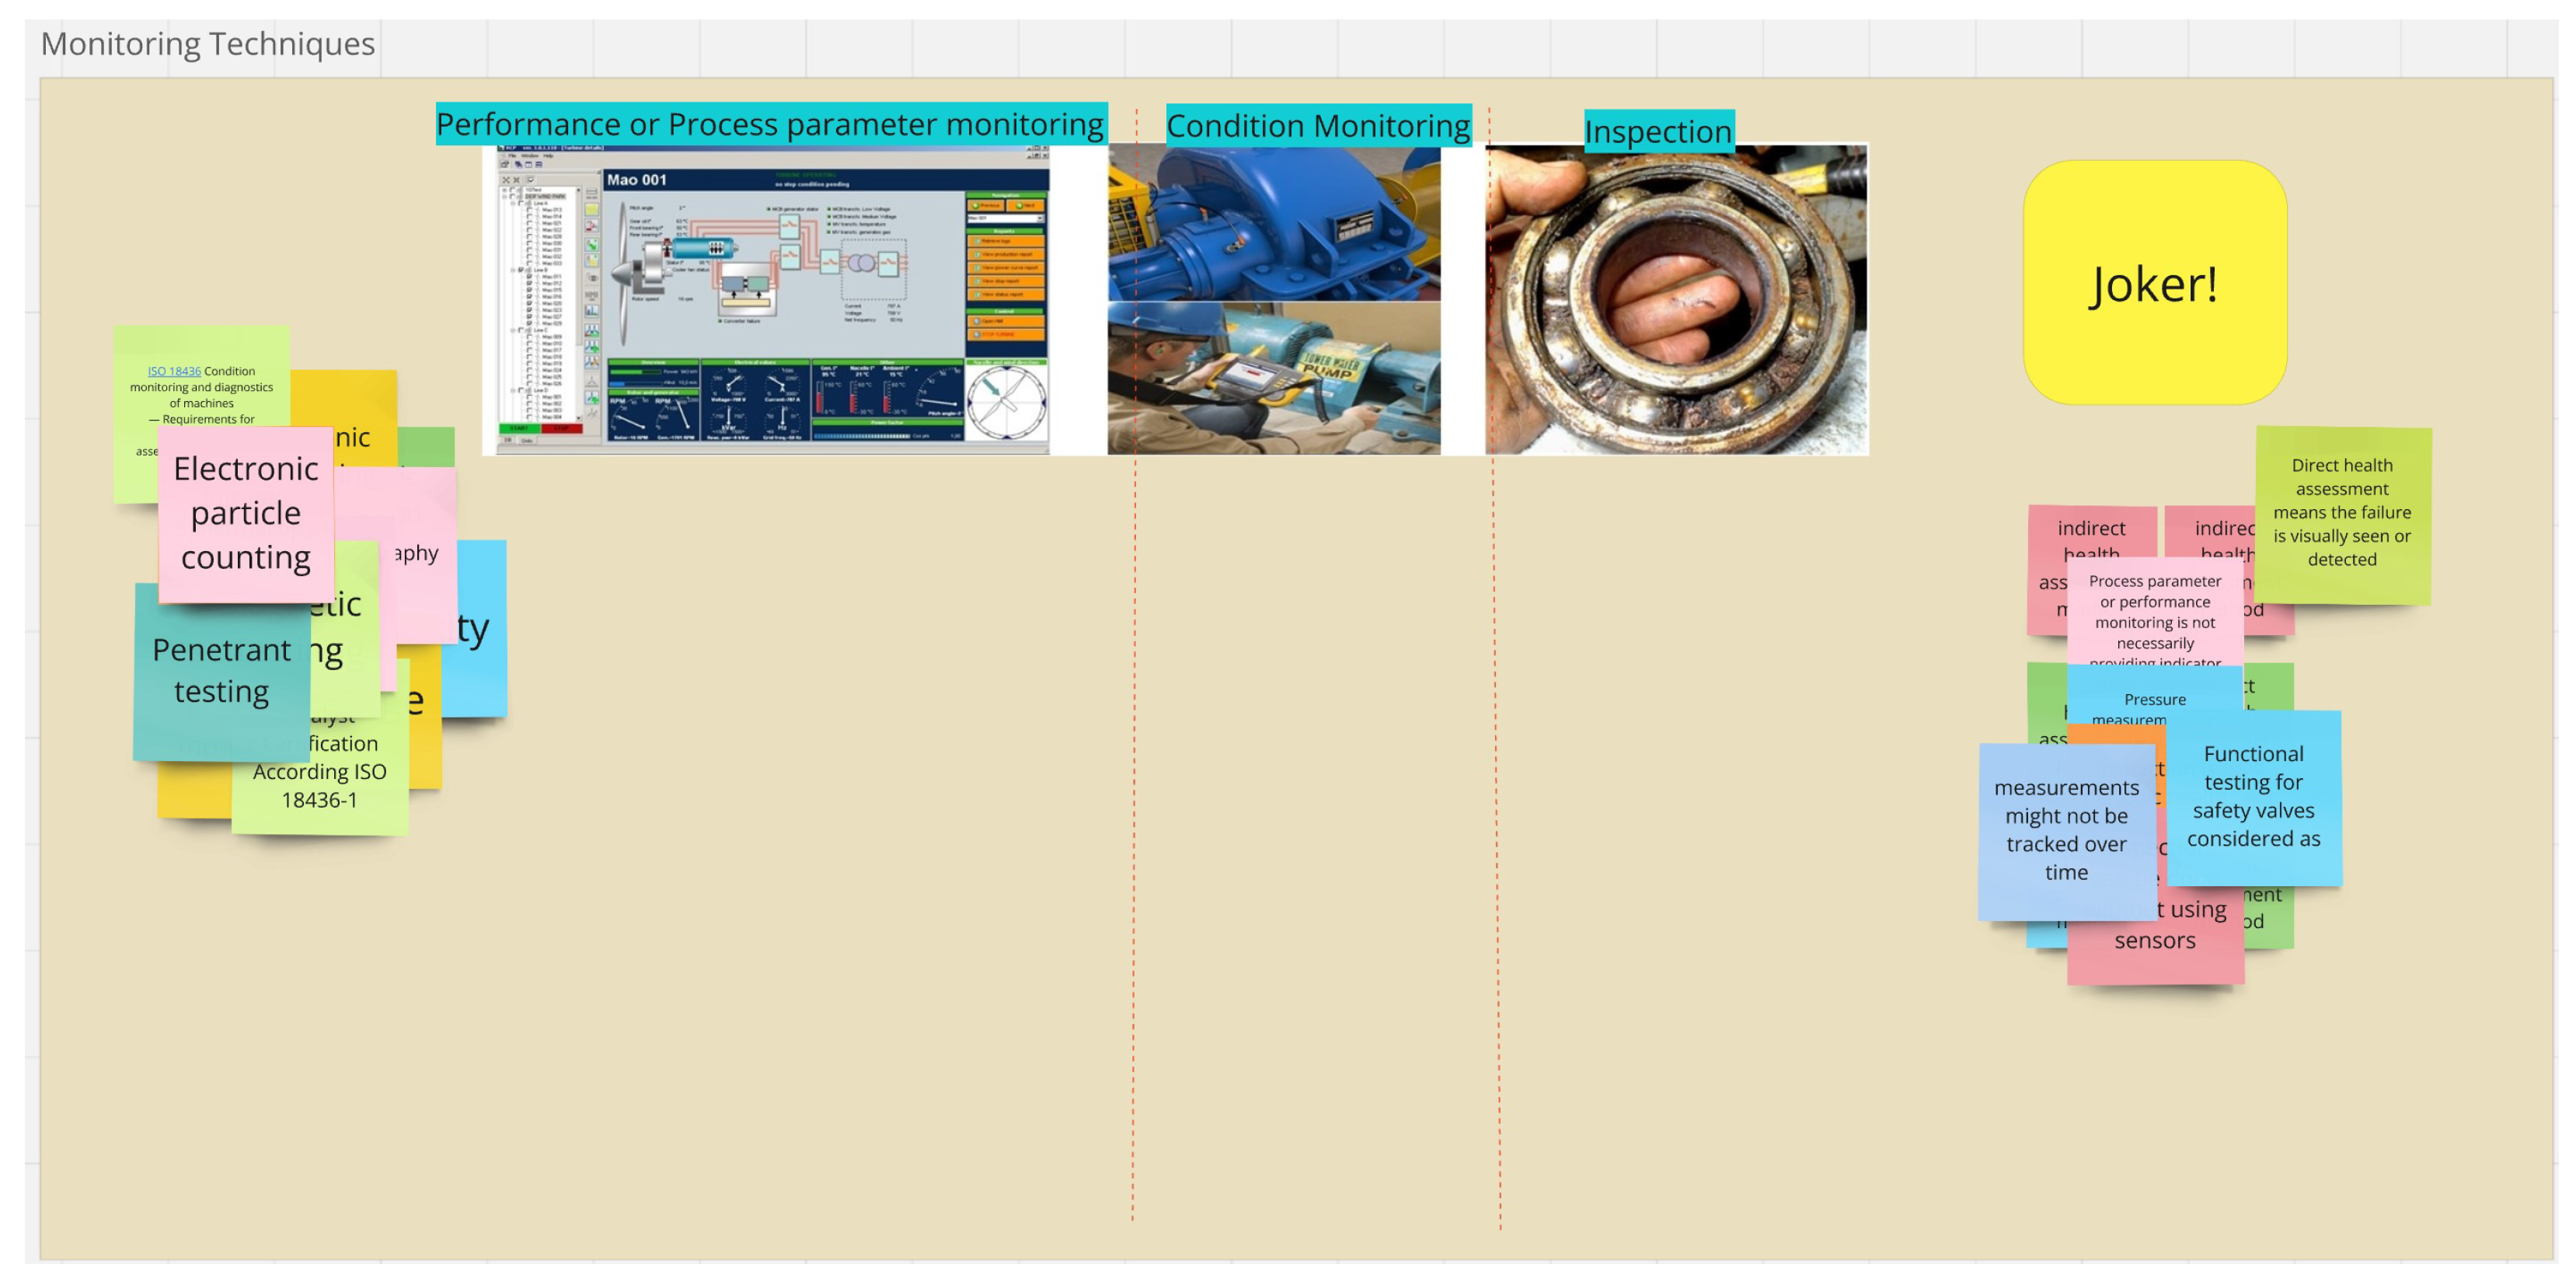
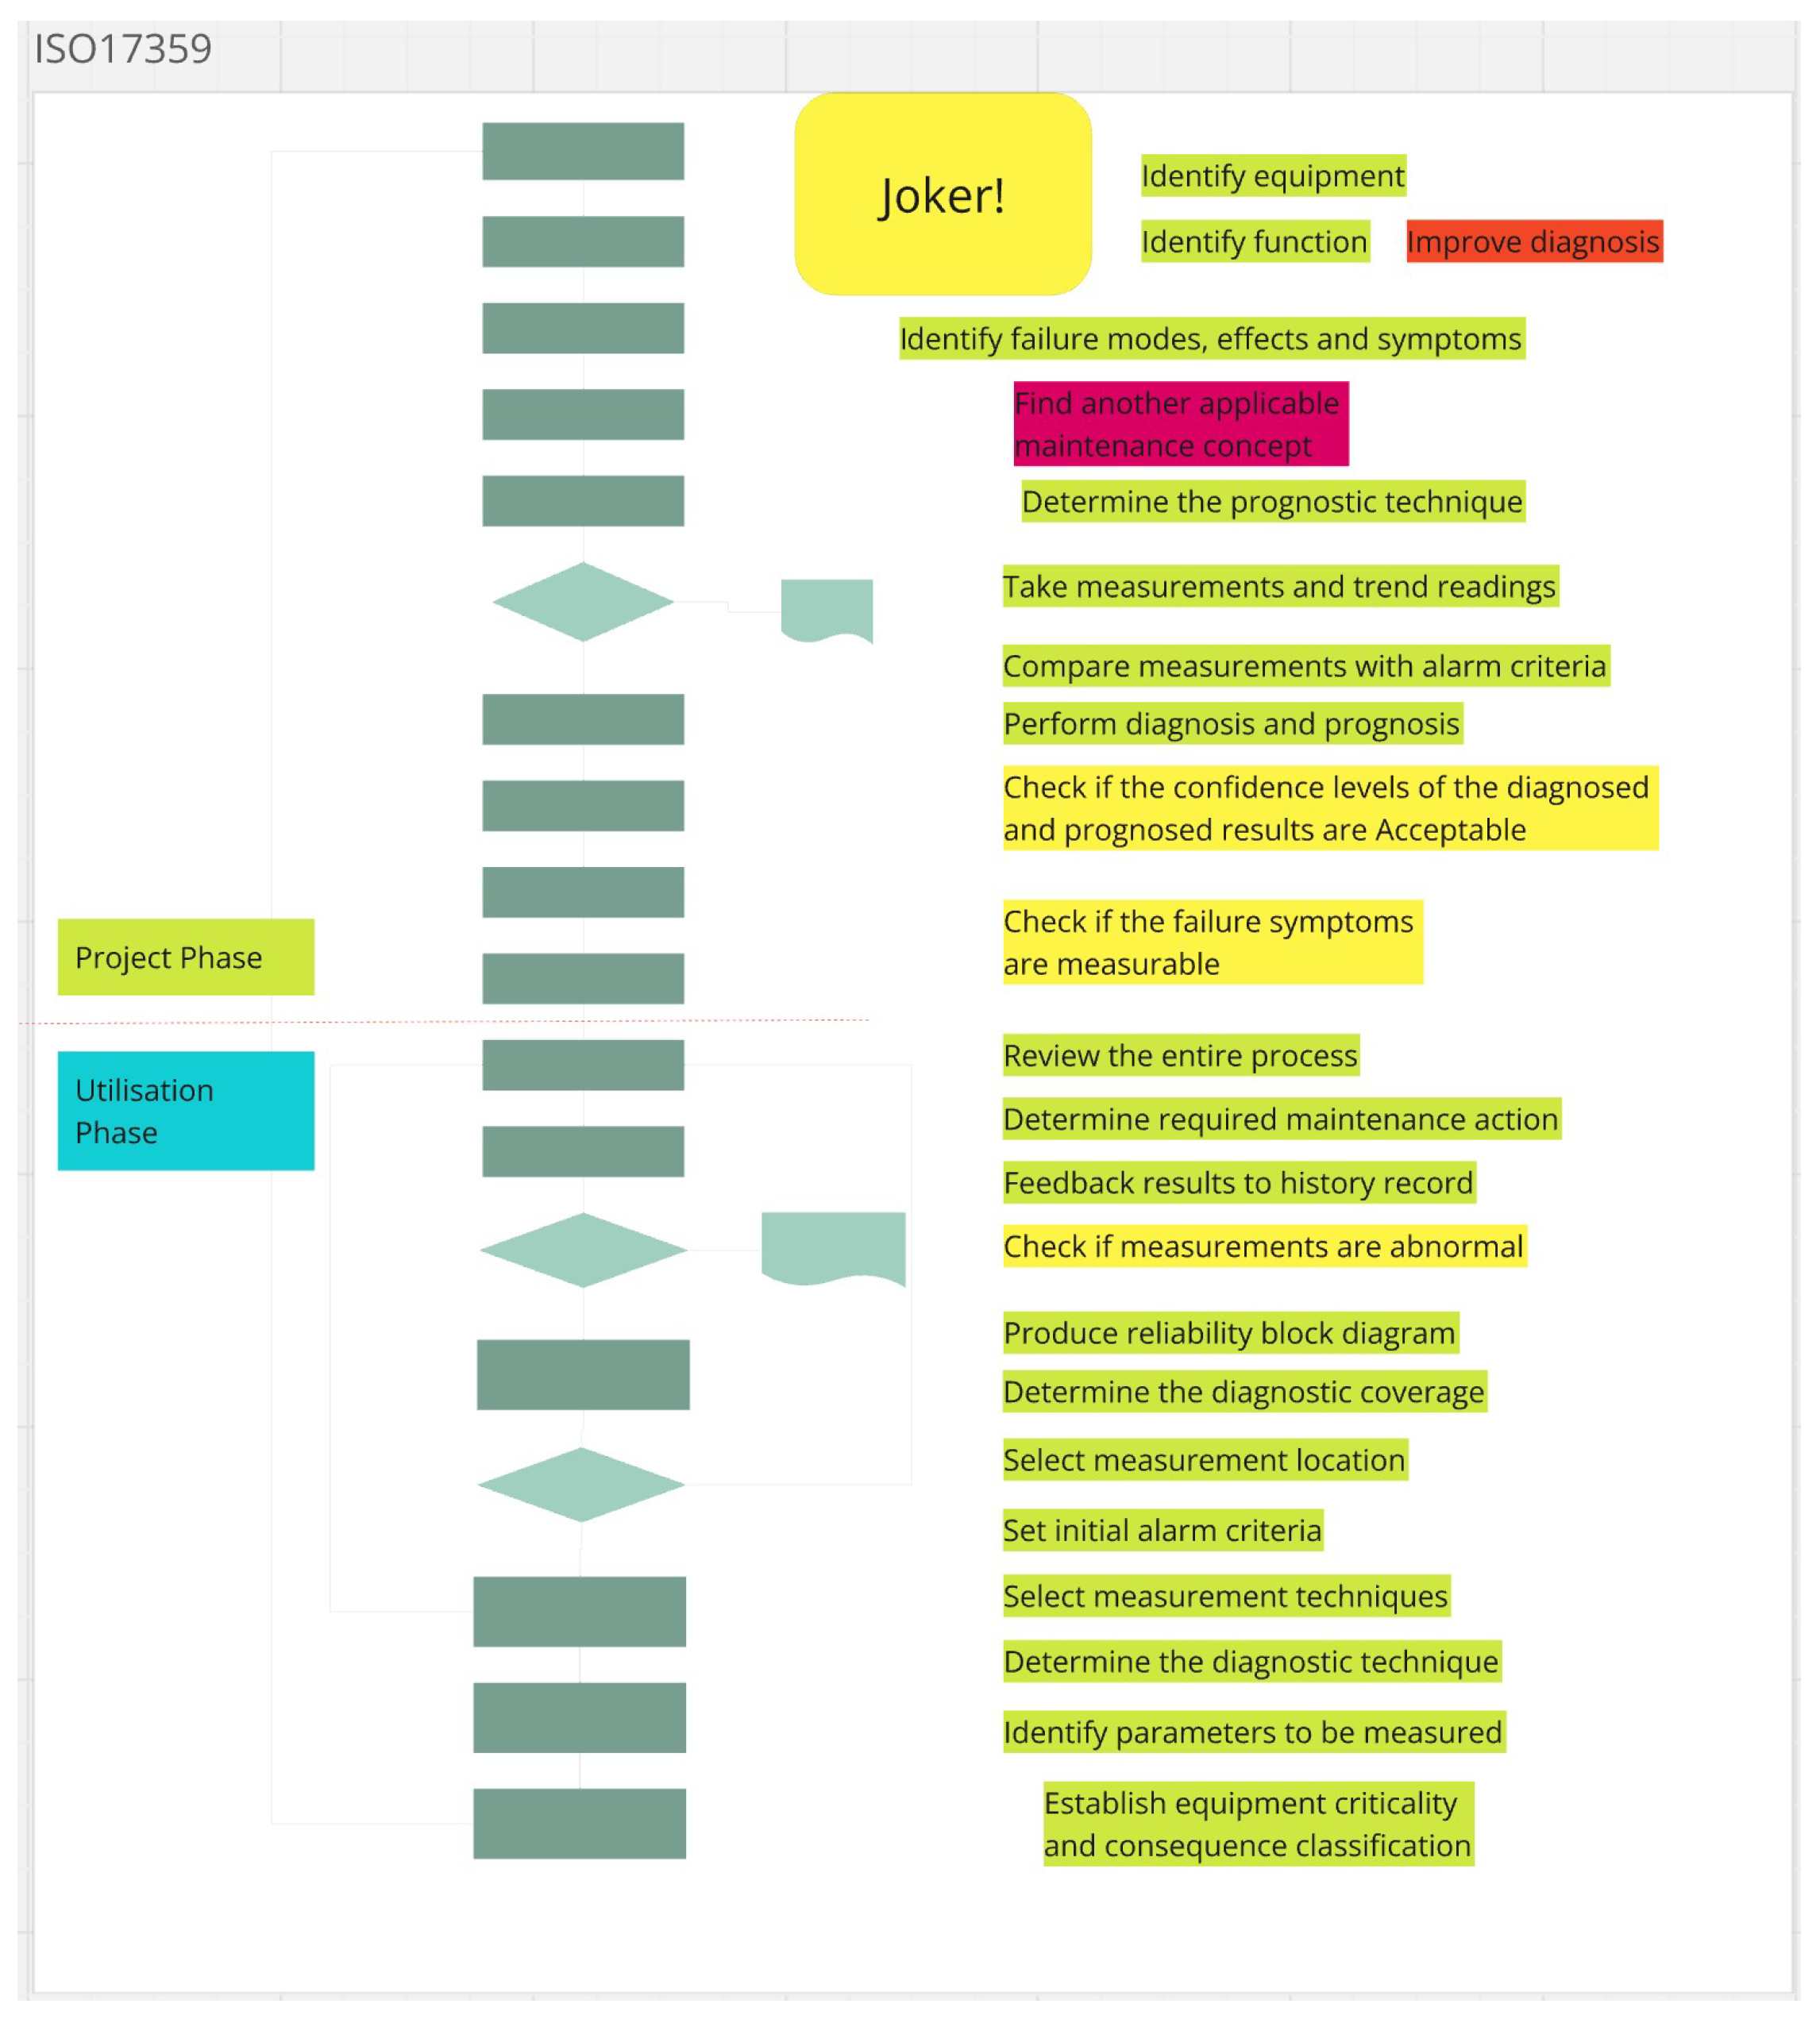
The gamified flipped classroom was applied to support students to participate and engage in the course and enhance their learning concerning concept assignment. There are twelve sets of concepts that are fundamental for students to understand in this course. To gamify the flipped classroom, 12 game boards were created in Miro, as described in Table 4. The game boards have various ways to be played: classify the cards into the correct categories (as illustrated in Figure 2), or place the cards in the right place to construct a work process (as illustrated in Figure 3), curve, equation, etc.

2.5.4. Game Playing Approach

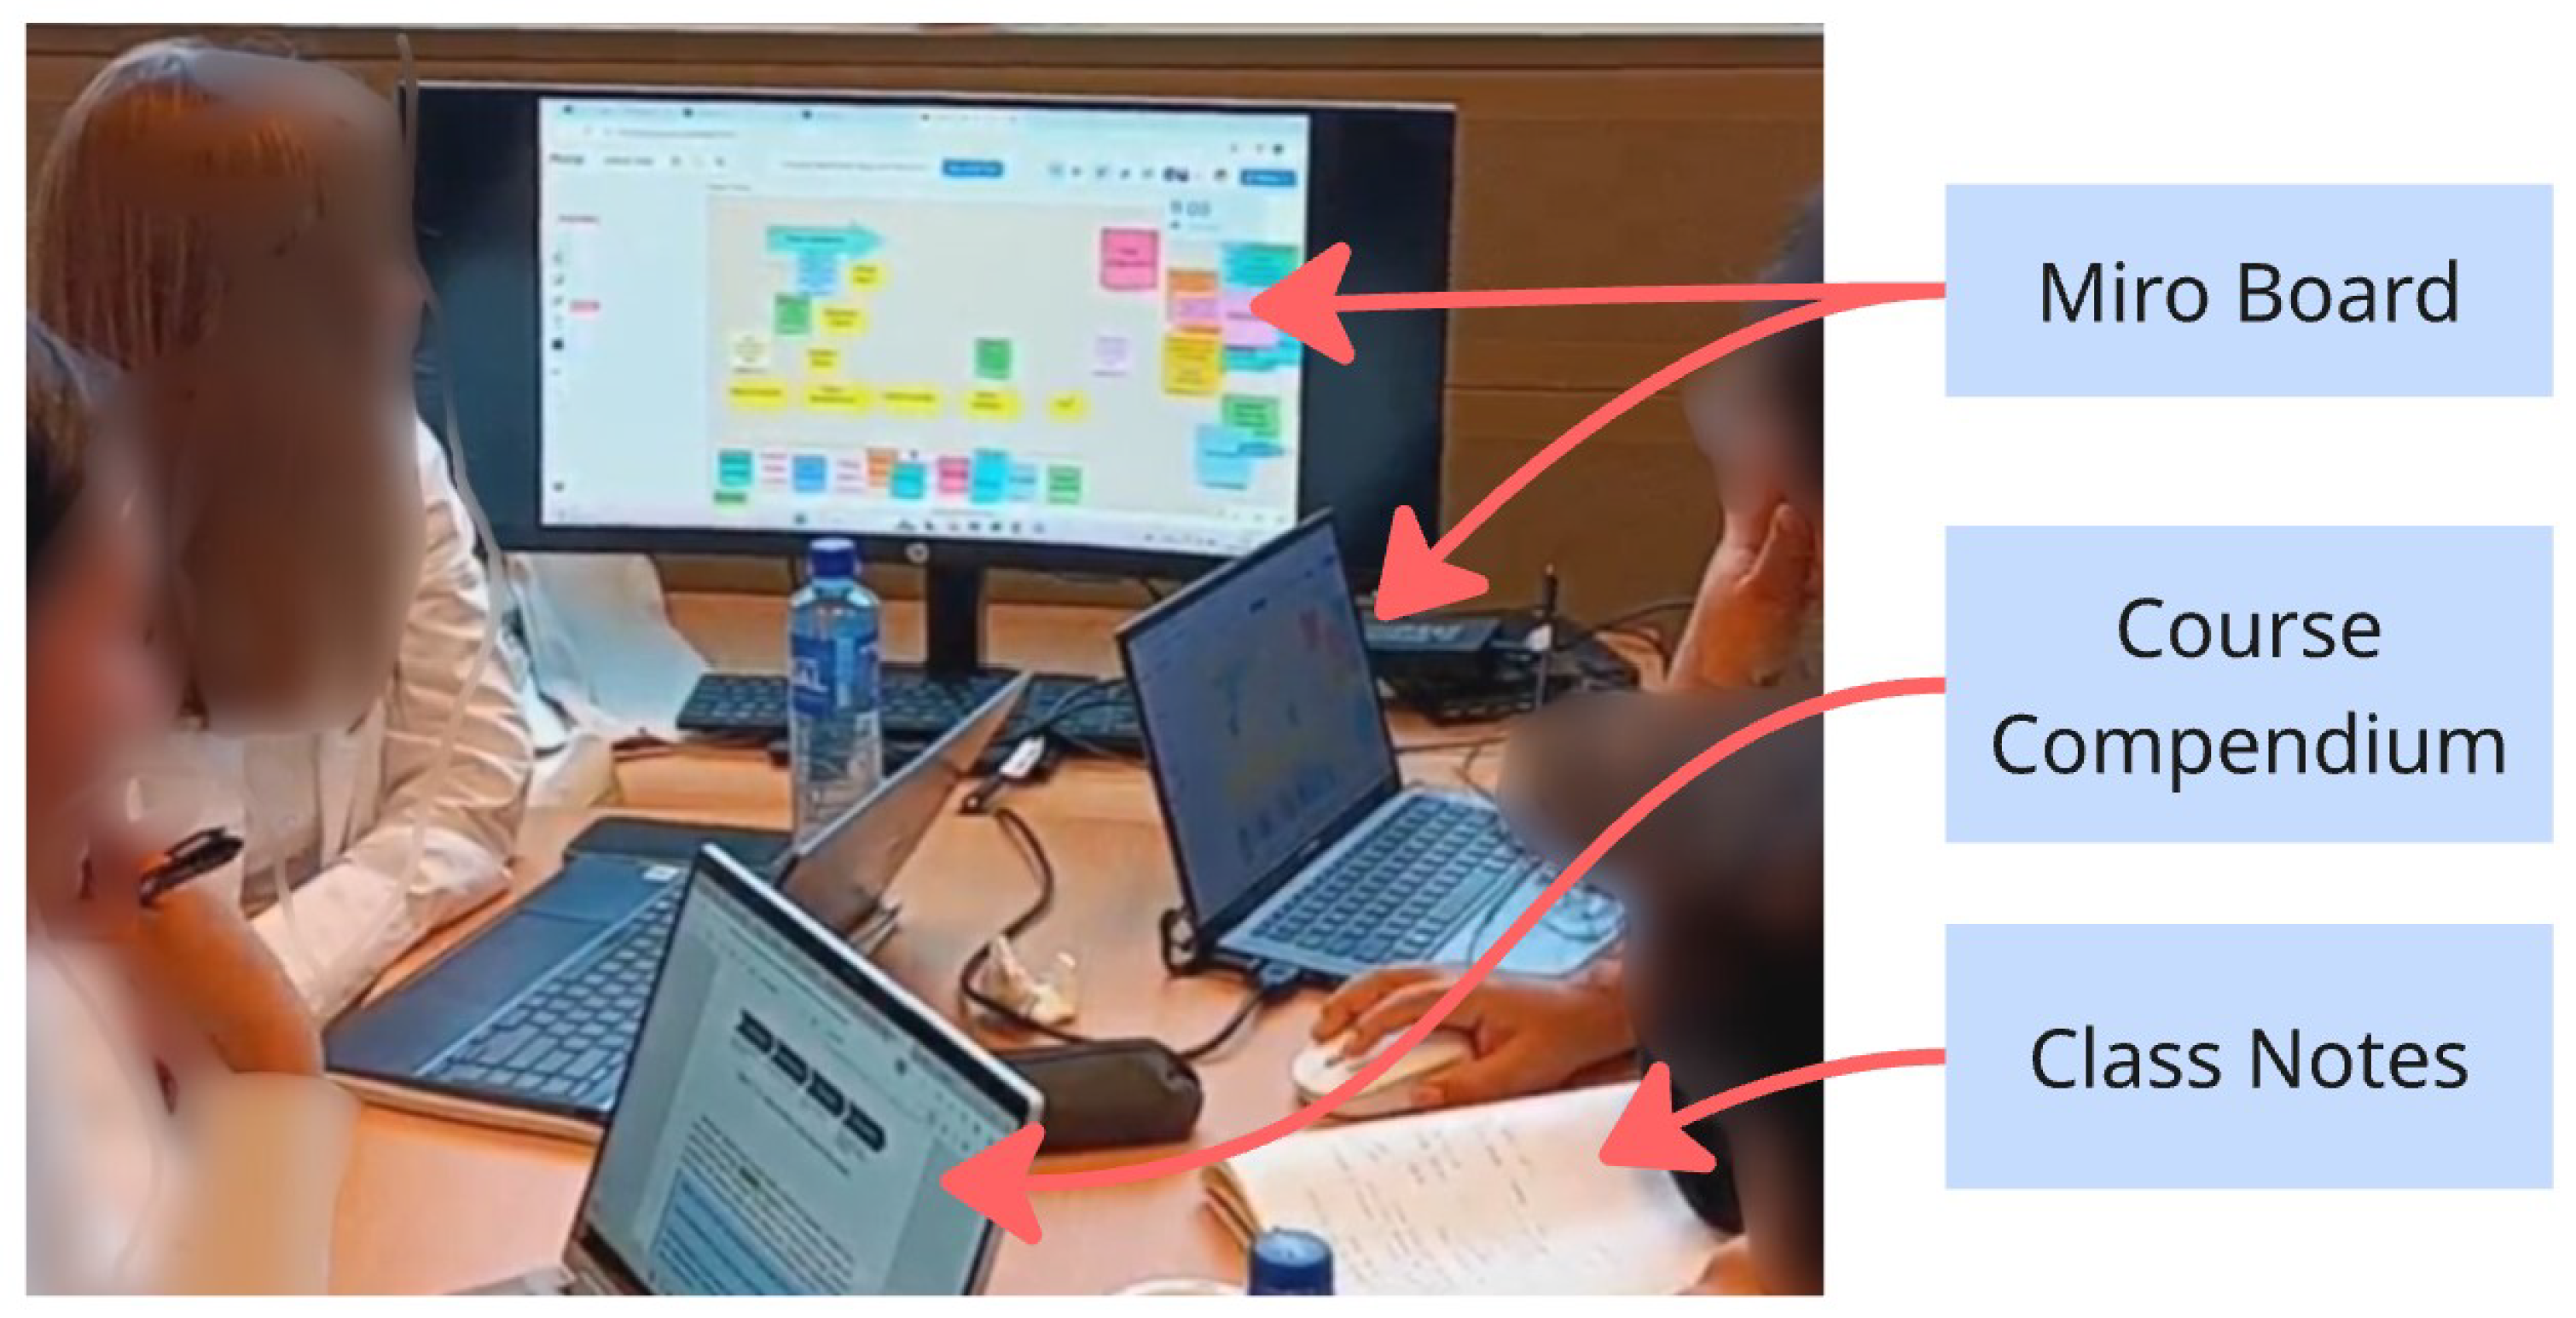
The classroom was prepared for the gamified flipped classroom workshop, where three tables were equipped with a large screen where the Miro game board is visible for all group members and it is easy to zoom in and read the text on the cards. As can be seen in Figure 4, the group members are around the table and trying to read and place the card at the right location, some are reading, some are thinking (e.g., hands on the chin indicate that a person is engaged in serious consideration), and others are reading the lecture notes.
In 2023, the game boards were played in a single round, where each group of students had 15 min to play, and after the time ended, the instructor provided the correct answers with some explorative descriptions. However, in 2024 and at the beginning of the second gamified flipped classroom workshop, students requested a slower and more explanatory mode of play, as shown in Figure 5. Therefore, it was agreed to play multiple rounds (maximum three due to time limitation) until one group had all the cards correctly answered, and after each round, the correct cards would be counted.

2.5.5. Concept Assignment

The concept assignment was introduced to encourage students to study the compendium and follow up at the lectures. The concepts covered in this assignment are fundamental for the student to learn the condition monitoring subject and also to carry out the course project. The course compendium (lecture notes) and the course videos provide clear answers for all questions (shown in Table 5) in the concept assignment. The game boards were created to engage the students, let them read the cards (texts are taken from the lecture notes), discuss, and agree on the answer. Questions (10, 11 and 12) in the concept assignment did not have game boards related, as the teaching staff believed that related concepts could be better explained using the traditional presentation method.

2.6. Methodology

The methodology applied in this study is a retrospective case study for the selected course that had implemented a gamified flipped classroom. As mentioned earlier, the same gamified flipped classroom workshops were conducted in 2023 and 2024, and the level of understanding and misconception were more satisfactory in 2024. Therefore, this study aims to examine and critically explain the higher level of understanding observed in 2024 compared to 2023. Moreover, all learning activities (workshops, assignments, grading) already occurred before the study begins, since the difference in level of understanding was observed after assignments were graded. The retrospective case study approach is effective for critically examining methods, results, and discussions to determine if the conclusion is reasonable and could be applied to practice Kobrin (2016), Nowak et al. (2016) Lobos et al. (2024). Mills and colleagues Mills et al. (2010) highlighted that a retrospective case study is useful when investigators cannot observe events that occurred prior to the outcome. A retrospective case study can also be used to gain a degree of emotional distance from events Al-Najjar et al. (2024) and examine sudden changes that were not expected to be studied Pilotti et al. (2023) or examine changes in classrooms over several academic years Doron and Spektor-Levy (2019). Mills et al. (2010) stated that all retrospective case studies are characterized by three key elements: (1) data collection takes place after the relevant events have occurred, (2) researchers draw on first-hand narratives and/or archival sources, and (3) the outcomes of the case are already established at the time of data collection. Hess (2004) explained that in retrospective case studies, data are previously collected for some other reason than research.
To answer the main research question of this study, “What are the key aspects that influenced the learning outcome in 2024 compared to 2023?”, several data sets are required to be collected and analyzed. The learning outcomes are influenced by a variety of factors that can be categorized into the level of the learner (motivation and attitude Chen et al. (2023), prior experiences Lim and Morris (2009), instructional (the richness of the learning materials and the level of interactivity Chu and Huang (2024), and contextual elements, mainly the learning environment Creemers and Kyriakides (2010)). Therefore, this study aims to analyze all these aspects in a retrospective approach. This study covered and analyzed the following aspects, as illustrated in Figure 6: (1) learning outcomes in completing the post-class assignment, (2) student self-study performance, (3) student profiles, (4) gamified flipped classroom performance and (5) the course evaluation survey. This retrospective study did not start until the course was completed and the grades were registered. Thanks to digital learning environments such as Canvas and Miro, all teaching and learning activities are recorded and can be analyzed after the course is completed. In fact, what triggers us to analyze this case and write about it is the student performance reflected in the concept assignment outcomes (grades, correct answers, fewer misconceptions) and the course evaluation results. Both sets of results were unique compared to previous years of teaching the same course.

2.6.1. Analysis of Learning Outcomes

The analysis of learning outcomes is based on the student’s written answers to the concept assignment, where incomplete, misconception, and hallucinated answers were analyzed. An incomplete answer refers to a response or explanation that lacks sufficient detail, depth, or information to fully address a question or issue. An answer with a misconception refers to an answer that is wrong or inaccurate. The hallucinated answer in this study refers to a response generated by the student or artificial intelligence that includes plausible-sounding content that is not based on factual information or has high conceptual ambiguity. An example of a correct but hallucinated answer that has added a high level of conceptual ambiguity is the following answer in quote 1.
Quote 1: “Time domain technique is ineffective for Complex Systems, Not ideal for systems with multiple overlapping signals or separating out components of a multi-frequency system”.
—Student 1, Concept assignment, Answer to Question 10
The terms “complex systems, not ideal, overlapping, multi-frequency” are all generic terms and not well defined or specific. To make such an answer clearer and persuasive, explanations and examples are required. For example, the sentence “Time domain technique is ineffective for Complex Systems” shall further define the complexity as “specifically when several components and faults are involved”. The term “not ideal” is not explanatory, as none of the techniques in signal processing can be ideal. The term “overlapping” should be explained with a clear example, as vibrations of two different components might have the same frequency peak and overlap with each other.

2.6.2. Student Learning Performance Analysis

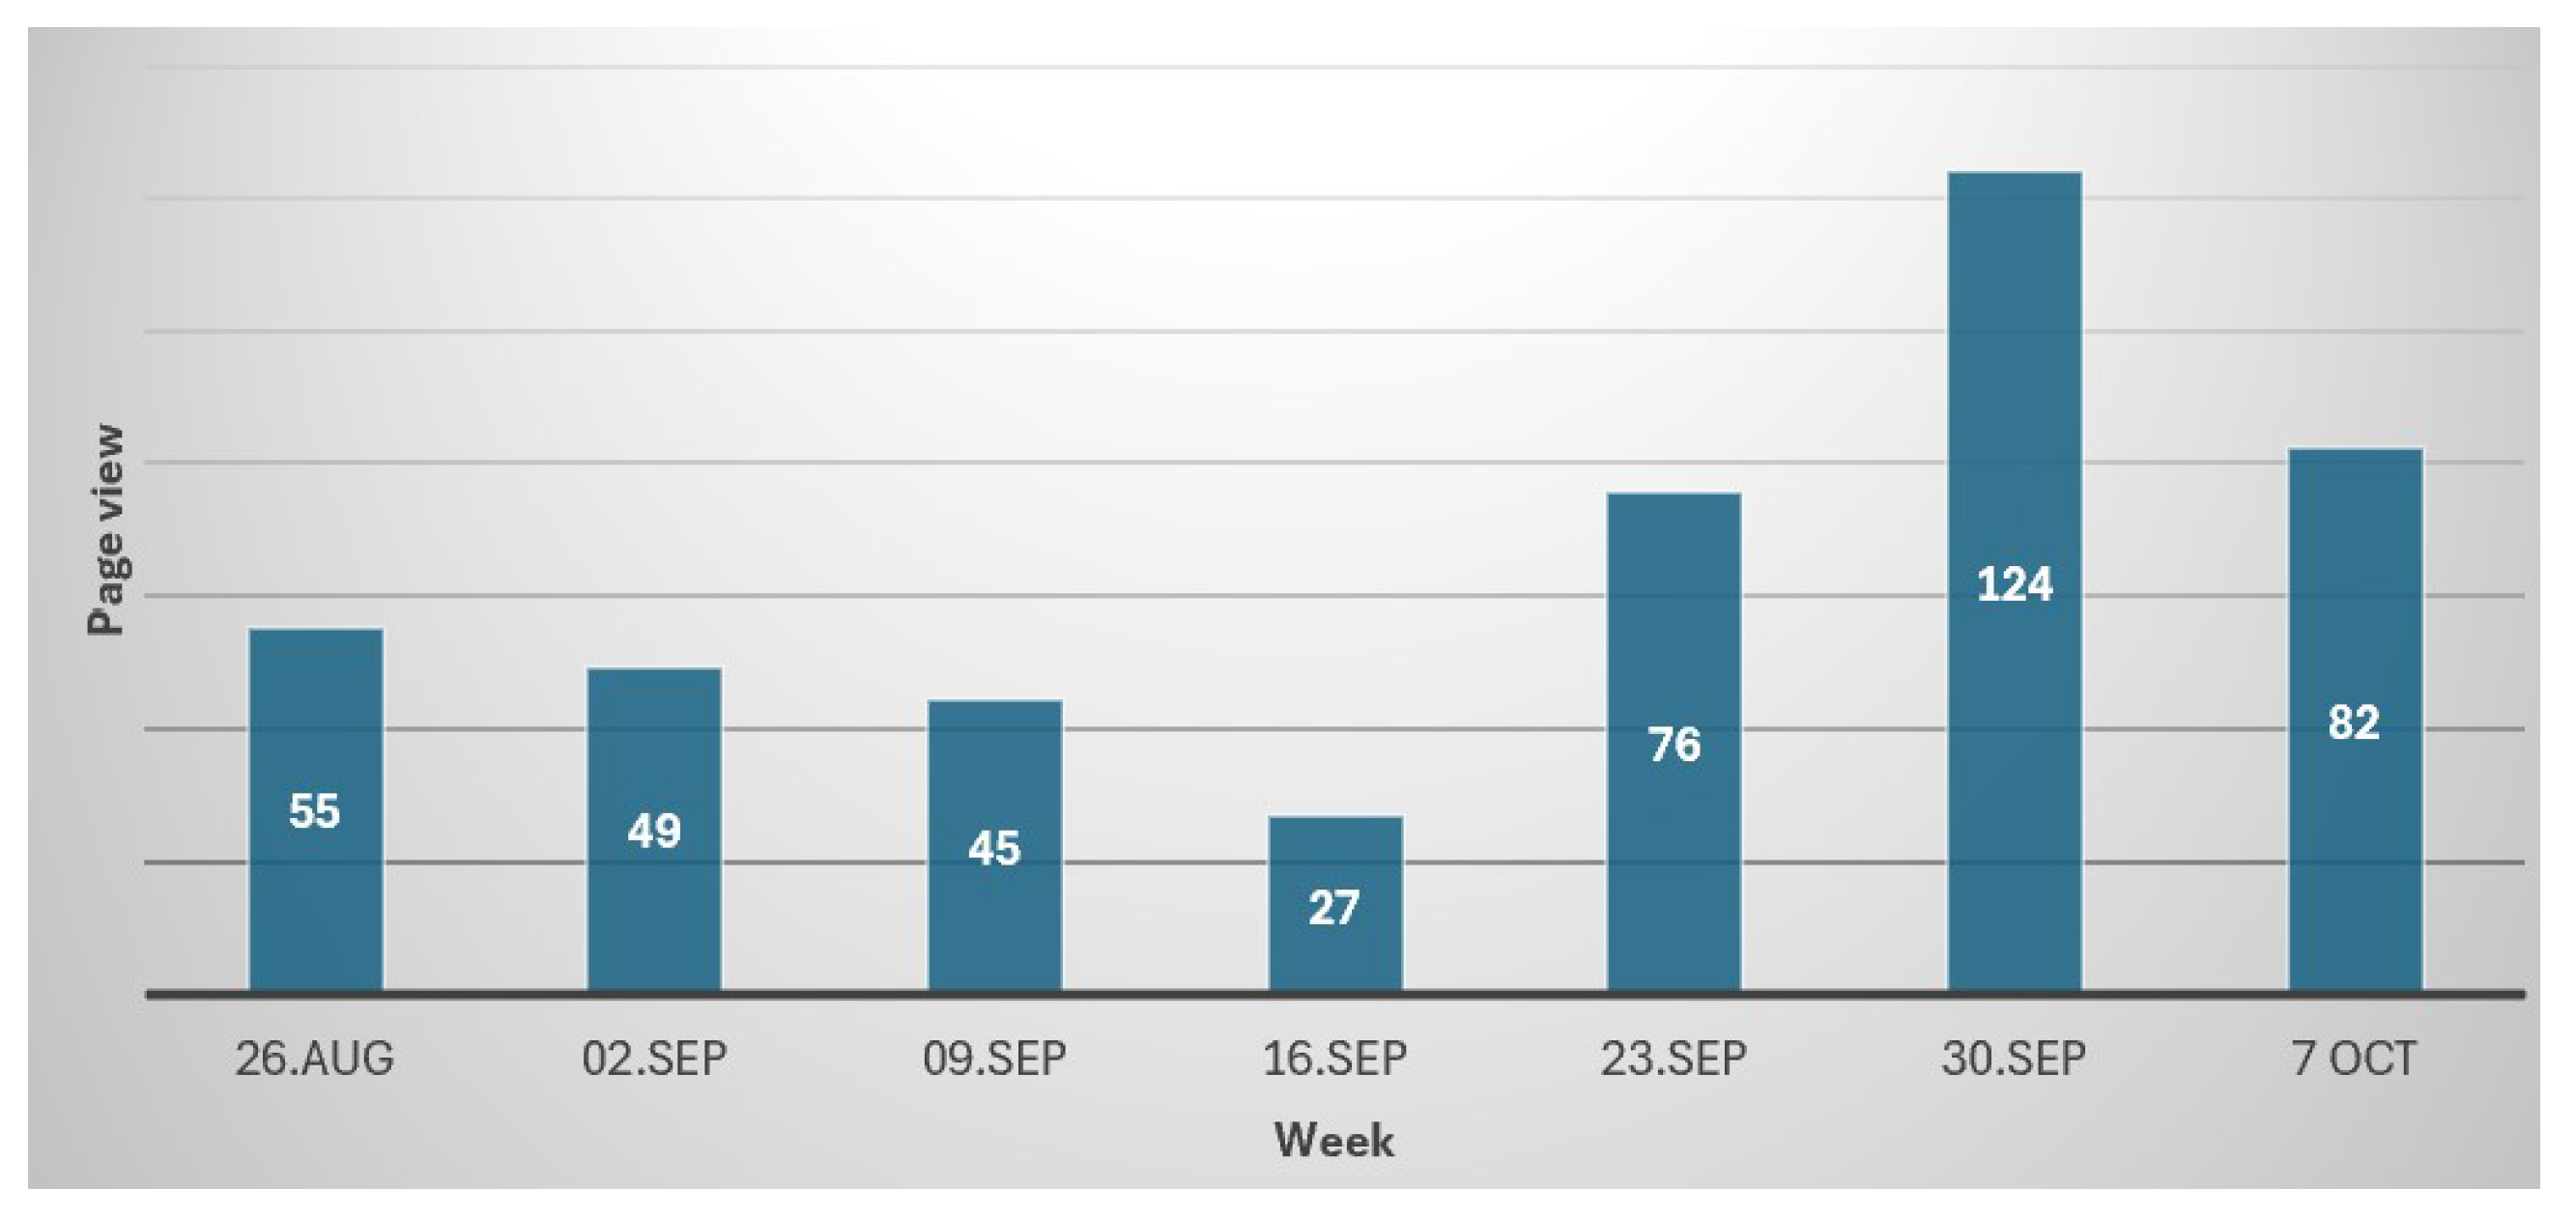
To explore the student learning performance, especially the self-study performance, the course analytics provided by the learning management system (i.e., Canvas) were utilized. Canvas collects data on weekly page views (Figure 7) and detailed video viewing performance (Figure 8).
These two measures provided by Canvas can be effective indicators for self-studying performance. Although these indicators cover cases where students viewed the course pages without studying (e.g., surfing), downloaded the lecture notes and studied offline, or ran the video without watching, these indicators still provide a good generic indicator of the student’s self-performance.

2.6.3. Student Profile Analysis

To analyze student profiles, the main features considered were the type of student (single subject, full-program student or exchange), whether they had relevant experience, whether they were working full-time, self-study performance, and attending gamified flipped classrooms. It is worth mentioning that each student has a unique learning profile or style due to various intrinsic and extrinsic motivations, cognitive abilities, emotional states, prior experiences, and the ability for social interaction. However, based on teaching this course for eight years, it was understood that a self-prediction mechanism of the student learning outcome is heuristically built based on generic student profiles considering teaching activities, self-learning activities, experience, and self-motivation. We usually have students who are engaged and participating in class learning activities and others who are not, due to work conditions, distance, or unwillingness. We also have students who are motivated and have the capacity for self-study and others who are not due to being busy, procrastinating, or unwillingness. Furthermore, we have students who have valuable experience that helps them understand the subject and others who do not. Students might also differ in their goals or intention to study this course; most of the students are taking this course as a compulsory course to earn a master’s degree, and some students are studying this course as exchange students or as a single elective course. Taking into account class attendance, self-study, and experience level, and as a teacher, student performance can be simply predicted, as described in Table 6. Fundamentally, this assumes that students who attend and perform all the class learning activities, perform the required self-study, and have relevant experience would probably achieve high learning outcomes. Students who do not attend or perform class learning activities, do not perform the required self-study, and have no relevant experience would most probably achieve low learning outcomes. Any other combinations will most likely result in medium learning outcomes.
As a teacher of this course, I knew that student outcomes usually followed the normal distribution in previous years, where the mean is around the medium learning outcome, and some students end up with a high and others with low learning outcomes. However, for this course round (fall 2024), the actual student learning outcome was higher than the predicted student learning outcome. In fact, this difference triggered the exploration of this case and prompted me to write about it. To explain the difference between predicted and actual outcomes, a confusion matrix was used, as shown in Table 7. The confusion matrix is a well-known illustration in the machine learning field to evaluate predictive methods in which actual values are compared to predicted values, and missed predicted values are illustrated and counted in overall accuracy. The scores in the concept assignment and the quality of the answers are used to provide the actual student learning outcome.

2.6.4. Classroom Performance and Course Evaluation Analyses

The attendance of gamified flipped classrooms is recorded and considered. The learning performance (correct game cards) in several game rounds is analyzed for each game board and each group of students. The University of Stavanger conducts the course evaluation survey at the end of the course where students are asked to rate and comment on several aspects: study load per week, satisfaction with their own effort, participation in learning activities, learning outcomes, teaching performance, effectiveness of teaching activities, effectiveness of digital tools, communication, feedback, and social and academic environment effectiveness.

2.6.5. Ethical Considerations

Since this study is retrospective, the researcher analyzed the pre-existing data without intervention or manipulation, as there may be power dynamics that affect student responses or grades. Moreover, the behavior of the students was not influenced by observations. However, personal data, for example, names, student IDs, emails, grades, assignments, feedback, and attendance records, are all anonymized to protect student identities. The behavior of all class students was analyzed to avoid bias selection or cherry-picking results to prevent skewed results. The author also presents the data objectively, avoiding overgeneralization or misinterpretation or overlooking alternative explanations.

3. Results

3.1. Observations on Concept Assignment Grades

The first set of results is related to the assessment of concept assignment. The assessment results are illustrated in Table 8 and Table 9 for students who have not attended the classes and students who have attended the classes, respectively. In general, the question index is a metric used to evaluate the overall performance or difficulty level of a particular question based on how students respond to it. This index helps assess how well students understood the material, and it can be used to identify questions that might need to be reworded or re-evaluated for clarity or fairness. In this case, the Question Index is calculated by summing the marks obtained by all the students for the question and then dividing it by the total possible marks for the question, which reflects the average performance on the question relative to the maximum score.
Question Index = ( Student Marks ) Total Marks Possible × Number of Students
For example, the question index for question 1 is calculated as the sum of students’ marks (8 marks) divided by the total available marks (12 marks), which yields a value of 0.67 (67%) for the given data.
As mentioned earlier, the concept assignment consists of twelve conceptual questions to assess the level of understanding and detect any misconception, incompleteness, and hallucination features. These three characteristics (incompleteness, misconception, and hallucination) have shaped the assessment rubric and the final level of understanding (the key learning outcome in this study). Table 8 illustrates the score for each student on each question; the level of incompleteness, misconception, hallucination; and the final level of understanding assessed. In addition, the question index and the average level of incompleteness, misconception, and hallucination were estimated for the two groups.
The Incompleteness Index quantifies the average number of incomplete items per student, providing a measure of how much information is missing in all student responses. The Incompleteness Index is calculated as
Incompleteness Index = i = 1 Number of Students Incomplete items in each student response i Number of Students
Given the number of incomplete items for six students, 1 , 2 , 0 , 4 , 1 , 1 , the Incompleteness Index is calculated as
Incompleteness Index = 1 + 2 + 0 + 4 + 1 + 1 6 = 9 6 = 1.5
The Misconception Index quantifies the average number of misconceptions (wrong or inaccurate answers) per student, providing insight into the prevalence of misunderstandings in student responses. The Misconception Index is calculated as
Misconception Index = i = 1 Number of Students Wrong or inaccurate in each student response i Number of Students
Given the number of misconceptions (wrong or inaccurate items) for six students, 8 , 3 , 3 , 2 , 0 , 2 , the Misconception Index is calculated as
Misconception Index = 8 + 3 + 3 + 2 + 0 + 2 6 = 18 6 = 3
So the Misconception Index for this data set is 3. This indicates that, on average, each student has 3 misconceptions in their responses.
The hallucination index can be defined as a measure of the frequency or extent of hallucinated answers provided by students or AI, reflecting how often responses contain plausible-sounding but incorrect or ambiguous information. The Hallucination Index is calculated as
Hallucination Index = i = 1 Number of Students hallucinated items in each student response i Number of Students
Given the number of hallucinated items (plausible-sounding but inaccurate content) for six students: 12 , 2 , 9 , 0 , 0 , 0 , the hallucinated index is calculated as:
Hallucination Index = 12 + 2 + 9 + 0 + 0 + 0 6 = 23 6 = 3.83
A comparison of the Incompleteness Index in both Table 8 and Table 9 shows that students who attended the class had higher incomplete answers compared to students who had not attended the class and relied heavily on digital resources (lecture notes, internet, AI applications). Students who had not attended had an average Incompleteness Index of 1.5, while students who attended the class had an index of 2.29. However, in terms of misconception and hallucination, the students who attended the class had lower average misconceptions and hallucinated answers compared to students who had not attended the class. Students who had not attended the class had a Misconception Index of 2.5, while students who attended the class had an index of 1.29. In addition, students who had not attended the class had an average Hallucination Index of 3.83, while students who attended the class had an index of 1.43. In fact, the answers were more persuasive and compact, and one could feel the confidence in what they were answering, compared to the lengthy and ambiguous style of answers provided by students who had not attended the class. However, it should be noted that the high Hallucination Index of 3.83 was related to three students out of six in the non-attending group. It is important to mention that two students from the non-attending class group provided correct answers; however, they heavily used texts from the lecture notes. Although this is normal practice, the answers did not show any self-reflection and did not indicate whether they performed high-order thinking or just read the lecture notes. In terms of question indexes, it shows that students who attended the class managed to achieve better grades for questions 1–9. However, they scored almost the same as the non-attending group for questions 10–12.
In summary, the level of understanding assessed for the entire class level was high. However, it is hard to conclude that class-attending students have higher learning outcomes (level of understanding) compared to not-attending-class students, since there are not-attending-class students who gained high learning outcomes, and some class-attending students gained low learning outcomes. Therefore, student profiles and their study performance shall be individually analyzed with the hope of providing an explanation of these observed learning outcomes (level of understanding). Interestingly, questions (10, 11, and 12) in the concept assignment did not have game boards related, as the teaching staff believed that the related concepts could be better explained using the traditional method of presentation. However, the results for the class-attending students were similar to those of the class-not-attending students, which is not the case for other questions supported by game boards (class-attending students scored higher than not-attending-class students). This could refer to Konopka’s claim Konopka et al. (2015) that “the effective use of these techniques requires a new philosophical stance of both the teacher and the student, and the application of active methodologies is not just limited to ‘try’ a different pedagogical activity with students or to promote debates in class”. As a self-reflection, gamifying the concepts helps the teacher demystify the concepts and allows students to construct the concept themselves, rather than hearing a description of a ready-made or constructed concept.

3.2. Observations Based on Course Analytics

The histogram of weekly page views, shown in Figure 9, illustrates the diverse spectra of page-viewing behavior with a mean of around 30.85 views per week with a minimum of 0 and a maximum of 341.
A more detailed look at the histogram reveals four patterns of views: (1) no views on some weeks, (2) fewer than 30 views per week, (3) between 30 and 75 views per week, and (4) between 75 and 150 views per week. The bar around 341 views indicates an outlier that occurs once and for only one student.
To illustrate page views over weeks, a time plot of average page views over weeks for students who have attended the classes is shown in Figure 10. The course started on 28 August with a traditional lecture on the course objectives, modules, expectations, and assignments. The first gamified flipped classroom workshop was held on 4 September. In other words, in the first two weeks, page views were not affected by gamified flipped classroom workshops, and they were mainly related to the student’s curiosity to explore the course content. In the third week (from 3 to 9 September) and after the first classroom workshop, page view numbers start to slightly increase over the weeks (28, 32, 35, and 40).
On the other hand, the time plot of the average page views in weeks for students who did not attend the classes, shown in Figure 11, shows a decrease in page views in the second, third, and fourth weeks and then a rapid increase (from 27 to 76 and 124) in the last two weeks before the assignment deadline on 30 September, which was later extended to 4 October.
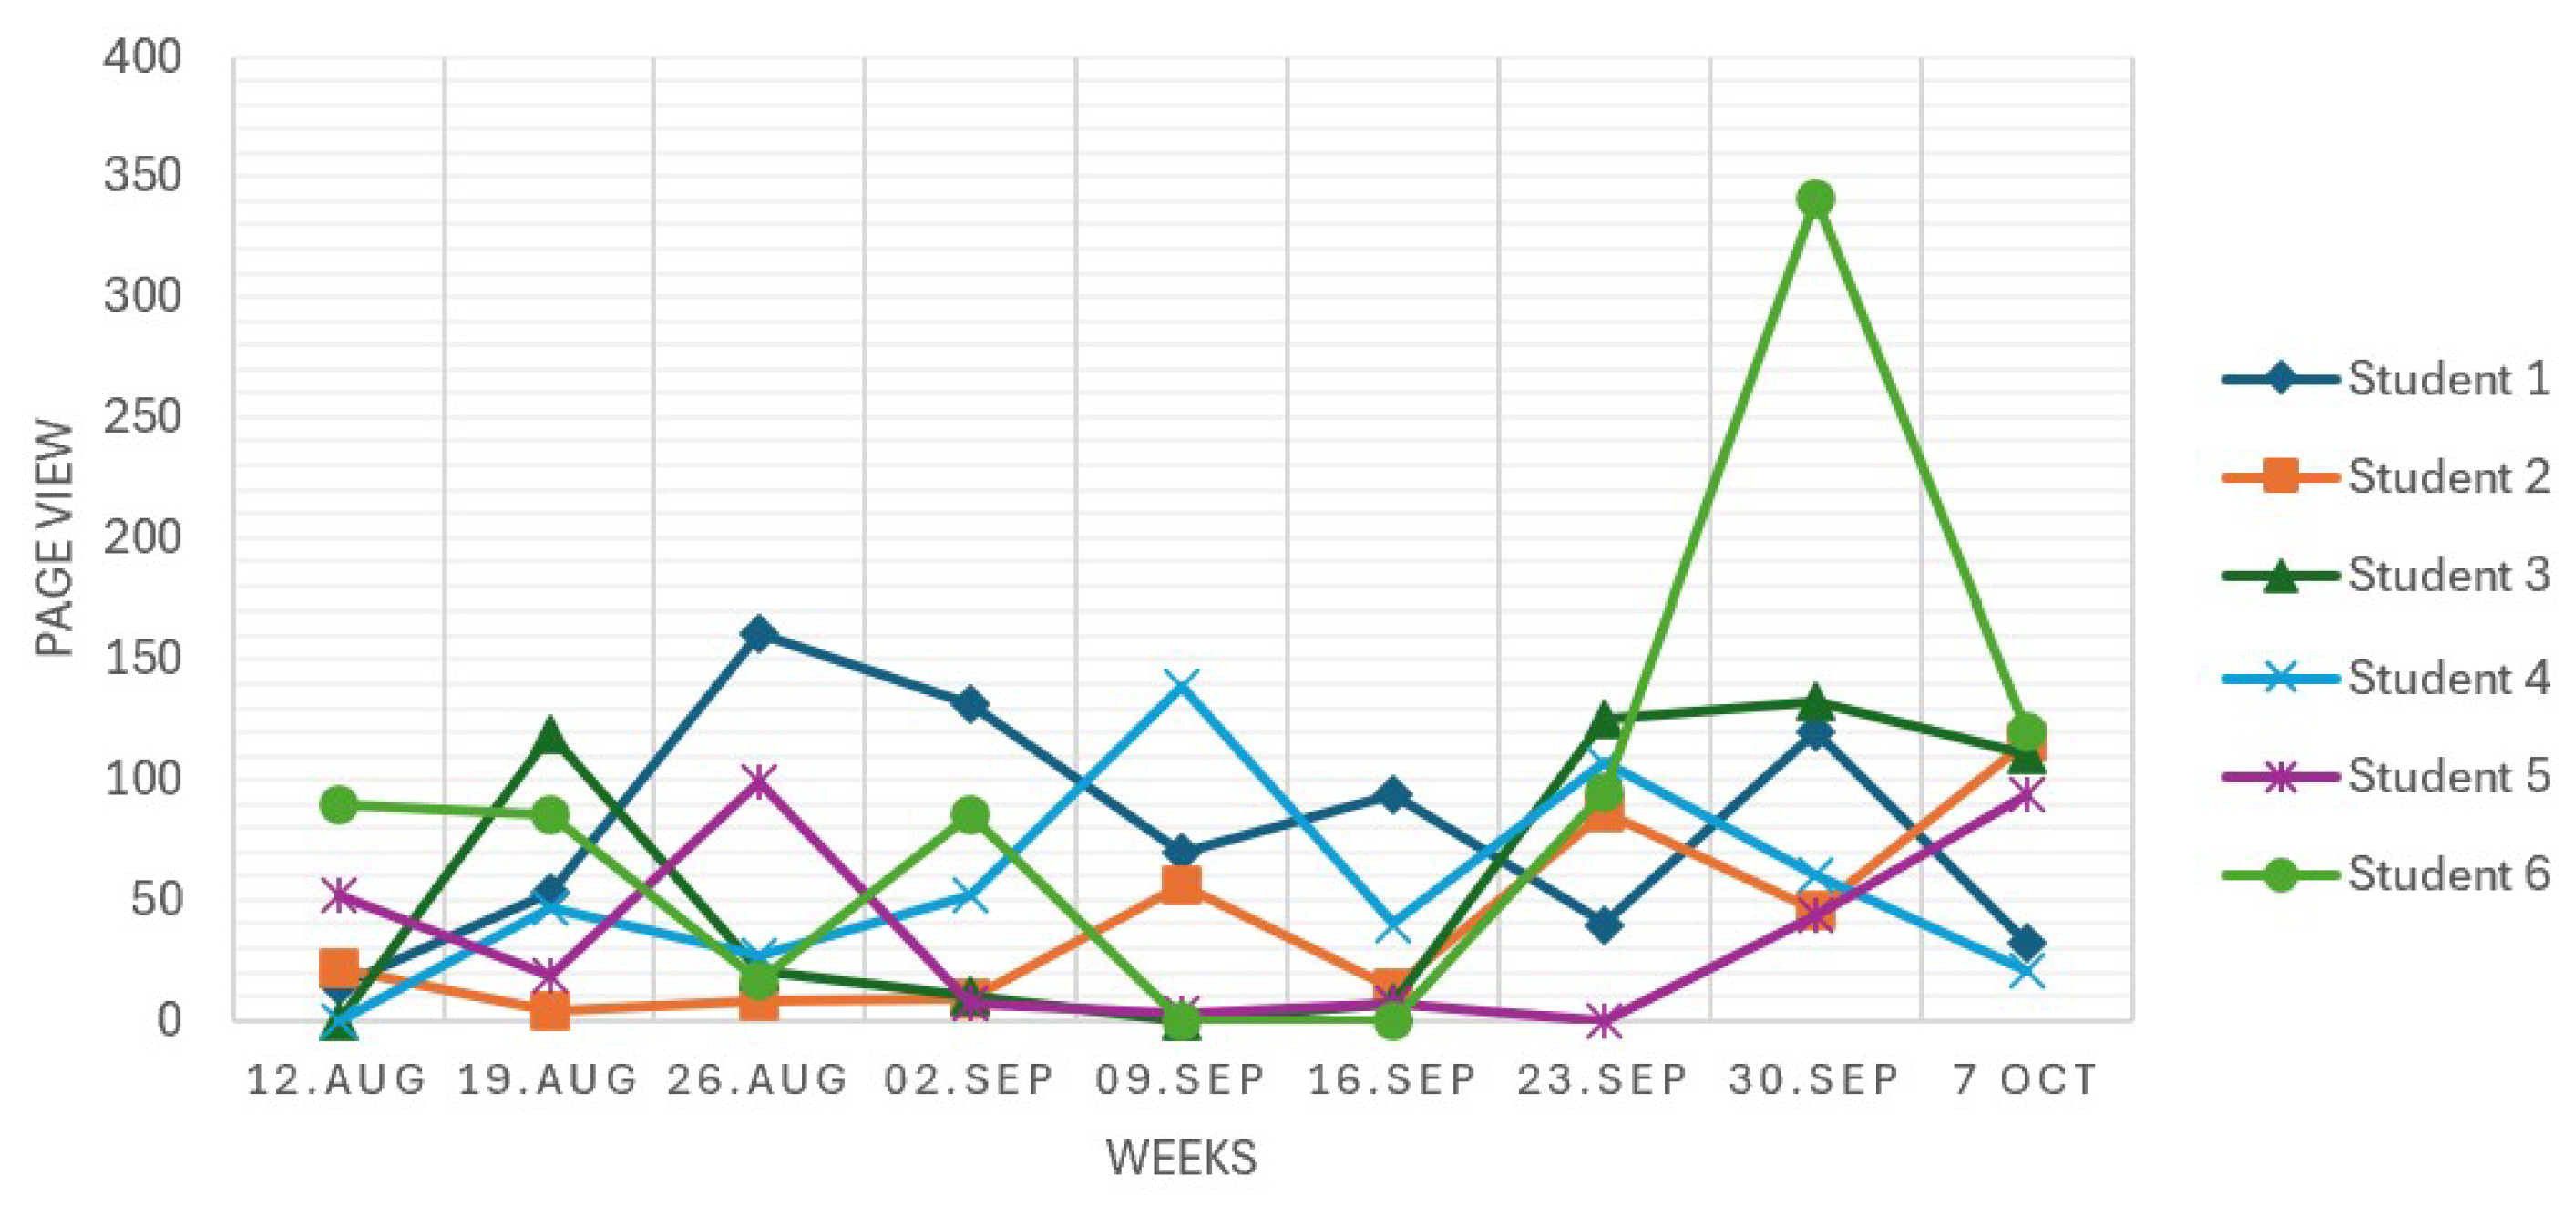
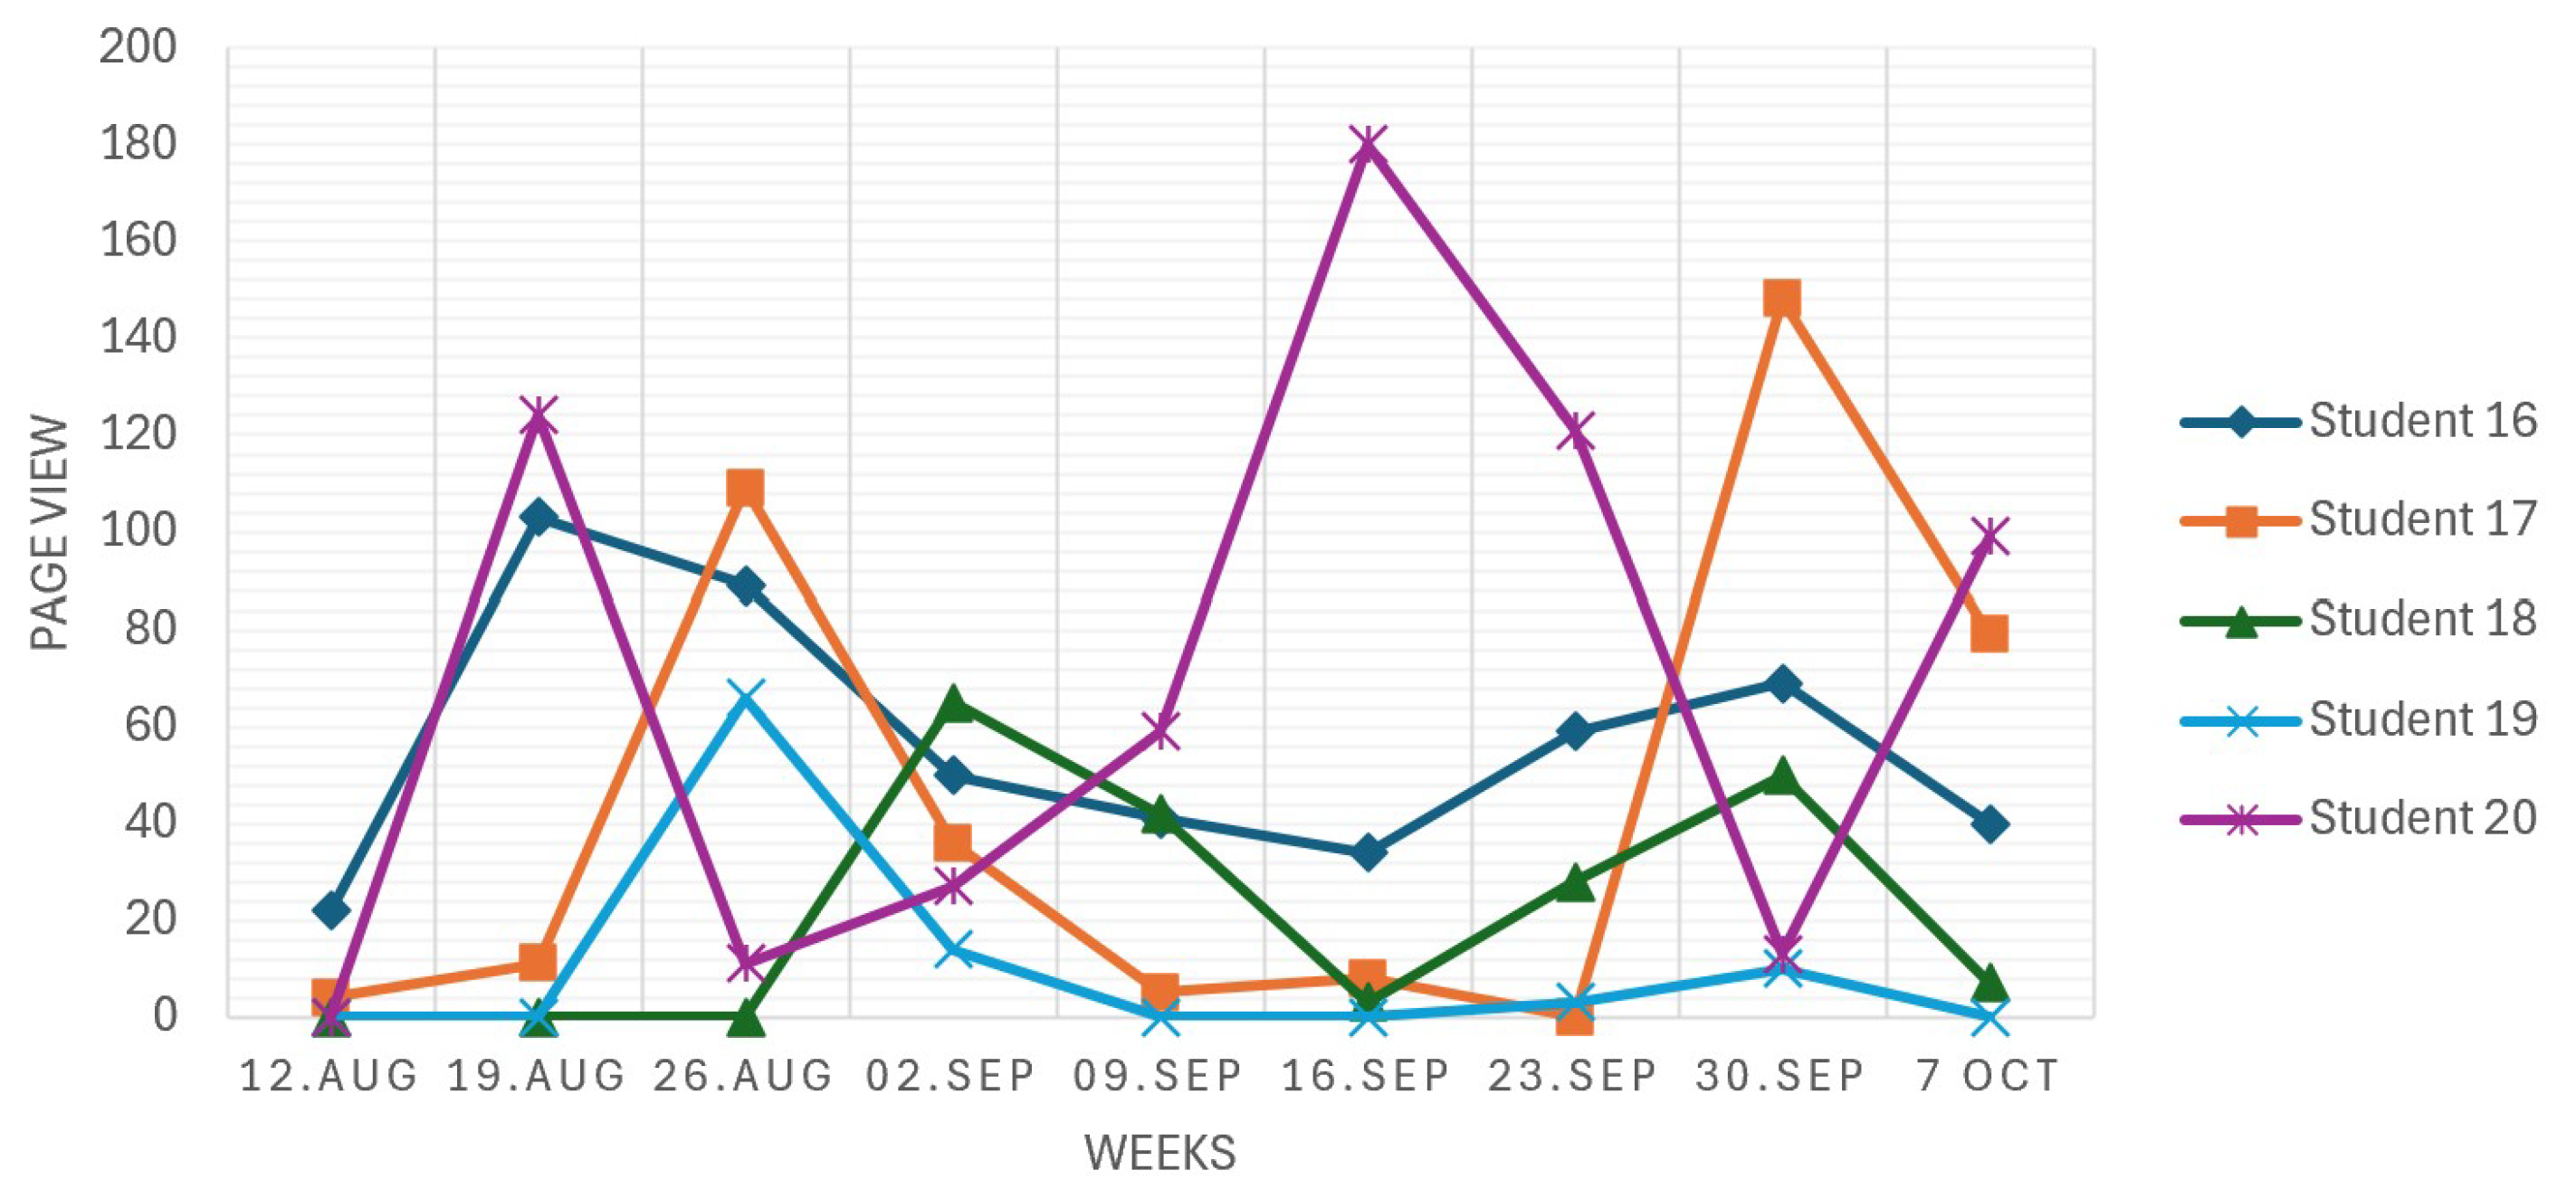
To dig a bit deeper into individual student performance, individual page views over the weeks for students are illustrated in Figure 12, Figure 13 and Figure 14. While illustrating the individual page views for students who have attended the classes, it was noticed that there are some students who are working and have different individual page view behaviors. Therefore, it was decided to split the class-attending student group into two groups; working and not-working students. When comparing the time plots in Figure 12 and Figure 13, it can be observed that non-attending class students viewed the course pages much more than class-attending students. When comparing the time plots in Figure 13 and Figure 14, it can be observed that the majority of students who were working had a low page view rate, with many weeks with zero or a very low rate of views and fluctuating over weeks, while it is more stable over weeks for the students who were attending and not working full-time jobs. When comparing the time plots in Figure 12 and Figure 14, it can be observed that students who worked full-time jobs had similar fluctuating patterns, as all students not attending classes were also full-time workers. For example, student number 2 did not perform self-study during the first weeks. It is worth mentioning that the fluctuation is common in all students; however, the level of fluctuation is higher for students who were working full time.
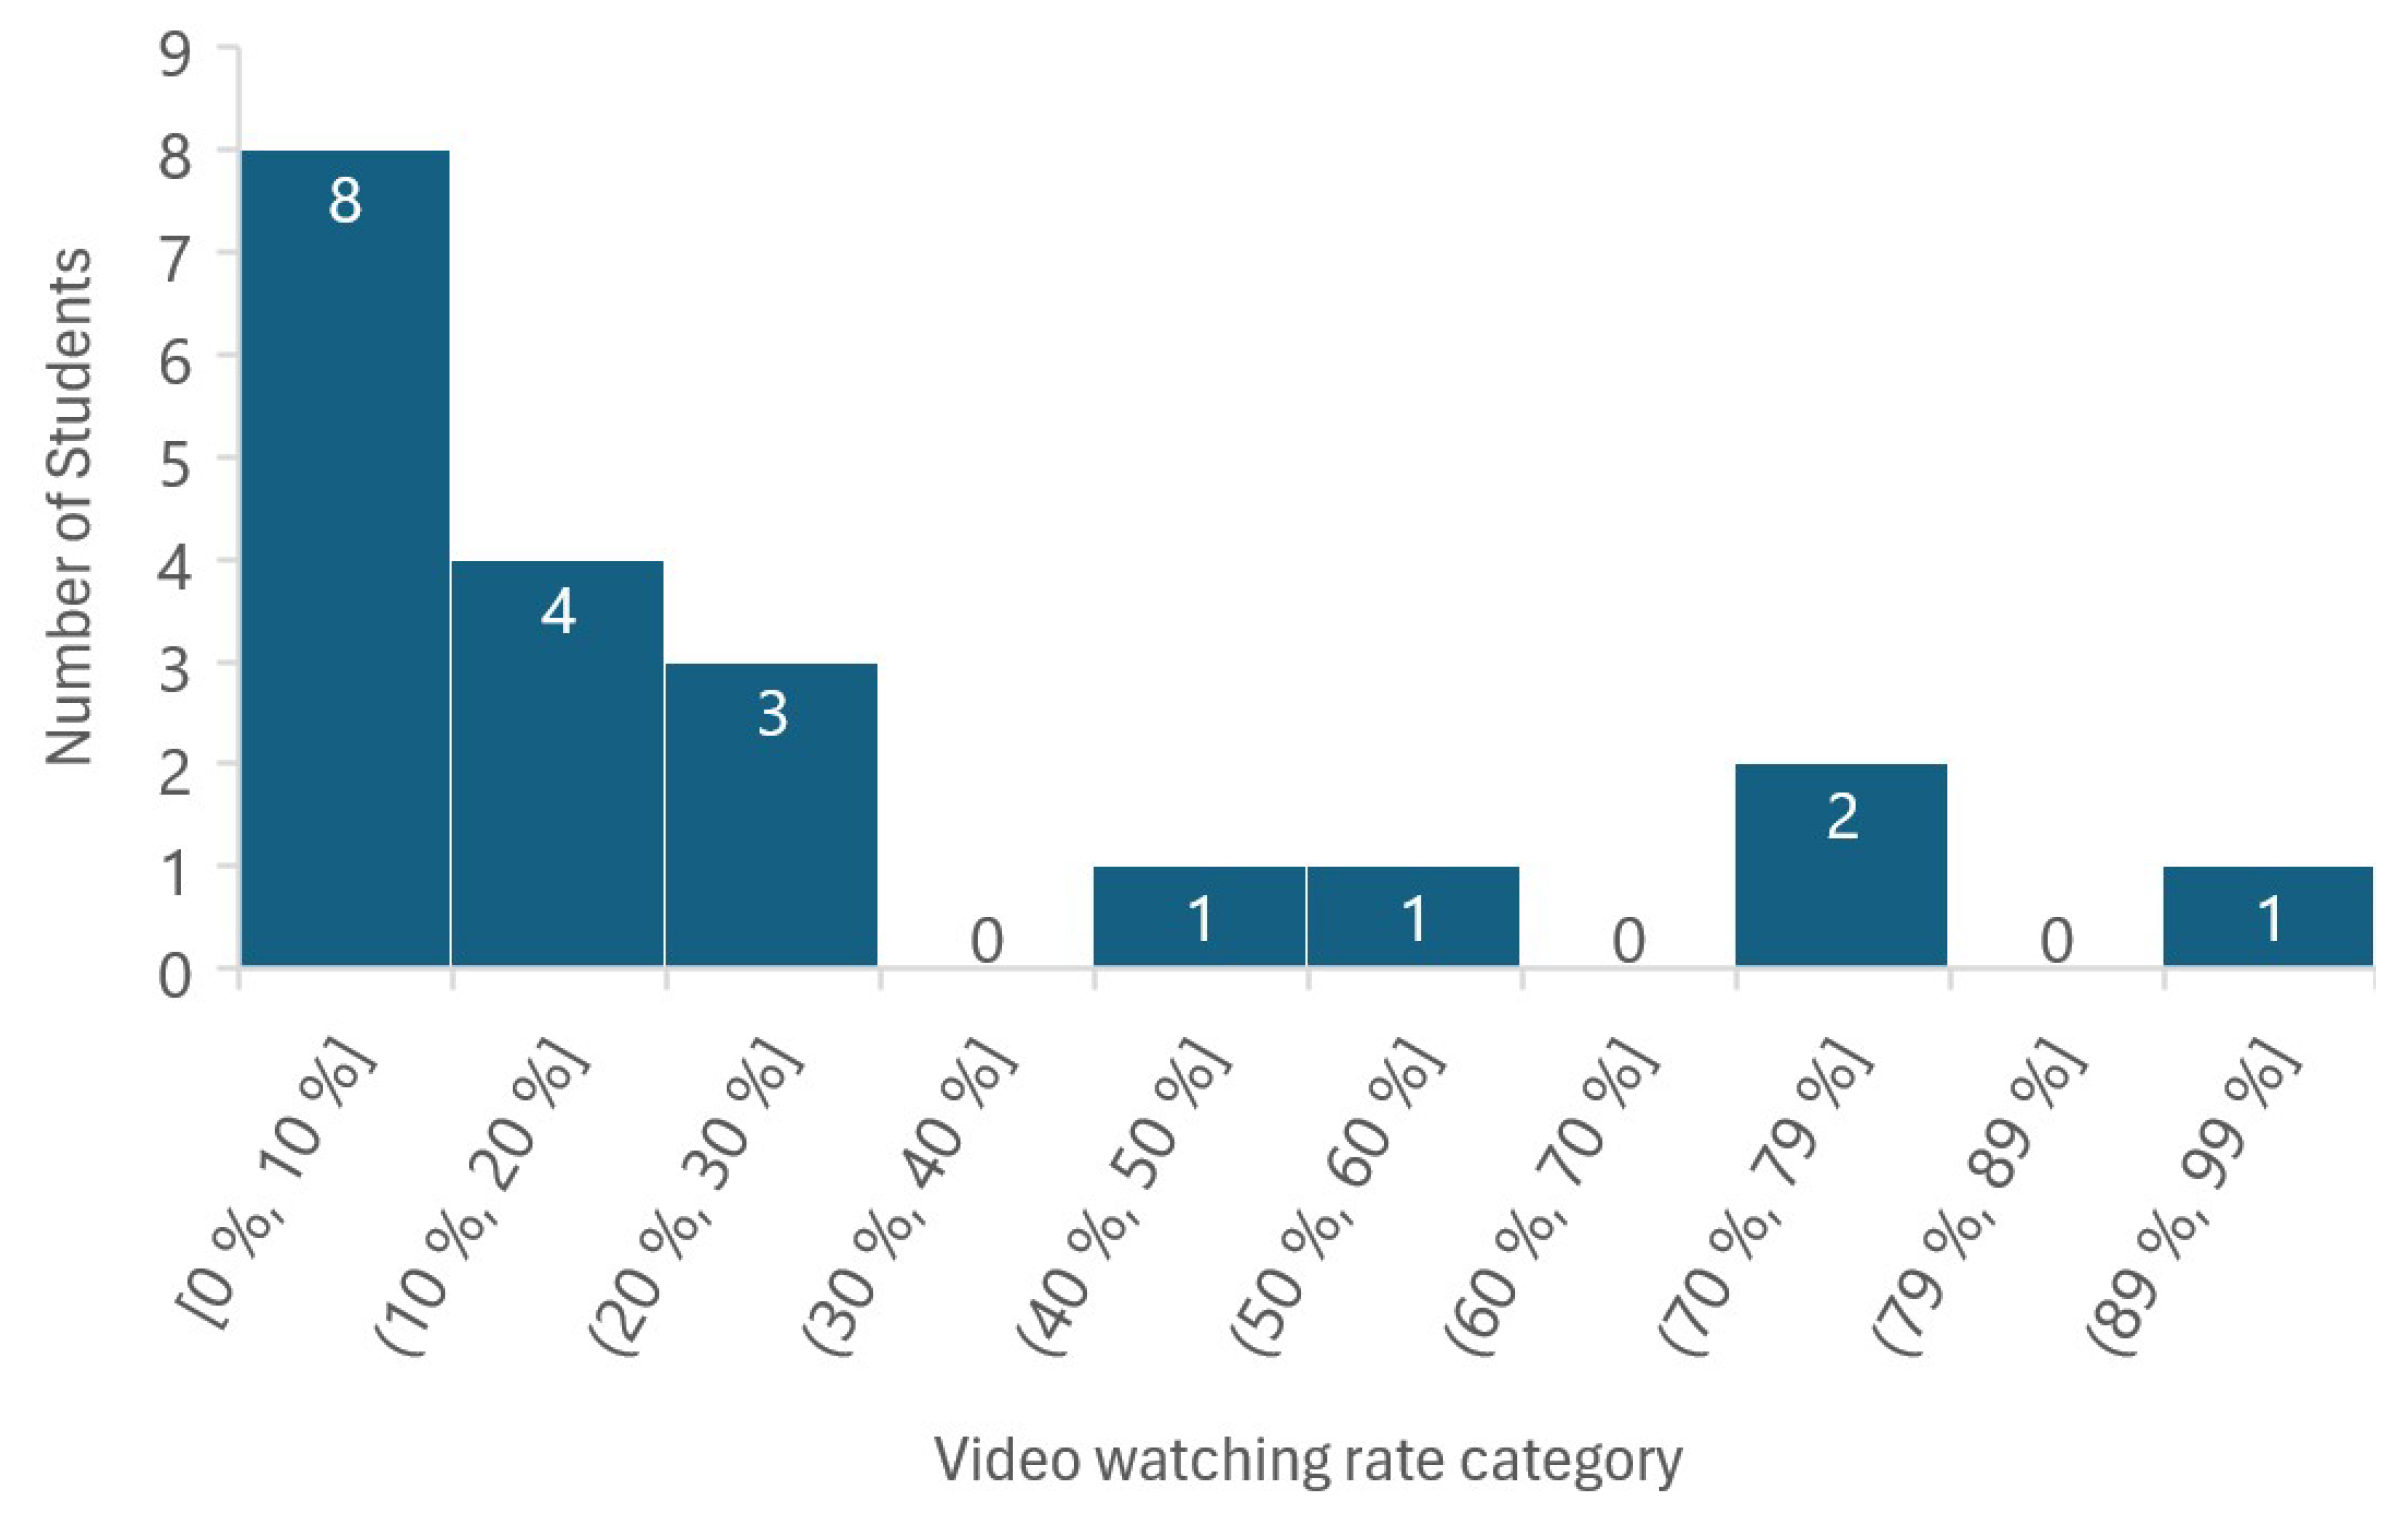
The second indicator of student self-study is the video-viewing rate. The histogram of the video-viewing rate, shown in Figure 15, illustrates the low video-viewing rate, where most students did not view more than 30% of the videos.
Based on observations of page viewing and video-viewing rates, the level of self-study is normal and similar to that of previous years, and it does not justify the actual high level of understanding that was observed in the assessed concept assignment. Hence, the second hypothesis, which claims that the student profile is better than in other years, shall be further explored.

3.3. Observations Based on Student Profiles: Predicted and Actual

Let us start by analyzing the student profiles of the students who did not attend the classes. Student 1 is working full-time and has relevant experience with the subject; her level of self-study is high, as her viewing rates of videos and pages are quite high. The predicted level of understanding or learning outcome was medium as she has a high self-study rate and experience, but lacks participation in active learning activities in the classroom. However, her actual level of understanding or learning outcome based on the assessed concept assignment falls into the low level, where she had several misconceptions and a high level of hallucination due to the use of AI applications. Student 2 is working full-time and has relevant experience with the subject. His level of self-study is medium and lacks participation in active learning activities in the classroom. His predicted and actual levels of understanding were also medium.
Students 3 and 6 work full-time and have relevant experience with the subject; their level of self-study is high and they lack participation in active learning activities in the classroom. Their predicted level of understanding (learning outcome) was medium. However, their actual level of understanding based on the assessed concept assignment was high. This student indicated in their answers the use of lecture notes. Student 4 is working full-time and has relevant experience with the subject. His level of self-study is high and lacks participation in active learning activities in the classroom. His predicted and actual level of understanding was medium.
Student 5 is working full-time and has relevant experience with the subject; the level of self-study is medium and he lacks participation in active learning activities in the classroom. The predicted level of understanding was medium; however, the actual level of understanding was high. This student indicated in his answers the use of lecture notes. This is almost similar to the cases of Students 3 and 6. The student profiles and learning outcomes for each student are summarized in Table 10.
Let us now analyze the student profiles of the class-attending group. Student 6 is not working full time and has no relevant experience in the subject; her level of self-study is quite high. The predicted level of understanding was medium to high, as she lacks relevant experience. Her actual level of understanding was clearly high. Comparing Student 6 with Student 20 where both had a similar level of self-study, Student 20 was working full-time and had relevant experience in the subject. However, both managed to gain a high level of understanding.
The other 12 students who attended the classes showed a low (six students, 12, 13, 14, 15, 18, and 19) to medium (six students, 8, 9, 10, 11, 16, and 17) level of self-study. Of the six students who were predicted to have a medium level of understanding, three (students 8, 9 and 16) actually showed a high level of understanding, two (students 11 and 17) showed an actual medium level of understanding as predicted (medium), and one (student 10) showed a low level of understanding. Students 8 and 9 had a medium level of self-study and no relevant experience; the only difference observed is that student 9 was an exchange, while student 8 was a program-enrolled student. Student 16 had relevant experience and a medium level of self-study. Although Students 11 and 17 had a medium level of self-study and a medium level of understanding, student 11 was an exchange student and had no relevant experience, while student 17 was a program-enrolled student and worked full time with relevant experience. Although Student 10 was predicted to show a medium level of understanding, he ended up with a low level of understanding.
Regarding the six students (12, 13, 14, 15, 18, 19) who had a low level of self-study, Students 13, 14, 18, and 19 managed to show a high level of understanding, although the prediction was that they had low levels of understanding. The difference among them is that students 13 and 14 have no relevant experience compared to students 18 and 19. It is worth mentioning that student 14 is an exchange student and student 18 was taking this course as an elective single course. Student 12 managed to show a medium level of understanding, although he had a low level of self-study. Student 12 had a low level of self-study, no relevant experience, and participated partially in workshops; he ended up showing a low level of understanding and AI-style answers.
The applied heuristic approach to predict the level of understanding based on experience, self-study, and participation in active learning had some false predictions, as can be observed in Table 11 and Table 12. It is evident that there were several factors related to student conditions (health, social, economic) and friendship among students that affect levels of self-study and understanding, motivation, and participation, making each student have a unique profile of learning that was difficult to predict with high precision. However, the heuristic prediction approach was a good indicator to detect if the teaching and learning process is as effective as planned or not. For the non-attending class students, as shown in Table 11, the actual results were better than predicted on the one hand due to the use of lecture notes and worse than predicted on the other hand due to AI-generated answers. For the class-attending student, the majority of the results were better than predicted, as shown in Table 12. The nine students who were predicted to achieve a low and medium understanding level and a high level are a good indicator of the effectiveness of gamified flipped classroom activities. Honestly, the hypothesis in the teacher’s mind after noticing the high level of understanding in the concept assignment was that gamified flipped classroom activities engaged students and motivated them to carry out greater self-study. However, the analysis of self-study profiles shows no extraordinary or high level of self-study compared to last year. In fact, the non-attending class group showed medium to high self-study to cope with the lack of participation in active learning activities in the classroom. In summary, the self-study and student profiles are highly similar to those of last year, and the high level of understanding observed is still not explained, especially for the class-attending students. The last aspect to analyze is the gamified flipped classroom activities.
Analysis of student profiles at the beginning of the course is necessary to plan the learning activities. It is also important to predict the student’s performance in order to plan the learning activities and evaluate the learning activities with the actual performance. This study provided a simple way to utilize the “data already collected” from the learning platform (Canvas) to observe and analyze the student learning performance and outcomes over time in terms of reading, viewing videos, and interacting with curriculum materials. These data would not be possible to extract through interviews or surveys. Definitely, more data were collected that shall be explored and utilized to assess teaching and learning activities. The learning indicator (direct and indirect) shall also be explored and identified; for example, a page view is a more indirect indicator of learning that can indicate different issues for different groups, as class-attending students indicated “read with purpose” and not-attending-class students indicated “surf-reading” or “off-line reading”. In summary, learning data analytics shall encourage teaching to be more predictive and proactive to fit the student’s needs and conditions.
Assuming that student learning performance follows a normal distribution might discourage teaching enhancements. It kind of puts the emphasis on the student type rather than the teaching performance. In fact, teaching and assessing the learning in one specific method will always produce student performance with a normal distribution, as some students might be engaged more than others with that specific method. The applied teaching and assessing methods shall be diversified until all students are engaged and actively learning, and the normal distribution is totally left-skewed to the higher level of learning outcome.

3.4. Observations at the Workshops

The teaching staff (teacher and teaching assistant) organized and managed four flipped gamified classroom sessions to cover 12 game boards. Each session had three groups of students; each group consisted of four or five students sitting around a table with a large screen. In general, good engagement and participation were observed in all groups. The game sessions allow good collaboration and communication between the group members; for example, someone was more handy with the Miro board and was in charge of the mouse actions and moving the post-it cards, another was checking the literature, and a good level of discussion was involved before the cards reached their final location. In Table 13, the learning performance (correct game cards) in several game rounds is illustrated for each game board and for each group of students.
Most of the game boards required two or three game rounds, and only one game board was correctly used in the first round (Boards 5 and 6). Please note that the first three game boards were used in the first workshop, where a single-trail game was played. After the early dialogue, the teacher and the students decided to perform multiple trials until all cards were correctly sorted by a student group. It can be seen from Table 13, that groups 1 and 2 were constantly competing to be the winner, although group 3 performed well, but fell behind in terms of time. Moreover, it was observed that several cards were placed in the correct place, however, for wrong reasoning, which was counted as false until they obtained the right explanation. It should be mentioned that the feedback after each game round was given in several ways; (1) only correct cards were identified, (2) only false cards were identified, and (3) peer review between groups to discuss cards in conflict. The feedback method was naturally selected based on the real-time results of the groups.
From a student perspective, some challenges were observed in the first session related to being unfamiliar with the Miro board and how to move, zoom in/out, and navigate; however, this issue disappeared over time. Moreover, the students who had not performed the pre-reading were a bit annoyed as they felt they were guessing the answers during the game. Some of them indicated the need for a pre-lecture before playing the game, as expressed in quotes 2 and 3. The teaching staff decided to provide mini-lectures on demand and after the game was played. In fact, in sessions two and three, there was one mini-lecture as high misconception was observed in all playing groups. Some students, as expressed in quote 4, highlighted that the games were helpful in strengthening the pre-reading understanding.
Quote 2: “They do contribute to my learning and the teacher is very supportive and helpful, but at the beginning of the course it would be useful if some more lectures were held before we did the Miro exercises because now it is more turned into a guessing game”.
—One student out of 21 student, Course Evaluation Report, Question 7
Quote 3: “Keep the exercises but add a few lectures in the beginning to give the students a good foundation”.
—One student out of 21 student, Course Evaluation Report, Question 14
Quote 4: “I didn’t get this issue when I read the lecture notes, the game gives life to the text”.
—One student out of 21 student, Comment after game session 2
From the teacher’s perspective, the game boards help teaching staff and students to observe common correct answers, common misconceptions, and unique misconceptions (within a specific group or group member). The digital game board offered great flexibility to manage one’s time over the entire game sessions. For some game boards, the time was extended, and for others, the time was shortened. On average, each game board took around 45 min with three trials, each between 10 and 15 min. The Miro boards allow teaching staff to assess the answers as they are visible in real time, without the need to wait until students are finished with the game, which makes it faster and easier to assess and gives the chance to prepare for the post-game discussion, giving tips for the next round of games, providing additional information, and presenting specific slides. In fact, it also requires active learning for the teacher and requires more energy than delivering a lesson or non-active lecture. On the other hand, it is more relaxing to supervise and coordinate the game than to talk and present in a three-hour lecture.
The boosting active learning approach applied in this case requires more time in the class compared to traditional active learning or one-time active game learning. However, the digital game board allows us to effectively manage session time, as it has a stopwatch embedded. Students have also indicated several good features that any digital game board should have, such as (1) the ability to zoom in and out to enable all group members to read, (2) the ability to assess the learning process in real time and prepare on-demand discussion items to fit the current situation, (3) the ability to trace all correct and incorrect answers, and (4) the ability to lock and access the game board as a learning document at any time.
Exploring the performance of self-study for students in each group, as shown in Table 14, could explain the performance of these groups in the games. Groups 1 and 2 have a good balance of students who performed satisfactory self-study, while group 3 lacks that.

3.5. Observations Based on Course Evaluation

The course survey was answered by 11 students (of 26), which is approximately 42.31%. It is an anonymous survey, and it is hard to identify whether the students who responded to the survey attended the classes or not. However, based on question number 3 (as shown in Figure 16) about the amount of participation in the organized learning activities, it can be observed that two students answered “Seldom”, which may mean that they are related to the group not attending the class. Seven students have answered this question as “most of them” and “All or almost all”. Thus, the results of this survey are dominated by students who attended classes.
The survey results highlight that the students were satisfied with their own efforts (Figure 17).
The survey results show that students on average invested 6–10 h per week, as shown in Figure 18. This confirms the low–medium self-study levels that course analytics have provided. Compared to previous years, as shown in Figure 19 and Figure 20, the study load was reduced by introducing active learning activities.
The survey results support the idea that teaching performance (Figure 21), teaching activities (Figure 22) and learning outcomes (Figure 23) successfully contributed to large and very large degrees of student learning. The students also highlighted that digital tools (Miro boards) have supported their learning to a very large extent (Figure 24).
It should be mentioned that communication (Figure 25), feedback (Figure 26), and the learning environment (Figure 27) play a significant role in the active learning environment. Although there were no special time slots or office hours provided, the workshops were utilized to discuss and give feedback, as well as one hour after the class for open discussion.
One student indicated the enjoyment feature in the gamified flipped classroom, as expressed in quote 5, as an answer to the question “What could contribute to a better academic and social environment among the students, in your view?”
Quote 5: “It is already great. he spends a lot of time making the course enjoyable for everyone. This creates a great academic and social environment and contributes to the environment among the students too”.
—One student out of 11 student, Course Evaluation Report, Question 12
Based on the results in Figure 28, the students are satisfied with the course in general.
The observations during the game sessions and students’ comments in the course evaluation survey indicated that the games motivate students to complete the pre-session reading as they do not feel comfortable playing the game without pre-understanding; otherwise, it looks like a guessing game. However, page-viewing results indicate that students who attended the gamified flipped classrooms had a lower page-viewing rate compared to students who did not attend these classrooms. This might indicate that attending active learning-boosting sessions can reduce self-study or allow students to perform well with a reasonable amount of self-study. This result might encourage students to attend class sessions and enhance the active participation of students. In addition, students who attended the boosting active learning sessions managed to provide more persuasive and compact answers and were more confident with their answers compared to students who did not attend the class.
Master’s students usually work full-time while studying in order to cope with life’s expenses and also gain experience. Some students can attend classes and be active, and some have job limitations (full-time, shifts, or offshore work rotations). In a geographically large country like Norway, some students might have issues (economic, environmental) to travel and have physical classes. These life-related issues put more pressure on physical classes to be more effective and attractive in engaging students and achieving higher learning outcomes. Although the game sessions used digital game board software, the games were played physically in the classroom. It should also be possible to play these games online.

4. Discussion and Conclusions

The main research question in this study is to examine the key aspects that influenced the learning outcome in 2024 compared to 2023. Four sets of observations and results indicate the positive impact of the gamified flipped classroom on student learning outcomes. First, in Section 3.1, the question indices, the Misconception Index, and the Hallucination Index are all higher for students who attended gamified flipped classrooms compared to students who did not attend these classes. Second, in Section 3.3, the actual level of understanding was much higher than the predicted level of understanding for students who attended gamified flipped classrooms compared to students who did not attend these classes. Third, in Section 3.4, the results of the workshop show that about 40–60% of the concepts were correctly understood in the second and third trials of the game. Fourth, as shown in Section 3.5, the students believed that teaching and learning contributed to their learning to a large extent. These observations are in line with several studies van Alten et al. (2019), Kapur et al. (2022), in which flipped classrooms have been shown to increase the achievement of learning outcomes when games are included.
The better learning outcomes in the 2024 course round were found to be related to gamified flipped classrooms, since the set-up of the course, materials, game boards, and student profiles were similar to the course round in 2023. However, the study revealed that the way to play the game is what helps the student learn and assess, reward, and reinforce their understanding until all misconceptions are detected and corrected. The game-playing approach used in teaching this course was similar to the boosting learning approach. The boosting learning approach applied in this course encouraged students to have the second and third trials of thinking and reflection, instead of giving them the correct answers after the first game trial (which was the case in 2023 and the first workshop in 2024). In machine learning, boosting learning works by training models sequentially, with each new model focusing on the errors made by the previous ones. This result supports the claims of Werbach and Hunter (2012), Jabbar and Felicia (2015) that the effectiveness of gamified learning is influenced by game mechanics elements like rules, challenges, cooperation, and coordination.
In addition, the video and page viewing was more stable on a weekly basis for students who attended gamified flipped classrooms compared to highly fluctuating for students who did not attend these classrooms. This result was also highlighted by Ferriz-Valero et al. (2020) and Kyewski and Krämer (2018), where notable enhancements in terms of learning outcomes were observed due to gamified learning without a corresponding increase in the intrinsic motivation of the students.
Boosting learning (i.e., a game of several trials) is found to be an effective game-playing approach that improves gamified flipped classrooms and associated learning outcomes. Although it did not increase self-studying performance, it made it more stable on a weekly basis.
Predicting the learning outcome based on the student profile (including self-studying, experience, and attending classrooms) and comparing it with the actual learning outcomes has proven to be an effective method for measuring the effect of any teaching change. This study also has shown a way to utilize the data collected by the learning management system and the course evaluation reports for learning measuring purposes. The retrospective study approach has been shown to be an effective approach in maintaining the natural behavior of teaching and learning in this class and avoiding many potential manipulations.
For recommended future work, it is worth further exploring gamified flipped classrooms with a game-boosting learning approach under a controlled setup. Moreover, gamified flipped classrooms with a game-boosting learning approach shall be observed under virtual and semi-virtual conditions. Finally, the predictive analytics of learning outcomes shall be further developed in terms of techniques and indicators and better adapted to fit the data resources in the learning management systems.

Funding

This research received no external funding.

Institutional Review Board Statement

Not applicable.

Informed Consent Statement

Not applicable.

Data Availability Statement

The original contributions presented in the study are included in the article, further inquiries can be directed to the corresponding author.

Acknowledgments

The author would like to acknowledge the invaluable comments, discussions and insights from the teaching assistant and my colleagues at the Department of Mechanical and Structural Engineering and Materials Science, University of Stavanger.

Conflicts of Interest

The author declares no conflicts of interest.

Note

1
Each ECTS credit represents 25–30 study hours.

References

  1. Al-Najjar, N., Al Bulushi, M. Y., Al Seyabi, F. A., Al-Balushi, S. M., Al-Harthi, A. S., & Emam, M. M. (2024). Perceived impact of initial Student teaching practice on teachers’ teaching performance and professional skills: A retrospective study. Pedagogies: An International Journal, 1–20. [Google Scholar] [CrossRef]
  2. An, Y. (2020). Designing effective gamified learning experiences. International Journal of Technology in Education (IJTE), 3(2), 62–69. [Google Scholar] [CrossRef]
  3. Asok, D., Abirami, A., Angeline, N., & Lavanya, R. (2016, December 9–10). Active learning environment for achieving higher-order thinking skills in engineering education. [Conference session]. 2016 IEEE 4th International Conference on Moocs, Innovation and Technology in Education (mite) (pp. 47–53), Madurai, India. [Google Scholar] [CrossRef]
  4. Baig, M. I., & Yadegaridehkordi, E. (2023). Flipped classroom in higher education: A systematic literature review and research challenges. International Journal of Educational Technology in Higher Education, 20(1), 61. [Google Scholar] [CrossRef]
  5. Bergmann, J., & Sams, A. (2012). Flip your classroom: Reach every student in every class every day. International Society for Technology in Education. [Google Scholar]
  6. Bonwell, C. C., & Eison, J. A. (1991). Active learning: Creating excitement in the classroom. School of Education and Human Development, George Washington University. [Google Scholar]
  7. Bozkurt, A. (2022). A retro perspective on blended/hybrid learning: Systematic review, mapping and visualization of the scholarly landscape. Journal of Interactive Media in Education, 2022, 2. [Google Scholar] [CrossRef]
  8. Brandao, E., Adelfio, M., Hagy, S., & Thuvander, L. (2021). Collaborative pedagogy for co-creation and community outreach: An experience from architectural education in social inclusion using the miro tool. In D. Raposo, N. Martins, & D. Brandão (Eds.), Advances in human dynamics for the development of contemporary societies (pp. 118–126). Springer International Publishing. [Google Scholar]
  9. Chan, T. A. C. H., Ho, J. M. B., & Tom, M. (2023). Miro: Promoting collaboration through online whiteboard interaction. SAGE Publications Ltd. [Google Scholar] [CrossRef]
  10. Chen, D.-P., Chang, S.-W., Burgess, A., Tang, B., Tsao, K.-C., Shen, C.-R., & Chang, P.-Y. (2023). Exploration of the external and internal factors that affected learning effectiveness for the students: A questionnaire survey. BMC Medical Education, 23(1), 49. [Google Scholar] [CrossRef]
  11. Chu, J., & Huang, A. D. (2024). Curricular, interactional, and structural diversity: Identifying factors affecting learning outcomes. Studies in Higher Education, 49(12), 2475–2490. [Google Scholar] [CrossRef]
  12. Collado-Valero, J., Rodríguez-Infante, G., Romero-González, M., Gamboa-Ternero, S., Navarro-Soria, I., & Lavigne-Cerván, R. (2021). Flipped classroom: Active methodology for sustainable learning in higher education during social distancing due to COVID-19. Sustainability, 13(10), 5336. [Google Scholar] [CrossRef]
  13. Creemers, B., & Kyriakides, L. (2010). School factors explaining achievement on cognitive and affective outcomes: Establishing a dynamic model of educational effectiveness. Scandinavian Journal of Educational Research, 54(3), 263–294. [Google Scholar] [CrossRef]
  14. Dahalan, F., Alias, N., & Shaharom, M. S. N. (2024). Gamification and game based learning for vocational education and training: A systematic literature review. Education and Information Technologies, 29, 1279–1317. [Google Scholar] [CrossRef]
  15. de Menéndez, M. H., Guevara, A. V., Martínez, J. C. T., Alcántara, D. H., & Morales-Menendez, R. (2019). Active learning in engineering education. A review of fundamentals, best practices and experiences. International Journal on Interactive Design and Manufacturing, 13, 909–922. [Google Scholar] [CrossRef]
  16. Deslauriers, L., McCarty, L. S., Miller, K., Callaghan, K., & Kestin, G. (2019). Measuring actual learning versus feeling of learning in response to being actively engaged in the classroom. Proceedings of the National Academy of Sciences of the United States of America, 116, 19251–19257. [Google Scholar] [CrossRef] [PubMed]
  17. Deterding, S., Dixon, D., Khaled, R., & Nacke, L. (2011, September 29–30). From game design elements to gamefulness: Defining “gamification”. [Conference session]. 15th International Academic MindTrek Conference: Envisioning Future Media Environments (pp. 9–15), Tampere, Finland. [Google Scholar] [CrossRef]
  18. Ding, L. (2018). Applying gamifications to asynchronous online discussions: A mixed methods study. Computers in Human Behavior, 91, 1–11. [Google Scholar] [CrossRef]
  19. Doolittle, P., Wojdak, K., & Walters, A. (2023). Defining active learning: A restricted systematic review. Teaching and Learning Inquiry, 11. [Google Scholar] [CrossRef]
  20. Doron, E., & Spektor-Levy, O. (2019). Transformations in teachers’ views in one-to-one classes—Longitudinal case studies. Technology, Knowledge and Learning, 24(3), 437–460. [Google Scholar] [CrossRef]
  21. Driessen, E. P., Knight, J. K., Smith, M. K., & Ballen, C. J. (2020). Demystifying the meaning of active learning in postsecondary biology education. CBE Life Sciences Education, 19, 1–9. [Google Scholar] [CrossRef]
  22. Dziuban, C., Graham, C. R., Moskal, P. D., Norberg, A., & Sicilia, N. (2004). Blended learning. Educause Center for Applied Research Bulletin, 2004(7), 1–12. [Google Scholar]
  23. Emily, C., Clark, J., & Post, G. (2021). Preparation and synchronous participation improve student performance in a blended learning experience. Available online: https://ajet.org.au/index.php/AJET/article/view/6811 (accessed on 28 December 2024).
  24. Faiella, F., & Ricciardi, M. (2015). Gamification and learning: A review of issues and research. Journal of e-Learning and Knowledge Society Je-LKS The Italian e-Learning Association Journal, 11, 3. [Google Scholar] [CrossRef]
  25. Fazio, C. (2020). Active learning methods and strategies to improve student conceptual understanding: Some considerations from physics education research. In J. Guisasola, & K. Zuza (Eds.), Research and innovation in physics education: Two sides of the same coin (pp. 15–35). Springer International Publishing. [Google Scholar] [CrossRef]
  26. Felder, R. M., & Brent, R. (2009). Active learning: An introduction. ASQ Higher Education Brief, 2(4), 1–5. [Google Scholar]
  27. Ferriz-Valero, A., Østerlie, O., Martínez, S. G., & García-Jaén, M. (2020). Gamification in physical education: Evaluation of impact on motivation and academic performance within higher education. International Journal of Environmental Research and Public Health, 17(12), 4465. [Google Scholar] [CrossRef]
  28. Freeman, S., Eddy, S. L., McDonough, M., Smith, M. K., Okoroafor, N., Jordt, H., & Wenderoth, M. P. (2014). Active learning increases student performance in science, engineering, and mathematics. Proceedings of the National Academy of Sciences of the United States of America, 111, 8410–8415. [Google Scholar] [CrossRef]
  29. Gleason, B. L., Peeters, M. J., Resman-Targoff, B. H., Karr, S., McBane, S., Kelley, K., Thomas, T., & Denetclaw, T. H. (2011). An active-learning strategies primer for achieving ability-based educational outcomes. American Journal of Pharmaceutical Education, 75, 186. [Google Scholar] [CrossRef] [PubMed]
  30. Göksün, D. O., & Gürsoy, G. (2019). Comparing success and engagement in gamified learning experiences via Kahoot and Quizizz. Computers & Education, 135, 15–29. [Google Scholar] [CrossRef]
  31. Graffam, B. (2007). Active learning in medical education: Strategies for beginning implementation. Medical Teacher, 29(1), 38–42. [Google Scholar] [CrossRef] [PubMed]
  32. Guimarães, L. M., & da Silva Lima, R. (2021). Active learning application in engineering education: Effect on student performance using repeated measures experimental design. European Journal of Engineering Education, 46(5), 813–833. [Google Scholar] [CrossRef]
  33. Halachev, P. (2024). Gamification as an e-learning tool: A literature review. E-Learning Innovations Journal, 2, 4–20. [Google Scholar] [CrossRef]
  34. Hassan, M. A., Habiba, U., Majeed, F., & Shoaib, M. (2019). Adaptive gamification in e-learning based on students’ learning styles. Interactive Learning Environments, 29(5), 545–565. [Google Scholar] [CrossRef]
  35. Hess, D. R. (2004). Retrospective studies and chart reviews. Respiratory Care, 49(10), 1171–1174. [Google Scholar]
  36. Hui, T., Lau, S. S., & Yuen, M. (2021). Active learning as a beyond-the-classroom strategy to improve university students’ career adaptability. Sustainability, 13, 6246. [Google Scholar] [CrossRef]
  37. Jabbar, A. I. A., & Felicia, P. (2015). Gameplay engagement and learning in game-based learning: A systematic review. Review of Educational Research, 85(4), 740–779. [Google Scholar] [CrossRef]
  38. Jing, J., & Canter, D. (2023). Developing a mixed-methods digital multiple sorting task procedure using zoom and miro. Methodological Innovations, 16(2), 250–262. [Google Scholar] [CrossRef]
  39. Johnson, E. K. (2022, October 6–8). Miro, Miro: Student perceptions of a visual discussion board. 40th ACM International Conference on Design of Communication (pp. 96–101), Boston, MA, USA. [Google Scholar] [CrossRef]
  40. Kapur, M., Hattie, J., Grossman, I., & Sinha, T. (2022). Fail, flip, fix, and feed—Rethinking flipped learning: A review of meta-analyses and a subsequent meta-analysis (Vol. 7). Frontiers Media S.A. [Google Scholar] [CrossRef]
  41. Kiryakova, G., Angelova, N., & Yordanova, L. (2014, October 16–88). Gamification in education. 9th International Balkan Education and Science Conference (Vol. 1, pp. 679–684), Trakya University, Edirne, Turkey. Available online: https://dosyalar.trakya.edu.tr/egitim/docs/Kongreler/FProceedings.pdf (accessed on 3 March 2025).
  42. Kobrin, J. L. (2016). Examining changes in teaching practices using a retrospective case study approach. SAGE Publications Ltd. [Google Scholar] [CrossRef]
  43. Konopka, C. L., Adaime, M. B., & Mosele, P. H. (2015). Active teaching and learning methodologies: Some considerations. Creative Education, 6, 1536–1545. [Google Scholar] [CrossRef]
  44. Kumar, A., Krishnamurthi, R., Bhatia, S., Kaushik, K., Ahuja, N. J., Nayyar, A., & Masud, M. (2021). Blended learning tools and practices: A comprehensive analysis. IEEE Access, 9, 85151–85197. [Google Scholar] [CrossRef]
  45. Kutergina, E. (2017). Computer-based simulation games in public administration education. NISPAcee Journal of Public Administration and Policy, 10, 119–133. [Google Scholar] [CrossRef]
  46. Kyewski, E., & Krämer, N. C. (2018). To gamify or not to gamify? An experimental field study of the influence of badges on motivation, activity, and performance in an online learning course. Computers & Education, 118, 25–37. [Google Scholar] [CrossRef]
  47. Landers, R. N. (2014). Developing a theory of gamified learning: Linking serious games and gamification of learning. Simulation and Gaming, 45, 752–768. [Google Scholar] [CrossRef]
  48. Lavi, R., & Bertel, L. B. (2024). Active learning pedagogies in high school and undergraduate stem education. Education Science, 14, 1011. [Google Scholar] [CrossRef]
  49. Li, M., Ma, S., & Shi, Y. (2023). Examining the effectiveness of gamification as a tool promoting teaching and learning in educational settings: A meta-analysis (Vol. 14). Frontiers Media SA. [Google Scholar] [CrossRef]
  50. Lim, D. H., & Morris, M. L. (2009). Learner and instructional factors influencing learning outcomes within a blended learning environment. Educational Technology & Society, 12, 282–293. [Google Scholar]
  51. Limaymanta, C. H., Apaza-Tapia, L., Vidal, E., & Gregorio-Chaviano, O. (2021). Flipped classroom in higher education: A bibliometric analysis and proposal of a framework for its implementation. International Journal of Emerging Technologies in Learning, 16, 133–149. [Google Scholar] [CrossRef]
  52. Lobos, E., Catanzariti, A., & McMillen, R. (2024). Critical analysis of retrospective study designs: Cohort and case series. Clinics in Podiatric Medicine and Surgery, 41(2), 273–280. [Google Scholar] [CrossRef]
  53. Lopez-Caudana, E., Ramirez-Montoya, M. S., Martínez-Pérez, S., & Rodríguez-Abitia, G. (2020). Using robotics to enhance active learning in mathematics: A multi-scenario study. Mathematics, 8, 2163. [Google Scholar] [CrossRef]
  54. Maldonado-Trapp, A., & Bruna, C. (2024). The evolution of active learning in response to the pandemic: The role of technology. In The COVID-19 Aftermath: Volume II: Lessons Learned (pp. 247–261). Springer. [Google Scholar] [CrossRef]
  55. Martella, A. M., Yatcilla, J. K., Park, H., Marchand-Martella, N. E., & Martella, R. C. (2021). Investigating the active learning research landscape through a bibliometric analysis of an influential meta-analysis on active learning. SN Social Sciences, 1, 228. [Google Scholar] [CrossRef]
  56. Mercan, G., & Varol Selçuk, Z. (2024). Investigating the impact of game-based learning and gamification strategies in physical education: A comprehensive systematic review. Journal of Interdisciplinary Education: Theory and Practice, 6(1), 1–14. [Google Scholar] [CrossRef]
  57. Michael, J. (2006). How we learn where’s the evidence that active learning works? Advances in Physiology Education, 30, 159–167. [Google Scholar] [CrossRef] [PubMed]
  58. Mills, A., Durepos, G., & Wiebe, E. (2010). Retrospective case study. In Encyclopedia of case study research (pp. 825–827). SAGE Publications, Inc. Available online: https://sk.sagepub.com/ency/edvol/casestudy/toc (accessed on 3 March 2025). [CrossRef]
  59. Miro. (2024). About miro. Available online: https://miro.com/about/ (accessed on 26 December 2024).
  60. Miyachi, T., Iga, S., Hirokawa, M., & Furuhata, T. (2016, November 10–12). A collaborative active learning for enhancing creativity for multiple disciplinary problems. 2016 11th International Conference on Knowledge, Information and Creativity Support Systems (KICSS) (pp. 1–6), Yogyakarta, Indonesia. [Google Scholar] [CrossRef]
  61. Nelson, L. P., & Crow, M. L. (2014). Do active-learning strategies improve students’ critical thinking? Higher Education Studies, 4(2), 77–90. [Google Scholar] [CrossRef]
  62. Nguyen, K. A., Borrego, M., Finelli, C. J., DeMonbrun, M., Crockett, C., Tharayil, S., Shekhar, P., Waters, C., & Rosenberg, R. (2021). Instructor strategies to aid implementation of active learning: A systematic literature review. International Journal of STEM Education, 8, 9. [Google Scholar] [CrossRef]
  63. Nowak, M. K., Speakman, E., & Sayers, P. (2016). Evaluating PowerPoint presentations: A retrospective study examining educational barriers and strategies. Nursing Education Perspectives, 37(1), 28–31. Available online: https://pubmed.ncbi.nlm.nih.gov/27164774/ (accessed on 3 April 2024).
  64. Owens, D. C., Sadler, T. D., Barlow, A. T., & Smith-Walters, C. (2020). Student motivation from and resistance to active learning rooted in essential science practices. Research in Science Education, 50, 253–277. [Google Scholar] [CrossRef]
  65. Pilotti, M. A. E., Alaoui, K. E., Abdelsalam, H. M., & Khan, R. (2023). Sustainable development in action: A retrospective case study on students’ learning before, during, and after the pandemic. Sustainability, 15(9), 7664. [Google Scholar] [CrossRef]
  66. Prince, M. (2004). Does active learning work? A review of the research. Journal of Engineering Education, 93(3), 223–231. [Google Scholar] [CrossRef]
  67. Sala, R., Maffei, A., Pirola, F., Enoksson, F., Ljubić, S., Skoki, A., Zammit, J. P., Bonello, A., Podržaj, P., Žužek, T., Priarone, P. C., Antonelli, D., & Pezzotta, G. (2024). Blended learning in the engineering field: A systematic literature review. Computer Applications in Engineering Education, 32(3), e22712. [Google Scholar] [CrossRef]
  68. Theobald, E. J., Hill, M. J., Tran, E., Agrawal, S., Arroyo, E. N., Behling, S., Chambwe, N., Cintrón, D. L., Cooper, J. D., Dunster, G., Grummer, J. A., Hennessey, K., Hsiao, J., Iranon, N., Jones, L., Jordt, H., Keller, M., Lacey, M. E., Littlefield, C. E., … Freeman, S. (2020). Active learning narrows achievement gaps for underrepresented students in undergraduate science, technology, engineering, and math. Proceedings of the National Academy of Sciences, 117(12), 6476–6483. [Google Scholar] [CrossRef]
  69. Ting, F. S. T., Lam, W. H., & Shroff, R. H. (2019). Active learning via problem-based collaborative games in a large mathematics university course in Hong Kong. Education Sciences, 9(3), 172. [Google Scholar] [CrossRef]
  70. Tomas, L., Evans, N. S., Doyle, T., & Skamp, K. (2019). Are first year students ready for a flipped classroom? A case for a flipped learning continuum. International Journal of Educational Technology in Higher Education, 16(1), 5. [Google Scholar] [CrossRef]
  71. Torralba, K. D., & Doo, L. (2020). Active learning strategies to improve progression from knowledge to action. Rheumatic Disease Clinics of North America, 46(1), 1–19. Available online: https://www.sciencedirect.com/science/article/pii/S0889857X19300778 (accessed on 1 March 2025). [CrossRef] [PubMed]
  72. University of Stavanger. (2024). Condition monitoring and predictive maintenance(IAM540). Available online: https://www.uis.no/en/course/IAM540_1 (accessed on 22 December 2024).
  73. van Alten, D. C., Phielix, C., Janssen, J., & Kester, L. (2019). Effects of flipping the classroom on learning outcomes and satisfaction: A meta-analysis (Vol. 28). Elsevier Ltd. [Google Scholar] [CrossRef]
  74. Wang, K., & Zhu, C. (2019). MOOC-based flipped learning in higher education: Students’ participation, experience and learning performance. International Journal of Educational Technology in Higher Education, 16(1), 33. [Google Scholar] [CrossRef]
  75. Werbach, K., & Hunter, D. (2012). For the win: How game thinking can revolutionize your business. Wharton Digital Press. Available online: https://picture.iczhiku.com/resource/paper/shkSGKokAIOeIcNc.pdf (accessed on 22 December 2024).
  76. White, P. J., Larson, I., Styles, K., Yuriev, E., Evans, D. R., Rangachari, P. K., Short, J. L., Exintaris, B., Malone, D. T., Davie, B., & Eise, N. (2016). Adopting an active learning approach to teaching in a research-intensive higher education context transformed staff teaching attitudes and behaviours. Higher Education Research & Development, 35(3), 619–633. [Google Scholar] [CrossRef]
  77. Otegui, X., & Raimondi, C. (2024). Enhancing pedagogical practices in engineering education: Evaluation of a training course on active learning methodologies. In M. E. Auer, U. R. Cukierman, E. V. Vidal, & E. T. Caro (Eds.), Towards a hybrid, flexible and socially engaged higher education (pp. 255–266). Springer Nature Switzerland. [Google Scholar]
  78. Yıldız, E., Doğan, U., Özbay, Ö., & Seferoğlu, S. S. (2022). Flipped classroom in higher education: An investigation of instructor perceptions through the lens of TPACK. Education and Information Technologies, 27(8), 10757–10783. [Google Scholar] [CrossRef]
  79. Zaric, N., Roepke, R., Lukarov, V., & Schroeder, U. (2021). Gamified learning theory: The moderating role of learners’ learning tendencies. International Journal of Serious Games, 8, 71–91. [Google Scholar] [CrossRef]
  80. Zhang, Y., Tan, W. H., & Zhou, J. A bibliometric review of research on gamification in education: Reflections for moving forward. Journal of Education, Humanities and Social Sciences, 41, 112–127.
Figure 1. Flipped classroom process and associated results for two different years.
Education 15 00430 g001
Figure 2. Game board 2: monitoring and inspection techniques.
Education 15 00430 g002
Figure 3. Game board 12: building condition monitoring flowchart.
Education 15 00430 g003
Figure 4. Game set up and students’ interactions with the digital game board.
Education 15 00430 g004
Figure 5. Snapshot from the course early dialogue report, 11 September 2024.
Education 15 00430 g005
Figure 6. Research methodology for this study.
Education 15 00430 g006
Figure 7. Snapshot of the page viewing data collected by Canvas.
Education 15 00430 g007
Figure 8. Snapshot of the video watching data collected by Canvas.
Education 15 00430 g008
Figure 9. Histogram of weekly page views, with a mean value (red coloured line) of approximately 30.85.
Education 15 00430 g009
Figure 10. The average page views over weeks for students who attended the classes.
Education 15 00430 g010
Figure 11. The average page views over weeks for students who did not attend the classes.
Education 15 00430 g011
Figure 12. Time plot of the individual page views over weeks for students who did not attend the classes.
Education 15 00430 g012
Figure 13. Time plot of the individual page views over weeks for students who attended the classes and were not working full-time.
Education 15 00430 g013
Figure 14. Time plot of the individual page views over weeks for students who attended the classes and were working full-time.
Education 15 00430 g014
Figure 15. Histogram of video-viewing rate, with a mean value of approximately 28%.
Education 15 00430 g015
Figure 16. Student participation performance.
Education 15 00430 g016
Figure 17. Student satisfaction with their own efforts.
Education 15 00430 g017
Figure 18. Students’ own involvement as hours per week in 2024.
Education 15 00430 g018
Figure 19. Students’ own involvement as hours per week in 2023.
Education 15 00430 g019
Figure 20. Students’ own involvement as hours per week in 2022.
Education 15 00430 g020
Figure 21. Teaching performance.
Education 15 00430 g021
Figure 22. Teaching activity performance.
Education 15 00430 g022
Figure 23. Achievement learning outcome performance.
Education 15 00430 g023
Figure 24. Digital tool performance.
Education 15 00430 g024
Figure 25. Communication performance.
Education 15 00430 g025
Figure 26. Feedback performance.
Education 15 00430 g026
Figure 27. Social and academic environment performance.
Education 15 00430 g027
Figure 28. Overall course satisfaction.
Education 15 00430 g028
Table 1. Course learning objectives University of Stavanger (2024).
Objective SetLearning Objective
KnowledgeGain a comprehensive understanding of condition monitoring (CM), condition-based maintenance (CBM) and predictive maintenance (PdM).
Gain a comprehensive understanding of common machine faults: causes, mechanisms, symptoms, and modes.
Gain a basic understanding and theories behind the monitoring techniques, e.g., vibration, acoustic emission, ultrasonic, oil-debris, thermal and process parameters.
Gain a basic understanding and theories behind signal analysis, diagnosis and prognosis analysis.
Gain a basic understanding and theories behind the non-destructive testing (NDT) methods such as penetrant, flux leakage, eddy current, and radiography.
SkillsBe able to apply the project execution model to design monitored and PdM-ready equipment and deliver concept and front-end engineering (FEED) studies.
Be able to perform engineering analysis methods, e.g., failure mode analysis, symptom analysis, sensor diagnostic coverage analysis, and PdM concept study.
Be able to perform time and frequency domain signal analysis.
Be able to perform diagnosis analysis and determine the fault type, location and severity level.
Be able to perform prognosis analysis (physics-based and/or data-driven) to predict the remaining useful lifetime.
General competenceCan analyze relevant academic, professional, and research ethical problems.
Can work in teams and plan and manage projects.
Can apply his/her knowledge and skills in new areas in order to carry out assignments and projects.
Can communicate about academic issues, analyses and conclusions in the field, both with specialists and with the general public.
Table 2. History of course updates.
Updated Aspect20172018201920202021202220232024
No. of students4737343442351626
LecturesXXXXXX
Project-based learningXXXXXXXX
Systems thinking skills XXXXXXX
Lab exercises XXXXXXX
Project partitioning and feedback XXXXXX
Job embedded content XXXXXX
Digital context, streamed lectures XXXXX
Introduce individual concept assignment XXXX
Introduce individual reflection assignment XXXX
Animated videos XXX
Lecture notes based compendium XXX
Expand the course from 5 to 10 Ects XX
Active learning with a flipped classroom XX
Cloud-based and non-coding machine learning XX
Table 3. Course timeline until the concept assignment submission.
DateDescriptionLecture Type
28.8Introduction to IAM540Traditional
4.9Condition monitoring techniquesGamified flipped classroom
11.9Early dialogue session15 min discussion
11.9Time Waveform analysisGamified flipped classroom
18.9Frequency Domain analysisGamified flipped classroom
25.9Machine faults, Diagnostics and PrognosticsGamified flipped classroom
30.9Concept Assignment, Extended to 4th October
Table 4. Miro boards.
No.Board TitleBoard Description
B1PdM in RAMI4.0Define the industry 4.0 architecture, layers and predictive maintenance (PdM) functions
B2Asset HierarchyDefine the asset layers and apply it on equipment from a new context (wind energy)
B3P-F curveDefine the potential (P) and functional (F) failure points on the deterioration curve
B4Monitoring techniquesDiscuss different monitoring and inspection techniques and compare them
B5Vibration versus AECompare results from vibration and acoustic emission (AE) for detected fault
B6Vibration versus UltrasonicCompare results from vibration and ultrasonic for detected fault under different rotation speed conditions
B7CM, CBM, PdMCompare between condition monitoring (CM), condition-based maintenance (CBM) and predictive maintenance (PdM) in terms of functions, techniques and benefits
B8Uptime and downtime plotIdentify the difference between reliability, maintainability, supportability, dependability, time to failure, time to main, time to support
B9Failure EventReflect the terms (failure cause, mechanism, mode, symptom, effect) on the failure curve
B10Failure Engineering MethodsDefine the s between failure mode and effect analysis, failure mode and symptom analysis, diagnostic coverage analysis, and predictive maintenance analysis
B11PEM for PdMFit the engineering analysis into the project execution model (PEM) and industrial work process to build a predictive maintenance (PdM) program and identify the decision gates and required tasks
B12ISO17359Construct the work-process to engineer a condition monitoring system
Table 5. Concept assignment description.
No.QuestionRelated Miro Board
Q1What are the similarities and differences between condition monitoring (condition-based maintenance) and predictive maintenance?B7
Q2Explain the main stages/steps in ISO 17359 standard, and what is the logic behind its sequence?B12
Q3What are the main potential benefits of the Predictive Maintenance program over the condition monitoring program?B8
Q4What are the differences between FMECA, FMSA, and PdMA?B10
Q5What is the difference between performance monitoring and health monitoring techniques? which one is more accurate in providing an early fault indicator?B4
Q6Explain how can the vibration technique be effective to detect machine faults e.g., imbalance, misalignment?B3, B9
Q7What is the principal difference between the AE technique and the Ultrasonic technique?B4, B5, B6
Q8What are the capabilities and limitations of the Infrared spectroscopy and Debris counter techniques?B4
Q9What is the difference between Non-Destructive Testing (NDT) techniques and monitoring techniques? please use an example to clarify that.B4
Q10What are the capabilities and limitations of the time-domain detection analysis?No board
Q11What are the capabilities and limitations of frequency-domain detection analysis?No board
Q12What is the difference between trend projection prognosis and extrapolation prognosis?No board
Table 6. Student features and predicted student learning outcome based on teacher experience.
Student TypeClass
Attendance
Self StudyExperience
Level
Predicted Student
Outcome Level
Attending class, self-studying and has experienceHighHighHighHigh
Attending class, self-studying and no experienceHighHighLowMedium
Attending class, not self-studying and has experienceHighLowHighMedium
Attending class, not self-studying and no experienceHighLowLowLow
Not attending class, self-studying and has experienceLowHighHighMedium
Not attending class, self-studying and no experienceLowHighLowLow
Not attending class, not self-studying, has experienceLowLowHighLow
Not attending class, not self-studying, no experienceLowLowLowLow (Very)
Table 7. Confusion matrix of student learning outcomes.
Predicted Class
High (H)Medium (M)Low (L)
Actual ClassHigh (H)H
Medium (M) M
Low (L) L
Table 8. Assessment results of the concept assignment for not-attending-class students (S 1).
AspectFull MarkS1S2S3S4S5S6Question Index
Q(2)1211212167%
Q2211112267%
Q3202112158%
Q4211211267%
Q5211222283%
Q610.51111192%
Q710.50.5111183%
Q810.51111192%
Q910.51111192%
Q10211112267%
Q1120.51112263%
Q12212222292%
Total score208.513.516141918Index
Incompleteness 1204111.5 3
Misconception 8332023 4
Hallucination 12290003.83 5
Comment AI style AI style and Lecture notes Lecture notesLecture notes
Level of understanding LMHMHH
1 S refers to Student, 2 Q refers to Question, 3 Incompleteness Index, 4 Misconception Index, 5 Hallucination Index.
Table 9. Assessment results of concept assignment for class-attending students (S 1).
AspectFull
Mark
S7S8S9S10S11S12S13S14S15S16S17S18S19S20Question
Index
Q(2)122121112111122271%
Q222121122212122282%
Q322220211211222279%
Q422211122112122279%
Q522221122212222289%
Q6111111111111111100%
Q7111111111111111100%
Q8111111111111111100%
Q9111111111111111100%
Q102211111121111.51.5268%
Q1121121211111.511.52264%
Q1222222111202120271%
Total score2019161812141516171116.5141917.520Index
Incompleteness 132344334230202.29 3
Misconception 012512104130001.29 4
Hallucination 002311505110401.43 5
Comment AI style AI style AI style AI style
Level of understanding HHHLMMHHLHMHHH
1 S refers to Student, 2 Q refers to Question, 3 Incompleteness Index, 4 Misconception Index, 5 Hallucination Index.
Table 10. Student profiles and learning outcome (predicted and actual).
Student
No.
TypeExperienceAttending
Workshops
Video Viewing %Page ViewingLevel of
Self Study
Predicted Level
of Understanding
Actual Level
of Understanding
1SubjectYesNo30%649HighMediumLow
2ProgramYesNo7%335MediumMediumMedium
3SubjectYesNo76%407HighMediumHigh
4ProgramYesNo7%446HighMediumMedium
5ProgramYesNo9%254MediumMediumHigh
6ProgramYesNo25%658HighMediumHigh
7ProgramNoYes74%495HighMediumHigh
8ExchangeNoYes7%277MediumMediumHigh
9ProgramNoYes14%228MediumMediumHigh
10ProgramNoYes18%227MediumMediumLow
11ExchangeNoYes10%224MediumMediumMedium
12ProgramNoYes7%179LowLowMedium
13ProgramNoYes0%96LowLowHigh
14ExchangeNoYes7%106LowLowHigh
15ProgramNoPartially11%48LowLowLow
16ProgramYesYes26%382MediumMediumHigh
17ProgramYesYes57%385MediumMediumMedium
18SubjectYesYes7%195LowLowHigh
19ProgramYesYes0%93LowLowHigh
20ProgramYesYes99%510HighHighHigh
Table 11. Actual and predicted levels of understanding for not-attending-class students.
Predicted Class
High (H)Medium (M)Low (L)
Actual ClassHigh (H)030
Medium (M)020
Low (L)010
Table 12. Actual and predicted levels of understanding for class-attending students.
Predicted Class
High (H)Medium (M)Low (L)
Actual ClassHigh (H)144
Medium (M)021
Low (L)011
Table 13. Game boards and learning performance over several trials.
No.DescriptionTotal Game
Cards
Group
No.
Correct Cards
in 1st Trial
Correct Cards
in 2nd Trial
Correct Cards
in 3rd Trial
Comment
1RAMI4.0181810 cards left Winner
2711 cards left
3513 cards left
2Asset hierarchy12157 cards left Winner
266 cards left
339 cards left
3P-F curve10191 card left
282 cards left Winner
382 cards left
4Monitoring techniques27113104
215111Winner
38955 cards left
5&6Vibration, AE, Ultrasonic919 Winner, one round
28 1 card left
38 1 card left
7CM, CBM, PdM3511885Winner, 4 cards left
216865 cards lefts
314957 cards lefts
8Lifetime benefits101802 cards leftWinner, two rounds
2802 cards leftWinner, two rounds
3712 cards lefttwo rounds
9Failure event38115125Winner, 6 cards left
216134Winner, 6 cards left
3141068 cards left
10Failure engineering12184
293 Winner, two rounds
375
11PEM for PdM191154 Winner, two rounds
2153 1 card left
3105 4 cards left
12ISO173592512041 card leftWinner, two rounds
2178Winner
310132 cards left
Table 14. Groups and students in the gamified flipped classrooms.
Group No.Student No.Level of Self-Study
Group 17, 8, 9, 16, 17H, M, M, M, M
Group 211, 14, 18, 20M, L, L, H
Group 310, 12, 13, 15, 19M, L, L, L, L
Disclaimer/Publisher’s Note: The statements, opinions and data contained in all publications are solely those of the individual author(s) and contributor(s) and not of MDPI and/or the editor(s). MDPI and/or the editor(s) disclaim responsibility for any injury to people or property resulting from any ideas, methods, instructions or products referred to in the content.