1. Introduction
The main modern problem in assessing the pace of socio-economic development of the Russian Federation is the incompatibility of macroeconomic parameters used in the indicative planning of regional socio-economic systems. Thus, we analyzed the forecasts for the socio-economic development of the subjects of the Volga Federal District, placed in the State Autonomous System “Control”. Of the 14 regions included in it, forecasts were presented for 7: the Kirov region (73 forecast indicators were used), the Penza region (40), the Samara region (37), the Chuvash Republic (32), the Nizhny Novgorod region (31), the Republic of Mari El (24), and the Republic of Tatarstan (23 indicators) [
1].
In the forecasts of all analyzed regions, only 10 general indicators were used: the number of the resident population (average annual), gross regional product, index of gross regional product in comparable prices, index of industrial production, agricultural production in all categories of farms, index of agricultural production, retail trade turnover, index of physical volume of retail trade turnover, investments in fixed assets, and index of physical volume of investments in fixed assets [
2].
Thus, it can be noted that in the forecasts of all analyzed regions, there is a certain “core” of indicators (18), reflecting socio-economic processes common for different regions. At the same time, this set of indicators has certain significant shortcomings in the methodological aspect, which we considered in [
2]. We believe that the indicators used to assess the pace of socio-economic development of the Russian Federation should comply with the following principles:
consistency, i.e., indicators should reflect the totality (main components) of the analyzed (projected) socio-economic system;
fixability, i.e., indicators should be quantitative and obtained at minimal cost;
reasonable sufficiency; based on the analysis, it can be concluded that a “reasonable” number of indicators, according to employees of the governing bodies of the constituent entities of the Russian Federation, are 30–40 indicators;
comparability across regions of the names and units of measurement of indicators;
adequacy; thus, the above basic set does not allow an objective assessment of the state, vector, and dynamics of changes in processes in the social and environmental spheres.
The purpose of the article is, on the basis of statistical data with heterogeneous metrics, to develop a methodology for assessing the socio-economic development of the Russian Federation with the construction of mathematical models to obtain a high-quality predictable result in order to ensure positive trends in the formation of the country.
The following research methods were used: technologies of the index and integral calculation of indicators; mathematical modeling, based on correlation and regression analysis and the theory of multifactorial regression; forecasting, based on analysis of variance.
Analyzing foreign publications from recent years Beckert, J. [
3], Hilty, L. [
4], the Center for Global Development [
5], Chen, S. [
6], Gunawardana, A. [
7], Lee, R. [
8], Lee, SJ [
9], Liu, W. [
10], Njos R. [
11], Pattin, W. [
12], Poly, M. [
13], Reichardt, Ch. S. [
14], Shani, A. B. [
15], and Yoon, D. [
16], the authors came to the conclusion that the research technologies used in them are based only on analysis, which does not allow forecasting. In the works of Boyadjiev, Ch. [
17], Gungor, A. [
18], and Lennert, J. [
19], despite the construction of mathematical models, account indicators with different units of measurement were not taken into account.
In the mathematical models of the noted works, one of the important characteristics is missing—a digitized quality indicator, on the basis of which the forecasting technology is carried out. To this end, the authors introduce a numerical quality indicator for the constructed model based on the analysis of variance, as well as a formula for calculating the predicted value.
Based on this, the authors propose a methodology for assessing the pace of socio-economic development of the Russian Federation and their forecasting based on the developed technologies (successfully tested by solving the following tasks): the impact of socio-economic factors on the reproduction of human resources in agriculture [
20,
21], as well as forecasting reproductive processes in agriculture in general [
22], and the pace of agricultural production, in particular [
23], the author’s method for assessing the pace of socio-economic development of the Russian Federation and forecasting them is proposed.
2. Materials and Methods
In the first stage, a selection of the most significant thirty-two indicators was formed to assess the pace of socio-economic development of the Russian Federation, divided into seven macro-regional blocks (income, labor, business, ecology, society, prospects, finance). A more detailed analysis of the selected factors is presented below, individually for each block.
Initially, the first macro-regional block, “Income”, included seven indicators: the number of people with incomes in the range from 14 to 45 thousand rubles. per month; the population with incomes below 10 thousand rubles; the number of people with incomes below the subsistence level; funds ratio; GDP (GRP) per capita; the ratio of GDP (GRP) to actual final consumption (per capita); increase (decrease) in the population’s money (in % of total money income) [
2].
However, considering that during the analyzed period, some statistical methods of calculation changed, some indicators were calculated periodically and not annually, we will exclude them from further calculations. Thus, a selection of the most significant indicators of the macro-regional block “Income” was formed (
Table 1).
Analyzing the data in
Table 1, it can be seen that the population with incomes below the subsistence minimum fluctuated in different years from 15.4 million people in 2012 up to 19.6 million people in 2015. Although, since 2015, this indicator has been decreasing every year, it still remains above the values of 2010 per 0.4 million people. Despite such a significant number of the population with incomes below the subsistence minimum, the coefficient of income differentiation tends to decrease; that is, the degree of social stratification of society is gradually decreasing. This is due to the 2.3 times increase in GDP per capita in 2019 compared to 2010.
The selected indicators of the macro-regional block “Income” are given to the index value (in % of the previous year) in order to be able to take them into account when calculating the integral indicator (
Table 2). The index analysis method allows aggregating a wide range of quantitative indicators for assessing the pace of socio-economic development, which have different units of measurement and cannot be compared with each other without standardizing the values.
Based on the information in
Table 2, Formula (1) was developed, which calculates an integral indicator that characterizes the macro-regional block “Income” in the Russian Federation in 2010–2019
in %:
where
—index of change in the population with income below the subsistence level, %;
—index of change in income differentiation coefficient, %;
—index of change in GDP per capita, %.
Analysis indicates that for 2010–2019, the average value of the index of change in the number of people with an income below the subsistence level was 100.5%. The average index of the income differentiation coefficient decreased to 99.4%, and GDP per capita increased to 107.7%, which clearly demonstrates the increase in the income of the population of the Russian Federation in the analyzed period.
Next, a selection of the most significant indicators is formed to assess the pace of socio-economic development that characterize the second macro-regional block, “Labor”, in the Russian Federation (
Table 3). Initially, it had seven indicators: the level of employment; unemployment rate; composition of the employed population by level of education; the ratio of the number of labor forces to the average annual number of employees; the ratio of the need for workers, declared by employers to state employment service institutions, to the number of unemployed; arrears of wages, as a percentage of the monthly wage fund of organizations with arrears; arrears in wages per one employee to whom there is an arrears. However, taking into account the transformation of the methodological recommendations of their calculations and insignificant fluctuations of some of them over ten years, four indicators of the “Labor” macro-regional block will be used for further calculations.
An analysis of
Table 3 indicates a decrease in all indicators for the period from 2010 to 2019. Thus, the level of employment of the population decreased by 3.3 p.p., unemployment by 2.7 p.p., participation in the labor force by 5.4 p.p. Overdue wage arrears to employees of organizations decreased in 2019 on 286 million rubles compared to 2010.
Then, based on the materials of
Table 3,
Table 4 and Formula (2) were developed, which calculate the integral indicator characterizing the macro-regional block, “Labor” in the Russian Federation
in %.
where
—index of change in the level of employment of the population, %;
—index of change in the unemployment rate, %;
—index of change in labor force participation rate, %;
—index of change in arrears of wages to employees of organizations, %.
Analysis of the indexes of change of indicators indicates that for 2010–2019 the average value of three of them tended to decrease (employment rates—99.4%, unemployment—96.3, and labor force participation—99.2%). In total, all four indicators of the macro-regional block “Labor” had a decrease in the average rate of the integral indicator to 99.6%.
The next step is to form a sample of the most significant indicators of the third macro-regional block “Business” (
Table 5). Initially, it had eight indicators, namely: the number of small enterprises per 10,000 people of the population; turnover of small enterprises per 10,000 people; the share of the average number of employees of small enterprises in the total number of employed people; balanced financial result (profit minus loss) of organizations’ activities per 10,000 employed people; profitability of sold goods, products (works, services) of organizations, %, carrying out their activities in crop production; %, engaged in livestock activities; the number of enterprises and organizations per 10,000 people. However, for 2010–2019, some indicators were not calculated annually but periodically, so we will exclude them from further calculations.
An analysis of the data in
Table 5 indicates an increase in the turnover of small enterprises per 1000 people of the population by 2.7 times, or by 228.4 million rubles in 2019 compared to 2010. The balanced financial result of the activities of organizations per 10,000 people of the employed population also increased by 2.6 times, or by 140.7 million rubles. The profitability of sold goods, products (works, services) of organizations increased by 0.8 p.p. Only two indicators out of the five of the macro-regional block “Business” show a decrease: the share of the average number of employees of small enterprises in the total number of the employed population—by 0.1 p.p., and the number of enterprises and organizations per 1000 people—by 7.7 units.
Further, on the basis of
Table 5,
Table 6 and Formula (3) were developed, which calculate the integral indicator characterizing the macro-regional block “Business” in the Russian Federation
in %.
where
—index of change in the turnover of small enterprises per 1000 people population, %;
—index of change in the share of the average number of employees of small enterprises in the total number of the employed population, %;
—index of change in the balanced financial result of the activities of organizations per 10,000 people of the employed population, %;
—index of change in the profitability of sold goods, products (works, services), of organizations, %;
—index of change in the number of enterprises and organizations per 1000 people population, %.
shows that over the analyzed period, the average value of the indices ranged from 97.5% (change in the number of enterprises and organizations per 1000 people of the population) to 114.9% (change in the balanced financial result of the activities of organizations per 10,000 people of the employed population). This means that these indicators had a minimum and maximum impact, respectively, on the integral indicator of the macro-regional block “Business”.
Then, a selection of the most significant indicators was formed to assess the pace of socio-economic development that characterizes the fourth macro-regional block, “Ecology”, in the Russian Federation (
Table 7). Initially, it was proposed to use seven indicators: emissions of pollutants into the atmospheric air from stationary sources per capita; capturing air pollutants from stationary sources per capita; freshwater use per capita; discharge of polluted wastewater into surface water bodies per capita; volume of recycled and consistently used water per capita; ratio of GDP (GRP) to total land area; ratio of agricultural output to total land area. However, five were used for further calculations since two of them remained almost unchanged over a ten-year period.
Table 7 clearly demonstrates the reduction in all parameters, except for the discharge of polluted wastewater into surface water bodies. This indicator, despite fluctuations over the analyzed period, in 2019, had a similar value to 2010—115.5 million m
3 per capita.
Based on the data in
Table 7,
Table 8 and Formula (4) were developed, which calculate the integral indicator characterizing the macro-regional block “Ecology” in the Russian Federation
in %:
where
—index of change in emissions of pollutants into the atmospheric air from stationary sources, %;
—index of change in the capture of atmospheric pollutants from stationary sources, %;
—index of change in freshwater use, %;
—index of change in the discharge of polluted wastewater into surface water bodies, %;
—index of change in the volumes of recycled and successively used water, %.
Analysis indicates that for 2010–2019, the average value of three out of five indices had approximately the same downward trend (98.8%, 98.6%, 98.3%). The index of change in the volumes of recycled and consistently used water remained unchanged—100.0%. Only the index of change in the discharge of polluted wastewater into surface water bodies slightly increased to 100.6%.
The next step is to form a selection of the most significant indicators for assessing the pace of socio-economic development that characterize the fifth macro-regional block, “Society”, in the Russian Federation (
Table 9). Initially, the sample included seven indicators, namely: total fertility rate (number of births per 1000 people); general mortality rate (number of deaths per 1000 people); infant mortality rate (number of children who died before the age of 1 year per 1000 live births); coefficient of natural population growth (per 1000 people); the total area of residential premises per inhabitant on average (at the end of the year, sq. m.); commissioning of residential buildings per 1000 people of the population (sq. m of the total area); incidence per 1000 people. However, six will be involved in the calculations since the rate of natural increase of the population already includes birth and death rates.
Analyzing the data in
Table 9, it can be seen that the first three indicators show a downward trend. Thus, the total birth rate decreased by 2.4 points, mortality by 1.9, and infant mortality by 2.6 points. Incidence per 1000 people decreased in 2019 by 0.52 cases compared to 2010. The total area of residential premises per inhabitant increased by 3.7 sq. m., and the commissioning of residential buildings per 1000 people by 150.1 sq. m of total area.
Then, based on
Table 9,
Table 10 and Formula (5) were developed, which calculate the integral indicator characterizing the macro-regional block “Society” in the Russian Federation
in %.
where
—index of change in the total fertility rate, %;
—index of change in the total mortality rate, %;
—index of change in the infant mortality rate, %;
—index of change in the total area of residential premises per inhabitant, %;
—index of change in the commissioning of residential buildings per 1000 people population, %;
—index of change in incidence per 1000 people population, %.
shows that over the analyzed period, the four average values of the indices had a negative trend and ranged from 93.2% (morbidity per 1000 people) to 98.8% (total mortality rate). The average rate for all six indicators is 98.4%.
At the next step, a selection of the most significant indicators is formed to assess the pace of socio-economic development that characterize the sixth macro-regional block, “Prospects”, in the Russian Federation (
Table 11).
Initially, seven indicators were involved in the sample: the cost of fixed assets per capita; the degree of depreciation of fixed assets; investment in fixed assets per capita (in actual prices, rubles); the share of organizations that carried out technological, organizational, marketing innovations in the total number of surveyed organizations (%); use of global information networks (in % of the total number of surveyed organizations of the corresponding subject of the Russian Federation); organizations that had a website (as a percentage of the total number of surveyed organizations of the corresponding subject of the Russian Federation); the number of students enrolled in bachelor’s, specialist’s, and master’s programs per 10,000 people. However, six indicators will be used in further calculations since the wording “the share of organizations that carried out technological, organizational, marketing innovations in the total number of surveyed organizations (%)” has somewhat transformed over the analyzed period. The list of innovations included in this indicator has changed, so it cannot be objective and was not included in this block.
Analysis of the data in
Table 11 shows an increase in five indicators out of the six; fixed assets at full book value per capita increased in 2019 by 1730.9 thousand rubles or almost 3.7 times, investments in fixed assets per capita increased by 2.1 times, and the number of students enrolled in bachelor’s, specialist’s, and master’s programs per 1000 people increased by 1.8 times.
Based on
Table 11,
Table 12 and Formula (6) were developed, which calculate the integral indicator characterizing the macro-regional block “Prospects”
in %.
where
—index of change in fixed assets at full book value per capita, %;
—index of change in the degree of depreciation of fixed assets, %;
—index of change in investments in fixed assets per capita, %;
—index of change in the use of global information networks, %;
—index of change in organizations that had a website, %;
—index of change in the number of students enrolled in bachelor’s degree, specialist’s, and master’s programs per 1000 people population, %.
Analysis shows that for 2011–2019, the average value of all indices tended to increase, except for changes in the degree of depreciation of fixed assets (reduction to 97.9%). The average rate for all six indicators of the macro-regional block “Prospects” is 105.2%. At the same time, the index of change in fixed assets at the full book value per capita had the maximum impact on the integral indicator—114.2%. All this testifies to the development prospects of the Russian Federation.
In the end, a selection of the most significant indicators characterizing the seventh macro-regional block, “Finance”, in the Russian Federation is formed (
Table 13). Initially, seven indicators were involved in it: revenues of the consolidated budgets of the constituent entities of the Russian Federation per capita; expenses of the consolidated budgets of subjects of the Russian Federation per capita; the ratio of revenues and expenditures of the consolidated budgets of the constituent entities of the Russian Federation per capita; the share of gratuitous receipts in the structure of incomes of the consolidated budgets of the constituent entities of the Russian Federation; the ratio of GDP (GRP) to the income of the consolidated budgets of the constituent entities of the Russian Federation per capita; the ratio of GDP (GRP) to the expenditures of the consolidated budgets of the constituent entities of the Russian Federation per capita; share of unprofitable organizations. However, given that not all of them were calculated over a ten-year period, and for some, there were insignificant changes, these indicators were not all included in the seventh block.
Analyzing
Table 13, it can be seen that in terms of revenues and expenditures of the consolidated budgets of the constituent entities of the Russian Federation per capita, there is an increase of almost 2.4 and 2.1 times, respectively, over the analyzed period. However, the share of unprofitable organizations also increased by 2.6 p.p.
Then, on the basis of
Table 13,
Table 14 and Formula (7) were developed, which calculate the integral indicator characterizing the macro-regional block “Finance”
in %.
where
—index of change in the income of the consolidated budgets of the constituent entities of the Russian Federation per capita, %;
—index of change in expenditures of the consolidated budgets of the subjects of the Russian Federation per capita, %;
—index of change in the share of unprofitable organizations, %.
Analysis indicates that for 2010–2019, a positive trend has been outlined for all indicators of the macro-regional block “Finance”. At the same time, the income of the consolidated budgets of the constituent entities of the Russian Federation per capita had the maximum impact on it with an average rate of 108.2%, and the minimum—the index of change in the share of unprofitable organizations—was 101.0%. Respectively, clearly demonstrates the improvement in the financial situation in the country over the analyzed period.
Next, we substitute the values of Formulas (1)–(7) into Formula (8) to calculate the rates of socio-economic development in the Russian Federation in 2010–2019 (
), %:
where
—integral indicator characterizing the macro-regional block “Income”, %;
—integral indicator characterizing the macro-regional block “Labor”, %;
—integral indicator characterizing the macro-regional block “Business”, %;
—integral indicator characterizing the macro-regional block “Ecology”, %;
—integral indicator characterizing the macro-regional block “Society”, %;
—integral indicator characterizing the macro-regional block “Prospects”, %;
—integral indicator characterizing the macro-regional block “Finance”, %.
The values of the indicator characterizing the pace of socio-economic development in the Russian Federation in 2010–2019 (
) are shown in
Table 15.
Analysis of the indicator of the pace of socio-economic development, , indicates that in 2010–2019 it fluctuated from 98.0% in 2010 (minimum) to 107.5% in 2015 (maximum). For eight years out of ten, the indicator had a positive value. Its average value for 2010–2019 amounted to 102.1%. The most positive impact on it is demonstrated by the integral indicators characterizing the macro-regional blocks “Finance” —105.3%, “Business” , and “Prospects” —105.0% each, the most negative—an integral indicator characterizing the macro-regional block “Society” —was 98.4%.
3. Results
We used the means of mathematical modeling to study the problem identified in the present work and arrange the generated blocks in the constructed mathematical model. In the article, subsequent developments take place in a new modification of the author’s technology of research, successfully tested in the works [
20,
21,
22].
In the first stage of the study, the necessary indicators were taken into account, grouped into blocks, and presented in
Table 1,
Table 3,
Table 5,
Table 7,
Table 9,
Table 11 and
Table 13. In the second step, a transition was made to dimensionless units (
Table 2,
Table 4,
Table 6,
Table 8,
Table 10,
Table 12 and
Table 14). In the third step, the procedure for aggregating the considered indicators into seven factors was completed (
Table 15). Based on it and taking into account the introduced notation:
a multifactorial mathematical model was considered:
Based on the analysis of the correlation matrix of mathematical model (9) (
Table 16), obtained from the data of the factors
(
Table 15), the correlation of the factor was established
и
. Therefore, from the structure of model (9), we pass to the structure with factors
:
Reanalysis of the correlation matrix for model (10) (
Table 17) confirmed the correlation of factors
и
. Therefore, we pass from model (10) to a model with a set of factors
:
Analysis of the correlation matrix of model (11) allows us to state the absence of correlation factors
(
Table 18).
Based on these factors,
(
Table 15), we calculate the multifactorial model:
The equation of the multifactorial model (12) has a coefficient of multiple determination
, calculated on the basis of the analysis of variance per one degree of freedom, according to the formula:
where
n—number of data,
m—number of model parameters.
The significance of Equation (12) is established using the Fisher criterion at the level
,
,
. A competing hypothesis is accepted:
, asserting the significance of the constructed multifactorial model (12). Below, in
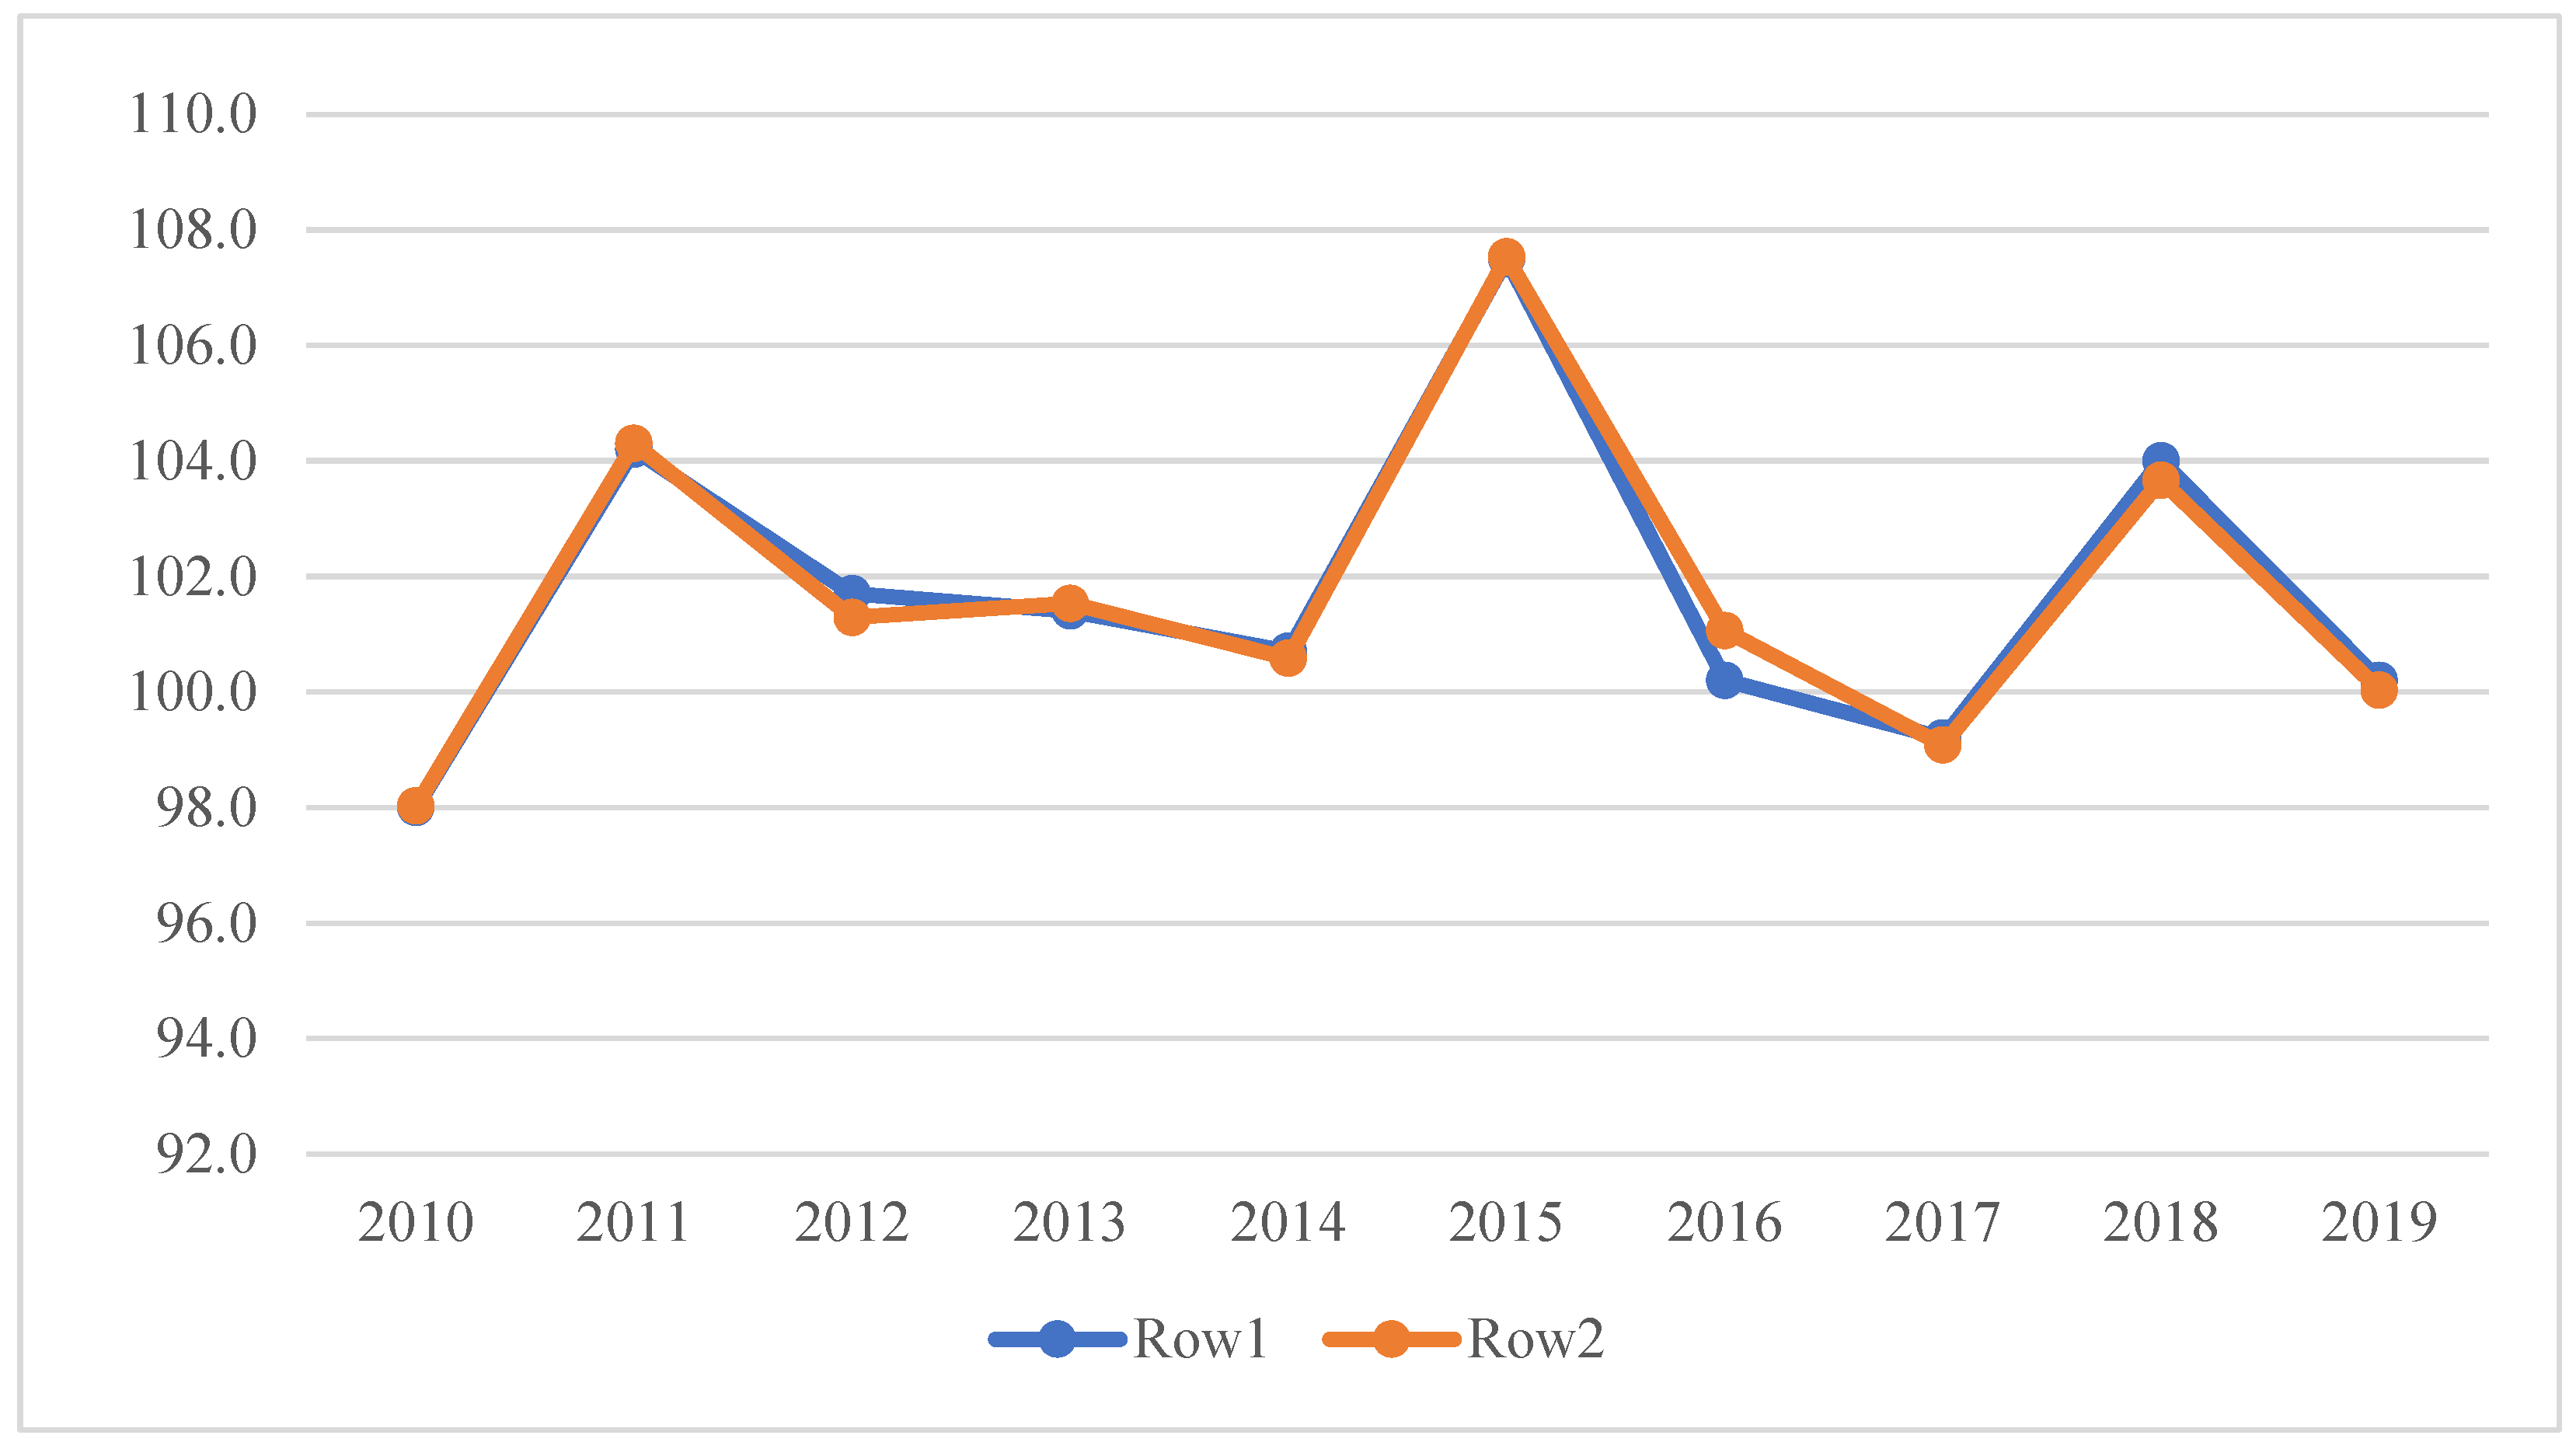
Figure 1, a geometric interpretation of the multifactorial model (12) is presented.
The constructed mathematical model (12) reflects all causal relationships between the studied indicator and the factors influencing it. After that, a numerical indicator of quality was introduced, based on the analysis of variance, which allows for forecasting. The degree of influence of factors on the indicator under study is reflected in the numerical values of the coefficients of model (12), which are the partial correlation coefficients of the multifactorial model. The maximum value of the partial correlation coefficients corresponds to the significance of the factors for the indicator under study and the effectiveness of the programs being implemented. The value of the study lies in the possibility of determining: (1) an important list of factors influencing the process under study; (2) the efficiency of the developed and implemented programs; (3) on the basis of the first two points, to exercise a competent influence on the management of economic processes.
4. Discussion
Constructed multifactorial model (12) was tested according to the data of 2010–2018 (
Table 15), which is a mathematical proof of the model-building technology. The constructed multifactorial model (12) was tested according to the data of 2010–2018 (
Table 15). Calculated coefficient values
in Formula (11) make it possible to compile a multifactorial model:
The coefficient of the multiple determination for mathematical model (14) is
, obtained on the basis of the analysis of variance per one degree of freedom (Formula (13)). The significance of Equation (14) is established using the Fisher criterion at the level
,
,
. A competing hypothesis is accepted:
, asserting the significance of constructed multifactorial model (13). Below, in
Figure 2, the geometric interpretation of multifactorial model (13) for the data of 2010–2018 is presented.
Based on constructed model (14), the confidence interval of the predicted value was calculated
:
according to the formula
where
was calculated by model (14). The real value of the pace of socio-economic development for 2019 is
. Observe the consistency of the predicted value
with the resulting confidence interval, the confidence interval covers the predicted value.
To calculate the predicted value of the rate of socio-economic development of according to model (12), it is necessary to know the factors for 2020. One of the options for obtaining these factor values is based on the construction of a mathematical model for each factor based on the theory of time series. For example, based on the dynamics of the development of the factors of model (12), consider the values of the factors: . From expression (12) and model (14) we obtain a confidence interval according to Formula (15) for the predicted value of the indicator of the rate of socio-economic development the Russian Federation for 2020: .
An analysis of the multifactorial model (12) shows that the first (“Income”) and fifth (“Society”) factors have a significant impact on the pace of socio-economic development of the Russian Federation and in the background, the third (“Business”) and the second (“Labor”). This is reflected in the values of the coefficients of partial correlation, the values of the coefficients of the structure of the multifactorial model (12). The constructed mathematical model allows you to make analysis not only of the declared blocks but also of each block by year. It should be noted that the factors taken into account in the model are directly related to regulatory documents.
Each integral indicator in its macroeconomic block is a clear parameter for determining the effectiveness of its management: the greater its value in quantitative terms, the higher the level of their management. This also applies to the pace of socio-economic development in general. In addition, we substantiated the effectiveness of the calculations by determining the dependence at different time intervals between the pace of development of each of the macroeconomic blocks and the implementation of state measures in them (based on the analysis of seventy-one legal acts) related to them. Unfortunately, it is not possible to add this voluminous material to the article, but it clearly demonstrates the relationship between the indicators in
Table 15 by year and the dates of the beginning of the implementation of regulatory legal acts (growth of the indicator) and their completion (decrease in the indicator) by blocks.
In the next stage, we consider all the indicators of these factors and determine options for possible measures in order to increase the values of the relevant factors for a positive impact on the indicator of the pace of socio-economic development.
5. Conclusions
Despite the limitations of the study, caused by the impossibility of using the entire set of declared indicators of Rosstat due to the fact that for 2010–2019 some statistical methods of calculation changed, some indicators were calculated periodically and not annually; their units of measurement changed from absolute to relative; or were excluded from further calculations. Nevertheless, the results of the research presented in this article, based on the constructed mathematical model, allow us to draw the following conclusions:
1. A methodology has been developed for assessing the rates of socio-economic development and their forecasting in the Russian Federation, which makes it possible to consider factors with heterogeneous metrics. Its novelty lies in: (1) identifying thirty-two indicators divided into seven macro-regional blocks (income, labor, business, ecology, society, prospects, finance), bringing them to an index value, introducing seven formulas for their calculations, determining integral indicators, and characterizing their changes; (2) substantiation of the effectiveness of the calculations carried out by determining the dependence at different time intervals between the pace of development of each of the macroeconomic blocks and the implementation of government measures (based on the analysis of seventy-one legal acts) relating to them; (3) determining the pace of socio-economic development of the Russian Federation (by developing an appropriate formula). The rates of development calculated by us for each block separately and for socio-economic development as a whole are a clear option for determining the effectiveness of management: the greater their value in quantitative terms, the higher the quality of their management.
2. Using the means of mathematical modeling, a mathematical model was built and tested (mathematical proven) in real-time, which allows a high-quality predictable result to be obtained. The novelty of the development includes the technology of transition to dimensionless units used in the study of statistical information, as well as the construction of a mathematical multifactorial model of the dynamics of changes in the rate of socio-economic development of the Russian Federation and the calculation of its predicted value. After the elimination of multicollinearity, five integral indicators of macroeconomic blocks remained: income, labor, business, ecology, and society. This model was tested according to the data of 2010–2018; the quantitative indicator of its quality was calculated based on the analysis of variance . The real value of the rate of socio-economic development for 2019, , falls within the confidence interval of the predicted value calculated by us, : , and indicates the quality of the forecast. The paper presents the author’s formula for calculating the confidence interval of the predicted value of the indicator and proposes a calculation option for a 2020 confidence interval of the predicted value.
3. All factors taken into account in the mathematical model have a direct connection with the implemented normative legal acts concerning the socio-economic development of the Russian Federation. This relationship is reflected in the numerical form of tables developed by the authors. This relationship is reflected in the numerical values of the partial correlation coefficients—a group of factors one and five (Formula (12)), as having the most maximum effect. Based on the graphs of the mathematical model (
Figure 1), we can note the time intervals: 2010–2011, 2014–2015, 2017–2018, in which the pace of increase in socio-economic development is observed, indicating the effectiveness of programs implemented by the state and the adoption of new ones. Therefore, in 2017–2018, Decrees of the President of the Russian Federation “On the Approval of the Concept of the Foreign Policy of the Russian Federation” [
25] and “On the Strategy for the Economic Security of the Russian Federation for the Period up to 2030” [
26] were adopted. Moreover, also approved were the “Strategy for Improving Financial Literacy in the Russian Federation for 2017–2023” [
27], “Federal Scientific and Technical Program for the Development of Agriculture for 2017–2025” [
28], the state program “Development of Education” [
29], etc.
In the periods from 2011 to 2014, from 2015 to 2017, and from 2018 to 2019, there was a decline in the rate of socio-economic development of the Russian Federation, caused by the expiration of some government programs. For example, in 2011–2014, the deadlines for the implementation of such Federal target programs as: “National technological base” for 2007–2011 [
30]; “Social development of the village until 2012” [
31]; “Improving the efficiency of use and development of the resource potential of the fishery complex in 2009–2013” [
32], had expired. A similar situation was noted in other periods of the slowdown in the socio-economic development of the Russian Federation. Due to the large number of analyzed programs, we present some of them as an example. The volume of our article does not allow us to list all the programs implemented in the state.
At the next stage of the study, based on the received forecasts, we state the need to adjust certain indicators of groups of factors one and five that actively influence the pace of development. Thus, this study is a mathematical justification for making managerial decisions in the development of strategies and programs related to socio-economic progress in the Russian Federation.


