Article

Who Is the Most Effective Country in Anti-Corruption? From the Perspective of Open Government Data and Gross Domestic Product

1
Department of Finance, National Yunlin University of Science and Technology, Douliu 64002, Taiwan
2
Department of Information Management, National Yunlin University of Science and Technology, Douliu 64002, Taiwan
3
Jesse H. Jones School of Business, Texas Southern University, 3100 Cleburne Street, Houston, TX 77004, USA
*
Author to whom correspondence should be addressed.
Mathematics 2022, 10(13), 2180; https://doi.org/10.3390/math10132180
Submission received: 26 May 2022 / Revised: 15 June 2022 / Accepted: 18 June 2022 / Published: 22 June 2022

Abstract

:
Corruption represents the misuse of public power by government departments for personal gain, hindering a country’s economic growth. Corruption cannot be eliminated by implementing the national democratic system, and mature democratic countries also exist with varying degrees of corruption. Corruption affects people’s trust in the public sector and the country’s economic development. Open government data can help people understand the governance performance of the government to reduce corruption in the public sector. Citizens can use open government data to generate innovative applications and economic value. This study uses a two-stage data envelopment analysis method to assess the anti-corruption efficiency of 21 countries from 2013 to 2017 through open government data, the corruption perception index, and GDP data. Then, the efficiency analyzed is introduced into the BCG (Boston Consulting Group) matrix to observe the distribution of these 21 countries. Analyzing the results showed that Uruguay and Costa Rica in Central and South America are the two most influential countries in fighting corruption. Turkey is at the bottom in the evaluation of anti-corruption efficiency. In addition, discussions of the included countries for their possible improvement in anti-corruption are also provided by using the association rule’s analysis. The study results will provide a reference for governments to effectively carry out anti-corruption work in the future.

1. Introduction

Corruption refers to the abuse of public office by government departments for personal gain, which hinders the development of the national economy [1]. Although the damage caused by corruption is relatively tiny in market-oriented economies relative to more closed economies [2], corruption cannot be eliminated in democracies, and corruption exists to varying degrees in mature democracies. Corruption affects people’s trust in public sector behavior. Brown et al. [3] found patterns of corrupt behavior through cross-country data. Corruption can be polarized by the politics of a democracy.
Open government data (OGD) can help citizens understand government behavior and performance, and open data can also generate insights to improve government performance [4]. The Open Government Partnership was born in 2011 after many government leaders formed a unique partnership with civil society advocates to promote the idea of accountable, responsive, and inclusive governance. So far, 79 countries and thousands of civil society organizations have joined. Member states must disclose government information to increase transparency and credibility, and propose an annual plan of action for reforms to counter authoritarianism and corruption.
Gross domestic product (GDP) is often used to assess the state of national and global economic growth, and GDP growth can be interpreted as advantages such as a well-functioning economy and increased employment opportunities [5]. However, corruption can lead to economic losses for the country. Mauro [1] pointed out that corruption will reduce investment, reducing economic growth. Gründler and Potrafke [6] found that the higher the level of corruption, the lower the GDP.
Open government data require the government to commit to making public sector data public and available to the crowd to increase government governance transparency. In addition, open government data can add value to innovation through use by citizens and businesses. The study combines the Corruption Perception Index (CPI) and Gross Domestic Product (GDP) of people around the world to assess corruption through the Open Data Barometer (ODB), which measures open government data. Using a two-stage network data envelopment analysis (DEA) approach, the anti-corruption efficiency of 21 countries was analyzed.

2. Literature Review

2.1. Corruption

Shleifer and Vishny [7] and Svensson [8] define corruption as the sale of relevant assets by government departments for personal gains, such as the public sector accepting bribes, providing licenses or certificates, and prohibiting other competitors from participating. Jain [9] argues that corruption uses public power for personal gain by breaking the rules. Corruption is often associated with government structures and economic problems, and Mauro [1] pointed out that corruption leads to reduced investment, which in turn reduces economic growth. Research by Ella [10] points out that corruption is more significant in economies dominated by a small number of companies and in countries where antitrust laws are ineffective. Furthermore, Melki and Pickering [11] argue that even a mature national democracy cannot eliminate corruption. Aragonès et al. [12] explore why corruption still exists in democracies in developing countries and find that voter heterogeneity and information asymmetry lead to corrupt politicians who can still find voters who voted for them.
The relevant research on corruption in recent years is shown in Table 1. Most of these studies focus on panel data analysis and statistical models.

2.2. Open Government Data

Open Government Data (OGD) is one of the categories of open data, which opens government-related data to the public to achieve the democratic goals of open government [20]. The movement seeks to expose the value of data and seek democratic change through openness, participation, and collaboration [21]. After the 21st century, open government information has become an essential multilateral link between national governments, creating a paradigm shift in how governments shape public relations [22]. The Open Data Charter clarifies the ambitious goal of open government data, which seeks technological advancement and innovation to create more accountable, efficient, and responsive governments and businesses, and stimulate economic growth [23].
Hulstijn et al. [24] argue that government data disclosure can stimulate organizational culture and regulate decision-making. It will be discussed and documented to help fight corruption. The related research on government data disclosure and anti-corruption is shown in Table 2. Florez and Tonn [25] point out that the G7 and G20 have long focused on the open data arena. Multinational organizations such as the World Bank have also invested heavily in this project, and it has also attracted widespread advocacy by many civil society organizations. Although some people believe that open data has only achieved part of the anti-corruption situation, others point out a lack of openness in anti-corruption—an extensive data survey. Žuffová [26] explores whether open government data and freedom of information (FOI law) can achieve anti-corruption effects. Through cross-country data analysis, Žuffová believes that the impact of government data disclosure on anti-corruption depends on the quality of national media and freedom of the Internet.

2.3. Gross Domestic Product (GDP)

GDP is a reference indicator of national and global economic growth. GDP is measured by calculating all outputs of a country in a given period, including defense and education services provided by some national governments [5].
The related research on economic growth and corruption is summarized in Table 3. Malanski and Póvoa [27] analyzed the effects of corruption on economic growth for different levels of economic freedom. The construct of economic freedom is directly related to freedom for individual actions, referring to the choice for competition and action, and voluntary exchanges and negotiations, ensuring the right to property. They found that in Latin America, it was possible that corruption damages countries with greater economic freedom but favors economic growth in countries with lower economic freedom levels. Afzali et al. [28] found that as the risk of economic uncertainty increases, many firms engage in norm-deviation behavior through tax evasion, tax evasion, and more bribery. Gründler and Potrafke [6] used the Corruption Perception Index CPI to investigate the relationship between corruption and economic growth in many countries from 2012 to 2018. When the CPI increased by one standard deviation, real GDP per capita fell by about 17%.

2.4. Two-Stage Network Data Envelope Analysis
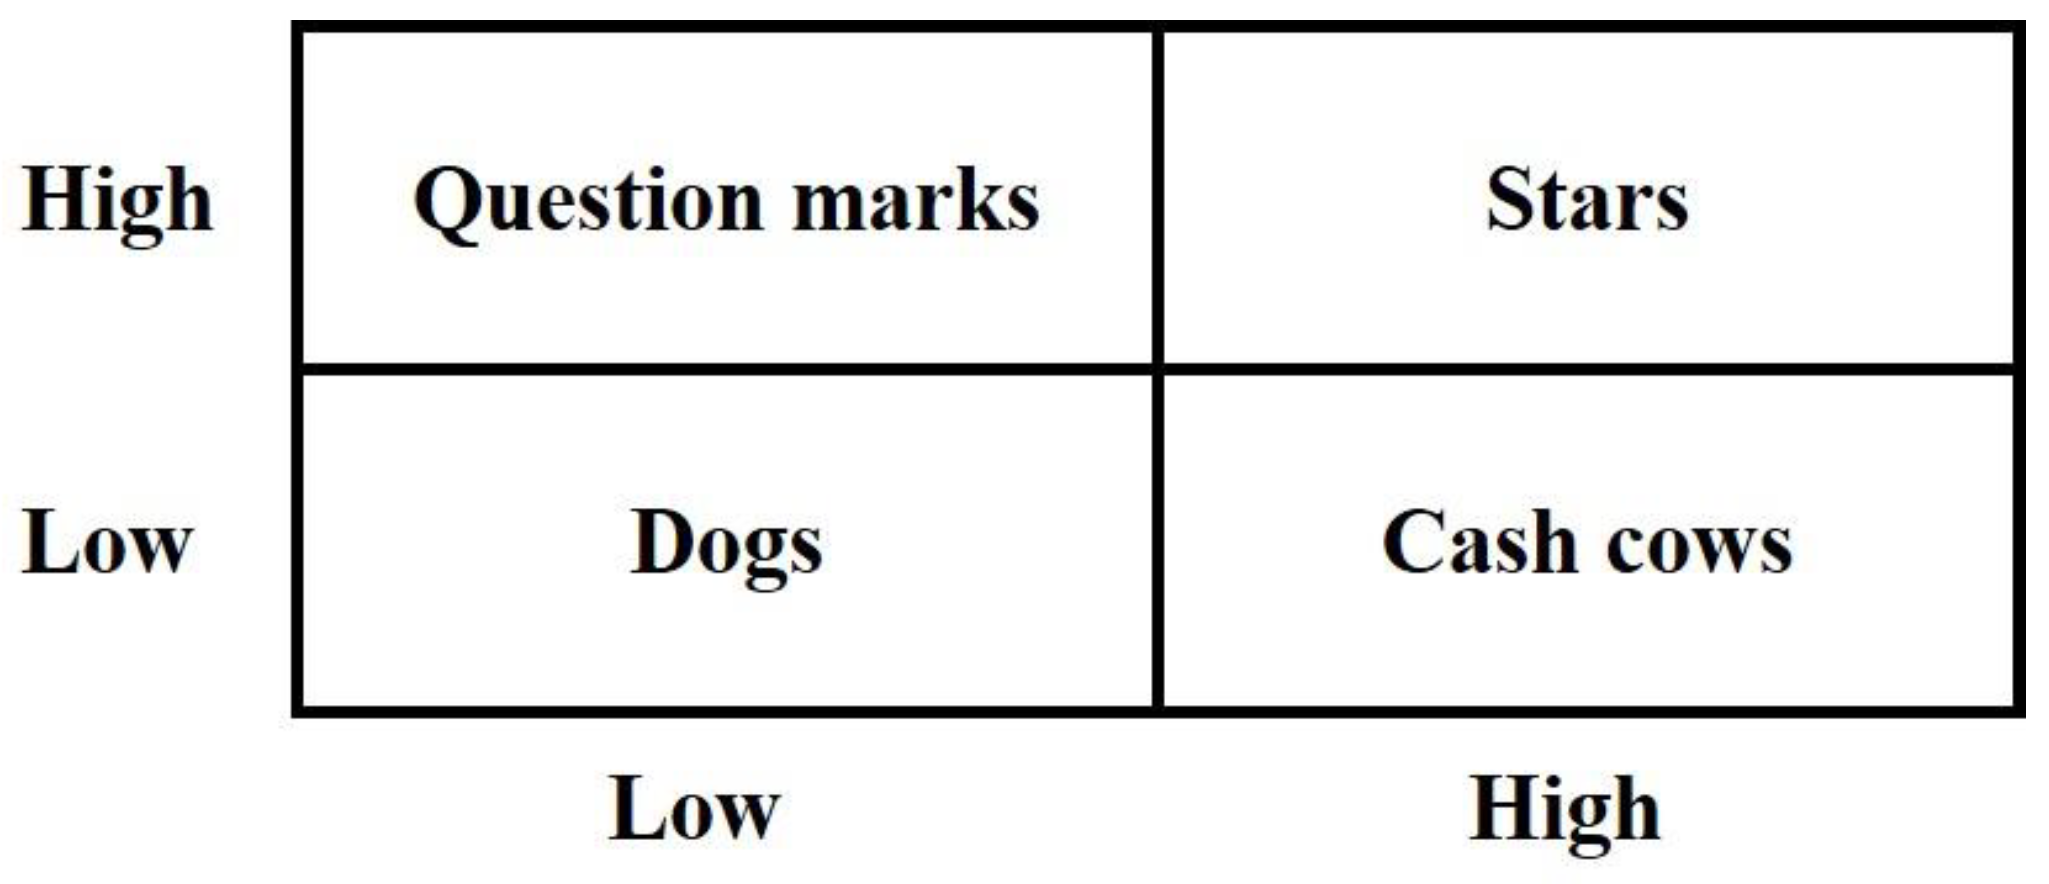
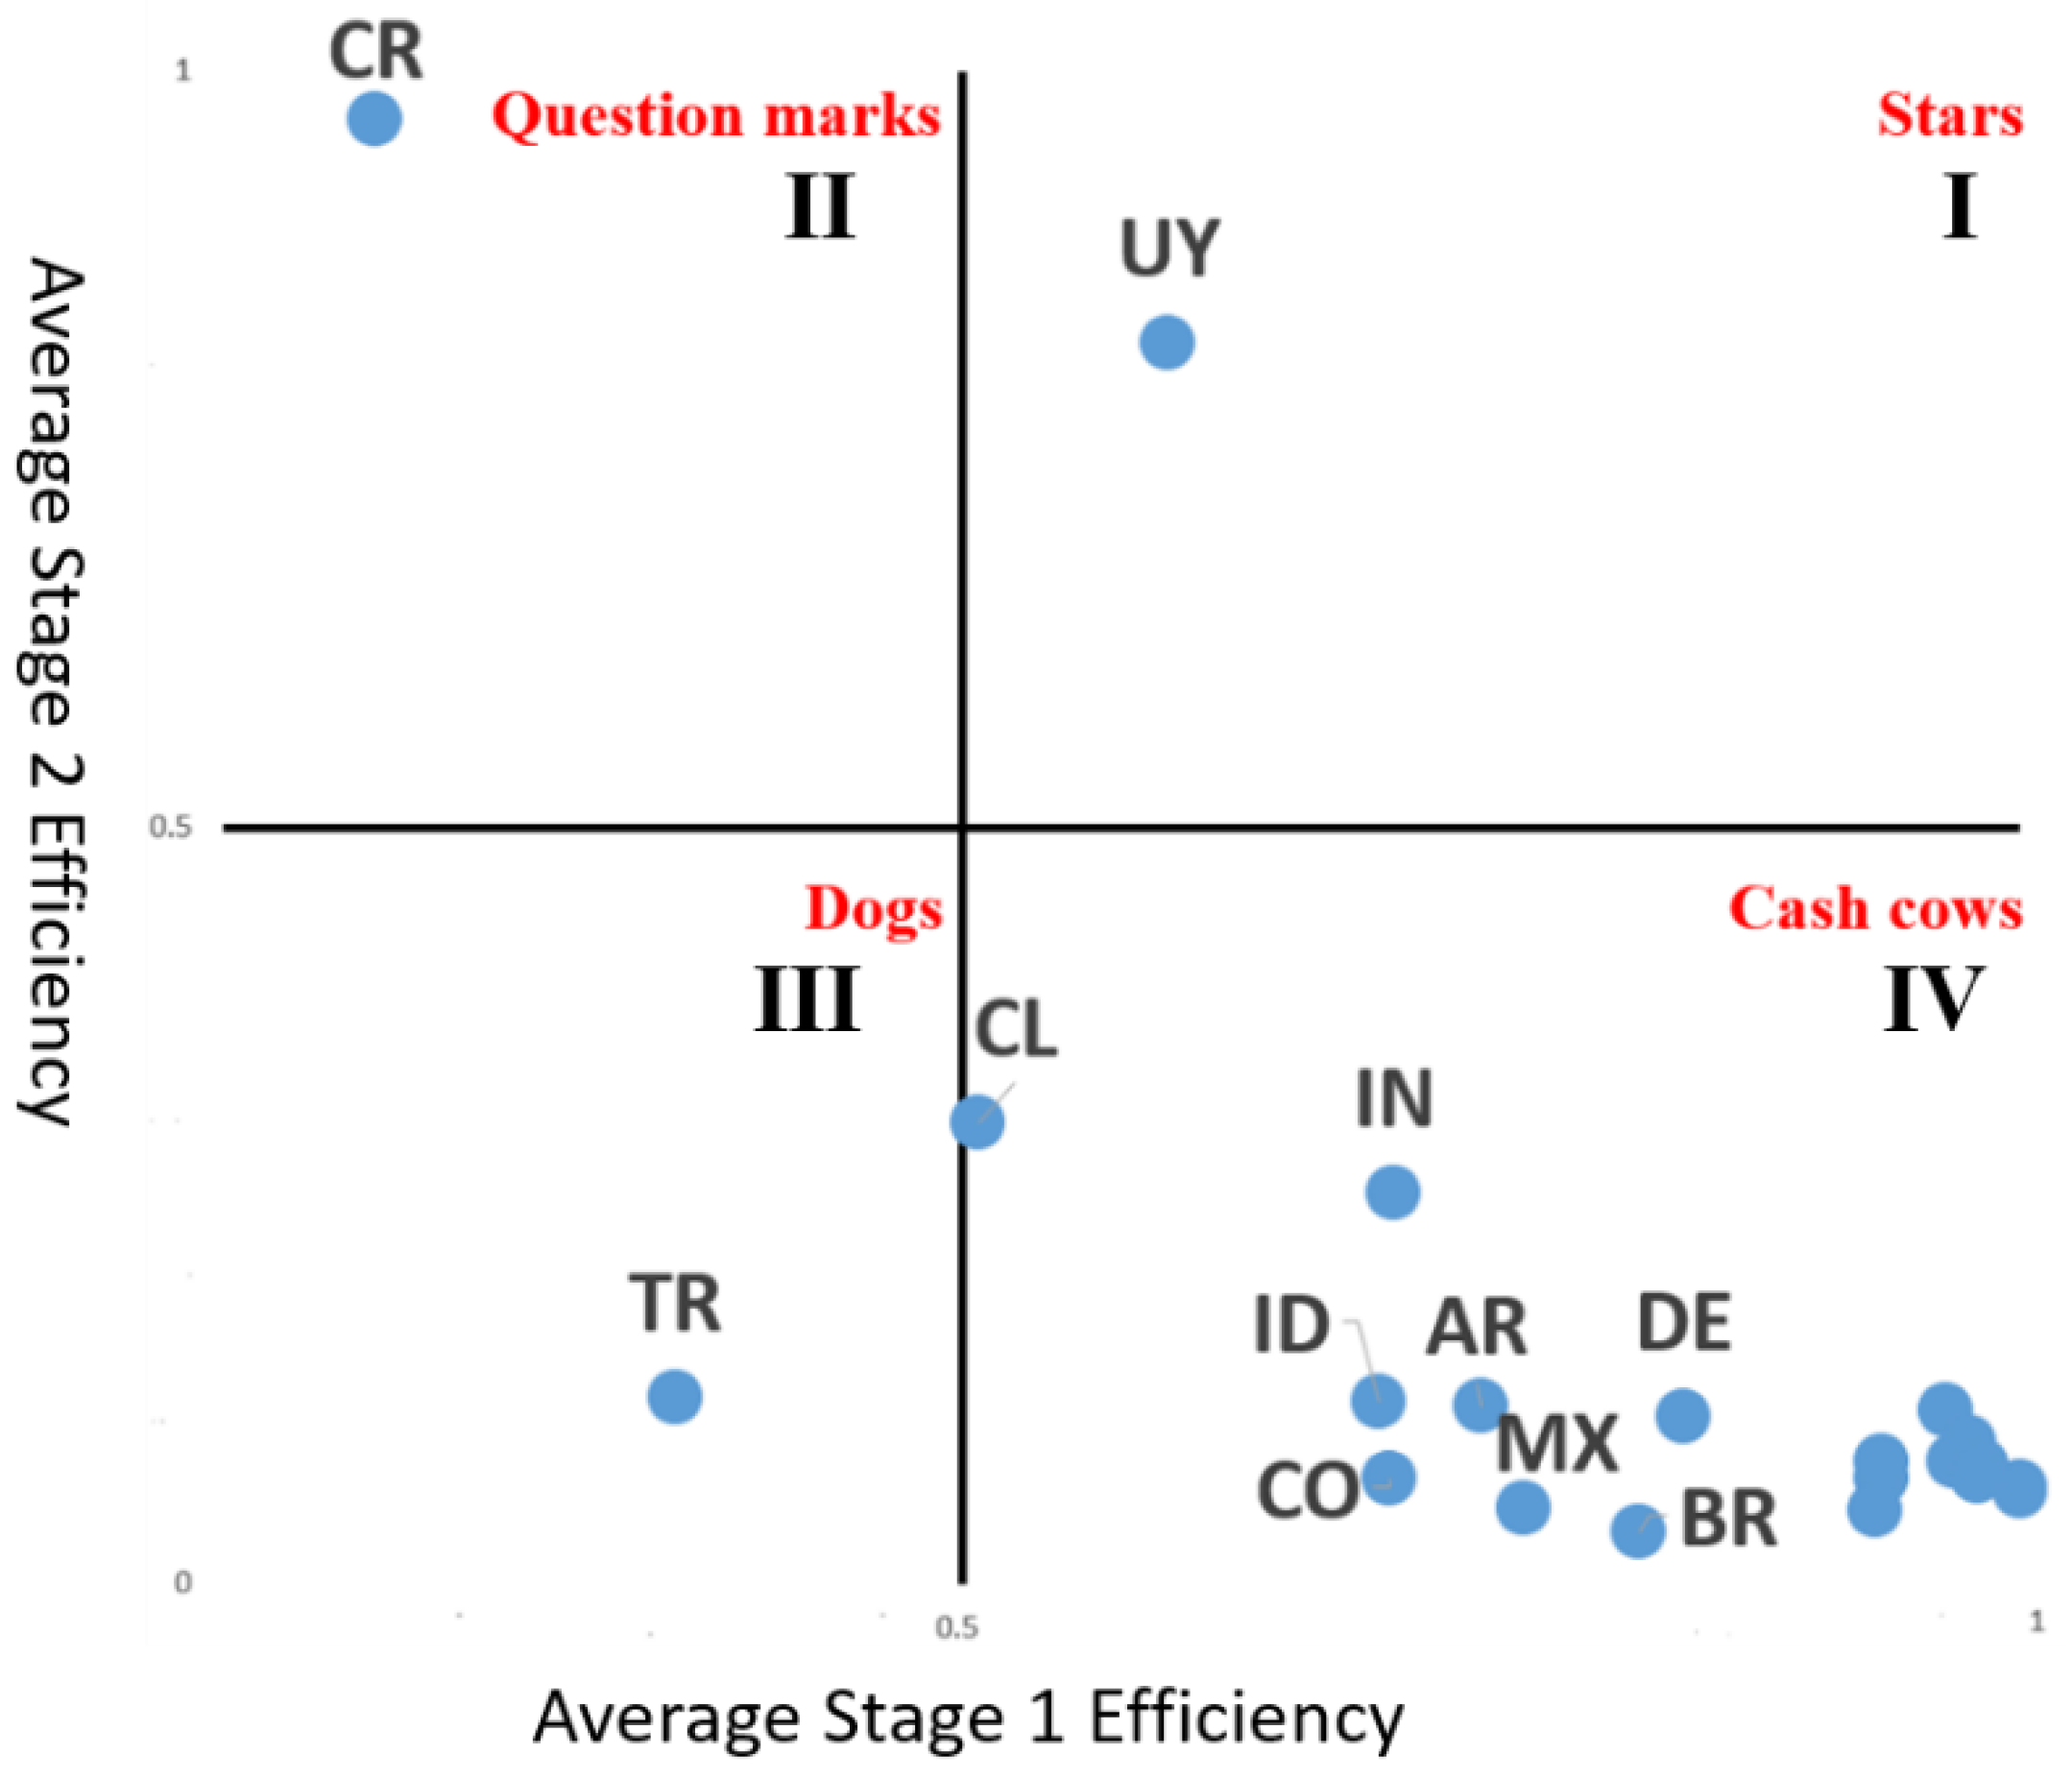
Data Envelope Analysis (DEA) is a nonparametric statistical efficiency analysis method used to compare which in a set of decision-making units (DMU) is performing best and identify poor performers. DEA does not need to make any assumptions about the efficiency of decision-making units and can use multiple inputs and outputs simultaneously. DEA also defines the efficiency of each decision unit [29,30]. DEA has also been used for efficiency assessments in many domains and types, including the chemical industry, the credit card industry, financial services, and athlete performance [31]. DEA constructs a segmented efficiency frontier for multiple decision-making units through mathematical programming. The distance between the evaluation of each decision-making unit relative to the frontier varies in the interval of 0 to 1.
Since 1990, numerous studies have investigated the performance of the banking industry through the DEA. These studies have begun to explain the overall performance of the banking sector from different perspectives and structures, but lack the impact of intermediate products. Seiford et al. [32] divided DEA into two stages and constructed a two-stage DEA by sharing inputs. The first stage of the method is the bank’s profitability, which also determines the marketability of the bank in the second stage. Fukuyama and Matousek [33] reviewed a series of parallel and serial network models that used a two-stage processing flow to analyze revenue performance using deposits as a link between initial resources and final outputs, or “bridges”.
The origin of the two-stage network data envelopment analysis approach can be described from the traditional DEA CCR model of Charnes et al. [34]. Assumed constant returns in DMU k , denote X i j and i as 1 to m and Y r j and r as 1 to s . The u r , v i     0 are the variable weights to be determined by the solution of the problem. The X and Y are all positive values and score from 0 to 100 and the DEA model is set to the input of i th and the output of r th as follow:
E k = m a x r = 1 s u r Y r k   /   i = 1 m v i X i k s . t .   r = 1 s u r Y r j   /   i = 1 m v i X i j 1 , j = 1 , , n , w p , v i ε , r = 1 , , s ;   i = 1 , , m ,
where ε is a small non-Archimedean, each DMU produces an output of s from an input of m , and E k is the relative efficiency of DMU k; if E k is 1, it means that the DMU is efficient, and if it is less than 1, it is inefficient.
If the current DEA model consists of the two processes in Figure 1, the overall process passes through the input X i k of m , i is 1 to m , which produces the output Y r k of s , and r is 1 to s . Including q intermediate products Z p k , p is 1 to q . Z p k is also the output of the first stage and the input of the second stage, and (2) and (3) describe the efficiency E k 1 of the first stage and the efficiency E k 2 of the second stage.
E k 1 = m a x p = 1 q W p Z p k / i = 1 m v i X i k s . t .   p = 1 q W p Z p j / i = 1 m v i X i j 1 , j = 1 , , n ,     w p , v i ε , p = 1 , , q ,   i = 1 , , m ,
E k 2 = m a x r = 1 s u r Y r k   /   p = 1 q w p Z p k s . t .   r = 1 s u r Y r j / p = 1 q w p Z p j 1 , j = 1 , , n ,           u r , w p ε , r = 1 , , s ;   p = 1 , , q .  
The essence of 2a and 2b is the same as that of (1), in order to independently calculate the efficiency of the two processes. In order to link the two stages into an overall process, the model must describe the series relationship between the overall process and the two sub-processes [35].
E k = r = 1 s u r Y r k   /   i = 1 m v i X i k 1 , E k 1 = p = 1 q w p Z p k   /   i = 1 m v i X i k 1 , E k 2 = r = 1 s u r Y r k   /   p = 1 q w p Z p k 1 ,
The overall efficiency is the product of the two-stage efficiencies:
E k = E k 1 × E k 2
Based on the concept of (3), the method to calculate the overall efficiency E k , considering the tandem relationship of the two stages, the proportional limit constraint of the tandem relationship of the two stages is finally incorporated into (1).
E k = m a x r = 1 s u r Y r k   /   i = 1 m v i X i k s . t .   r = 1 s u r Y r j   /   i = 1 m v i X i j 1 , j = 1 , , n , p = 1 q w p Z p j   /   i = 1 m v i X i j 1 , j = 1 , , n , r = 1 s u r Y r j   /   p = 1 q w p Z p j 1 , j = 1 , , n , u r , w p , w p ε , r = 1 , , s ;   i = 1 , , m ;   p = 1 , , q .

2.5. BCG Matrix

The Boston Consulting Group (BCG) Matrix is a four-celled matrix (a 2 × 2 matrix) developed by BCG, USA. It is the most renowned corporate portfolio analysis tool. It provides a graphic representation for an organization to examine different businesses in its portfolio on the basis of their related market share and industry growth rates. It is a two-dimensional analysis of SBU’s (Strategic Business Units) management. In other words, it is a comparative analysis of business potential and the evaluation of the environment. The BCG matrix helps companies allocate resources and is used as an analytical tool for brand marketing, product, and strategic management [36]. The BCG matrix uses an indicator for each of the two criteria for classifying core areas of activity. Market attractiveness is assessed based on its growth rate and business competitiveness is based on its market share relative to the most robust competitors [37]. The BCG matrix has four cells to indicate different types of businesses: Question Marks: businesses operating in high-growth markets but having low relative market shares, Stars: a successful Question Mark becomes a Star, a market superior in a high-growth market, Dogs: target with weak market shares in low growth markets are called Dogs, and Cash Cows: a Star with the biggest market share becomes a Cash Cow [38].
Since the BCG matrix uses an indicator for each of the two criteria for classifying core areas of activity. Therefore, countries in this study could be classified as high or low according to their efficiency of two stages.

2.6. Association Rule Mining

Association rule mining can find frequent patterns among itemsets; its purpose is to extract interesting associations, patterns, and correlations between itemsets in data warehouses [39]. The most commonly used algorithm for association rule mining is HotSpot. The HotSpot algorithm can directly mine association rules and dynamically acquire the range of actual number intervals without the discretization of actual data [40]. The HotSpot algorithm can generate association rules for a classification issue. It is also a straightforward and effective algorithm for building association rules from a tree structure, it maximizes or minimizes a target attribute or value of interest [41].
In order to understand what characteristics the effective countries in anti-corruption have, the HotSpot algorithm is used in this study.

3. Materials and Methods

3.1. Open Data Barometer ODB

The Open Data Barometer (ODB) was established by the World Wide Web Foundation to explore the global impact of open government data initiatives (https://opendatabarometer.org accessed on 15 June 2020). Through peer-reviewed expert surveys, ODB covers the context, policy, implementation, and impact of publicly available data and conducts detailed surveys of government datasets, including data availability, format, licensing timeliness, and discoverability. The ODB also obtained auxiliary data from the World Economic Forum, the International Telecommunication Union (ITU), the United Nations e-Government Survey, and Freedom House to help with the survey. The architecture of ODB can be divided into three sub-indices, namely, readiness, implementation, and impact.

3.2. Corruption Perceptions Index CPI

The Corruption Perception Index (CPI) is an anti-corruption index established by Transparency International that focuses on eliminating corruption and injustice and promoting transparency, accountability, and integrity in society and surveys in more than 100 countries and territories (https://www.transparency.org/en/cpi accessed on 15 June 2020). The CPI is based on the identification of experts and business executives on the level of corruption in the country’s public sector; it is a comprehensive index collected by multiple agencies that conduct multiple corruption investigations and is currently the most widely used index to discuss a country’s level of anti-corruption.

3.3. Gross Domestic Product GDP

Gross Domestic Product (GDP) measures the added value created by a country through producing goods and services in a certain period. It is also one of the most important indexes to measure a country’s economic activity [42]. A country’s gross domestic product is usually calculated by the country’s statistical agency, which gathers information from multiple sources and follows established national standards for calculation. GDP is measured in the currency of the country in question, and adjustments are needed when trying to compare the output of other countries in different currencies, usually by converting the GDP value of the country being compared to US dollars [5].

3.4. Study Framework

The main steps of this study process are divided into data collection, input, and selection of input variables, followed by a two-stage data envelopment analysis for efficiency evaluation. Finally, the evaluation results are discussed. The complete research process is shown in Figure 2 and described as follows.
  • Data collection: Since the countries collected in the ODB are not consistent each year, we only have to choose the countries that recur from 2013 to 2017. Therefore, this study collected CPI, ODB, and GDP data for 21 countries that recur from 2013 to 2017, and the GDP data are from the World Bank database.
  • Selection of input–output variables: According to the 11 variables included in CPI, ODB, and GDP data from 2013 to 2017, input, intermediate, and output variables were selected.
  • Performance evaluation: A two-stage network data envelopment analysis was performed on the selected research variables to calculate the anti-corruption efficiency of 21 countries from 2013 to 2017.
  • Results and Discussion: Average ranking of 21 countries for anti-corruption efficiency values from 2013 to 2017, and a discussion of several high- and low-performing countries.

3.4.1. Data Collection

The ODB and CPI indexes developed by the Global Information Network Foundation and the International Organization for Transparency are published on the official website and are available for download. This study collected 21 countries that included ODB and CPI indexes between 2013 and 2017. GDP data comes from the World Bank database. There are nine variables in the ODB indicator data; GDP and CPI are univariate, and all research variables are shown in Table 4, the variables x 1 ~ x 6 and z 1 ~ z 3 are ODB index, including the Readiness, Implementation, and Impact of the country’s open government data. z 4 is the GDP of the included country and y 1 is the CPI score of the country. Both CPI and ODB have variable values between 0 and 100, the higher the score, the better.
The ODB indicator data included in this study includes nine variables divided into three categories: readiness, implementation, and impact. Readiness refers to whether the country has measures and arrangements related to open data and strategies such as legal support. The implementation is to ask experts and the media whether the country has opened the data, whether the data conforms to a specific format, whether it is updated in real-time, etc. The impact is a questionnaire for experts asking whether the country has improved the efficiency and effectiveness of government through open data and whether it has had a positive impact on the economy. This study uses the Readiness and Implementation variables in the ODB index as the input, and Impact as the output of the first stage. This phase describes whether the country is helping to improve the efficiency and effectiveness of government by opening up government data. The second stage is to measure the anti-corruption efficiency of 21 countries through the mediating variables of the ODB indicator, Impact, and GDP.

3.4.2. Efficiency Assessment

According to the OGP’s webpage, corruption seriously affects economic development, and a transparent government can improve business efficiency and stimulate economic and investment opportunities. Fighting corruption is also fundamental to OGP’s commitment. Hence, this study aims to measure the effectiveness of governments in fighting corruption through the implementation of open government data and economic growth. Based on the studies of Fukuyama and Matousek [33], Aviles-Sacoto et al. [43], and Kao and Hwang [35], this study adopts a two-stage network model to evaluate the efficiency of anti-corruption, and the efficiency analysis scenario is shown in Figure 3.

4. Results

4.1. Two-Stage DEA Results

This study uses open data barometers ODB, Anti-Corruption Index CPI, and Gross Domestic Product (GDP) and uses a two-stage network data envelopment analysis method to evaluate the effectiveness of anti-corruption in 21 countries. The structure diagram of each stage of the two-stage network data envelopment analysis method is shown in Figure 4. Table 5 shows the evaluated results of anti-corruption efficiency of two stages in 21 countries from 2013 to 2017. Furthermore, the overall efficiency in total, and the trend graph of efficiency are also shown in Table 6.
As shown in Table 5, the evaluation results show that most countries have less efficiency in stage 2, which may be related to the slow pace of global economic recovery. According to the 2013 Global Economic Outlook of the OECD, the average growth rate of global GDP in 2013 was only 2.7%, much lower than the previous average growth rate of 4%. Therefore, countries with an excellent efficiency in the first stage may be accompanied by the stagnation of the global economy, resulting in a general decline in inefficiency in Stage 2. However, there still have countries with improved efficiency. Leviäkangas and Molarius [44] found that the economic value added due to open government data. Surabhi [45] states that the open data ecosystem will add USD 22 billion to India’s GDP by 2020. Although there are many studies and reports that open government data helps the economy and creates economic value-added, the economic value established by GDP and open government data may only account for a fraction of GDP, which may be the efficiency of Stage 2 performance are significant differences.
From the trend chart in Table 6, Australia, Colombia, Costa Rica, Turkey, the United Kingdom, and the United States seem to have similar trends; if the grouping algorithm is performed well, they should group together.

4.2. Discussion

4.2.1. Efficiency Assessment

According to the results of the two-stage network data envelopment analysis, this study ranks the 5-year average anti-corruption efficiency of 21 countries as shown in Table 7. It can be seen that Uruguay and Costa Rica are the two countries with the highest overall efficiency, and Turkey is the country with the lowest efficiency.
After adopting the two-stage network data envelopment analysis approach, this study uses the approach of [46] to introduce the efficiency of two stages into the BCG matrix to observe the distribution of countries. Using the quadrant distribution of decision-making units, countries can be divided into Stars, Cash cows, Question marks, and Dogs as shown in Figure 5. In addition, Figure 6 shows the distribution results of the overall BCG matrix for this study from 2013 to 2017. Both the x-axis and the y-axis in Figure 6 are unitless from 0 to 1. The clusters of countries seem to be different from the clusters of trend chart in Table 6.
From the definition of the BCG matrix, Stars have solid performances, and Question Marks have the potential to become Stars as long as they dare to challenge and take risks. Based on the BCG matrix in Table 8 and Figure 6, this study collected other works of literature and explained the development of open government data, economic growth, and corruption on three countries: Uruguay, Costa Rica, and Turkey. Uruguay is the Star, Costa Rica is the Question Mark, and Turkey is the Dog that is not performing as expected.
  • Uruguay
Uruguay is considered a country with a modern open access regime. After Uruguay ended its dictatorship, party politics reached a new balance, moving towards social modernization and economic openings. Uruguay was the second group member to join the Open Government Relationship (OGP) in 2011, which is also part of the Uruguayan government’s e-strategy [47]. A study by Buquet et al. [48] noted that most countries with high scores on the Corruption Perception Index (CPI) have higher CPIs and lower corruption levels, and Uruguay is a representative of them.
AGESIC (the Agency for e-Government and Information Society) has launched a series of open data activities in Uruguay to ensure that Uruguay’s e-government strategy aligns with the latest global trends with digital agendas. The agenda describes Uruguay’s strategy from 2011 to 2015, with key objectives including the disclosure of government data and the ability of citizens and businesses to use this data, the detailed activities are to adjust the two regulations and science and technology items. The regulations are mainly aimed at formulating the norms for releasing open data. The science and technology are to discuss the necessity and function of the construction of the open data platform, and define several rules that should be followed, and the format to ensure the openness of data [49].
Known as the cleanest country in Latin America, Uruguay is also a major financial center and a country with a long tradition of democracy and low unemployment. In the 2015 Latin Barometer Survey, Uruguayan citizens reported very low levels of corruption when using public services [50].
  • Costa Rica
According to a World Bank report on Costa Rica, Costa Rica has achieved developmental success and is considered an upper-middle-income country with a steady economic growth over the past 25 years. This growth results from an outward-looking strategy based on opening up to foreign investment and gradual trade liberalization. Costa Rica is also a global leader in environmental policy achievements, with success in forest and biodiversity conservation, making Costa Rica the only tropical country to reverse deforestation.
According to the results of the 2018 Costa Rica Public Sector Transparency Index (ITSP), the national average is a 34.55% transparency, a 50.15% information access rate, and a 21.20% public data availability. Costa Rica currently has an open government data platform. However, most of the data it provides is outdated, so even with relevant access to information laws, Rodriguez-Arias and Cortes-Morales [51] argue that other successful countries can use Taiwan as the reference object. Costa Rica joined the Open Government Relationship in 2012, and political momentum is key to the introduction and expansion of open data. Costa Rica initially made positive progress in making data public, but now lacks further progress and government action [52]. According to the current OGP webpage description, Costa Rica has proposed a national action plan for 2019–2022, which includes strengthening the capacity of the public sector and citizens to prevent corruption.
  • Turkey
EROĞLU [53] states that Turkey does not have a policy on open government data and related platforms, nor does it use open data or guidelines to build platforms at the central government level. The overall open government data policy and related platforms are still in their infancy in Turkey. However, Turkey’s official policies tend to be passive rather than active, which indirectly suggests that Turkey is not actively developing open government data. In 2016, the Turkish Prime Minister declared a three-month state of emergency over a coup, imprisoning 152 journalists and closing 174 media outlets, leading to the OGP Committee’s decision to withdraw from Turkey’s partnership.
According to the World Bank, Turkey is described as a historic center connecting China and the Mediterranean, with ports on both the Mediterranean and the Black Sea. It has an important strategic and economic significance as a channel connecting Europe, North Africa, the Middle East, and Central Asia. However, the reckless economic policies of the Turkish Prime Minister, including artificially low-interest rates and high debt, have led to economic deficits and inflation, and a large number of foreigners and investors have fled Turkey, causing Turkey to face huge foreign debts [54]. Kimya [55] pointed out that corruption is divided into two levels: large and small. Turkey has achieved certain results in improving small-scale corruption, such as simply reducing corruption-related crime rates, etc., but the ruling party has failed to enact party and campaign finance reforms under the law, widening nepotism between the government and certain companies, and securing lucrative bids for some. As a result, Turkey lacks the guidelines for opening up government data and building-related platforms, and certain companies benefit from arbitrary decisions to jail journalists and shut down many media outlets. This results in Turkey ranking last in the study for anti-corruption efficiency.

4.2.2. Association Rule Analysis

This study analyzes the anti-corruption efficiency analysis of 21 countries through two-stage network data envelopment analysis and the BCG matrix and discusses three countries that play different roles. If countries in different quadrants need to improve and strengthen the recommendations in the future, the adjustment may be even more overwhelming in the face of so many different indicators. Some suggestions can be given from the analysis of association rules. Association rule analysis is an analysis method in data mining, whose purpose is to find the regularity between different attributes in a large amount of data recorded in a large database through a specific measure. In this study, the HotSpot algorithm in the data mining software WEKA3.8 (Waikato Environment for Knowledge Analysis) was used to analyze the association rules. The HotSpot algorithm finds a set of tree-structured rules to maximize or minimize based on the target item of interest to the user and rules for finding various data types such as categorical and numeric types. If the target attribute is continuous numerical data, the HotSpot algorithm finds a rule that is higher than the average of the target attribute. In this study, the HotSpot algorithm will be performed for an analysis year by year (2013–2017), and a 5-year overall analysis is also included. Furthermore, the target attribute is set to Efficiency.
Algorithm 1 is a schematic result from running the HotSpot algorithm in 2013. The results show that if the included countries want to achieve an overall efficiency that exceeds the average level of 0.4449, the annual CPI must greater than 71, and the GDP must be less than or equal to 552,025 (unit: million). Countries with an average efficiency greater than 0.4449 in 2013 and meet the above rules are AU, CA, CR, DE, JP, UK, US, PH, UY, and ZA. The results of the HotSpot algorithm for other years are also listed in Table 9 for comparison.
Algorithm 1 2013 Hot Spot result
Mode: maximize
Total population: 21 instances
Target attribute: efficiency
Target average in total population: 0.445
Minimum segment size: 7 instances (33% of total population)
Maximum branching factor: 2
Maximum rule length: 3
Minimum improvement: 1s increase in average

efficiency (0.4449)
 2013CPI > 71 (0.5619:1.26x [7])
 GDP <= 552,025.1403(0.5514:1.24x [7])
Table 8 is a consolidated table of the association rules of the HotSpot algorithm compiled by this study. In addition to sorting out the rules for each year (2013–2017) where key attribute values exceed the average value, countries that meet the above rules are also listed. Attributes related to target attribute efficiency, such as GDP, CPI, ready-government, ready-business, Implementation-Innovation, etc., can be observed from the collation.
In addition to the yearly analysis, this study additionally aggregates the mean of attributes for all years in every country and their overall efficiency for analysis as shown in Table 9. Algorithm 2 is the schematic result from running the HotSpot algorithm. The results show that we have two rules obtained. First, if the included countries want to achieve an overall efficiency that exceeds the average level of 0.5202, the mean of GDP must be less than or equal to 574,850 (unit: million), and the mean of the annual CPI must be greater than 45.4. These included countries are UY, CR, Z, and PH. Second, if the included countries want to achieve an overall efficiency that exceeds the average level of 0.5202, the mean of the annual CPI must be less than or equal to 79.2, and the mean of the GDP must be less than or equal to 2,853,779 (unit: million). These included countries are UK, JP, and USA.
Algorithm 2 HotSpot algorithm for 5-years
Mode: maximize
Total population: 21 instances
Target attribute: Overall-efficiency
Target average in total population: 0.52
Minimum segment size: 7 instances (33% of total population)
Maximum branching factor: 2
Maximum rule length: 3
Minimum improvement: 1s increase in average
Overall-efficiency (0.5202)
 GDP <= 574,850.8282 (0.5986:1.15x [7])
 CPI > 45.4 (0.5835:1.12x [10])

 |CPI <= 79.2 (0.6138:1.05x [7])
 |GDP <= 2,853,779.892 (0.6103:1.05x [7])
The results of association rule analysis show that the variables related to the efficiency of the two-stage network data envelopment analysis method. In addition to GDP and CPI, it also includes other variables of government data disclosure indicators, which represent certain regularities between anti-corruption and the economy, and government open data also has its representativeness. The variables related to open government data explored by association rules include Readiness-Government, Readiness-Business, and Implementation-Innovation. Readiness-Government represents whether a national government has a clearly defined open data policy, a consistent approach to open data management and publication and operates its own open data program. ready-business describes whether the national government allows enterprises to use open government data and train relevant talents, and whether it is willing to allocate funds to support the innovation culture of open data. Implementation-Innovation means that enterprises can carry out innovative applications and value-added through open government data, such as public transportation data, international transaction data, and open contract data.

4.2.3. Geography Distribution of Countries

Based on the country’s relationship to the OGP organization, the quadrant, and the region of the BCG matrix, the results of this study are compiled into Table 10, which shows when these countries became members of the OGP and whether there are action plans for improvement. In addition to discussing economic issues, the G20, the annual meeting of leaders of the world’s largest and fastest-growing economies, in 2014, members advocated open government data as a weapon against corruption. Signed by the G8 industrialized nations, the Open Data Charter pledges to make public sector data freely available in a reusable format.
Although Turkey is currently a member of the G20, it has not yet joined the OGP and has not passed the Open Data Charter. Furthermore, policymakers are not actively developing open data projects. Therefore, the findings suggest that Turkey cannot resist corruption through open data. Costa Rica and Uruguay, which both joined the OGP in 2011 and early 2012, also support the Open Data Charter and are located in Latin America. Perhaps the main goal in Latin America is to fight corruption through open data.

5. Conclusions

Corruption is closely related to economic growth, and many international non-profit organizations conduct corruption statistical surveys to help understand corruption in many countries. Corruption not only undermines corporate growth, distorts public spending, and deteriorates infrastructure, but also affects the willingness of domestic and foreign investors, so understanding how effectively countries are implementing anti-corruption is the main purpose of this study. This study collects ODB, CPI, and GDP indexes to understand the anti-corruption efficiency of the surveyed countries and uses the two-stage network data envelopment analysis approach to analyze the anti-corruption efficiency scores of 21 countries from 2013 to 2017. The discussions of the included countries for their possible improvement in anti-corruption are also provided by using the association rule’s analysis. According to the analysis results, Central and South American countries such as Uruguay and Costa Rica are the two countries with the highest annual total efficiency. Turkey is the worst country in the assessment, mainly due to the lack of regulations and policies in the implementation of open data in Turkey, and the ineffectiveness of anti-corruption due to poor decision-making by leaders, improving the public sector, people’s awareness, and the understanding of open data in the future may be an important project that Turkey can improve.
The limitations in this study are that the countries collected in the ODB are not consistent each year, so we only have to choose the countries that recur from 2013 to 2017. Therefore, all analyses can only be done based on these 21 countries collected. Nevertheless, the data of the ODB currently only collects until 2017, so it is not possible to do further analysis in subsequent years. However, our proposed analysis in this study can be applied to other indicators for further investigations.

Author Contributions

Conceptualization, D.C.Y.; Data curation, T.-W.W.; Formal analysis, P.-Y.S. and T.-W.W.; Funding acquisition, D.-H.S.; Investigation, C.-P.C.; Methodology, P.-Y.S., C.-P.C. and D.-H.S.; Project administration, D.-H.S. and D.C.Y.; Resources, D.-H.S.; Software, P.-Y.S. and T.-W.W.; Supervision, D.C.Y.; Validation, P.-Y.S. and C.-P.C.; Writing—original draft, T.-W.W.; Writing—review and editing, D.-H.S. All authors have read and agreed to the published version of the manuscript.

Funding

This work was partially supported by the Taiwan Ministry of Science and Technology (grants MOST 110-2410-H-224-010). The funder has no role in study design, data collection and analysis, decision to publish, or preparation of the manuscript.

Institutional Review Board Statement

Not applicable.

Informed Consent Statement

Not applicable.

Data Availability Statement

Not applicable.

Conflicts of Interest

The authors declare no conflict of interest.

References

  1. Mauro, P. Corruption and Growth. Q. J. Econ. 1995, 110, 681–712. [Google Scholar] [CrossRef]
  2. Elliott, K.A. Problem of Corruption: A Tale of Two Countries. Netw. J. Int. Law Bus. 1997, 18, 524. [Google Scholar]
  3. Brown, D.S.; Touchton, M.; Whitford, A. Political Polarization as a Constraint on Corruption: A Cross-national Comparison. World Dev. 2011, 39, 1516–1529. [Google Scholar] [CrossRef] [Green Version]
  4. Ubaldi, B. Open government data: Towards empirical analysis of open government data initiatives. Open Gov. Data 2013. [Google Scholar] [CrossRef]
  5. Callen, T. Gross Domestic Product: An Economy’s All; International Monetary Fund: Washington, DC, USA, 2020. [Google Scholar]
  6. Gründler, K.; Potrafke, N. Corruption and economic growth: New empirical evidence. Eur. J. Polit. Econ. 2019, 60, 101810. [Google Scholar] [CrossRef] [Green Version]
  7. Shleifer, A.; Vishny, R.W. Corruption. Q. J. Econ. 1993, 108, 599–617. [Google Scholar] [CrossRef]
  8. Svensson, J. Eight questions about corruption. J. Econ. Perspect. 2005, 19, 19–42. [Google Scholar] [CrossRef] [Green Version]
  9. Jain, A.K. Corruption: A Review. J. Econ. Surv. 2001, 15, 71–121. [Google Scholar] [CrossRef]
  10. Ella RA DI, T. Rents, Competition, and Corruption. Am. Econ. Rev. 1993, 89, 982–993. [Google Scholar]
  11. Melki, M.; Pickering, A. Polarization and corruption in America. Eur. Econ. Rev. 2020, 124, 103397. [Google Scholar] [CrossRef] [Green Version]
  12. Aragonès, E.; Rivas, J.; Tóth, Á. Voter heterogeneity and political corruption. J. Econ. Behav. Organ. 2020, 170, 206–221. [Google Scholar] [CrossRef] [Green Version]
  13. Tran, Q.T. Corruption and corporate cash holdings: International evidence. J. Multinatl. Financ. Manag. 2020, 54, 100611. [Google Scholar] [CrossRef]
  14. Sulemana, I.; Kpienbaareh, D. An empirical examination of the relationship between income inequality and corruption in Africa. Econ. Anal. Policy 2018, 60, 27–42. [Google Scholar] [CrossRef]
  15. Cummins, M.; Gillanders, R. Greasing the Turbines? Corruption and access to electricity in Africa. Energy Policy 2020, 137, 111188. [Google Scholar] [CrossRef]
  16. Dincer, O.C.; Fredriksson, P.G. Corruption and environmental regulatory policy in the United States: Does trust matter? Resour. Energy Econ. 2018, 54, 212–225. [Google Scholar] [CrossRef]
  17. Coffman, C.D.; Anderson, B.S. Under the table: Exploring the type and communication of corruption on opportunity pursuit. J. Bus. Ventur. Insights 2018, 10, e00101. [Google Scholar] [CrossRef]
  18. Denisova-Schmidt, E.; Prytula, Y. Business corruption in Ukraine: A way to get things done? Bus. Horiz. 2018, 61, 867–879. [Google Scholar] [CrossRef]
  19. Fath, S.; Kay, A.C. If hierarchical, then corrupt”: Exploring people’s tendency to associate hierarchy with corruption in organizations. Organ. Behav. Hum. Decis. Process. 2018, 149, 145–164. [Google Scholar] [CrossRef]
  20. Kučera, J.; Chlapek, D.; Nečaský, M. Open Government Data Catalogs: Current Approaches and Quality Perspective; Springer: Berlin/Heidelberg, Germany, 2013; pp. 152–166. [Google Scholar] [CrossRef]
  21. Davies, T.; Perini, F.; Alonso, J.M. Researching the emerging impacts of open data. ODDC Concept. Framew. 2013, 12, 148–178. [Google Scholar]
  22. Gigler, B.; Custer, S.; Rahemtulla, H. Realizing the vision of open government data. Opportunities, challenges and pitfalls. Open development technology alliance. 2011. [Google Scholar]
  23. Wang, V.; Shepherd, D. Exploring the extent of openness of open government data–A critique of open government datasets in the UK. Gov. Inf. Q. 2020, 37, 101405. [Google Scholar] [CrossRef]
  24. Hulstijn, J.; Darusalam, D.; Janssen, M.; Baldoni, M.; Baroglio, C.; Micalizio, R. Open Data for Accountability in the Fight against Corruption. In Proceedings of the CARe-MAS@ PRIMA, Nice, France, 31 October 2017; pp. 52–66. [Google Scholar]
  25. Florez, J.; Tonn, J. Accountability and anti-corruption. State Open Data 2019, 17–34. [Google Scholar]
  26. Žuffová, M. Do FOI laws and open government data deliver as anti-corruption policies? Evidence from a cross-country study. Gov. Inf. Q. 2020, 37, 101480. [Google Scholar] [CrossRef]
  27. Malanski, L.K.; Póvoa AC, S. Economic growth and corruption in emerging markets: Does economic freedom matter? Int. Econ. 2021, 166, 58–70. [Google Scholar] [CrossRef]
  28. Afzali, M.; Ҫolak, G.; Fu, M. Economic uncertainty and corruption: Evidence from public and private firms. J. Financ. Stab. 2021, 57, 100936. [Google Scholar] [CrossRef]
  29. Osman, I.H.; Berbary, L.N.; Sidani, Y.; Al-Ayoubi, B.; Emrouznejad, A. Data envelopment analysis model for the appraisal and relative performance evaluation of nurses at an intensive care unit. J. Med. Syst. 2011, 35, 1039–1062. [Google Scholar] [CrossRef]
  30. Chen, K.; Song, Y.; Pan, Y.; Feng, J.; Liang, G. Measuring destocking performance of the Chinese real estate industry: A DEA-Malmquist approach. Socio-Econ. Plan. Sci. 2020, 69, 100691. [Google Scholar] [CrossRef]
  31. Li, Y.; Lei, X.; Dai, Q.; Liang, L. Performance evaluation of participating nations at the 2012 London Summer Olympics by a two-stage data envelopment analysis. Eur. J. Oper. Res. 2015, 243, 964–973. [Google Scholar] [CrossRef]
  32. Seiford, L.M.; Zhu, J. Profitability and marketability of the top 55 US commercial banks. Manag. Sci. 1999, 45, 1270–1288. [Google Scholar] [CrossRef] [Green Version]
  33. Fukuyama, H.; Matousek, R. Modelling bank performance: A network DEA approach. Eur. J. Oper. Res. 2017, 259, 721–732. [Google Scholar] [CrossRef]
  34. Charnes, A.; Cooper, W.W.; Rhodes, E. Measuring the efficiency of decision-making units. Eur. J. Oper. Res. 1979, 3, 338–339. [Google Scholar] [CrossRef]
  35. Kao, C.; Hwang, S.N. Efficiency decomposition in two-stage data envelopment analysis: An application to non-life insurance companies in Taiwan. Eur. J. Oper. Res. 2008, 185, 418–429. [Google Scholar] [CrossRef]
  36. Ioana, A.; Mirea, V.; Balescu, C. Analysis of service quality management in the materials industry using the bcg matrix method. Amfiteatru Econ. J. 2009, 11, 270–276. [Google Scholar]
  37. Guță, A.J. The analysis of strategic alternatives using BCG matrix in a company. Quality 2017, 18, 358–361. [Google Scholar]
  38. Singh, J.P. Development trends in the sensor technology: A new BCG matrix analysis as a potential tool of technology selection for a sensor suite. IEEE Sens. J. 2004, 4, 664–669. [Google Scholar] [CrossRef]
  39. Karthikeyan, T.; Ravikumar, N. A survey on association rule mining. Int. J. Adv. Res. Comput. Commun. Eng. 2014, 3, 5223–5227. [Google Scholar]
  40. Qing-dao-er-ji, R.; Pang, R.; Chang, Y. An Improved HotSpot Algorithm and Its Application to Sandstorm Data in Inner Mongolia. Math. Probl. Eng. 2020, 2020, 4020723. [Google Scholar] [CrossRef] [Green Version]
  41. Thongkam, J.; Sukmak, V. Enhancing the performance of association rule models by filtering instances in colorectal cancer patients. Eng. Appl. Sci. Res. 2017, 44, 76–83. [Google Scholar]
  42. OECD Gross Domestic Product (GDP) (Indicator). 2022. Available online: https://doi.org/10.1787/dc2f7aec-en (accessed on 23 February 2022).
  43. Aviles-Sacoto, S.; Cook, W.D.; Imanirad, R.; Zhu, J. Two-stage network DEA: When intermediate measures can be treated as outputs from the second stage. J. Oper. Res. Soc. 2015, 66, 1868–1877. [Google Scholar] [CrossRef]
  44. Leviäkangas, P.; Molarius, R. Open government data policy and value added-Evidence on transport safety agency case. Technol. Soc. 2020, 63, 101389. [Google Scholar] [CrossRef]
  45. Surabhi Agarwal. Open Data Ecosystem Can Add $22 Billion to India’s GDP by 2020. The Economic Times. 2018. Available online: https://economictimes.indiatimes.com/news/economy/policy/open-data-ecosystem-can-double-farmers-income-by-2022study/articleshow/64260134.cms (accessed on 23 February 2022).
  46. Chen, Y.-C.; Hu, L.-H.; Lu, W.C.; Wu, J.-Z.; Yang, J.-J. Multiple Criteria Decision-Making for Developing an International Game Participation Strategy: A Novel Application of the Data Envelopment Analysis (DEA) Two-Stage Efficiency Process. Mathematics 2021, 9, 1700. [Google Scholar] [CrossRef]
  47. Porrúa, M.A. e-Government in Latin America: A review of the success in Colombia, Uruguay and Panama. In The Global Information Technology Report; Bilbao-Osorio, B., Dutta, S., Lanvin, B., Eds.; World Economic Forum: Geneva, Switzerland, 2013; Chapter 2.3; Available online: http://www3.weforum.org/docs/WEF_GITR_Report_2013.pdf (accessed on 23 February 2022).
  48. Buquet, D.; Piñeiro, R.; Salvat, R.; Selios, L.; Vairo, D. Corruption and politics in Uruguay. In Proceedings of the XXIInd World Congress of Political Science, Madrid, Spain, 8–12 July 2012; pp. 8–12. [Google Scholar]
  49. Köster, V.; Suárez, G. Open data for development: Experience of uruguay. In Proceedings of the 9th International Conference on Theory and Practice of Electronic Governance, Montevideo, Uruguay, 1–3 March 2016; pp. 207–210. [Google Scholar]
  50. Luijken, T. Uruguay: Overview of Corruption and Anti-Corruption. 2018. Available online: https://hdl.handle.net/10625/57676 (accessed on 24 May 2022).
  51. Rodriguez-Arias, F.; Cortes-Morales, R. Open government proposal for transparency and information access in Costa Rica. In Proceedings of the 18th International Conference on WWW/Internet, Cagliari, Italy, 7–9 November 2019; pp. 125–131. [Google Scholar]
  52. Brandusescu, A.; Iglesias, C.; Robinson, K.; Alonso, J.M.; Fagan, C.; Jellema, A.; Mann, D. Open Data Barometer: Global report.
  53. Eroğlu, Ş. Regulations on Access to Government Information and Impacts on Open Government: A Case of Turkey. Marmara Üniversitesi Siyasal Bilimler Derg. 2020, 8, 43–65. [Google Scholar] [CrossRef] [Green Version]
  54. Akçay, Ü. Neoliberal Populism in Turkey and Its Crisis; Working Paper; Institute for International Political Economy Berlin no other Information: Berlin, Germany, 2018. [Google Scholar]
  55. Kimya, F. Political economy of corruption in Turkey: Declining petty corruption, rise of cronyism? Turk. Stud. 2019, 20, 351–376. [Google Scholar] [CrossRef]
Figure 1. Two-stage DEA model.
Mathematics 10 02180 g001
Figure 2. Study process diagram.
Mathematics 10 02180 g002
Figure 3. Efficiency Analysis Scenario.
Mathematics 10 02180 g003
Figure 4. Structure of two-stage DEA.
Mathematics 10 02180 g004
Figure 5. BCG matrix reference.
Mathematics 10 02180 g005
Figure 6. BCG matrix for the Anti-corruption efficiency in total.
Mathematics 10 02180 g006
Table 1. Corruption related study.
MethodsSubjectsAuthors
Panel data analysisRelationship between cash holdings and corruption.Tran [13]
Polarization and corruption in America.Melki and Pickering [11]
Relationship between income inequality and corruption.Sulemana and Kpienbaareh [14]
Political Polarization as a Constraint on Corruption.Brown et al. [3]
Statistical modelVoter heterogeneity and political corruption.Aragonès et al. [12]
Link between corruption
and electricity access.
Cummins and Gillanders [15]
Relationship between Corruption and environmental regulatory policy.Dincer and Fredriksson [16]
Research designType and communication of corruption.Coffman and Anderson [17]
Questionnaire designCorruption at the firm-level.Denisova-Schmidt and Prytula [18]
Relationship between hierarchy and corruption.Fath and Kay [19]
Table 2. Study on open government data and corruption.
MethodsSubjectsAuthors
Case StudyMultilateral organizations’ case discussion.Florez and Tonn [25]
Government case discussion.Hulstijn et al. [24]
Panel data analysisCross-country data analysis.Žuffová [26]
Table 3. Study on economic growth and corruption.
Panel data analysisEconomic growth and corruption in emerging markets.Malanski and Póvoa [27]
Economic uncertainty and corruption.Afzali et al. [28]
Corruption and economic growth.Gründler and Potrafke [5]
Table 4. Datasets.
Table 4. Datasets.
VariablesAttributes
Inputs
x 1 : Readiness-Government-ScaledValue
x 2 : Readiness-Civil-ScaledValue
x 3 : Readiness-Business-ScaledValue
x 4 : Implementation-Innovation-ScaledValue
x 5 : Implementation-Social-Scaled Value
x 6 : Implementation-Accountability-ScaledValue
Intermediate
z 1 : Impact-Political-ScaledValue
z 2 : Impact-Social-ScaledValue
z 3 : Impact-Economic-ScaledValue
z 4 : GDPValue
Outputs
y 1 : CPIValue
Table 5. Efficiency of two stages from 2013 to 2017.
Year20132014201520162017
CountryStage 1Stage 2Stage 1Stage 2Stage 1Stage 2Stage 1Stage 2Stage 1Stage 2
Argentina0.7920.0000.5540.2110.6570.17210.1080.7210.094
Australia0.9780.0000.9590.0860.7380.12510.09010.099
Brazil10.0000.3180.0010.7830.01210.08310.071
Canada0.8790.00010.06210.0530.8140.0790.9680.049
Chile0.7680.0000.1960.8900.4710.0000.4700.4070.6330.227
Colombia0.2090.0000.8020.1870.6640.00010.0900.8350.070
Costa Rica00.8400.39710.14210.42910.1451
France0.6840.00010.110.0620.9930.0970.9960.087
Germany0.9760.0000.7710.1450.8390.02110.1920.6180.191
India0.5160.0000.12110.9310.08510.1320.9530.075
Indonesia00.03310.2300.6750.0900.9860.1420.8260.105
Italy10.00010.11110.0570.8800.1210.9680.110
Japan10.00010.0110.08010.12510.099
Mexico0.2860.0000.5400.12010.03410.05210.038
Philippines0.8890.00010.27810.06710.0830.9940.041
Russia10.00010.05710.12110.07410.054
South Africa10.0000.8990.00010.1540.9300.23410.180
Turkey00.0490.5060.0000.3700.0000.5170.3940.4280.170
UK0.9130.00010.10110.05510.12710.102
Table 6. Evaluation results of anti-corruption efficiency for each year.
Country20132014201520162017TrendAverage
Argentina0.4420.4290.4650.5540.459 Mathematics 10 02180 i0010.470
Australia0.4950.5140.4630.5460.550 Mathematics 10 02180 i0020.514
Brazil0.5000.2420.4450.5410.536 Mathematics 10 02180 i0030.453
Canada0.4680.5280.5260.4840.516 Mathematics 10 02180 i0040.504
Chile0.4350.3720.3200.450.476 Mathematics 10 02180 i0050.411
Colombia0.1730.5250.3990.5460.487 Mathematics 10 02180 i0060.426
Costa Rica0.8390.8930.8930.9320.883 Mathematics 10 02180 i0070.888
France0.4060.5470.5310.5460.542 Mathematics 10 02180 i0080.514
Germany0.4940.4990.4660.5960.455 Mathematics 10 02180 i0090.502
India0.3400.2160.5230.5660.525 Mathematics 10 02180 i0100.434
Indonesia0.0330.6020.4390.5670.499 Mathematics 10 02180 i0110.428
Italy0.5000.5540.5280.5250.546 Mathematics 10 02180 i0120.531
Japan0.5000.5030.5400.5630.550 Mathematics 10 02180 i0130.531
Mexico0.2220.3930.5170.5260.519 Mathematics 10 02180 i0140.435
Philippines0.4710.6350.5340.5410.519 Mathematics 10 02180 i0150.540
Russia0.5000.5280.5610.5370.527 Mathematics 10 02180 i0160.531
South Africa0.5000.4730.5770.5950.590 Mathematics 10 02180 i0170.547
Turkey0.0480.3360.2700.4750.351 Mathematics 10 02180 i0180.296
UK0.4770.5410.5270.5630.551 Mathematics 10 02180 i0190.532
USA0.5000.5390.5310.5550.525 Mathematics 10 02180 i0200.530
Uruguay110.54711 Mathematics 10 02180 i0210.909
Table 7. Anti-corruption efficiency in total.
CountriesOverall
Efficiency
Stage 1
Efficiency
Stage 2
Efficiency
Uruguay (UY)0.909400.597680.82005
Costa Rica (CR)0.888110.222540.96793
South Africa (ZA)0.546890.965390.11358
Philippines (PH)0.539770.976420.09360
UK (GB)0.532010.982540.07692
Japan (JP)0.5311010.06284
Italy (IT)0.530720.969550.07990
Russia (RU)0.5305810.06116
USA (US)0.529880.980510.07109
France (FR)0.514480.934600.06882
Australia (AU)0.513380.935030.08037
Canada (CA)0.504380.932240.04850
Germany (DE)0.501910.841020.10981
Argentina (AR)0.469670.744940.11719
Brazil (BR)0.452640.820230.03356
Mexico (MX)0.435350.765080.04881
India (IN)0.434010.704280.25825
Indonesia (ID)0.428130.697360.11978
Colombia (CO)0.425950.702060.06965
Chile (CL)0.410350.507510.30482
Turkey (TR)0.295990.364100.12261
Table 8. Results of association rules analysis for each year.
YearsTarget AttributeRulesCountries
2013Efficiency (0.4449)2013 CPI > 71
GDP <= 552,025.1403
AU, CA, CR, DE, JP, UK, US, PH, UY, ZA
2014Efficiency (0.5176)GDP <= 526,319.6737
Readiness-Business <= 48
CR, CO, ID, IT, PH, UY,
2015Efficiency (0.5049)Implementation-Innovation <= 47
2015 CPI > 42
CR, ID, IT, MX, RU, ZA
2016Efficiency (0.5813)GDP <= 557,531. 3762
Readiness-Government <= 66
CR, UY, ZA
2017Efficiency (0.5525)GDP <= 643,628.6653
2017 CPI > 50
CR, UY, ZA
Table 9. Mean of attributes for all years in every country.
Country x 1 x 2 x 3 x 4 x 5 x 6 z 1 z 2 z 3 z 4 y 1 Overall
Efficiency
Uruguay60.68952.459.5559.847.448.413.619.857,90272.20.9094
Costa Rica4156.239.431.1545.232.8305.455,75455.80.88811
South Africa23.864513519.832.215.224.814.2366,76543.60.54689
Philippines59.653.450.235.052733.834.229.617.2306,98735.60.53977
UK94.6889693.7590.893.68360.887.62,853,77979.60.53201
Japan74.484.874.854.758.252.444.861.639.44,897,753740.5311
Italy637547.845.55554.252.810.4411,993,81945.40.53072
Russia61.845.655.649.156.633.838.84.6451,713,23628.40.53058
USA92.282.493.487.2574.467.463.663.281.818,167,67374.40.52988
France88.692.682.480.4572.6587146.864.22,632,29569.80.51448
Australia85.883.476.885.270.660.244.847.653.81,385,58879.20.51338
Canada87.288.47890.972.46659.664.246.61,677,22381.80.50438
Germany6688.87074.6566.458.253.832.4473,624,425800.50191
Argentina39.6644742.2537.834.417.212.619.8574,850350.46967
Brazil64.666.858.64663.257.449.425.213.62,118,056400.45264
Mexico7175.65957.455.652.660.83339.61,199,81331.80.43535
India6465.447.637.25029.415.21024.22,189,14138.40.43401
Indonesia45.858.232.642.7547.62124.49.85.8922,33735.20.42813
Colombia75.46443.245.546.834.636.41614.8330,28336.80.42595
Chile55.875.657.460.5545.655.424.2012.2262,06369.40.41035
Turkey32.246.24639.3554.631.81062.4897,94843.60.29599
Table 10. Geography area of 21 countries and their characteristics.
CountryOGP
Members
OGP
Action Plan
G20
Members
Open Data CharterBCG
Quadrant
Geography Area
Indonesia201118YNIVEast Asia and Pacific
Colombia201114NYIVSouth America
Costa Rica20128NYIILatin America and the Caribbean
United Kingdom20118YYIVWestern Europe
Turkey--YNIIIWest Asia
Chile201112NYIII, IVLatin America and the Caribbean
Brazil201111YNIVLatin America and the Caribbean
Japan--YNIVEast Asia and Pacific
Germany201614YYIVWestern Europe
Mexico201113YYIVLatin America and the Caribbean
Australia20158YYIVEast Asia and Pacific
India--YNIVAsia-Pacific
Argentina201216YYIVSouth America
Canada201110YYIVNorth America
France201421YYIVWestern Europe
Italy201110YYIVSouthern Europe
Philippines201111NYIVSoutheast Asia
Russia--YNIVWest Asia
South Africa20118YNIVSouth Africa
United States 20118YNIVNorth America
Uruguay201139NYILatin America and the Caribbean
Publisher’s Note: MDPI stays neutral with regard to jurisdictional claims in published maps and institutional affiliations.

