
Data-Driven Coupling Coordination Development of Regional Innovation EROB Composite System: An Integrated Model Perspective


Abstract
:1. Introduction
2. Method
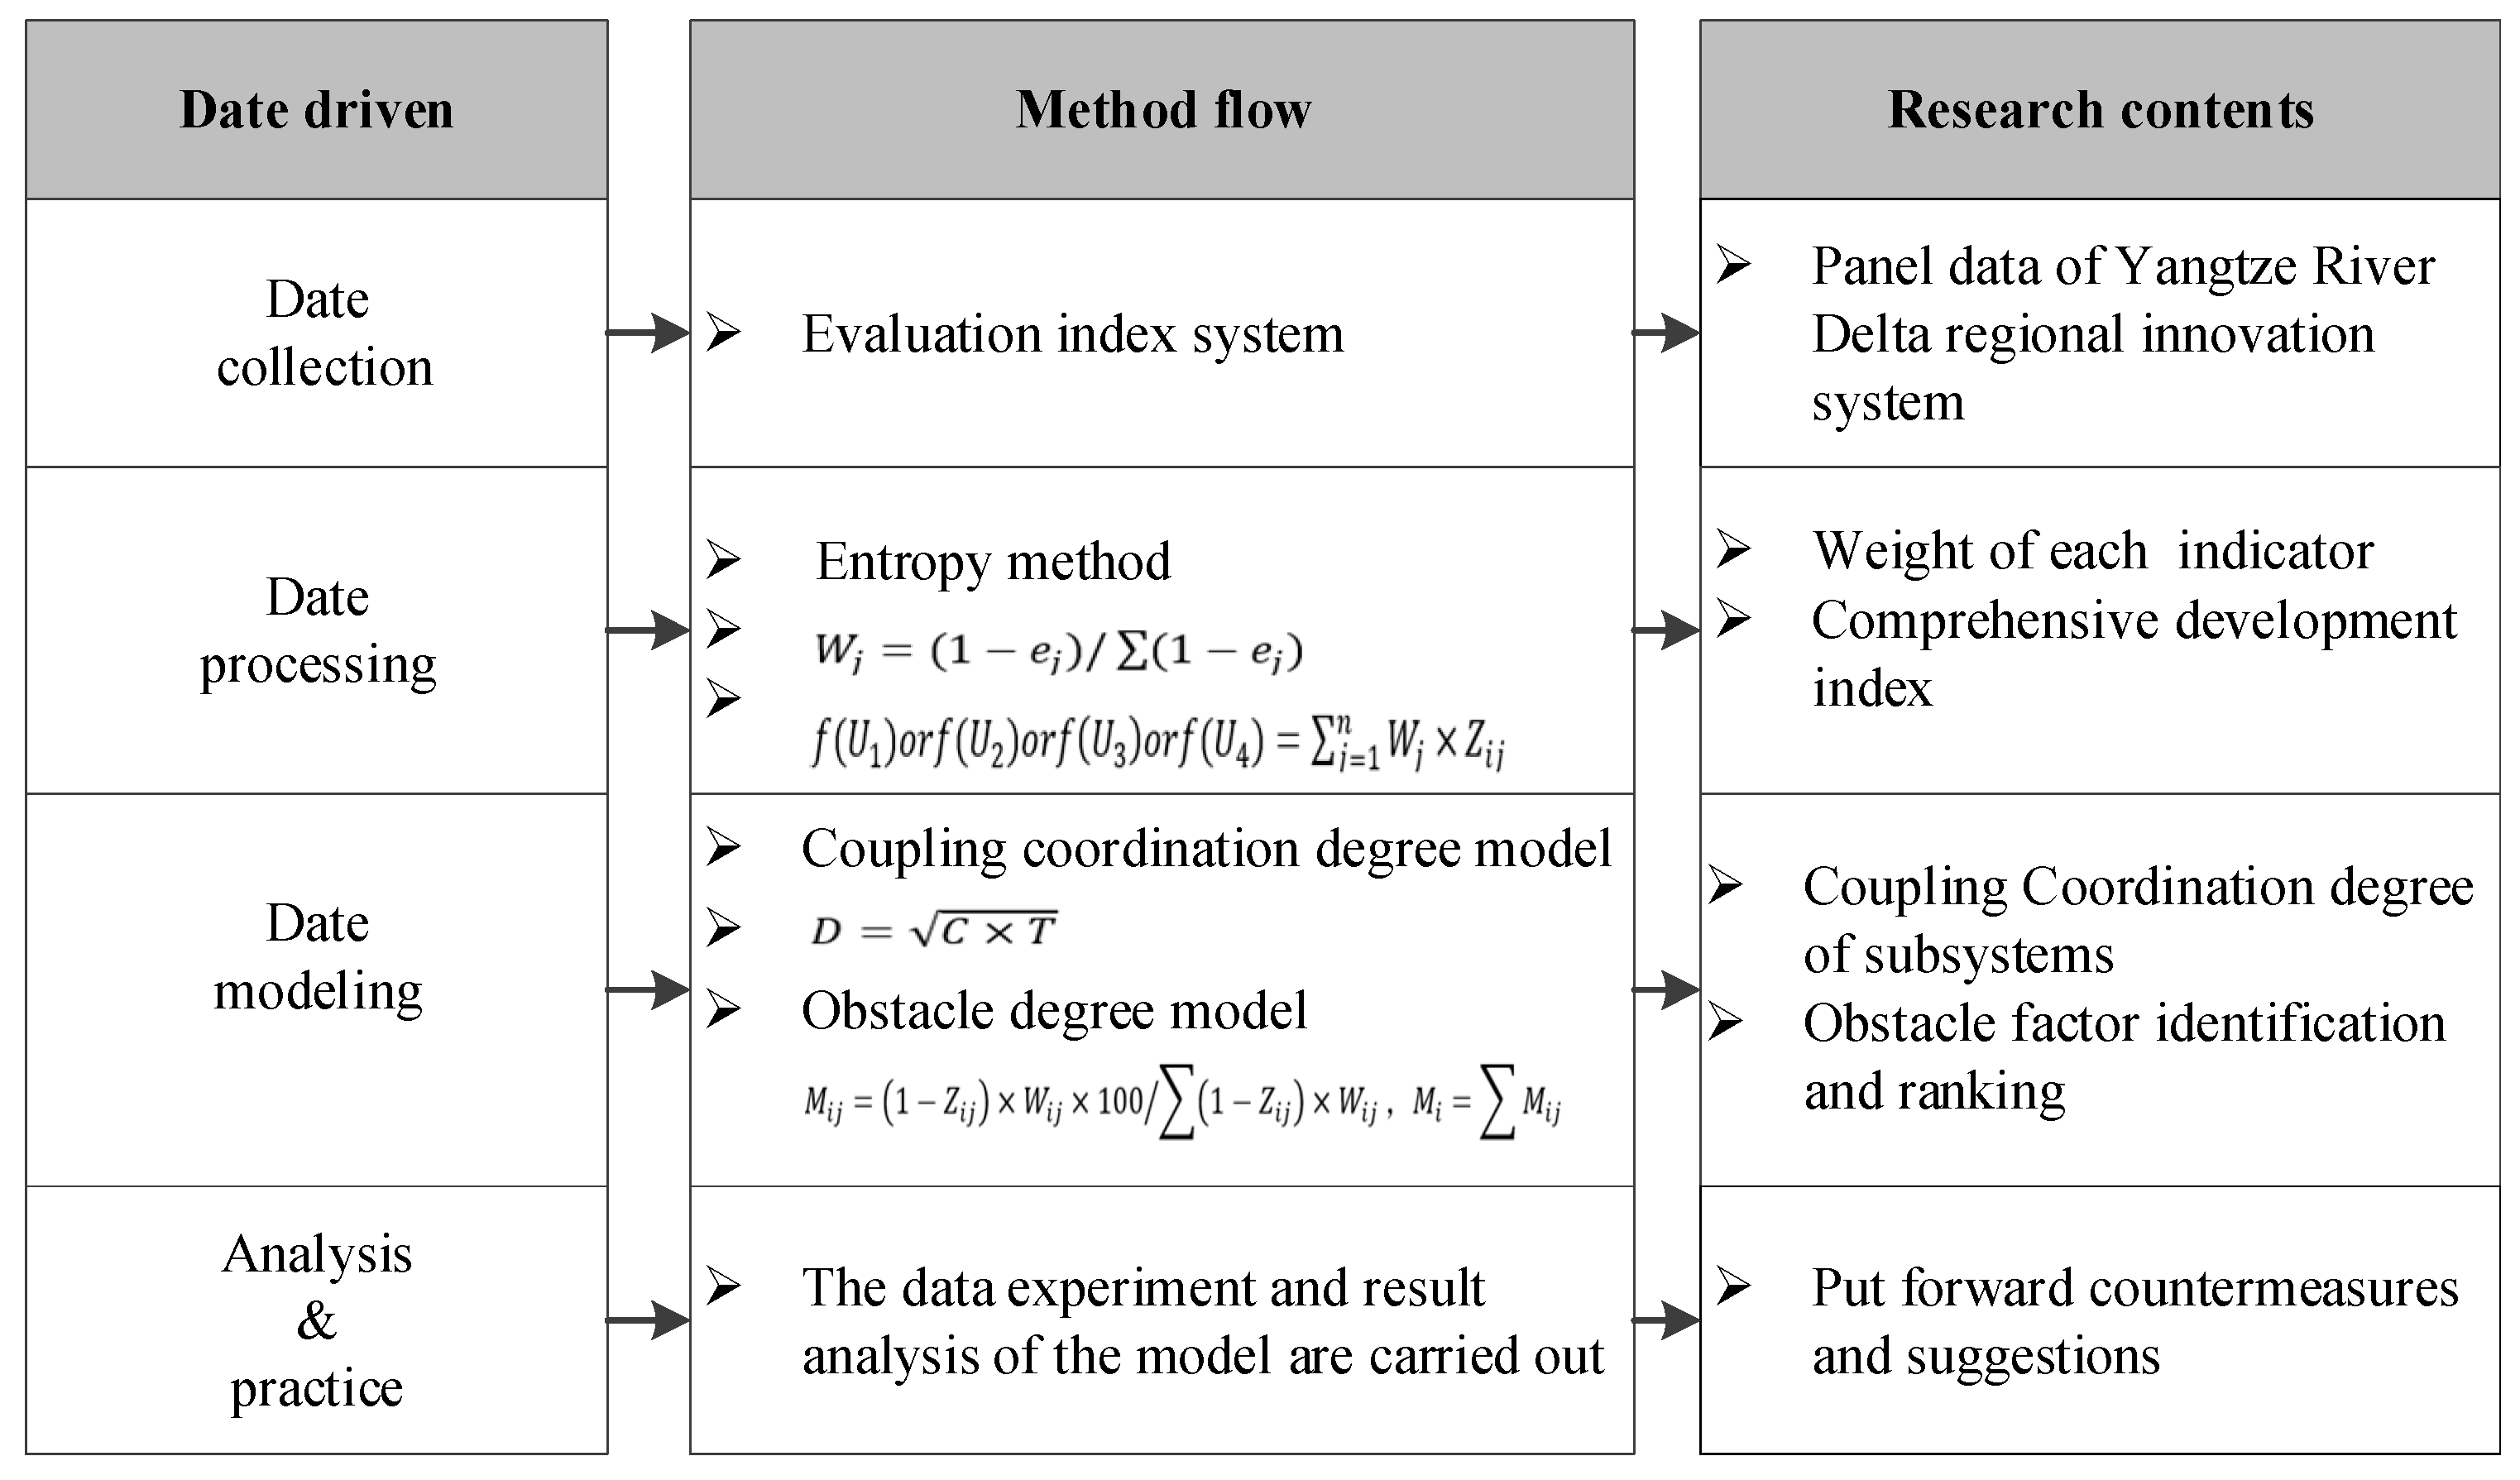
2.1. Method Flow
2.2. Data Collection

| Subsystem | Primary Index | Secondary Index | Unit | Direction | References |
|---|---|---|---|---|---|
| Innovation environmentU1 | Cultural environment C1 | Number of legal entities in cultural and related industries above designated sizeC11 | unit | + | [38] |
| Number of public library institutions C12 | unit | + | [41,42] | ||
| Public library collection per unit population C13 | piece | + | [42] | ||
| Economic environment C2 | Total investment in fixed assets C21 | 100 million RMB | [37,42] | ||
| Financial revenue C22 | 100 million RMB | + | [38,58] | ||
| Actual utilized foreign capital C23 | 100 million RMB | [38,43] | |||
| Innovation resourceU2 | Financial resource C3 | Internal expenditure of R&D funds C31 | million RMB | + | [41,43] |
| R&D expenditure intensity C32 | % | + | [41,42] | ||
| Local financial expenditure on education C33 | 100 million RMB | + | [41,43] | ||
| Human resource C4 | Number of students in colleges and universities per 100,000 population C41 | person | + | [38] | |
| R&D personnel full-time equivalent C42 | person year | + | [41,43,53] | ||
| R&D personnel input C43 | person | + | [39,41] | ||
| Innovation output U3 | Economic output C5 | Sales revenue of new products of Industrial Enterprises above Designated Size C51 | million RMB | + | [43,44,53] |
| Technology market turnover C52 | million RMB | + | [39,43,53] | ||
| Sales revenue of new products in high-tech industries C53 | million RMB | + | [38,43] | ||
| Knowledge creation C6 | Number of published scientific papers C61 | piece | + | [38,39,43] | |
| Invention patent authorization C62 | piece | + | [37,43,53] | ||
| Patent application authorization C63 | piece | + | [37,39,43] | ||
| Innovation benefit U4 | Environmental benefit C7 | Total industrial wastewater discharge C71 | 10,000 tons | − | [43,53,63] |
| Total industrial sulfur dioxide emission C72 | 10,000 tons | − | [33,43,53] | ||
| Industrial smoke (powder) dust emission C73 | 10,000 tons | − | [43,53] | ||
| Social benefit C8 | Urban registered unemployment rate C81 | % | − | [43,71] | |
| Engel coefficient of urban households C82 | % | − | [43,71] | ||
| Traffic accident fatalities C83 | person | − | [43,71] | ||
| Per capita disposable income of urban residents C84 | RMB | + | [38,44] | ||
| Economic benefit C9 | Total retail sales of social consumer goods c91 | million RMB | + | [63,71] | |
| Per capita GDP C92 | RMB/person | + | [17,41,44] | ||
| Proportion of added value of tertiary industry in GDP C93 | % | + | [63,71] |
2.3. Data Processing
2.4. Data Modeling
2.4.1. Coupling Coordination Degree Model
2.4.2. Obstacle Degree Model
2.5. Data Application
3. Case Study
3.1. Background
3.2. Results
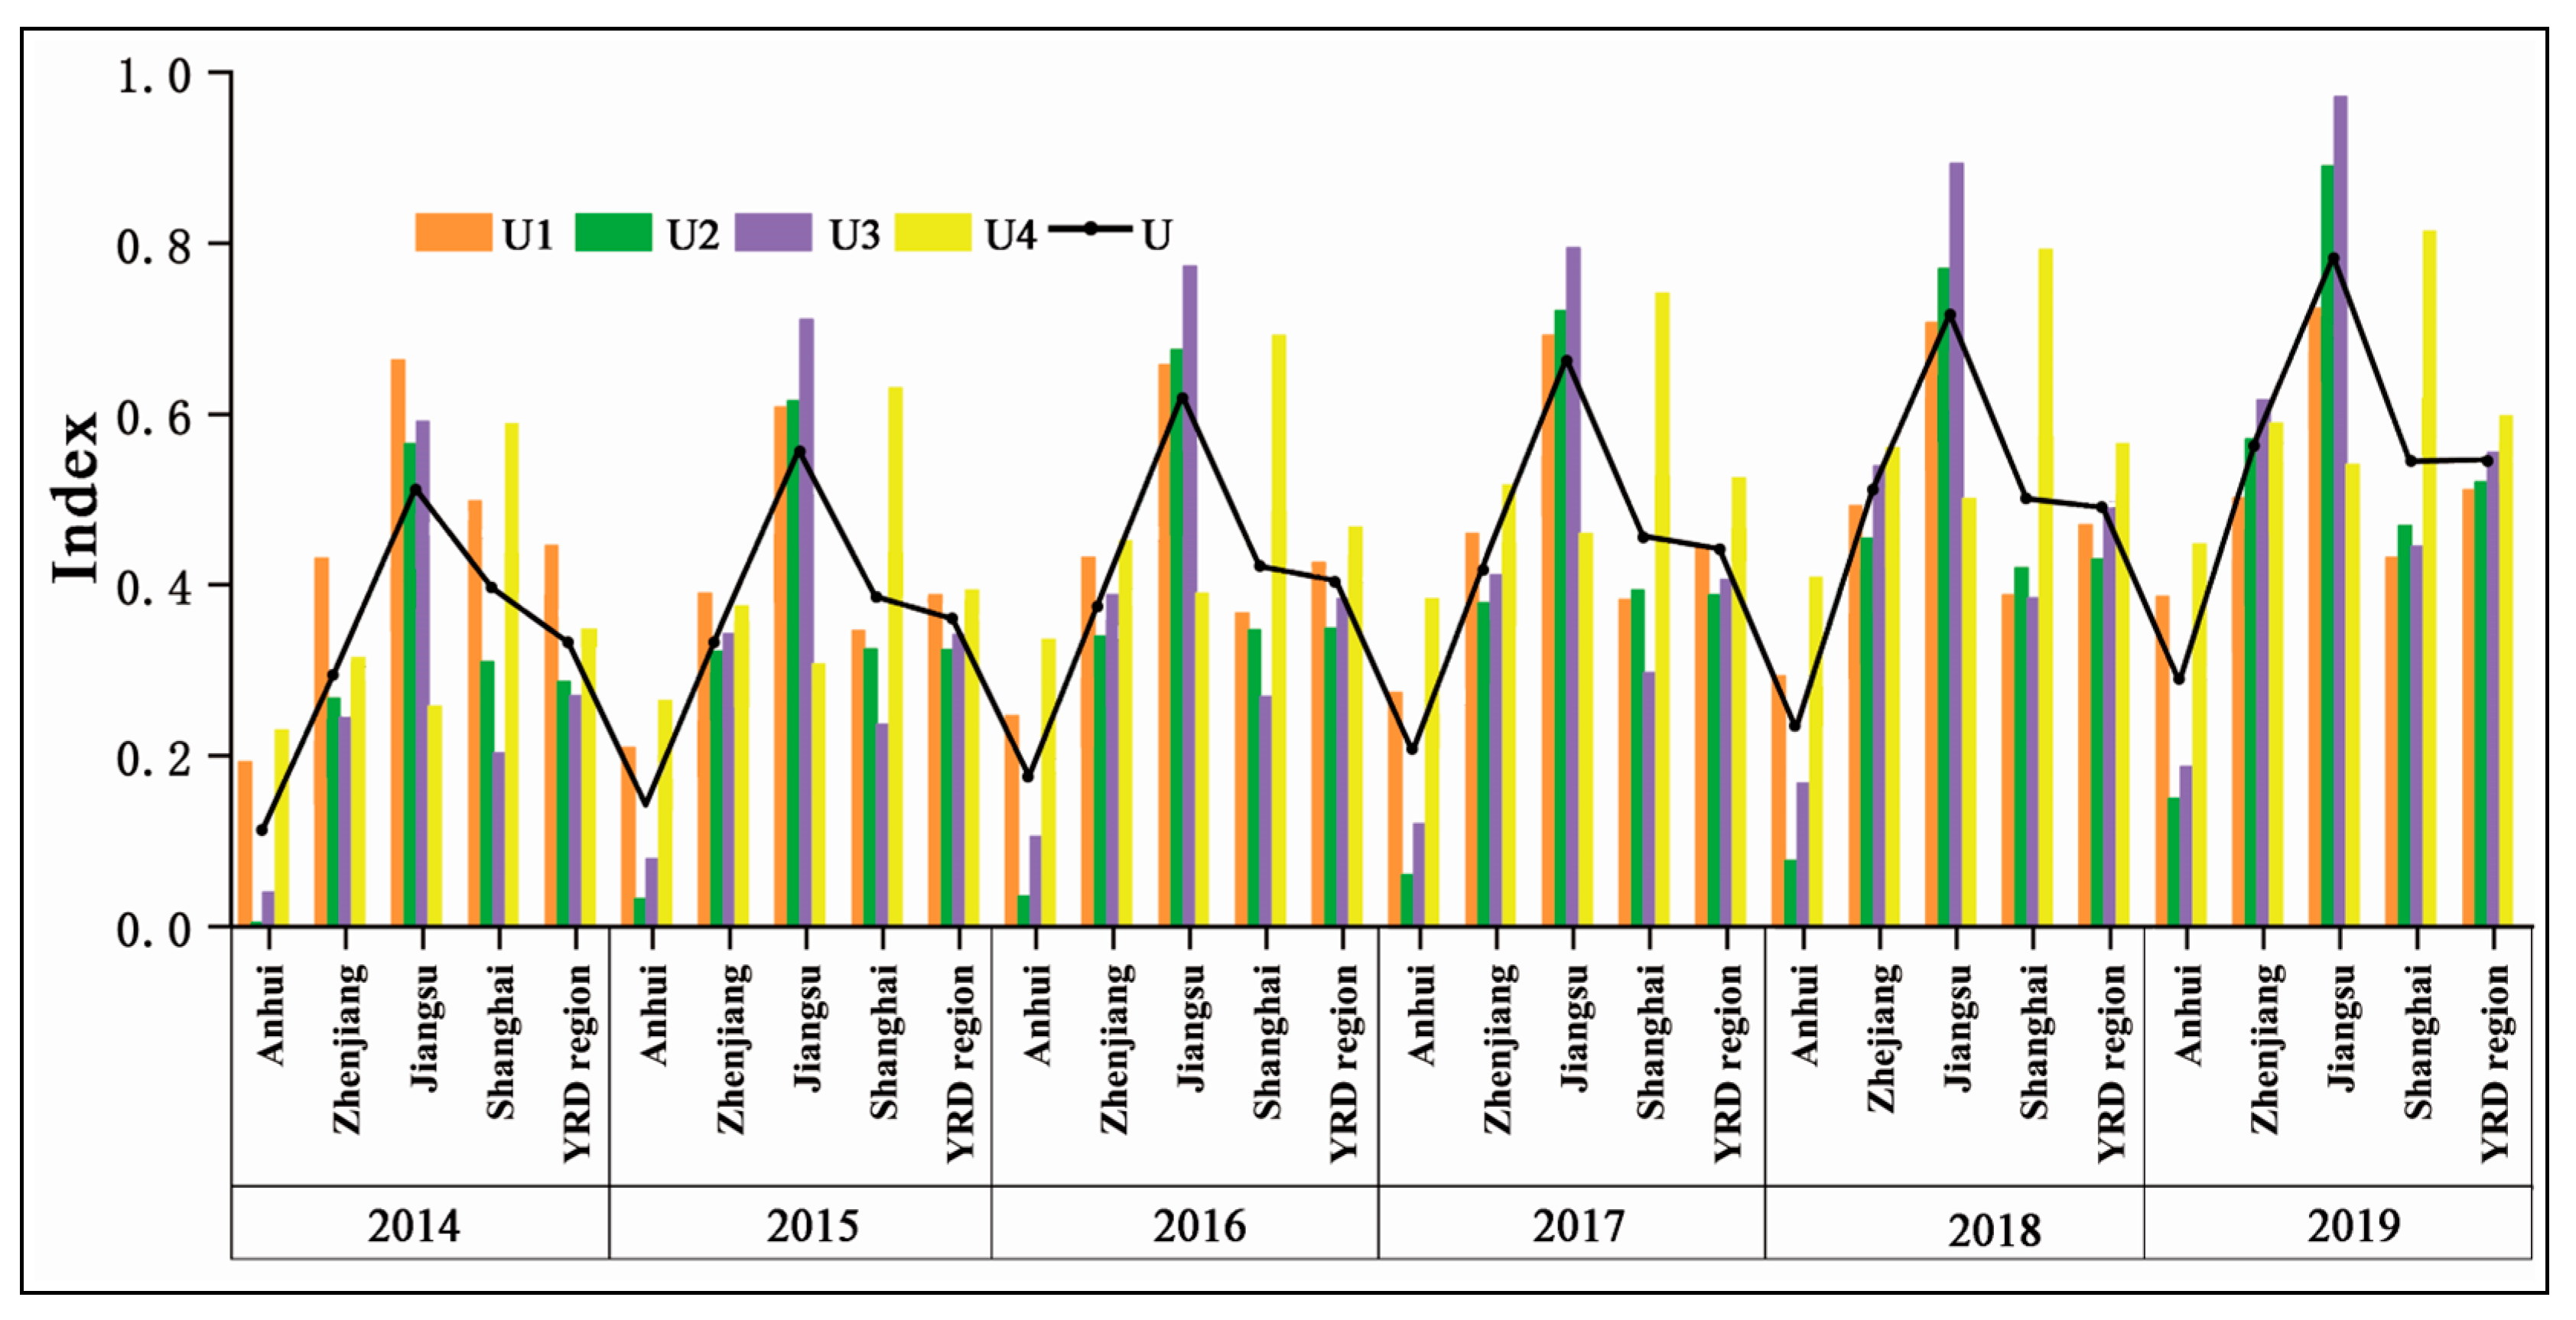
3.2.1. Calculation Results of the Development and Comprehensive Development Indices
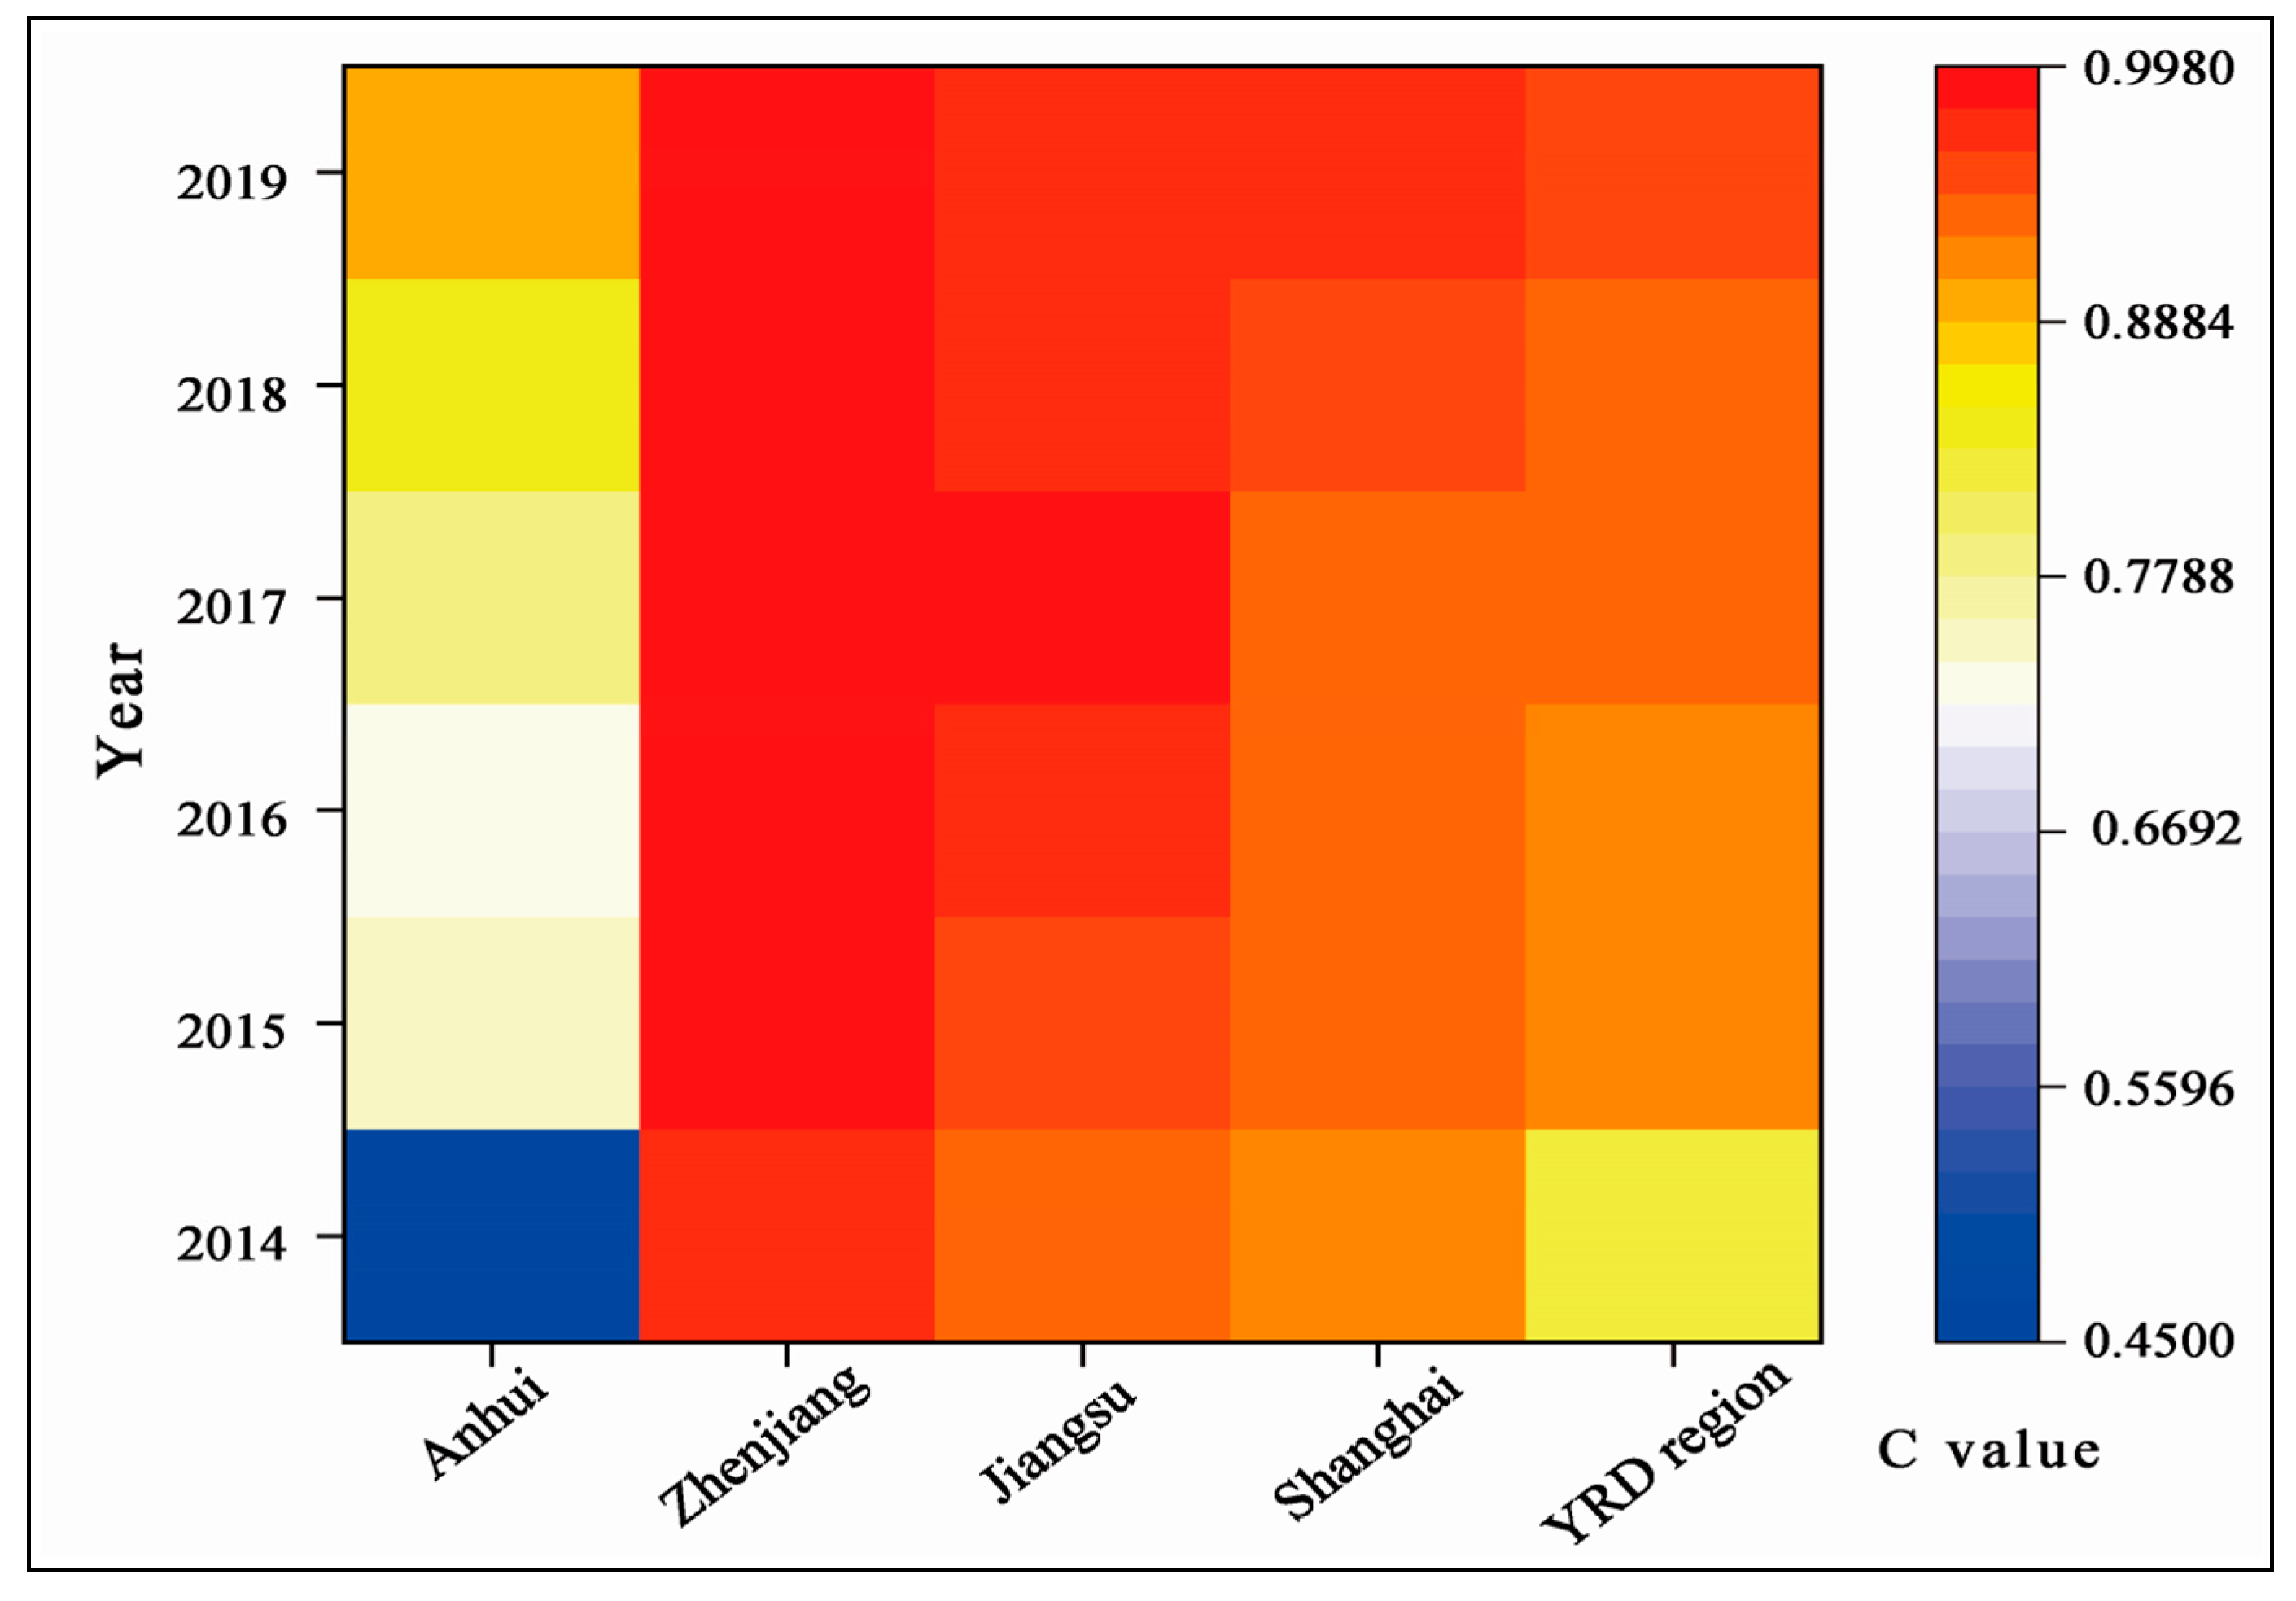
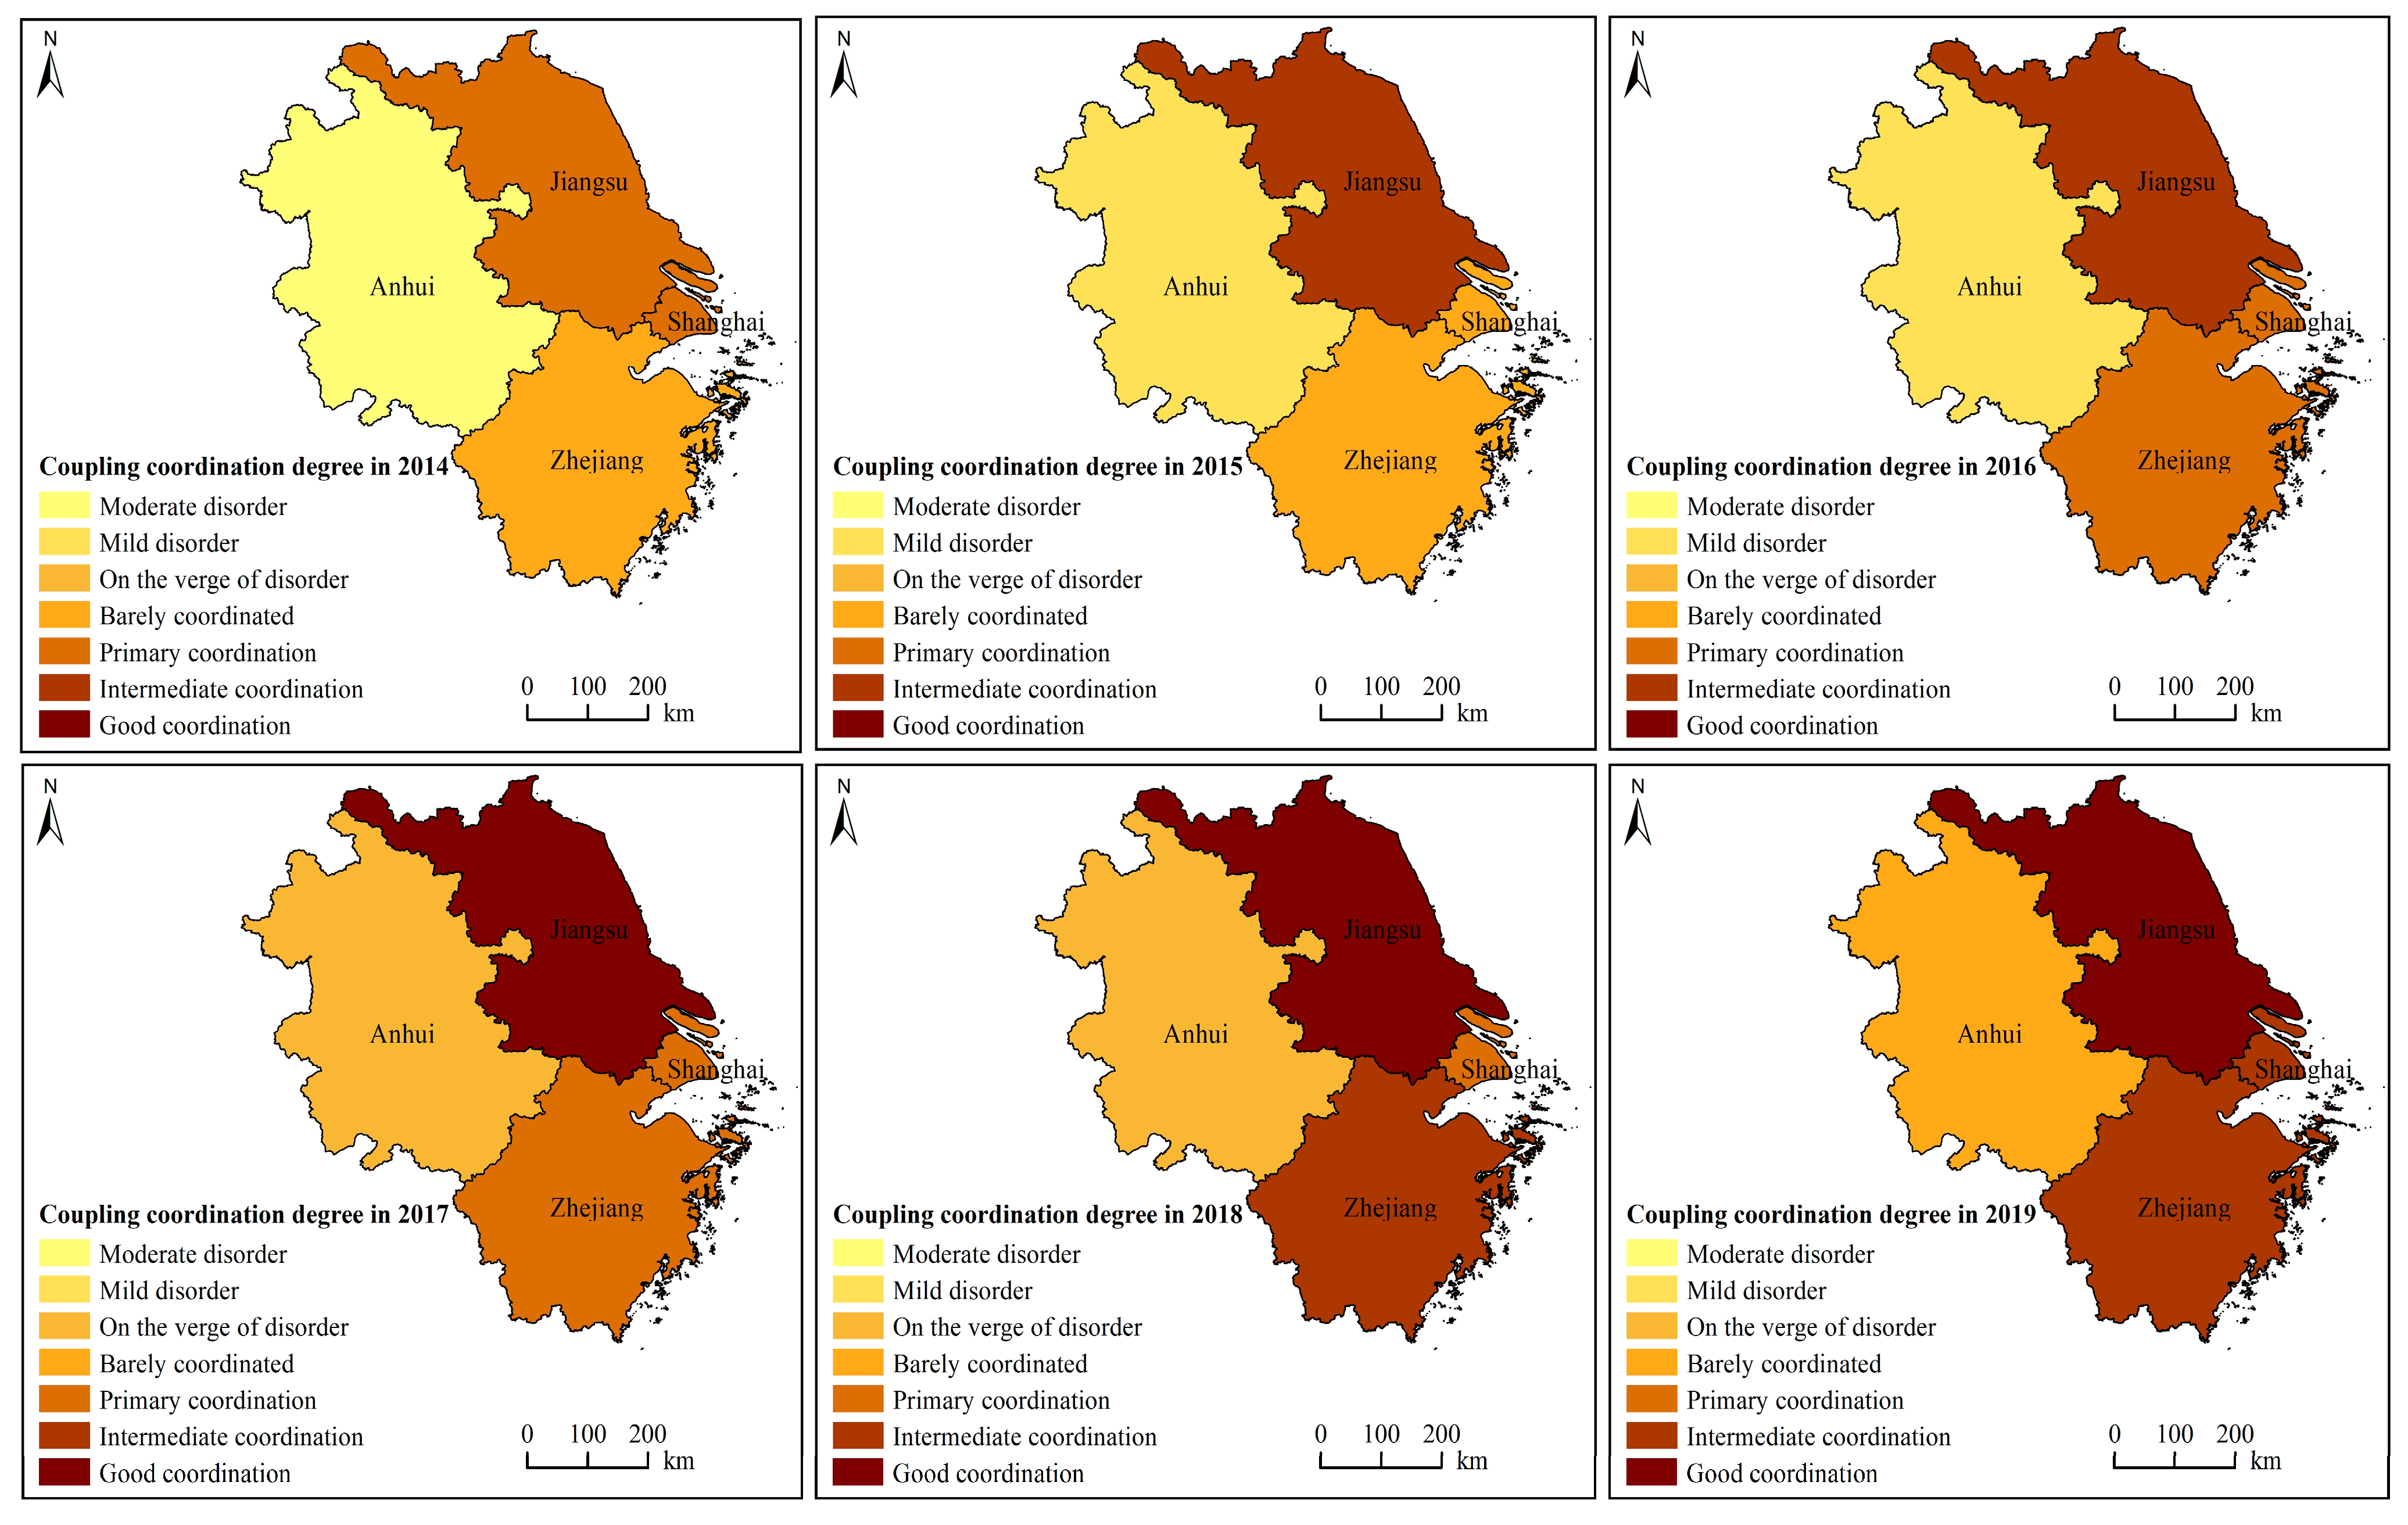
3.2.2. Coupling Coordination Degree Calculation Results
3.2.3. Coupling and Coordination Obstacle Factors Diagnosis Results
3.3. Result Analysis
3.3.1. Analysis of the Comprehensive Development Coefficient of the Regional Innovation EROB Composite System in the YRD
3.3.2. Analysis of the Coupling Coordination Degree of the Regional Innovation EROB Composite System in the YRD
3.3.3. Obstacle Factor Analysis of Coupling and Coordination of the Regional Innovation EROB Composite System in the YRD Region
3.4. Discussion and Management Enlightenment
3.4.1. Discussion
- (1)
- From the Overall Regional Level
- (2)
- From the Internal Regional Level
3.4.2. Management Enlightenment
4. Conclusions
Author Contributions
Funding
Institutional Review Board Statement
Informed Consent Statement
Data Availability Statement
Conflicts of Interest
References
- Li, G.P.; Wang, C.Y. The spatial characteristics and time-space evolution of China’s provincial innovation input—Based on empirical analysis of explorative spatial data. Geogr. Res. 2012, 31, 95–106. [Google Scholar]
- Cameron, K.S.; Quinn, R.E. Diagnosing and Changing Organizational Culture: Based on the Competing Values Framework; Addison Wesley Press: New York, NY, USA, 1998. [Google Scholar]
- Hu, F. Study on the roles and responsibilities of government in the regional innovation system. In Frontiers in Enterprise Integration; Da Xu, L., Ed.; CRC Press: London, UK, 2020; pp. 381–384. [Google Scholar]
- Asheim, B.T.; Isaksen, A.; Trippl, M. The role of the regional innovation system approach in contemporary regional policy: Is it still relevant in a globalised world? In Regions and Innovation Policies in Europe; González-López, M., Asheim, B.T., Eds.; Edward Elgar Publishing: Northampton, MA, USA, 2020; pp. 12–29. [Google Scholar]
- Malik, A.; Sharma, P.; Pereira, V.; Temouri, Y. From regional innovation systems to global innovation hubs: Evidence of a quadruple helix from an emerging economy. J. Bus. Res. 2021, 128, 587–598. [Google Scholar] [CrossRef]
- Kusharsanto, Z.S.; Maninggar, N.; Maulidya, D.; Muzaki, A.R. How infrastructure contributes to fostering regional innovation system: The case of Pelalawan Regency–Indonesia. IOP Conf. Ser. Earth Environ. Sci. 2021, 778, 012001. [Google Scholar] [CrossRef]
- Gasparin, M.; Quinn, M. Designing regional innovation systems in transitional economies: A creative ecosystem approach. Growth Chang. 2021, 52, 621–640. [Google Scholar] [CrossRef]
- Rong, K.; Lin, Y.; Yu, J.; Zhang, Y.; Radziwon, A. Exploring regional innovation ecosystems: An empirical study in China. Ind. Innov. 2021, 28, 545–569. [Google Scholar] [CrossRef]
- Han, G.; Zhang, Z. Regional innovation paths selection in complex environments of China: A configurational perspective. MDE Manag. Decis. Econ. 2021. [Google Scholar] [CrossRef]
- Xue, L.; Li, D.; Yu, Z. China’s national and regional innovation systems. In The Oxford Handbook of China Innovation; Fu, X., McKern, B., Chen, J., Eds.; Oxford University Press: New York, NY, USA, 2021; pp. 115–134. [Google Scholar]
- Heindl, A.B. Separate frameworks of regional innovation systems for analysis in China? Conceptual developments based on a qualitative case study in Chongqing. Geoforum 2020, 115, 34–43. [Google Scholar] [CrossRef]
- Fernandes, C.; Farinha, L.; Ferreira, J.J.; Asheim, B.; Rutten, R. Regional innovation systems: What can we learn from 25 years of scientific achievements? Reg. Stud. 2021, 55, 377–389. [Google Scholar] [CrossRef]
- Ciołek, D.; Golejewska, A.; Zabłocka-Abi Yaghi, A. Regional innovation systems in Poland: How to classify them? Экoнoмика Региoна 2021, 17, 987–1003. [Google Scholar] [CrossRef]
- Cooke, P.; Uranga, M.G.; Etxebarria, G. Regional systems of innovation: An evolutionary perspective. Environ. Plan. A 1998, 30, 1563–1584. [Google Scholar] [CrossRef] [Green Version]
- Fritsch, M.; Slavtchev, V. Determinants of the efficiency of regional innovation systems. Reg. Stud. 2011, 45, 905–918. [Google Scholar] [CrossRef]
- López-Rubio, P.; Roig-Tierno, N.; Mas-Tur, A. Regional innovation system research trends: Toward knowledge management and entrepreneurial ecosystems. Int. J. Qual. Innov. 2020, 6, 4. [Google Scholar] [CrossRef]
- Zabala-Iturriagagoitia, J.M.; Voigt, P.; Gutiérrez-Gracia, A.; Jiménez-Sáez, F. Regional innovation systems: How to assess performance. Reg. Stud. 2007, 41, 661–672. [Google Scholar] [CrossRef]
- Rohe, S.; Mattes, J. What about the regional level? Regional configurations of technological innovation systems. Geoforum 2022, 129, 60–73. [Google Scholar] [CrossRef]
- Balland, P.A.; Boschma, R.; Frenken, K. Proximity, innovation and networks: A concise review and some next steps. In Handbook of Proximity Relations; Torre, A., Gallaud, D., Eds.; Edward Elgar Publishing: Northampton, MA, USA, 2022; pp. 70–80. [Google Scholar]
- Pan, X.; Ming, Y.; Li, M.; Guo, S.; Han, C. Inter-regional innovation correlation effects and influencing factors in China. Bus. Process Manag. J. 2019, 26, 924–941. [Google Scholar] [CrossRef]
- Chen, J.; Wang, L.; Li, Y. Natural resources, urbanization and regional innovation capabilities. Resour. Policy 2020, 66, 101643. [Google Scholar] [CrossRef]
- Qi, Y.; Peng, W.; Xiong, N.N. The effects of fiscal and tax incentives on regional innovation capability: Text extraction based on python. Mathematics 2020, 8, 1193. [Google Scholar] [CrossRef]
- Fritsch, M.; Schwirten, C. Enterprise-university co-operation and the role of public research institutions in regional innovation systems. Ind. Innov. 1999, 6, 69–83. [Google Scholar] [CrossRef]
- Piazza, M.; Mazzola, E.; Abbate, L.; Perrone, G. Network position and innovation capability in the regional innovation network. Eur. Plan. Stud. 2019, 27, 1857–1878. [Google Scholar] [CrossRef]
- Trippl, M. Developing cross-border regional innovation systems: Key factors and challenges. Tijdschr. Econ. Soc. Geogr. 2010, 101, 150–160. [Google Scholar] [CrossRef]
- Garcia-Bernabeu, A.; Cabello, J.M.; Ruiz, F. A multi-criteria reference point based approach for assessing regional innovation performance in Spain. Mathematics 2020, 8, 797. [Google Scholar] [CrossRef]
- Tang, H.H. The strategic role of world-class universities in regional innovation system: China’s Greater Bay Area and Hong Kong’s academic profession. Asian Educ. Dev. Stud. 2020, 11, 7–22. [Google Scholar] [CrossRef]
- Zhang, Y.; Zhang, J. Exploring regional innovation growth through a network approach: A case study of the Yangtze River Delta region, China. Chin. Geogr. Sci. 2022, 32, 16–30. [Google Scholar] [CrossRef]
- Cooke, P. Regional innovation systems, clusters, and the knowledge economy. Ind. Corp. Chang. 2001, 10, 945–974. [Google Scholar] [CrossRef]
- Trippl, M.; Tödtling, F. Developing biotechnology clusters in non-high technology regions—The case of Austria. Ind. Innov. 2007, 14, 47–67. [Google Scholar] [CrossRef]
- Chen, W.-L.; Wang, C.-J. Study of the construction of assessment system on regional innovation capacity in knowledge management. Procedia Eng. 2012, 29, 1830–1834. [Google Scholar]
- Yuan, C.; Guo, B.; Liu, H. Assessment and classification of China’s provincial regional innovation system based on grey fixed weight clustering. Grey Syst. Theory Appl. 2013, 3, 316–337. [Google Scholar] [CrossRef]
- Dayneko, D.; Dayneko, A.; Peshkov, V.; Matveeva, M. Development of the regional innovation system in the forest industry of Irkutsk province based on institutional changes. IOP Conf. Ser. Earth Environ. Sci. 2019, 316, 012045. [Google Scholar] [CrossRef]
- Zhang, Y.; Duan, D.; Du, D. Coordinated development of innovation system in China’s Yangtze River economic belt, a demand and supply perspective. Sustainability 2020, 13, 178. [Google Scholar] [CrossRef]
- Lewandowska, A.; Švihlíková, I. Regional innovation system in the Podkarpackie against selected Polish and EU regions. J. Int. Stud. 2020, 13, 212–223. [Google Scholar] [CrossRef]
- Weck, M.; Humala, I.; Tamminen, P.; Ferreira, F.A. Knowledge management visualisation in regional innovation system collaborative decision-making. Manag. Decis. 2021, 60, 1017–1038. [Google Scholar] [CrossRef]
- Buesa, M.; Heijs, J.; Pellitero, M.M.; Baumert, T. Regional systems of innovation and the knowledge production function: The Spanish case. Technovation 2006, 26, 463–472. [Google Scholar] [CrossRef]
- Zhao, S.L.; Song, W.; Zhu, D.Y.; Peng, X.B.; Cai, W. Evaluating China’s regional collaboration innovation capability from the innovation actors perspective—An AHP and cluster analytical approach. Technol. Soc. 2013, 35, 182–190. [Google Scholar] [CrossRef]
- Wang, H.; An, L.; Zhang, X. Evaluation of regional innovation ability based on green and low-carbon perspective. Bulg. Chem. Commun. 2017, 49, 55–58. [Google Scholar]
- Huang, D.S.; Yang, C.F. Study on the convergence of regional innovation capacity based on spatial effect. Soft Sci. 2017, 31, 44–48. [Google Scholar]
- Shan, D. Research of the construction of regional innovation capability evaluation system: Based on indicator analysis of Hangzhou and Ningbo. Procedia Eng. 2017, 174, 1244–1251. [Google Scholar] [CrossRef]
- Polina, E.A.; Solovyeva, I.A. Methodology for comprehensive assessment of regional innovative development. R-Economy 2019, 5, 79–91. [Google Scholar] [CrossRef]
- Su, Y.; Liang, D.; Guo, W. Application of multiattribute decision-making for evaluating regional innovation capacity. Math. Probl. Eng. 2020, 2020, 2851840. [Google Scholar] [CrossRef]
- Lanchun, L.; Wei, C.; Kaimo, G.; Fang, Y.; Yun, T.; Ke, Z. Research on the evaluation system construction of county innovation driven development-based on evaluation and measurement model. In Artificial Intelligence in China; Liang, Q., Wang, W., Mu, J., Liu, X., Na, Z., Eds.; Springer: Singapore, 2022; pp. 218–225. [Google Scholar]
- Ceptureanu, S.I.; Ceptureanu, E.G.; Popescu, D.; Anca Orzan, O. Eco-innovation capability and sustainability driven innovation practices in Romanian SMEs. Sustainability 2020, 12, 7106. [Google Scholar] [CrossRef]
- Yuan, X.; Zheng, C. Improved intuitionistic fuzzy entropy and its application in the evaluation of regional collaborative innovation capability. Sustainability 2022, 14, 3129. [Google Scholar] [CrossRef]
- Zemtsov, S.; Kotsemir, M. An assessment of regional innovation system efficiency in Russia: The application of the DEA approach. Scientometrics 2019, 120, 375–404. [Google Scholar] [CrossRef]
- Barra, C.; Ruggiero, N. How do dimensions of institutional quality improve Italian regional innovation system efficiency? The knowledge production function using SFA. J. Evol. Econ. 2022, 32, 591–642. [Google Scholar] [CrossRef]
- Zhao, S.L.; Cacciolatti, L.; Lee, S.H.; Song, W. Regional collaborations and indigenous innovation capabilities in China: A multivariate method for the analysis of regional innovation systems. Technol. Forecast Soc. Chang. 2015, 94, 202–220. [Google Scholar] [CrossRef] [Green Version]
- Heindl, A.B.; Liefner, I. The analytic hierarchy process as a methodological contribution to improve regional innovation system research: Explored through comparative research in China. Technol. Soc. 2019, 59, 101197. [Google Scholar] [CrossRef]
- Sadabadi, A.A.; Rad, Z.R.; Fartash, K. Comprehensive evaluation of Iranian regional innovation system (RIS) performance using analytic hierarchy process (AHP). J. Sci. Technol. Policy Manag. 2021, 13, 298–322. [Google Scholar] [CrossRef]
- Teng, T.W.; Chen, J.Y. The performance space measurement of regional innovation system based on neuropsychology. Cogn. Syst. Res. 2019, 56, 159–166. [Google Scholar] [CrossRef]
- Su, Y.; Jiang, X.; Lin, Z. Simulation and relationship strength: Characteristics of knowledge flows among subjects in a regional innovation system. Sci. Technol. Soc. 2021, 26, 459–481. [Google Scholar] [CrossRef]
- Zhang, M.; Li, B. How to improve regional innovation quality from the perspective of green development? Findings from entropy weight method and fuzzy-set qualitative comparative analysis. IEEE Access 2020, 8, 32575–32586. [Google Scholar] [CrossRef]
- Li, T.; Liang, L.; Han, D. Research on the efficiency of green technology innovation in China’s provincial high-end manufacturing industry based on the RAGA-PP-SFA model. Math. Probl. Eng. 2018, 2018, 9463707. [Google Scholar] [CrossRef]
- Qiao, Y.B.; Wang, Y.Y. The evaluation of innovation efficiency in China based on three-stage DEA-windows. Sci. Sci. Manag. ST 2017, 38, 88–97. [Google Scholar]
- Barra, C.; Zotti, R. The contribution of university, private and public sector resources to Italian regional innovation system (in) efficiency. J. Technol. Transf. 2018, 43, 432–457. [Google Scholar] [CrossRef]
- Rudskaya, I.A.; Rodionov, D. Comprehensive evaluation of Russian regional innovation system performance using a two-stage econometric model. Rev. Espac. 2018, 39, 40. [Google Scholar]
- Jovanović, M.; Savić, G.; Cai, Y.; Levi-Jakšić, M. Towards a triple helix based efficiency index of innovation systems. Scientometrics 2022, 127, 2577–2609. [Google Scholar] [CrossRef] [PubMed]
- Xu, K.; Loh, L.; Chen, Q. Sustainable innovation governance: An analysis of regional innovation with a super efficiency slack-based measure model. Sustainability 2020, 12, 3008. [Google Scholar] [CrossRef] [Green Version]
- Lv, K.; Cheng, Y.; Wang, Y. Does regional innovation system efficiency facilitate energy-related carbon dioxide intensity reduction in China? Environ. Dev. Sustain. 2021, 23, 789–813. [Google Scholar] [CrossRef]
- Um, I.; Chon, S.; Hwang, K. Efficiency and its determinants in regional innovation systems in South Korea 1999–2014: The network data envelope analysis. Korea Obs. 2022, 53, 75–104. [Google Scholar] [CrossRef]
- Lin, T.Y.; Chiu, S.H.; Yang, H.L. Performance evaluation for regional innovation systems development in China based on the two-stage SBM-DNDEA model. Socio-Econ. Plan. Sci. 2022, 80, 101148. [Google Scholar] [CrossRef]
- Mikhaylova, A.A.; Mikhaylov, A.S. Antecedents and barriers to the formation of regional innovation system: Case study of the Kaliningrad region. Mod. Appl. Sci. 2015, 9, 178–187. [Google Scholar] [CrossRef] [Green Version]
- Efrat, K. The direct and indirect impact of culture on innovation. Technovation 2014, 34, 12–20. [Google Scholar] [CrossRef]
- Jingkun, Y.J.Z. Theoretical framework, case study and policy implication of cultural capital prompting regional innovation. Adv. Econ. Bus. Manag. Res. 2021, 203, 350–358. [Google Scholar]
- Ze-Lei, X.; Ru-Guo, F.; Xin-Ya, D. Measurement and convergence of China’s regional innovation capability. Sci. Technol. Soc. 2019, 24, 1–28. [Google Scholar] [CrossRef]
- Romer, P.M. Endogenous technological change. J. Political Econ. 1990, 5, S71–S102. [Google Scholar] [CrossRef] [Green Version]
- Sleuwaegen, L.; Boiardi, P. Creativity and regional innovation: Evidence from EU regions. Res. Policy 2014, 43, 1508–1522. [Google Scholar] [CrossRef]
- Tang, Y.; Chen, Y.; Wang, K.; Xu, H.; Yi, X. An analysis on the spatial effect of absorptive capacity on regional innovation ability based on empirical research in China. Sustainability 2020, 12, 3021. [Google Scholar] [CrossRef] [Green Version]
- Uyarra, E.; Ribeiro, B.; Dale-Clough, L. Exploring the normative turn in regional innovation policy: Responsibility and the quest for public value. Eur. Plan. Stud. 2019, 27, 2359–2375. [Google Scholar] [CrossRef] [Green Version]
- Yang, F.; Guo, G. Fuzzy comprehensive evaluation of innovation capability of Chinese national high-tech zone based on entropy weight—taking the northern coastal comprehensive economic zone as an example. J. Intell. Fuzzy Syst. 2020, 38, 7857–7864. [Google Scholar] [CrossRef]
- Pinto, H.; Guerreiro, J. Innovation regional planning and latent dimensions: The case of the Algarve region. Ann. Reg. Sci. 2010, 44, 315–329. [Google Scholar] [CrossRef] [Green Version]
- Wang, W.; Li, H.; Hou, X.; Zhang, Q.; Tian, S. Multi-criteria evaluation of distributed energy system based on order relation-anti-entropy weight method. Energies 2021, 14, 246. [Google Scholar] [CrossRef]
- Li, Y.; Sun, M.; Yuan, G.; Zhou, Q.; Liu, J. Study on development sustainability of atmospheric environment in Northeast China by rough set and entropy weight method. Sustainability 2019, 11, 3793. [Google Scholar] [CrossRef] [Green Version]
- Wang, Q.; Yuan, X.; Cheng, X.; Mu, R.; Zuo, J. Coordinated development of energy, economy and environment subsystems—A case study. Ecol. Indic. 2014, 46, 514–523. [Google Scholar] [CrossRef]
- He, J.; Wang, S.; Liu, Y.; Ma, H.; Liu, Q. Examining the relationship between urbanization and the eco-environment using a coupling analysis: Case study of Shanghai, China. Ecol. Indic. 2017, 77, 185–193. [Google Scholar] [CrossRef]
- Dong, L.; Longwu, L.; Zhenbo, W.; Liangkan, C.; Faming, Z. Exploration of coupling effects in the economy–society–environment system in urban areas: Case study of the Yangtze River Delta urban agglomeration. Ecol. Indic. 2021, 128, 107858. [Google Scholar] [CrossRef]
- Xing, L.; Xue, M.; Hu, M. Dynamic simulation and assessment of the coupling coordination degree of the economy–resource–environment system: Case of Wuhan City in China. J. Environ. Manag. 2019, 230, 474–487. [Google Scholar] [CrossRef]
- Sun, Y.; Zhao, T.; Xia, L. Spatial-temporal differentiation of carbon efficiency and coupling coordination degree of Chinese county territory and obstacles analysis. Sustain. Cities Soc. 2022, 76, 103429. [Google Scholar] [CrossRef]
- Song, Q.; Zhou, N.; Liu, T.; Siehr, S.A.; Qi, Y. Investigation of a “coupling model” of coordination between low-carbon development and urbanization in China. Energy Policy 2018, 121, 346–354. [Google Scholar] [CrossRef] [Green Version]
- Xiao, Y.; Wang, R.; Wang, F.; Huang, H.; Wang, J. Investigation on spatial and temporal variation of coupling coordination between socioeconomic and ecological environment: A case study of the Loess Plateau, China. Ecol. Indic. 2022, 136, 108667. [Google Scholar] [CrossRef]
- Hou, C.; Chen, H.; Long, R. Coupling and coordination of China’s economy, ecological environment and health from a green production perspective. Int. J. Environ. Sci. Technol. 2022, 19, 4087–4106. [Google Scholar] [CrossRef]
- Wang, M.; Zhao, X.; Gong, Q.; Ji, Z. Measurement of regional green economy sustainable development ability based on entropy weight-topsis-coupling coordination degree—a case study in Shandong Province, China. Sustainability 2019, 11, 280. [Google Scholar] [CrossRef] [Green Version]
- Tonghui, D.; Junfei, C. Evaluation and obstacle factors of coordination development of regional water-energy-food-ecology system under green development: A case study of Yangtze River Economic Belt, China. Stoch. Environ. Res. Risk Assess. 2021. [Google Scholar] [CrossRef]
- Li, Y.; Li, Y.; Zhou, Y.; Shi, Y.; Zhu, X. Investigation of a coupling model of coordination between urbanization and the environment. J. Environ. Manag. 2012, 98, 127–133. [Google Scholar] [CrossRef]
- Liu, C.; Zhang, R.; Wang, M.; Xu, J. Measurement and prediction of regional tourism sustainability: An analysis of the Yangtze River economic zone, China. Sustainability 2018, 10, 1321. [Google Scholar] [CrossRef] [Green Version]
- Zhang, F.; Sun, C.; An, Y.; Luo, Y.; Yang, Q.; Su, W.; Gao, L. Coupling coordination and obstacle factors between tourism and the ecological environment in Chongqing, China: A multi-model comparison. Asia Pac. J. Tour. Res. 2021, 26, 811–828. [Google Scholar] [CrossRef]
- Dadao, L. Economic belt construction is the best choice of economic development layout: The enormous potential for the Changjiang River economic belt. Sci. Geogr. Sin. 2014, 34, 769–772. [Google Scholar]
- Liu, Y.; Zhang, X.; Pan, X.; Ma, X.; Tang, M. The spatial integration and coordinated industrial development of urban agglomerations in the Yangtze River economic belt, China. Cities 2020, 104, 102801. [Google Scholar] [CrossRef]
- Zhou, Z.; Zhou, E.; Wang, J. Coupling coordinated development of population, economy, society and space urbanization in Yangtze River economic belt. In Proceedings of the 2019 16th International Conference on Service Systems and Service Management (ICSSSM), Shenzhen, China, 13–15 July 2019; pp. 1–13. [Google Scholar]
- Ma, W.; Tian, W.; Zhou, Q.; Miao, Q. Analysis on the temporal and spatial heterogeneity of factors affecting urbanization development based on the GTWR model: Evidence from the Yangtze River economic belt. Complexity 2021, 2021, 7557346. [Google Scholar] [CrossRef]


| Method | Research Object | References |
|---|---|---|
| RAGA-PP-SFA model | Manufacturing innovation system efficiency | Li al. [55] |
| Three-stage DEA-windows | China’s RIS efficiency | Qiao and Wang [56] |
| SFA | Italian’s RIS efficiency | Barra and Zotti [57] |
| Two-stage DEA model | Russian’s RIS performance | Rudskaya and Rodionov [58]; Jovanović et al. [59] |
| SBM model | RIS efficiency of Chinese provinces | Xu et al. [60] |
| DEA window technology | China’s RIS efficiency | Lv et al. [61] |
| Network DEA | Korea’s RIS efficiency | Um et al. [62] |
| Two-stage SBM-DNDEA model | Value creation process of China’s RIS | Lin et al. [63] |
| C Value Range | C Value Type | D Value Range | D Value Type |
|---|---|---|---|
| [0, 0.3] | Low-level coupling stage | [0, 0.1] | Extreme Disorder |
| (0.1, 0.2] | Serious Disorder | ||
| (0.2, 0.3] | Moderate Disorder | ||
| (0.3, 0.5] | Confrontation stage | (0.3, 0.4] | Mild Disorder |
| (0.4, 0.5] | On the Verge of Disorder | ||
| (0.5, 0.8] | Running in stage | (0.5, 0.6] | Barely Coordinated |
| (0.6, 0.7] | Primary Coordination | ||
| (0.7, 0.8] | Intermediate Coordination | ||
| (0.8, 1] | High-level coupling stage | (0.8, 0.9] | Good Coordination |
| (0.9, 1] | High-quality Coordination |
| Year | Region | U | U1 | U2 | U3 | U4 |
|---|---|---|---|---|---|---|
| 2014 | Anhui | 0.1122 | 0.1932 | 0.0044 | 0.0396 | 0.2298 |
| Zhenjiang | 0.3094 | 0.4311 | 0.2673 | 0.2452 | 0.3147 | |
| Jiangsu | 0.5133 | 0.6632 | 0.5654 | 0.5917 | 0.2575 | |
| Shanghai | 0.3962 | 0.4982 | 0.3097 | 0.2034 | 0.5888 | |
| Yangtze River Delta | 0.3328 | 0.4464 | 0.2867 | 0.2700 | 0.3477 | |
| 2015 | Anhui | 0.1421 | 0.2091 | 0.0327 | 0.0791 | 0.2640 |
| Zhenjiang | 0.3555 | 0.3899 | 0.3220 | 0.3422 | 0.3756 | |
| Jiangsu | 0.5575 | 0.6083 | 0.6150 | 0.7106 | 0.3068 | |
| Shanghai | 0.3865 | 0.3460 | 0.3248 | 0.2364 | 0.6304 | |
| Yangtze River Delta | 0.3604 | 0.3883 | 0.3236 | 0.3421 | 0.3942 | |
| 2016 | Anhui | 0.1760 | 0.2464 | 0.0351 | 0.1052 | 0.3365 |
| Zhenjiang | 0.4004 | 0.4319 | 0.3394 | 0.3881 | 0.4514 | |
| Jiangsu | 0.6216 | 0.6572 | 0.6746 | 0.7724 | 0.3904 | |
| Shanghai | 0.4215 | 0.3671 | 0.3471 | 0.2695 | 0.6922 | |
| Yangtze River Delta | 0.4049 | 0.4256 | 0.3491 | 0.3838 | 0.4676 | |
| 2017 | Anhui | 0.2050 | 0.2736 | 0.0605 | 0.1204 | 0.3838 |
| Zhenjiang | 0.4404 | 0.4600 | 0.3794 | 0.4117 | 0.5171 | |
| Jiangsu | 0.6651 | 0.6920 | 0.7205 | 0.7939 | 0.4598 | |
| Shanghai | 0.4574 | 0.3827 | 0.3943 | 0.2973 | 0.7409 | |
| Yangtze River Delta | 0.4420 | 0.4521 | 0.3887 | 0.4058 | 0.5254 | |
| 2018 | Anhui | 0.2321 | 0.2937 | 0.0774 | 0.1676 | 0.4087 |
| Zhejiang | 0.5111 | 0.4929 | 0.4542 | 0.5391 | 0.5604 | |
| Jiangsu | 0.7170 | 0.7065 | 0.7700 | 0.8926 | 0.5005 | |
| Shanghai | 0.5009 | 0.3887 | 0.4202 | 0.3846 | 0.7925 | |
| Yangtze River Delta | 0.4903 | 0.4704 | 0.4304 | 0.4960 | 0.5655 | |
| 2019 | Anhui | 0.2871 | 0.3862 | 0.1499 | 0.1871 | 0.4474 |
| Zhenjiang | 0.5722 | 0.5014 | 0.5710 | 0.6167 | 0.5898 | |
| Jiangsu | 0.7839 | 0.7231 | 0.8904 | 0.9712 | 0.5408 | |
| Shanghai | 0.5445 | 0.4324 | 0.4694 | 0.4451 | 0.8136 | |
| Yangtze River Delta | 0.5469 | 0.5108 | 0.5202 | 0.5550 | 0.5979 |
| Year | Region | C | T | D | Status |
|---|---|---|---|---|---|
| 2014 | Anhui | 0.4506 | 0.1168 | 0.2294 | Moderate Disorder |
| Zhenjiang | 0.9762 | 0.3146 | 0.5542 | Barely Coordinated | |
| Jiangsu | 0.9412 | 0.5195 | 0.6992 | Primary Coordinated | |
| Shanghai | 0.9217 | 0.4000 | 0.6072 | Primary Coordinated | |
| Yangtze River Delta | 0.8224 | 0.3377 | 0.5225 | Barely Coordinated | |
| 2015 | Anhui | 0.7475 | 0.1462 | 0.3306 | Mild Disorder |
| Zhenjiang | 0.9972 | 0.3574 | 0.5970 | Barely Coordinated | |
| Jiangsu | 0.9540 | 0.5601 | 0.7310 | Intermediate Coordination | |
| Shanghai | 0.9358 | 0.3844 | 0.5998 | Barely Coordinated | |
| Yangtze River Delta | 0.9086 | 0.3621 | 0.5646 | Barely Coordinated | |
| 2016 | Anhui | 0.7315 | 0.1808 | 0.3637 | Mild Disorder |
| Zhenjiang | 0.9941 | 0.4027 | 0.6327 | Primary Coordination | |
| Jiangsu | 0.9696 | 0.6237 | 0.7776 | Intermediate Coordination | |
| Shanghai | 0.9372 | 0.4190 | 0.6266 | Primary Coordination | |
| Yangtze River Delta | 0.9081 | 0.4065 | 0.6001 | Primary Coordination | |
| 2017 | Anhui | 0.7935 | 0.2096 | 0.4078 | On the Verge of Disorder |
| Zhenjiang | 0.9932 | 0.4420 | 0.6626 | Primary Coordination | |
| Jiangsu | 0.9799 | 0.6666 | 0.8082 | Good Coordination | |
| Shanghai | 0.9409 | 0.4538 | 0.6534 | Primary Coordination | |
| Yangtze River Delta | 0.9269 | 0.4430 | 0.6330 | Primary Coordination | |
| 2018 | Anhui | 0.8386 | 0.2368 | 0.4457 | On the Verge of Disorder |
| Zhenjiang | 0.9967 | 0.5116 | 0.7141 | Intermediate Coordination | |
| Jiangsu | 0.9787 | 0.7174 | 0.8379 | Good Coordination | |
| Shanghai | 0.9514 | 0.4965 | 0.6873 | Primary Coordination | |
| Yangtze River Delta | 0.9414 | 0.4906 | 0.6712 | Primary Coordination | |
| 2019 | Anhui | 0.9016 | 0.2926 | 0.5137 | Barely Coordinated |
| Zhenjiang | 0.9971 | 0.5697 | 0.7537 | Intermediate Coordination | |
| Jiangsu | 0.9759 | 0.7814 | 0.8733 | Good Coordination | |
| Shanghai | 0.9640 | 0.5401 | 0.7216 | Intermediate Coordination | |
| Yangtze River Delta | 0.9596 | 0.5460 | 0.7155 | Intermediate Coordination |
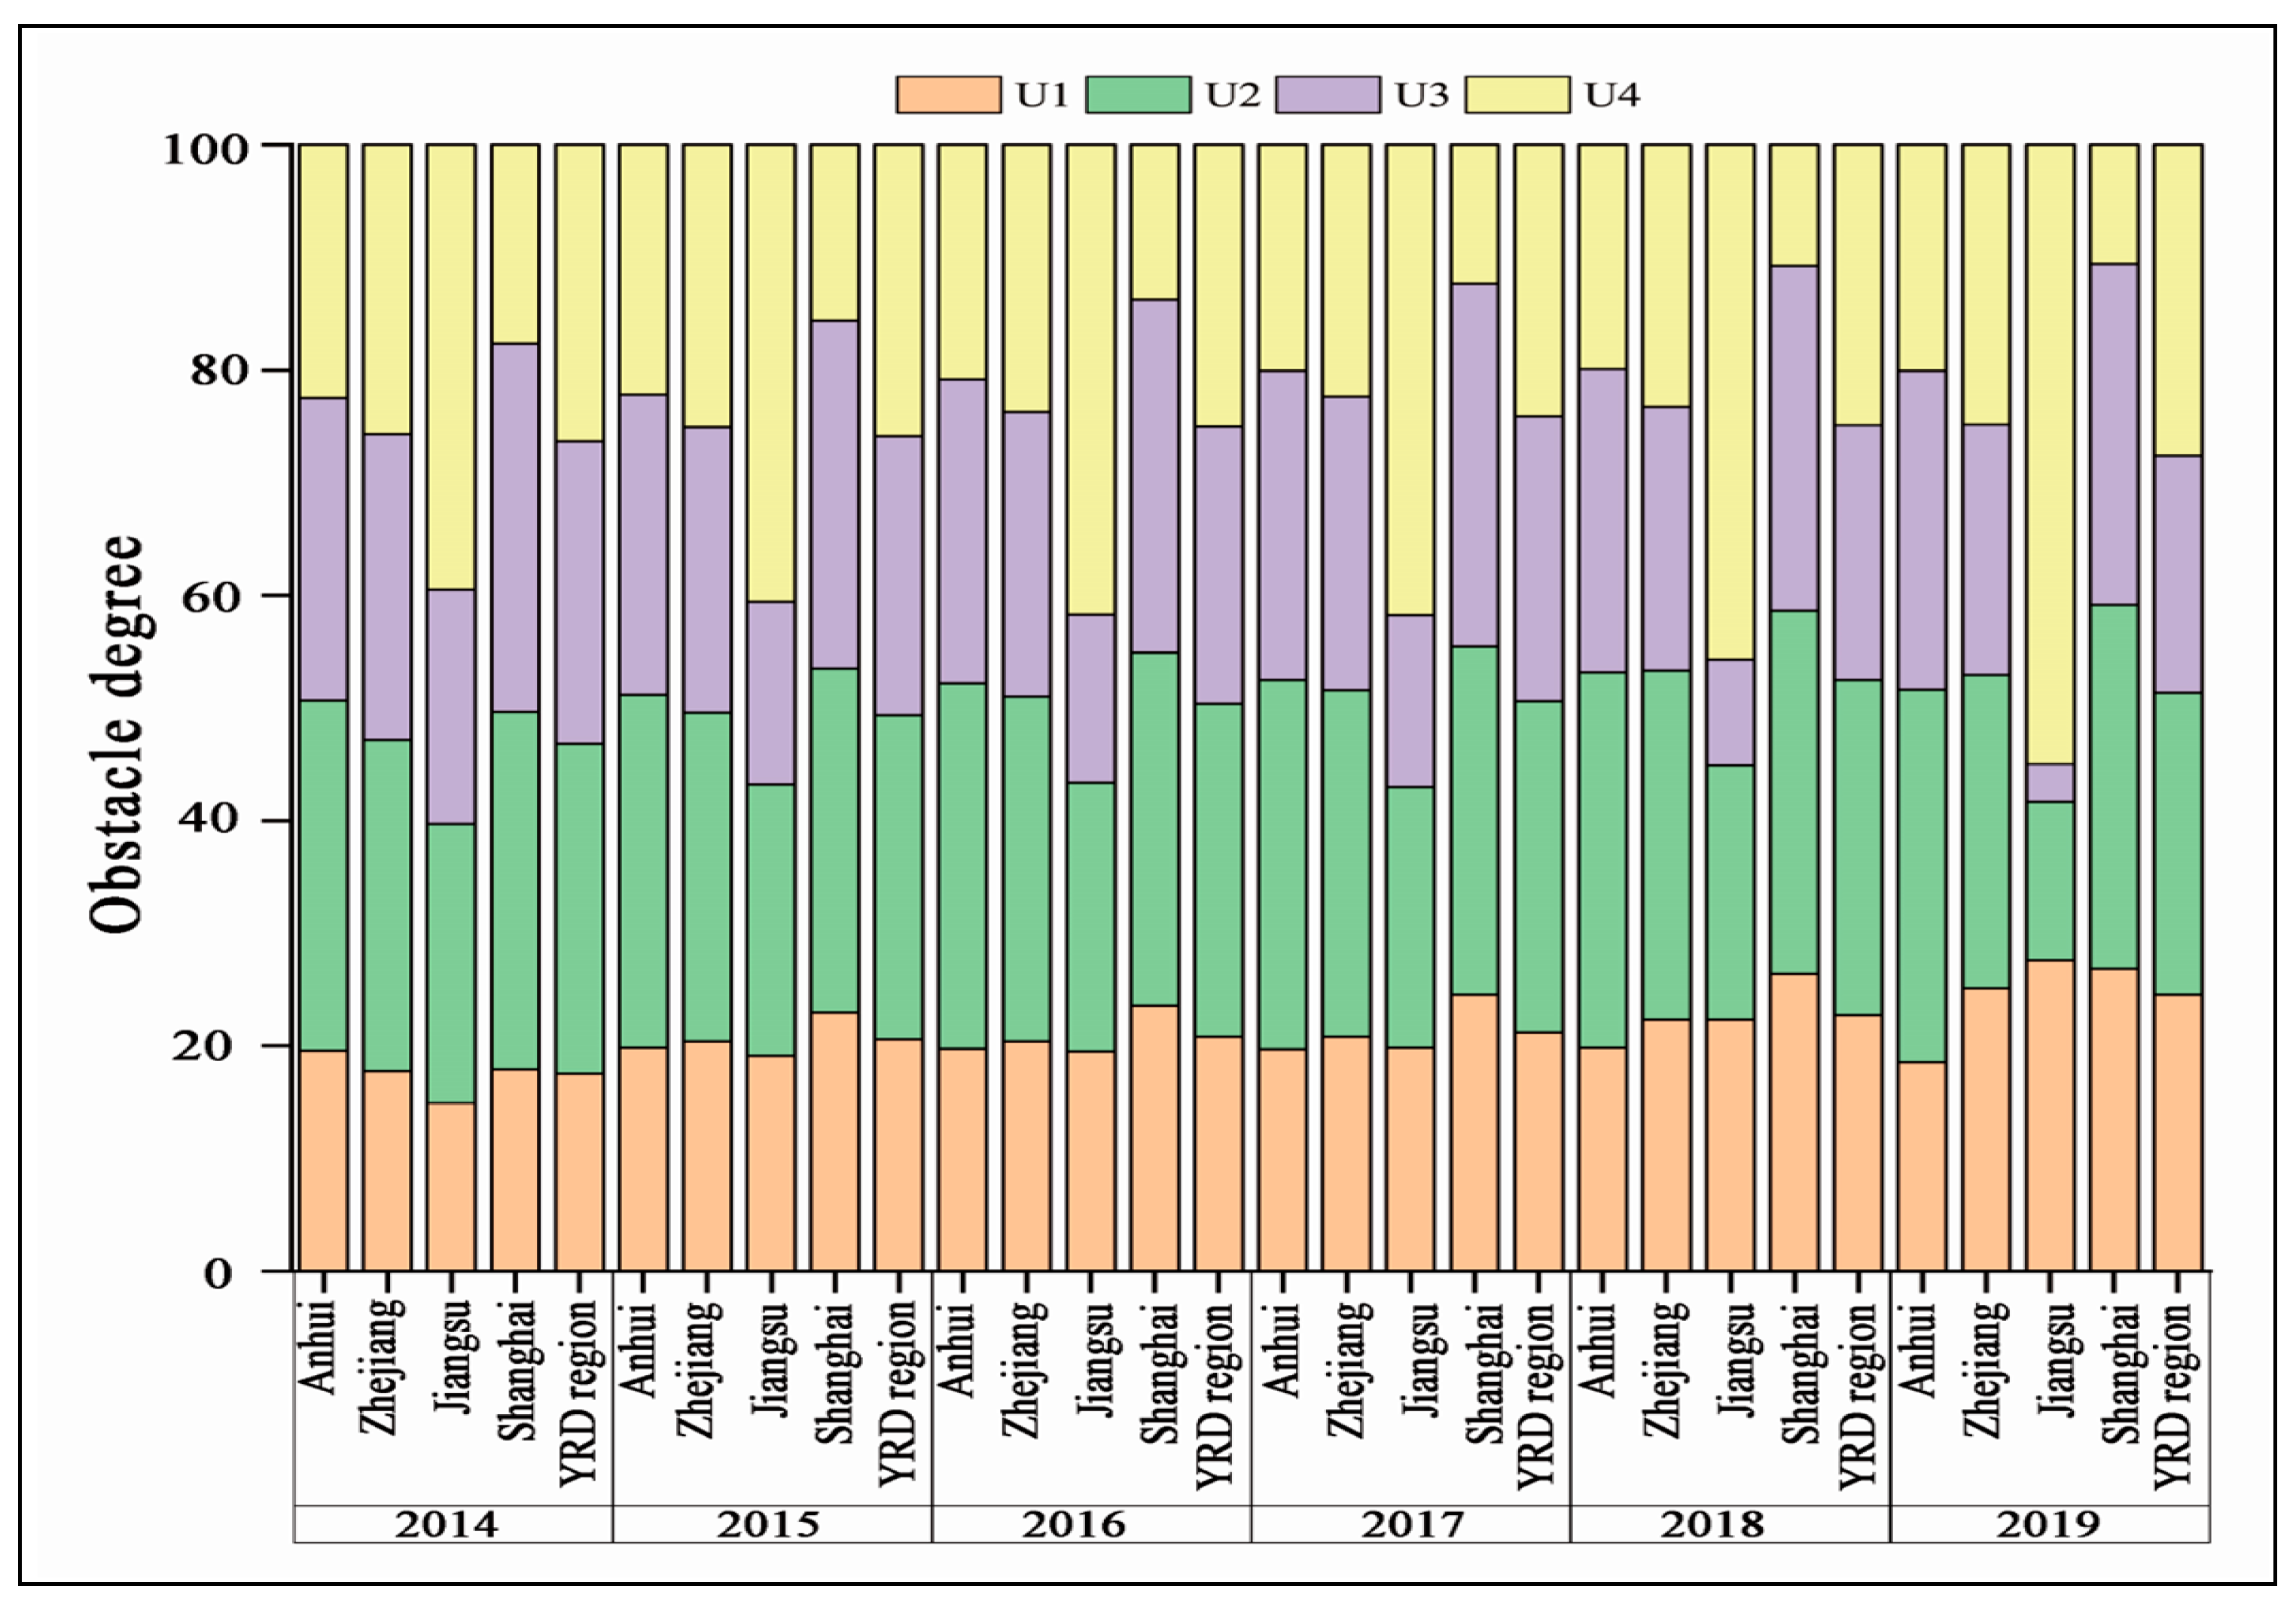
| Year | Region | U1 | U2 | U3 | U4 |
|---|---|---|---|---|---|
| 2014 | Anhui | 19.59 | 31.11 | 26.85 | 22.45 |
| Zhenjiang | 17.76 | 29.43 | 27.13 | 25.68 | |
| Jiangsu | 14.92 | 24.78 | 20.83 | 39.48 | |
| Shanghai | 17.92 | 31.72 | 32.74 | 17.62 | |
| Yangtze River Delta | 17.55 | 29.26 | 26.89 | 26.31 | |
| 2015 | Anhui | 19.88 | 31.28 | 26.64 | 22.20 |
| Zhenjiang | 20.41 | 29.19 | 25.33 | 25.07 | |
| Jiangsu | 19.09 | 24.14 | 16.23 | 40.54 | |
| Shanghai | 22.98 | 30.53 | 30.89 | 15.59 | |
| Yangtze River Delta | 20.59 | 28.78 | 24.77 | 25.85 | |
| 2016 | Anhui | 19.72 | 32.49 | 26.95 | 20.84 |
| Zhenjiang | 20.43 | 30.56 | 25.33 | 23.68 | |
| Jiangsu | 19.53 | 23.85 | 14.93 | 41.69 | |
| Shanghai | 23.59 | 31.31 | 31.34 | 13.76 | |
| Yangtze River Delta | 20.82 | 29.55 | 24.64 | 24.99 | |
| 2017 | Anhui | 19.70 | 32.78 | 27.46 | 20.06 |
| Zhenjiang | 20.81 | 30.77 | 26.10 | 22.33 | |
| Jiangsu | 19.83 | 23.15 | 15.28 | 41.74 | |
| Shanghai | 24.53 | 30.97 | 32.14 | 12.35 | |
| Yangtze River Delta | 21.22 | 29.42 | 25.24 | 24.12 | |
| 2018 | Anhui | 19.83 | 33.33 | 26.91 | 19.93 |
| Zhenjiang | 22.36 | 30.97 | 23.40 | 23.27 | |
| Jiangsu | 22.36 | 22.55 | 9.42 | 45.68 | |
| Shanghai | 26.41 | 32.23 | 30.61 | 10.76 | |
| Yangtze River Delta | 22.74 | 29.77 | 22.58 | 24.91 | |
| 2019 | Anhui | 18.56 | 33.08 | 28.30 | 20.06 |
| Zhenjiang | 25.13 | 27.82 | 22.24 | 24.82 | |
| Jiangsu | 27.63 | 14.07 | 3.31 | 54.99 | |
| Shanghai | 26.87 | 32.32 | 30.23 | 10.59 | |
| Yangtze River Delta | 24.55 | 26.82 | 21.02 | 27.61 |
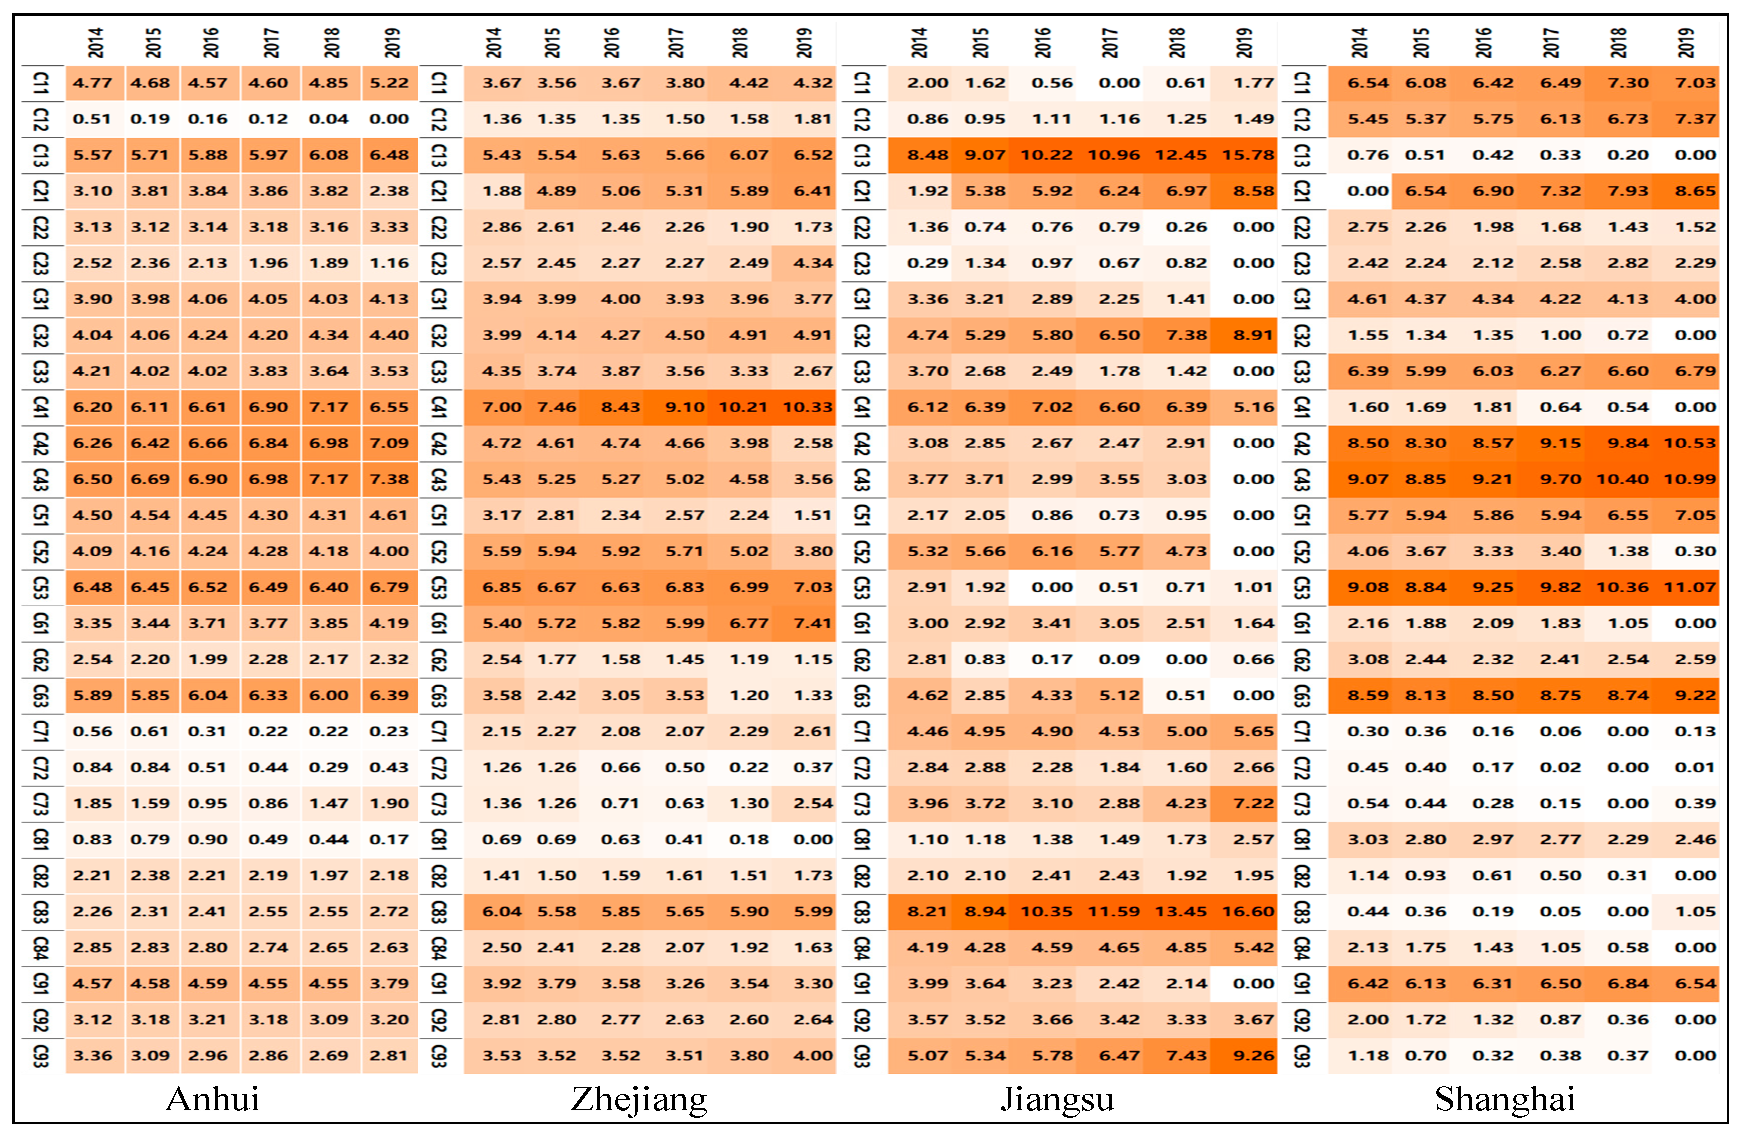
| Second-Level Index | C1 | C2 | C3 | C4 | C5 | C6 | C7 | C8 | C9 | |
|---|---|---|---|---|---|---|---|---|---|---|
| 2014 | Anhui | 10.85 | 8.74 | 12.15 | 18.96 | 15.07 | 11.78 | 3.25 | 8.16 | 11.05 |
| Order | 5 | 7 | 3 | 1 | 2 | 4 | 9 | 8 | 6 | |
| Zhejiang | 10.46 | 7.31 | 12.28 | 17.15 | 15.6 | 11.52 | 4.77 | 10.65 | 10.27 | |
| Order | 6 | 8 | 3 | 1 | 2 | 4 | 9 | 5 | 7 | |
| Jiangsu | 11.35 | 3.57 | 11.81 | 12.97 | 10.4 | 10.43 | 11.25 | 15.59 | 12.63 | |
| Order | 5 | 9 | 4 | 2 | 8 | 7 | 6 | 1 | 3 | |
| Shanghai | 12.75 | 5.17 | 12.55 | 19.16 | 18.91 | 13.83 | 1.29 | 6.74 | 9.6 | |
| Order | 4 | 8 | 5 | 1 | 2 | 3 | 9 | 7 | 6 | |
| Yangtze River Delta | 11.35 | 6.2 | 12.2 | 17.06 | 15 | 11.89 | 5.14 | 10.29 | 10.89 | |
| Order | 5 | 8 | 3 | 1 | 2 | 4 | 9 | 7 | 6 | |
| 2019 | Anhui | 11.69 | 6.87 | 12.06 | 21.02 | 15.39 | 12.91 | 2.56 | 7.69 | 9.8 |
| Order | 5 | 8 | 4 | 1 | 2 | 3 | 9 | 7 | 6 | |
| Zhejiang | 12.65 | 12.48 | 11.35 | 16.47 | 12.34 | 9.9 | 5.52 | 9.35 | 9.94 | |
| Order | 2 | 3 | 5 | 1 | 4 | 6 | 9 | 8 | 7 | |
| Jiangsu | 19.05 | 8.58 | 8.91 | 5.16 | 1.01 | 2.3 | 15.53 | 26.54 | 12.92 | |
| Order | 2 | 6 | 5 | 7 | 9 | 8 | 3 | 1 | 4 | |
| Shanghai | 14.4 | 12.46 | 10.8 | 21.52 | 18.42 | 11.81 | 0.53 | 3.51 | 6.54 | |
| Order | 3 | 4 | 6 | 1 | 2 | 5 | 9 | 8 | 7 | |
| Yangtze River Delta | 14.45 | 10.1 | 10.78 | 16.04 | 11.79 | 9.23 | 6.04 | 11.77 | 9.8 | |
| Order | 2 | 6 | 5 | 1 | 3 | 8 | 9 | 4 | 7 | |
Publisher’s Note: MDPI stays neutral with regard to jurisdictional claims in published maps and institutional affiliations. |
© 2022 by the authors. Licensee MDPI, Basel, Switzerland. This article is an open access article distributed under the terms and conditions of the Creative Commons Attribution (CC BY) license (https://creativecommons.org/licenses/by/4.0/).
Share and Cite
Yang, Y.; Wang, Y.; Zhang, Y.; Liu, C. Data-Driven Coupling Coordination Development of Regional Innovation EROB Composite System: An Integrated Model Perspective. Mathematics 2022, 10, 2246. https://doi.org/10.3390/math10132246
Yang Y, Wang Y, Zhang Y, Liu C. Data-Driven Coupling Coordination Development of Regional Innovation EROB Composite System: An Integrated Model Perspective. Mathematics. 2022; 10(13):2246. https://doi.org/10.3390/math10132246
Chicago/Turabian StyleYang, Yaliu, Yuan Wang, Yingyan Zhang, and Conghu Liu. 2022. "Data-Driven Coupling Coordination Development of Regional Innovation EROB Composite System: An Integrated Model Perspective" Mathematics 10, no. 13: 2246. https://doi.org/10.3390/math10132246