Abstract
This paper proposes a multi-objective teaching–learning studying-based algorithm (MTLSBA) to handle different objective frameworks for solving the large-scale Combined Heat and Power Economic Environmental Dispatch (CHPEED) problem. It aims at minimizing the fuel costs and emissions by managing the power-only, CHP and heat-only units. TLSBA is a modified version of TLBA to increase its global optimization performance by merging a new studying strategy. Based on this integrated tactic, every participant gathers knowledge from someone else randomly to improve his position. The position is specified as the vector of the design variables, which are the power and heat outputs from the power-only, CHP and heat-only units. TLSBA has been upgraded to include an extra Pareto archiving to capture and sustain the non-dominated responses. The objective characteristic is dynamically adapted by systematically modifying the shape of the applicable objective model. Likewise, a decision-making approach based on the fuzzy concept is used to select the most suitable CHPEED solution for large-scale dispatching of combined electrical power and heat energies. The proposed MTLSBA is assigned to multiple testing of 5-unit, 7-unit and 96-unit systems. It is contrasted with other reported techniques in the literature. According to numerical data, the suggested MTLSBA outperforms the others in terms of effectiveness and robustness indices. For the 5-unit system, the proposed MTLSBA achieves improvement in the fuel costs of 0.6625% and 0.3677% and reduction in the emissions of 2.723% and 7.4669% compared to non-dominated sorting genetic algorithm (NSGA-II) and strength Pareto evolutionary algorithm (SPEA 2), respectively. For the 7-unit system, the proposed MTLSBA achieves improvement in the fuel costs of 2.927% and 3.041% and reduction in the emissions of 40.156% and 40.050% compared to NSGA-II and SPEA 2, respectively.
Keywords:
teaching–learning-based optimization; studying effects; economic emission dispatching; valve-point loading effect; combined electrical power and heat energies MSC:
68T20
1. Introduction
Meta-heuristics are becoming increasingly prominent in several academic fields for tackling difficult optimization problems [1]. These stochastic optimization algorithms are among the most successful and efficient tactics for discovering optimum solutions, in contrast to conventional optimization procedures, which are undervalued owing to problems such as local minima stagnation [2]. Due to the obvious increase in industrial and household demands, the globe has recently become insatiable in its use of electrical and heat energies. As a consequence, energy designers were ordered to integrate heat and power sources besides the renewable energies in order to mitigate the drawbacks of the conventional facilities. Furthermore, there is a global direction to reduce pollutant emissions that increase global warming [3]. The domain of operation research involves the recent applications of the developed optimization methods and their applications in real-world problems. Power systems engineering is one the main fields in which researchers encourage the development of these optimization methods to solve various power system engineering problems. One of these problems is the so-called the Combined Heat and Power Economic Environmental Dispatch (CHPEED) [4]. The main goal of the CHPEED problem is to find the best value for heat obtained from heat generators, power obtained from power generators, and both power and heat obtained from CHP units such that fuel costs are kept to a minimum, while heat and power demands and constraints are met precisely [5]. On the other side, energy and environmental problems are directly related to energy production and consumption.
Developing effective, secure and sustainable energies with an optimal management system is among the world’s energy policy initiatives, especially in China [6]. Economic load dispatch (ELD) is a critical optimization problem in power systems that necessitates good generator coordination, control and management [7]. It displays non-linear performance because of imposed equal and unequal requirements. As a response, it has been identified as a challenging multi-modal optimizing problem to solve [8], where a comprehensive learning particle swarm optimization (PSO) has been hybridized with sequential quadratic programming algorithm and applied for the ELD optimization of the power system. However, only the minimization of fuel costs was considered as single objective task. In [9], a multi-objective pigeon-inspired algorithm was utilized for solving the ELD problem with emission minimization, but only small number of units were considered: three cases of 6-unit and 14-unit systems. In [10], a distributed fixed-step size optimizer was presented for solving the ELD problem considering the cost function of the distributed generators, but the classical quadratic model was utilized, ignoring the practical impacts of the valve-point loadings.
The integrated energy systems can fulfil diverse demand energies with rising efficiency and productivity. This provides the foundation for forming a low-carbon sustainable economic and social improvement procedure. Moreover, combined heat and power systems have been linked to energy savings and lower environmental impact over the last few decades. For that purpose, such systems drew the attention of the scientific community and led to additional studies and advances of renewable-based combined heat and power configurations in the residential and industrial sectors [11,12]. The Combined Heat and Power Economic Environmental Dispatch (CHPEED) problem aims at minimizing the fuel costs and emissions by managing power-only, CHP and heat-only units [13]. In addition, different inequality constraints must be maintained in terms of the capacity of the power, heat and CHP units, respectively. Moreover, the mutual dependency of the CHP units must be satisfied, which can affect the solution of the CHPEED problem [14]. A myriad of metaheuristic algorithms (MAs) has been used to address the difficult Combined Heat and Power Economic Dispatch (CHPED). The published research on CHPED that used metaheuristic techniques to solve this issue can be divided into two categories according to the main goals. The first category is developing effective optimization methods for systems containing thermal plants, CHP units and boilers to obtain the lowest operating costs. The second category is the investigation of all practically relevant constraints such as transmission loss, valve-point effects and environmental challenges of heat and power supply of CHPED. The following are some of the most intriguing works in the first group: by studying network losses and the valve-point effect of power-only units, the CHPED problem was solved using a gravitational search algorithm (GSA), as illustrated in [15]. The cuckoo search algorithm (CSA) was used in [16] to address the production cost minimization of the CHPED issue, which investigates the valve-point effect of power-only units. Both of these studies investigated valve-point impacts and network losses. However, they did not take the environmental issues into consideration.
A deep reinforcement learning (DRL) method was adopted in [17] to address CHPED with different operating conditions that resulted in a significant reduction in computing complexity. Additionally, artificial neural networks were been deployed in [18] to address CHPED. In [17,18], they did not take into account practical constraints such as valve-point impact, transmission loss, and environmental aspects. In [19], the heap optimizer was applied on the large-scale 84-unit and 96-unit systems with consideration of valve-point impact and transmission loss. In addition, a hybrid firefly and self-regulating particle swarm optimizer (PSO) method was applied in [20] to solve the optimal CHPED problem. Moreover, combining the cuckoo optimization algorithm with a penalty function in [21] was utilized to solve the CHPED problem, and a differential evolution using migrated variables was performed in [22] to deal with the CHPED issue. The marine predator algorithm (MPA) [23] was improved with the division of the iterations into three distinct and uninterrupted parts to terminate the likelihoods when the prey lost their way. A multi-player harmony search (MPHS) was presented in [24] for a case study with 84 units of CHPED optimization, taking into consideration the valve-point loading effects of thermal plants. In [25], the Heap optimizer was combined with the Jellyfish optimizer and applied on a large, 96-unit CHPED system to study unit outages. Despite their significant accomplishments, the bulk of MAs have a delicate sensitivity to the adjustment of user-defined parameters. The MAs may not always converge to the global optimum, which is another disadvantage. Because hybridization is a fundamental element of high-performing algorithms, these concerns have piqued researchers’ interest, prompting them to build hybrid versions as one of the legitimate measurements.
As stated above, various algorithms have been utilized for the CHPED and CHPEED problems in the literature, which are summarized in Table 1.

Table 1.
Various algorithm strategies for CHPED and CHPEED problems.
The teaching–learning-based algorithm (TLBA) is an adaptive optimization technique that simulates the classroom teaching–learning cycle [26]. Unlike typical evolution and swarming computational intelligent techniques, its iteration computation procedure is divided into two stages, each of which performs an adaptive learning process. TLBA has caught considerable interest due to various qualities involving its simple concept, absence of algorithm-specific constants, speedy convergence and simplicity of application [27]. The TLBA has been previously applied in an efficient way for several engineering optimization problems [28]. Some examples of these successful implementations are reactive power control in electrical systems [29], service restoration in distribution feeders [30], Tsallis-entropy-based feature selection classification [31], generation expansion-planning problem [32], design of passive filters [33], dissimilar resistance spot-welding process [34], water supply pipe condition prediction [35], robot manipulator calibration [36], harmonic elimination in multi-level inverters [37], operation analysis of a grid-connected photovoltaic (PV) with battery system [38] and parameter extraction of PV modules [39,40]. The abovementioned advantages of the TLBA and its successful applications in a wide array of engineering problems are the main reasons for the selection of the TLBA in this article.
Despite this, the TLBA is susceptible to being stuck in local minimum. This paper proposes a multi-objective teaching–learning studying-based algorithm (MTLSBA), an improved version of TLBA that improves the TLBA’s entire searchability and handling of multi-objective problems. The proposed update focuses on incorporating a strategic adjustment to the TLBA, which is characterized as a study approach wherein every individual obtains knowledge from a randomly chosen participant to improve their position [41]. Additionally, the proposed MTLSBA is updated to incorporate an extra Pareto archive to preserve the non-dominated solutions. A dynamic adaptation of the fitness feature is employed by iteratively varying the form of the employed fitness function. Furthermore, a fuzzy decision-making technique is activated to finally pick the appropriate operating point of the CHPEED for the large-scale dispatch of combined electrical power and heat energies.
To demonstrate the efficacy of the proposed MTLSBA, it is applied to three test systems where two small systems of 5 and 7 units and a large-scale system of 96 units are considered. The main contribution of this paper can be summarized as follows:
- A novel MTLSBA is proposed considering the studying strategy and incorporating an extra Pareto archive.
- A multi-objective CHPEED problem is handled by minimizing the overall production fuel costs and environmental pollutants.
- The suggested MTLSBA outperforms the others in terms of effectiveness and robustness indices, according to numerical data.
- The effectiveness and the stability of the studying strategy integration in the proposed TLSBA against the standard TLBA is demonstrated compared with other reported algorithms in the literature.
This paper is prepared in five sections: the modeling of the CHPEED problem is described in Section 2, while the stages of the proposed MTLSBA are illustrated in Section 3. Section 4 illustrates the obtained results by the proposed MTLSBA compared to the TLBA and recently applied optimization algorithms, whereas Section 5 presents the concluding remarks.
2. Modeling of CHPEED Problem
The basic goal of the CHPEED is to find the best value for heat obtained from heat generators, power obtained from power generators, and both power and heat obtained from co-generators such that fuel costs are kept to a minimum, while heat and power demands and constraints are maintained. On the other side, energy and environmental problems are directly related to energy production and consumption. The CHPEED aims to reduce both the cost of system and the emission of air pollutants from fossil fuel combustion. At first, the minimization objective of the generation costs (F1) can be formulated as [42]:
where NG, NH and NCHP are the number of the power, heat and CHP units, respectively, while Ck(Pk), Cj(Hj) and Ci(Pi,Hi) are, respectively, the cost functions for the power, heat and CHP units, which can be defined as follows:
where α1, α2, α3, α4 and α5 are the cost coefficients of the power units; φ1, φ2 and φ3 cost coefficients of the heat units; β1, β2, β3, β4, β5 and β6 are the cost coefficients for the CHP units.
From Equation (2), the valve-point effects are indicated by the sinusoidal term [23], that shows the power units, supplies the issue with non-differentiability and non-convexity. Next, the minimization objective of the emissions (F2) can be formulated considering the total emissions of the pollutant gases of SO2, NOx and CO2 as:
where Ek(Pk), Ej(Hj) and Ei(Pi,Hi) are, respectively, the emission functions for the power, heat and CHP units, which can be defined as follows [43]:
where, δ1, δ2, δ3, δ4 and δ5 are the emission coefficients of the power units; π is the emission coefficient of the heat units; and γ is the emission coefficient for the CHP units.
Added to that, the inequality constraints of this issue must be maintained in terms of the capacity of the power, heat and CHP units, respectively, as considered in Equations (9)–(12), as follows:
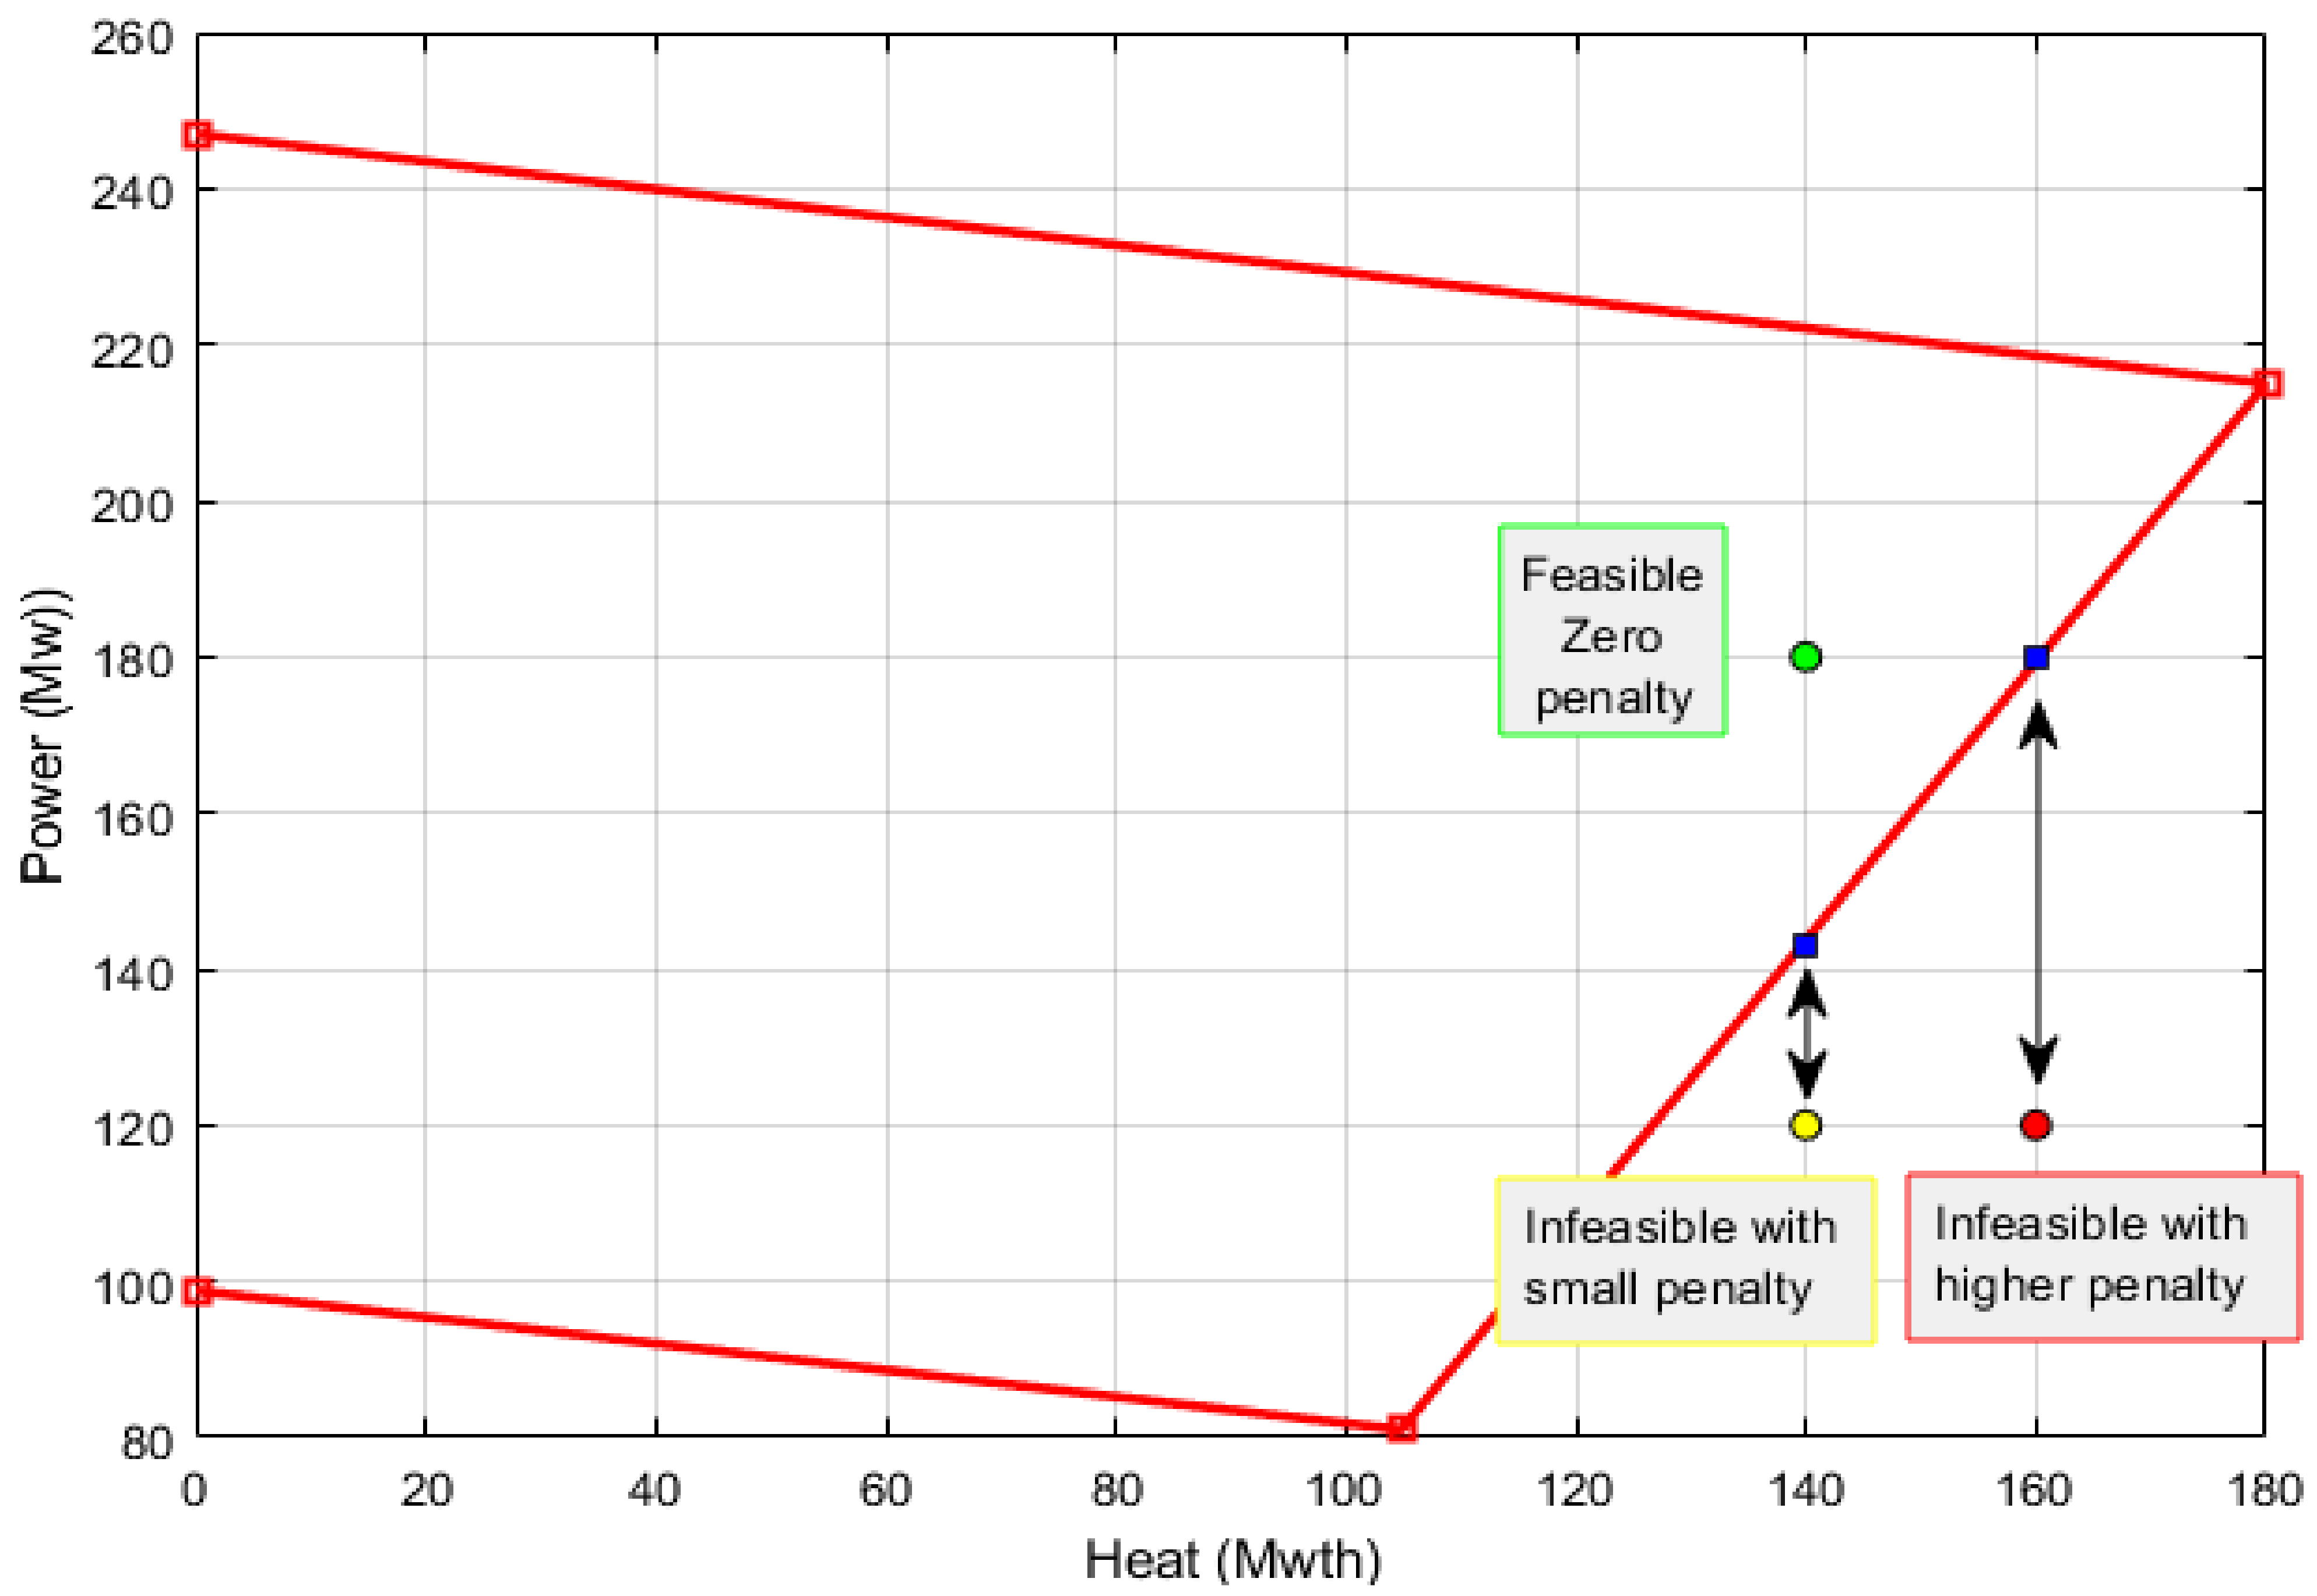
where the superscripts ‘min’ and ‘max’ indicate the minimum and maximum limits. Figure 1 describes the permissible operating area of the CHP units, which can affect the solution of the CHPEED problem. Therefore, these bounds can be maintained.
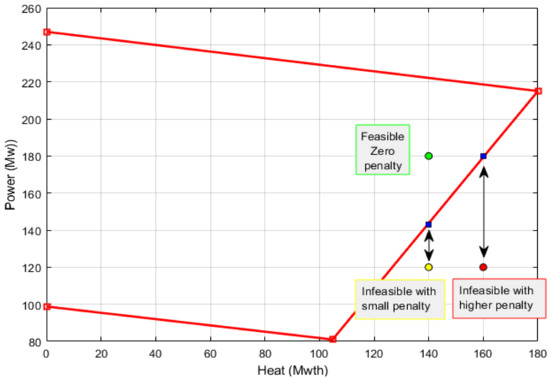
Figure 1.
Permissible operating area of CHP unit.
In addition, the equality constraints of this issue must be maintained in terms of the power and heat balance, respectively, as considered in Equations (13) and (14), as follows:
where Hdemand and Pdemand are the system heat demand and electric demand, respectively.
Furthermore, the transmission losses integration can produce another non-convexity for the problem, which is expressed in Equation (15) as a function of the units’ output power:
where PLoss is the total losses, and Bji is the coefficient element in the B-matrix that describes line losses correlating the units.
Accordingly, Equation (7) can be reformulated as follows:
3. Proposed MTLSBA for Solving the CHPEED Problem
In this section, an improved MTLSBA is introduced, which improves the TLBA’s general searchability. At first, the proposed MTLSBA update focuses on incorporating a studying strategy, in which each member borrows information from another randomly selected participant to improve their position [26]. Next, the Pareto dominance concept is integrated to deal with various opposite objectives. The suggested TLSBA is a population-based method that simulates the teaching and learning processes in a classroom. First and foremost, the individuals are initialized randomly, as follows:
where B and NB refer to the students’ vector of the design variables and their population number.
3.1. Proposed Studying Strategy
In the TLBA, if the optimization technique’s teacher becomes trapped in a local optimal solution and fails to depart in subsequent cycles, the entire class gradually shifts around this option. For the optimization procedure, a new appropriate studying strategy is proposed in the suggested TLSBA. The additional studying strategy represents a new optimization method or a sufficient mutation to develop the population diversity for such specific functions and conditions [44]. The presented strategy helps to avoid the local optima and increases the algorithm’s strength. Throughout this stage, the jth component attempts to adapt and improve its position by precisely adjusting each portion of its position [41] as:
where r is a random number following the uniform distribution within the range [0, 1]; Bk indicates a randomized individual among the population, and Dim refers to the number of design variables.
From Equation (18), all students are employed to change each dimension of each student—an excellent combination that serves to provide variation to the population while escaping from local optima. This ensures good exploration while also ensuring exploitation.
3.2. Hybridizing the Studying Strategy with the Teaching and Learning Phases
When paired with the teaching and learning phases, the studying strategy prevents the method from converging to the local minimum and considerably boosts its potency. In this strategy, all pupils are used to vary each dimension. This promotes effective exploration and assures exploitation. As a result, the updated method of the teaching stage is adjusted as:
where
where Bt is the teacher position; Bi indicates the ith pupil and round is a randomized integer approximation where FT is the learning changing factor.
Likewise, the learning phase’s updating process is altered to:
where randn refers to the randomized generating function for drawing a scalar from the standard normal distribution; Bj and Bk are, respectively, the jth and kth student who desires to learn more and another randomized person in the classroom; and F(Bj) and F(Bk) represent, respectively, their fitness functions.
Furthermore, to establish whether a pupil is more preferable than another, solutions of infeasible components ought to be addressed correctly. As a result, every new solution is tested for each dimension in the following manner:
3.3. Incorporation of Pareto Archive and Iterative Updating
The primary purpose of multi-objective optimization would be to modify the selection technique to make it easier to generate an appropriate Pareto-optimal front. To handle the multi-objective CHPEED, an external archive is required to preserve the non-dominated members at each iteration. To begin, the suggested MTLSBA includes this archive to maintain non-dominated alternatives, while Pareto domination is employed to upgrade this storage. For each iteration, the archive is improved. To update the archive, the members are updated in the following order based on dominance priority:
where It refers to the current iteration.
Based on Equation (23), each member is compared with the others in the same iteration and with each non-dominated member in the archive. If this member is non-dominated, it will be added to the archive; otherwise, it is discarded. Additionally, the teacher is elevated by randomly picking a non-dominated member from the archive.
If it becomes filled throughout optimization, a management mechanism is required. It is forbidden to utilize the archive if at least one solution dominates it. If a solution surpasses some Pareto alternatives, they all are removed, and this solution is inserted. If it is not dominated by all of the participants in the archive, it is kept [45]. When it becomes complete, some participants are discarded in the most crowded areas using a roulette wheel-based elimination mechanism.
3.4. Best Compromise Selection Based on Fuzzy Decision-Making Technique
The proposed MTLSBA in this research may be used to generate a set of Pareto optimum alternatives. Nevertheless, from a practical standpoint, the decision maker must thoroughly assess the scheduling outcomes based on the tradeoff between fuel costs and emissions, and then choose a realistic optimal compromise option. Essentially, the compromise solution is picked once the maximum number of iterations has been reached. For this process, a fuzzy decision-making technique is applied through two consecutive stages [46,47]. In the first stage, a fuzzification process is executed to convert each non-dominated solution into a membership function. In this regard, a triangular membership model is utilized for both objective functions of the fuel costs and emission minimization. In the second stage, the solution with maximum membership is selected as the best compromise solution. Both stages can be mathematically represented as follows:
- Stage 1: fuzzification process
A fuzzy technique is employed for this aim where a membership value Wi(Fj) is evaluated for each objective (Fj) as:
where NA is the number of solutions in the archive, and m is the number of objectives.
- Stage 2: Selecting the solution with maximum membership
The archive’s compromise solution has the maximum membership (λi) and may be stated as:
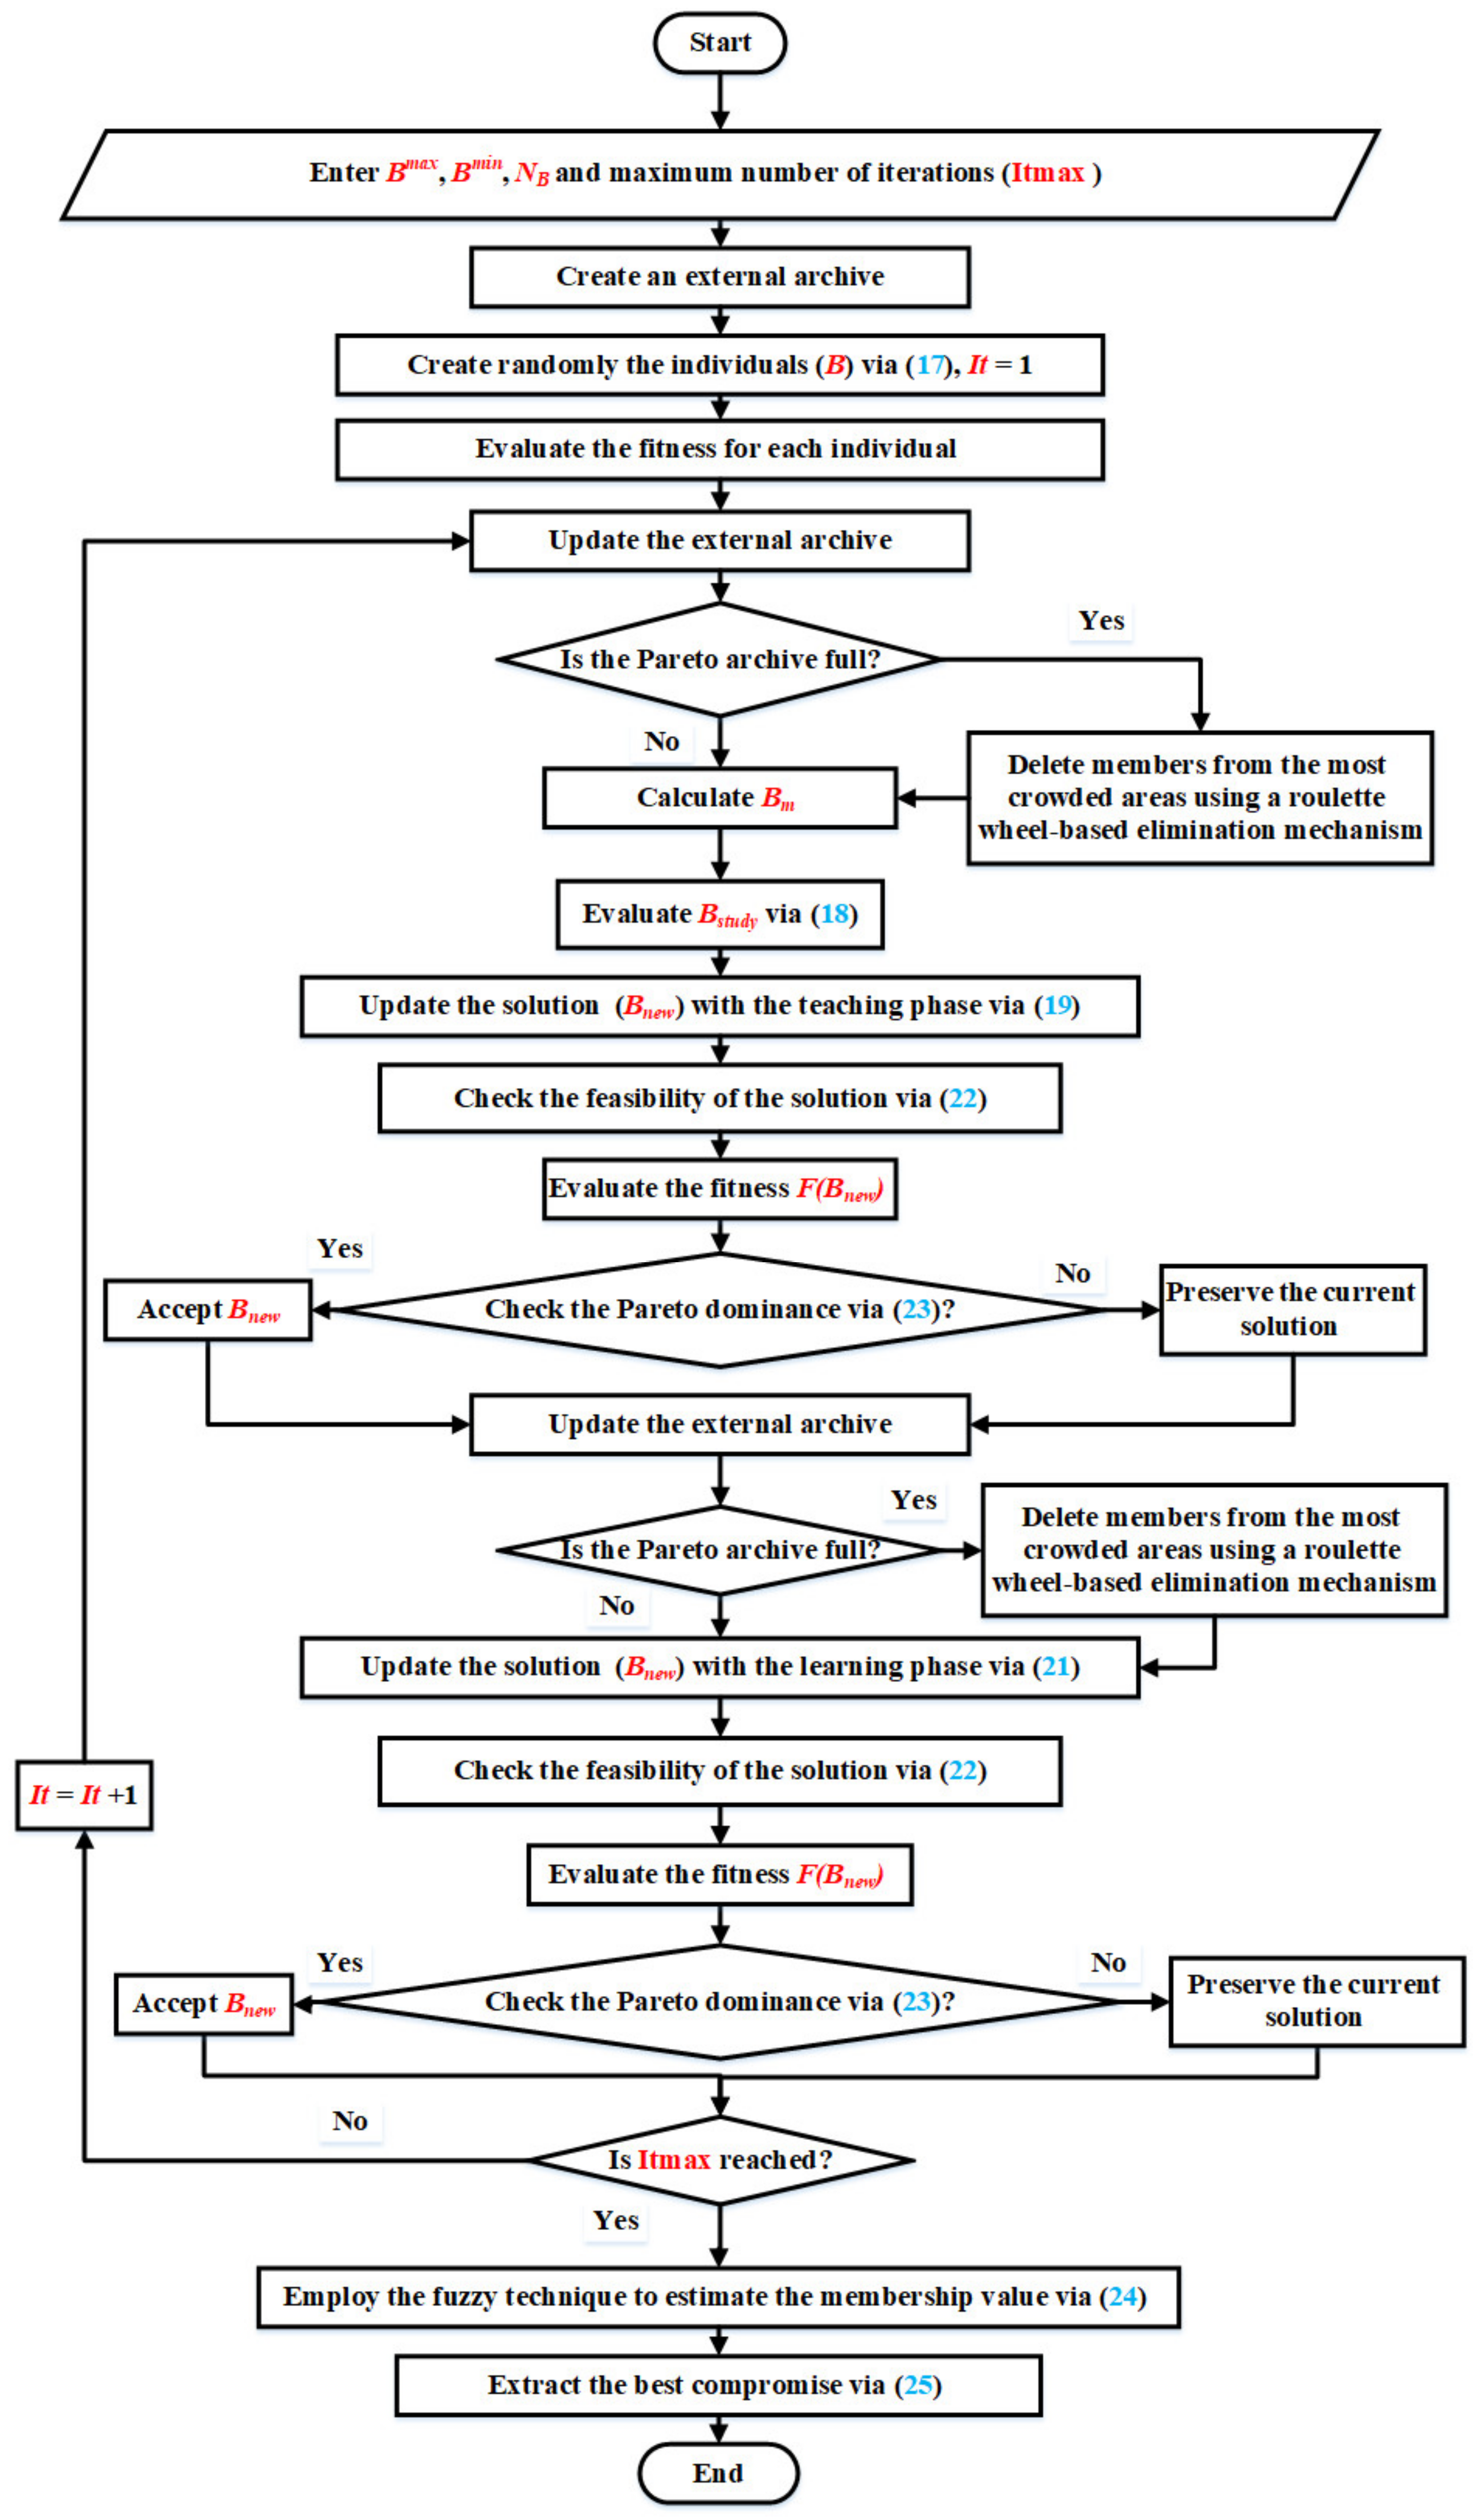
Based on that, the number of solutions in the archive and the number of objectives are the input data to the fuzzy tool. The minimum and maximum values of the fuel costs and emissions over the archive participants are the ranges. Depending on these changes, the suggested MTLSBA is oriented to addressing the CHPEED, as shown in Figure 2. In particular, Algorithm 1 displays the pseudocode of the proposed MTLSBA to solve the CHPEED, which describes the steps of the implementation of the proposed method.
| Algorithm 1 Pseudocode of the proposed MTLSBA to solve the CHPEED problem |
| Input: Population number (NB), Maximum number of iterations, lower bounds (Bmin) and upper bounds (Bmax) |
| Output: Best compromise solution (Compromise fuel costs and emissions) |
| 1: procedure MTLSBA |
| 2: Set It = 1 |
| 3: Initialize an empty external archive |
| 4: Initialize the individuals (Bm), Bm = Bmin+rand*(Bmax − Bmin) |
| 5: Evaluate the fitness functions of fuel costs and emissions for each individual j as (F(Bj)) |
| 6: while (It < Itmax) do |
| 7: Update the external archive based on Equation (23) |
| 8: Check the capacity of the archive and discard some solutions from the most crowded areas using a roulette wheel-based elimination mechanism |
| 9: Evaluate the mean member (Bm) |
| 10: Evaluate the mean member (Bstudy) based on Equation (18) |
| 11: Randomly select the teacher position (Bt) from the archive |
| 12: Update the position of the member (Bnew) based on Equation (19) |
| 13: Check the permissible boundaries of the position of the member (Bnew) based on Equation (22) |
| 14: Evaluate the fitness functions of fuel costs and emissions as (F(Bnew)) |
| 15: Compare the new member with the current one using the Pareto concept in Equation (23) and accept the new member if it dominates the current one. |
| 16: Update the external archive based on Equation (23) |
| 17: Check the capacity of the archive and discard some solutions from the most crowded areas using a roulette wheel-based elimination mechanism |
| 18: Randomly select a member (Bk) |
| 19: Update the position of the member (Bnew) based on Equation (21) |
| 20: Check the permissible boundaries of the position of the member (Bnew) based on Equation (22) |
| 21: Evaluate the fitness functions of fuel costs and emissions as (F(Bnew)) |
| 22: Compare the new member with the current one using the Pareto concept in Equation (23) and accept the new member if it dominates the current one. |
| 23: End while |
| 24: return Pareto archive /* Return the Pareto archive members and fitness values*/ |
| 24: Extract the minimum and maximum values of each fitness in the archive |
| 25: Apply a fuzzification process by specifying the values of membership function to all members in the archive based on Equation (24) |
| 26: Extract the best compromise solution with the maximum membership based on Equation (25) |
| 27: End procedure |
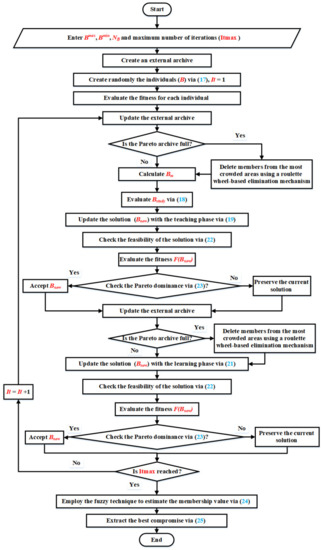
Figure 2.
Proposed MTLSBA to solve the CHPEED problem.
4. Simulation Results
To demonstrate the efficacy of the proposed MTLSBA, the obtained results for the CHPEED issue were compared to SPEA 2, NSGA-II and RCGA [48]. The proposed MTLSBA was tested on two systems with five and seven units. To investigate the extreme coordinates of the trade-off surface, both the targets of costs and emissions are reduced independently using the proposed MTLSBA.
The simulations are carried out with MATLAB 2017b. For the first two test systems, the population number and maximum number of iterations were set at 100 and 300, respectively.
Test system 1 is made up of a thermal generation unit, three CHP units, and a heat-only unit. Ref. [48] is used to obtain system data comprising coefficients of emissions and fuel costs and heat/power boundaries. The test system’s heat and power demands are 150 MWth and 300 MW, respectively.
Test system 2 is made up of four thermal generation units, two CHP units and a heat-only unit. Ref. [48] is used to obtain system data comprising the coefficients of emissions, fuel costs and losses, and heat/power boundaries. The test system’s heat and power demands are 150 MWth and 600 MW, respectively.
Added to that, a third test system is considered with large-scale characterization to show the effectiveness and the stability of the studying strategy integration in the proposed TLSBA against the standard TLBA.
Test system 3: The system consists of 24 cogeneration units, 52 power units, and 20 heat units, as described in [49]. This system considers a power demand of 5000 MW and a heat requirement of 9400 MWth. For this large system, the population number and maximum number of iterations were set at 100 and 3000, respectively, for the TLBA and TLSBA techniques.
4.1. Application for Test System 1
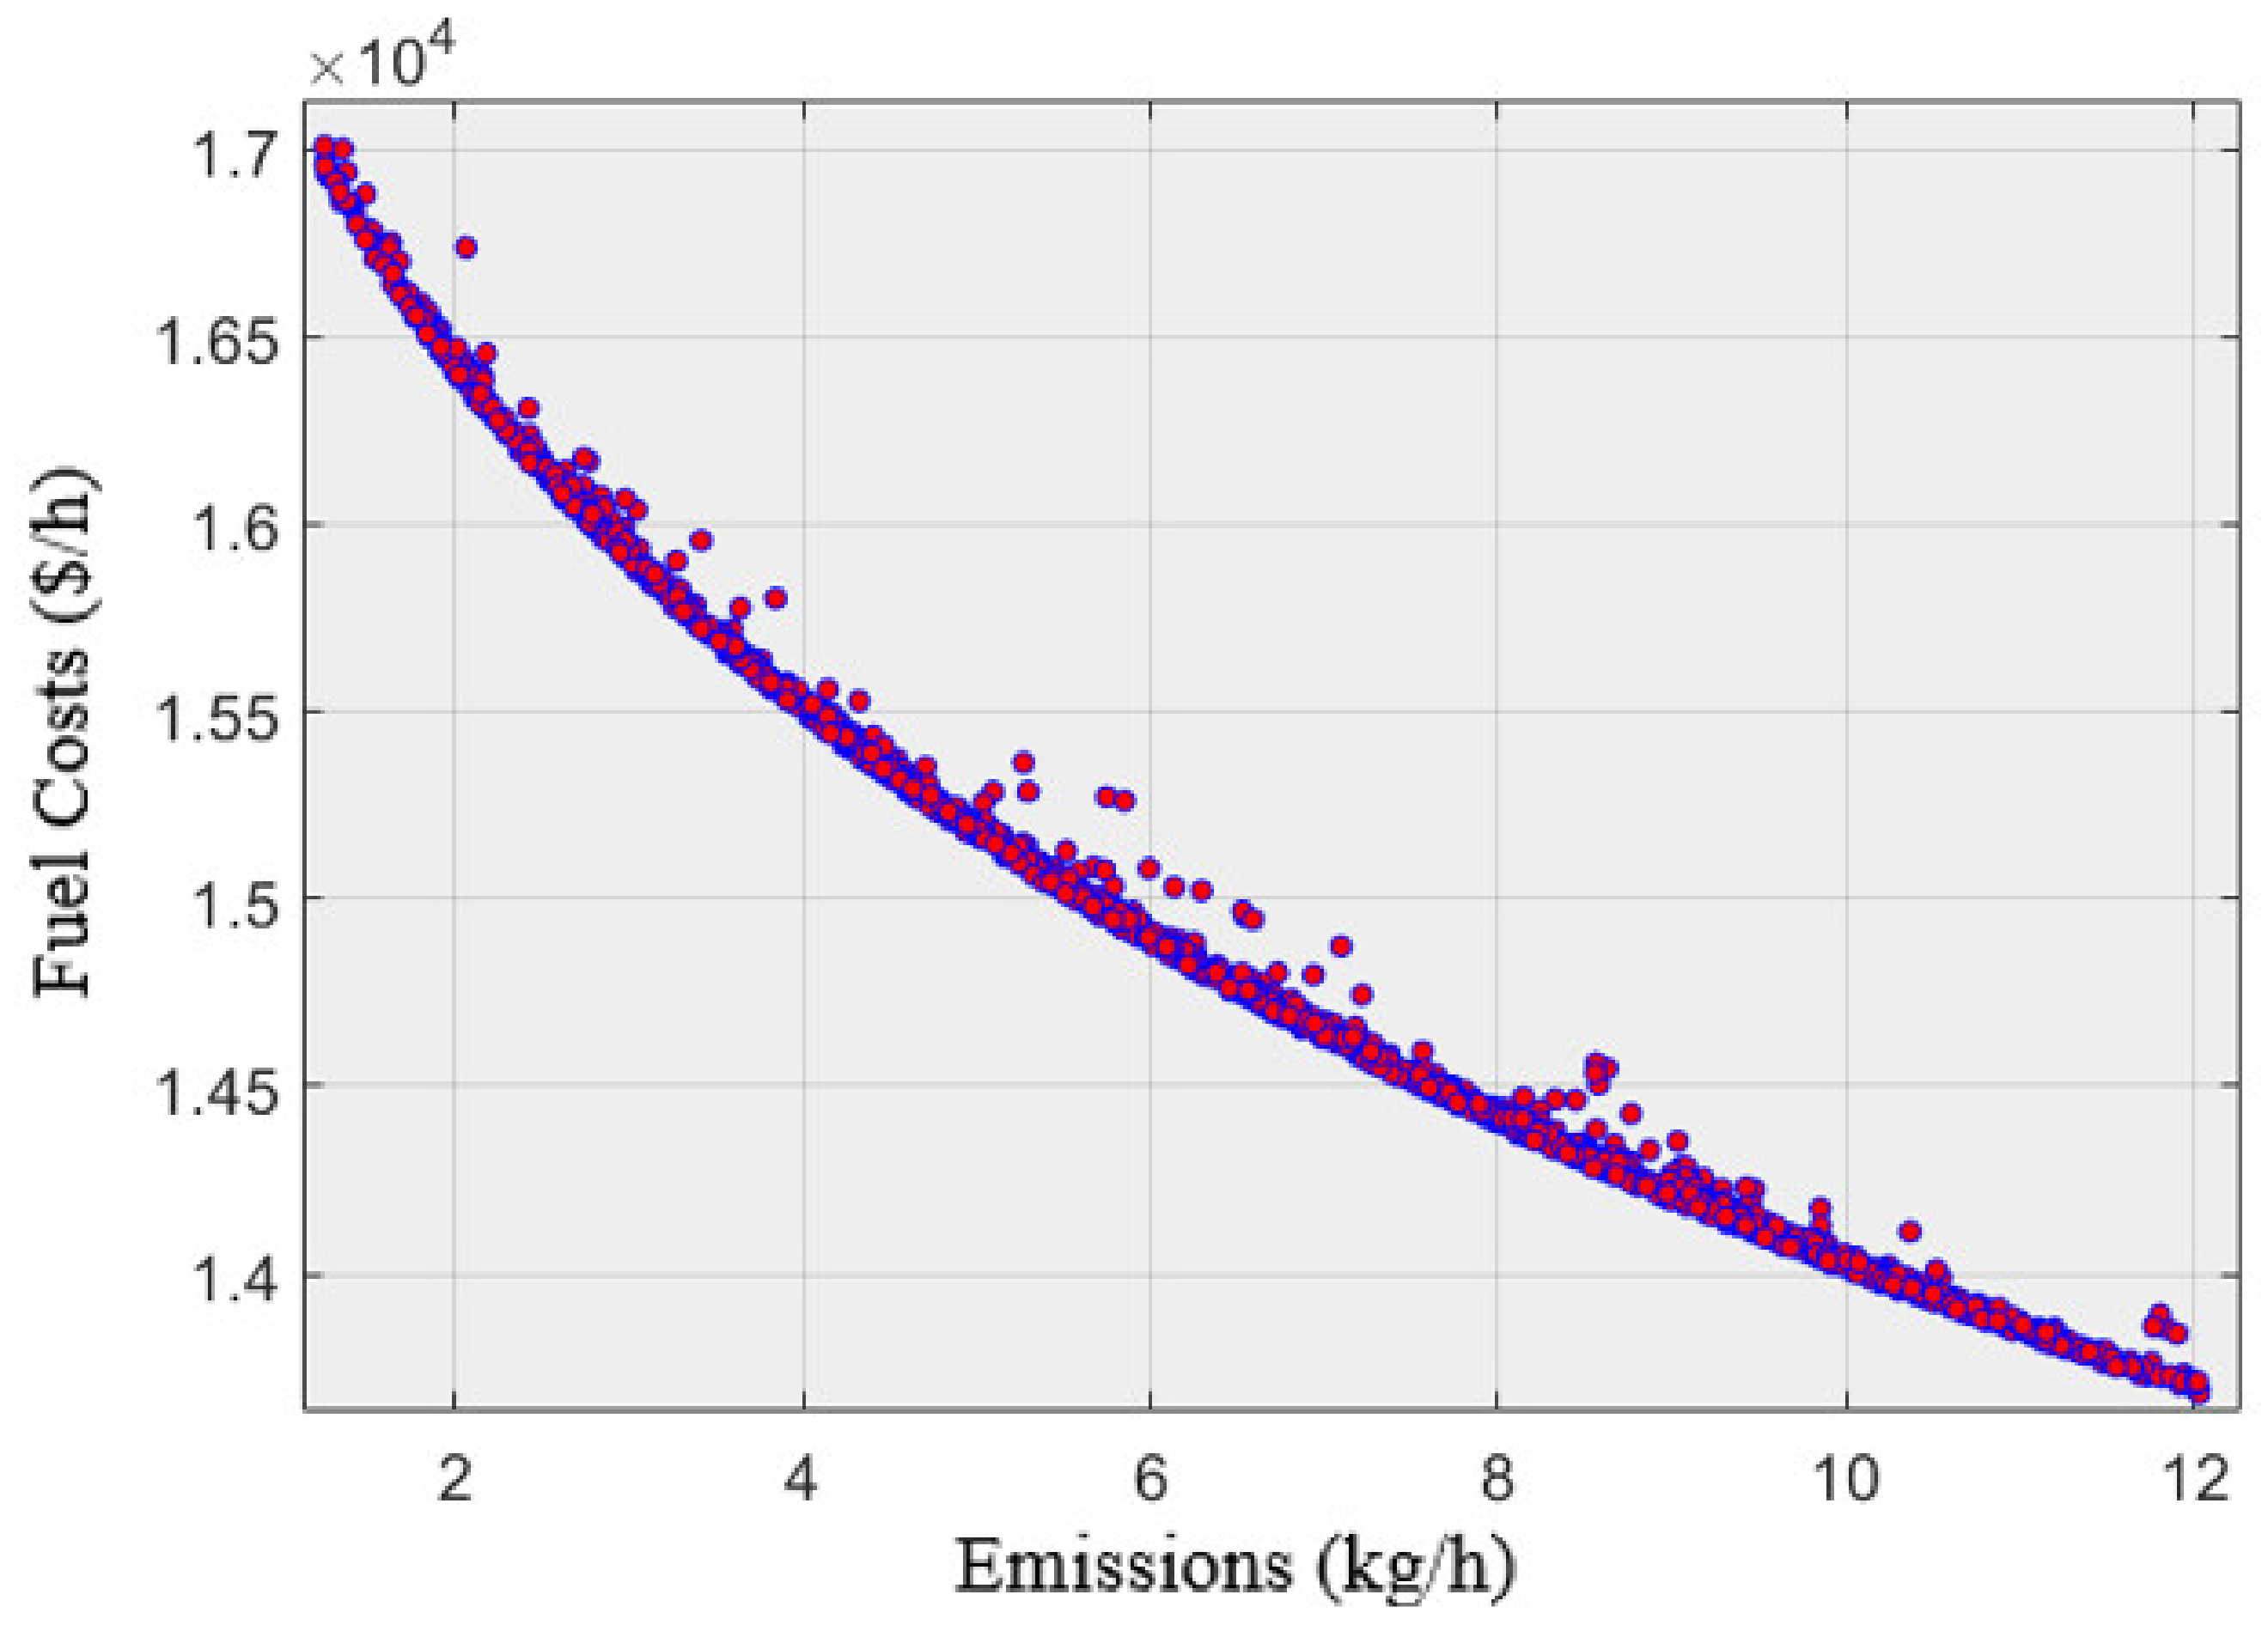
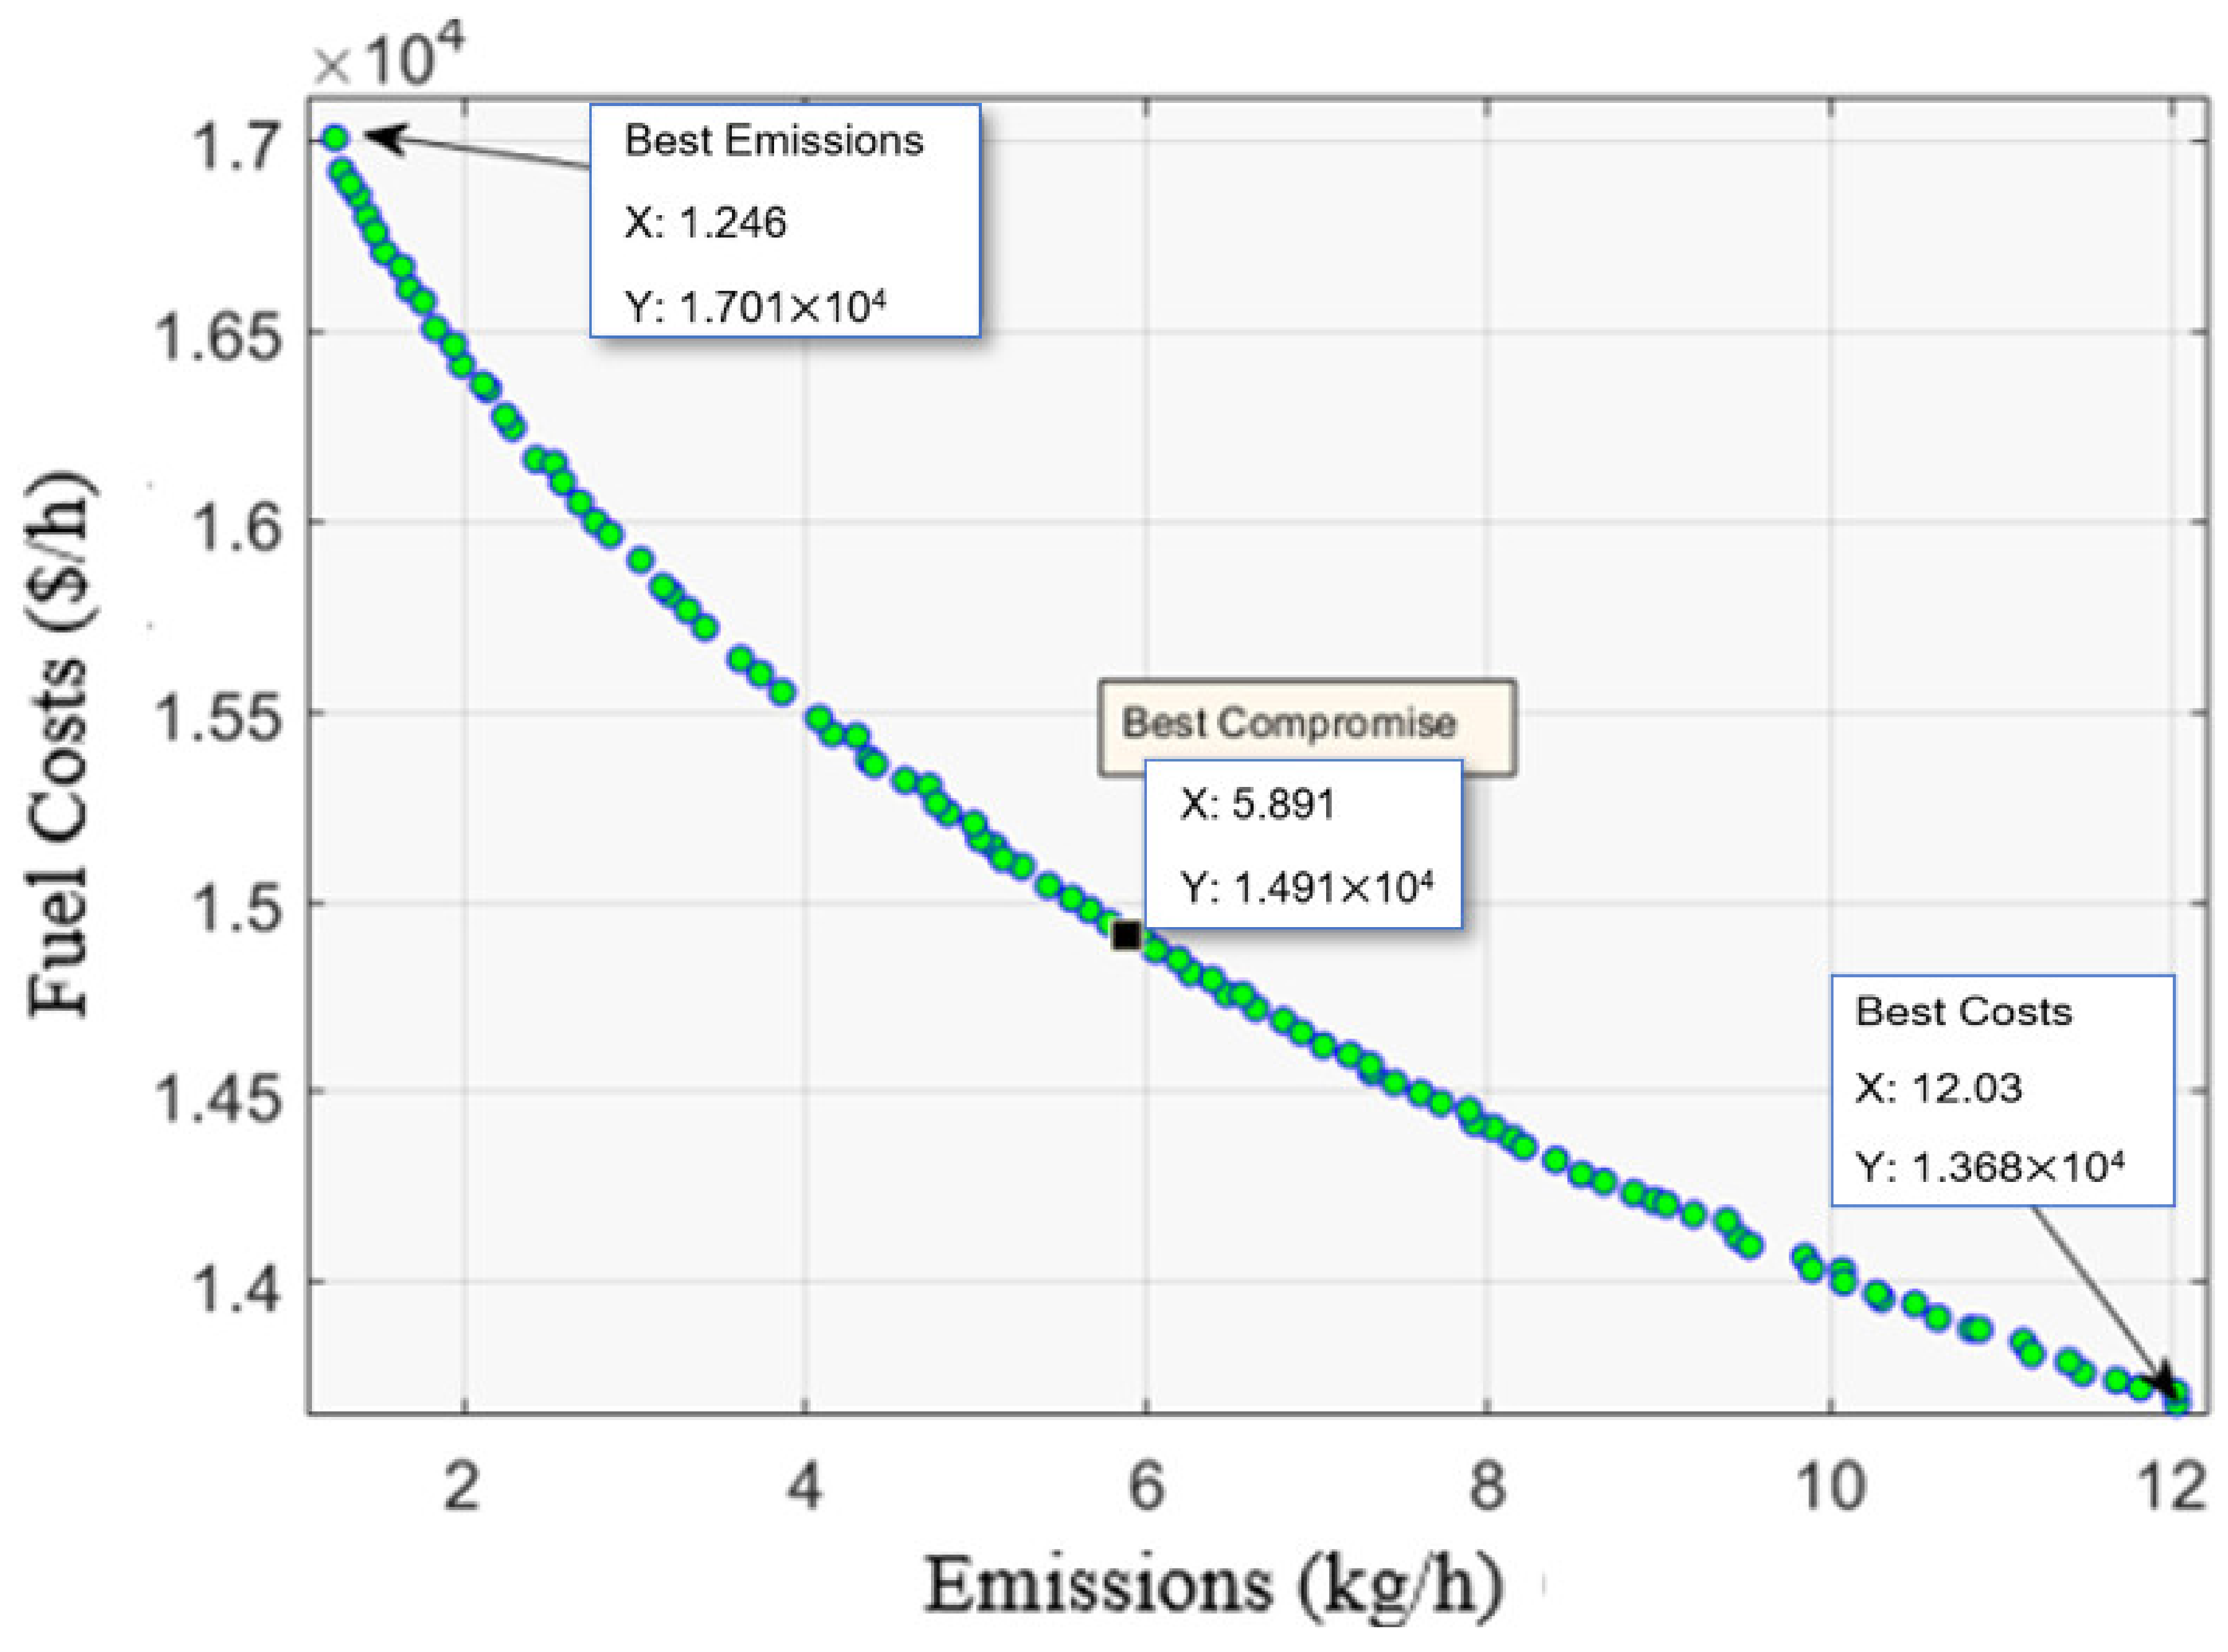
The proposed MTLSBA is applied for solving the multi-objective optimization of the CHPEED problem for minimizing the cost and emission targets. It is applied with an archive size of 100 individuals. Figure 3 describes the development of the Pareto set over the course of iterations for the optimal operation of the CHPEED problem, while Figure 4 illustrates the final Pareto set solutions. Table 2 describes the optimal outputs of the power-only, CHP and heat-only units related to the best fuel costs and emissions using the proposed MTLSBA. This table tabulates the corresponding achieved fuel costs and emissions as well. Based on the proposed MTLSBA, the fuel costs and emission goals are each reduced independently, as illustrated. The fuel expenditures are USD 13,712.35/h and emissions are 12.02 kg/h, according to the cost minimization criterion. However, in the event of emission minimization, the cost rises to USD 17,008.29168/h and the emissions fall to 1.245769996 kg/h. Compared to the RCGA [48], the proposed MTLSBA provides a reduction of 0.46% for minimizing the costs. Additionally, the proposed MTLSBA provides a higher reduction of 13.43% for minimizing the emissions.
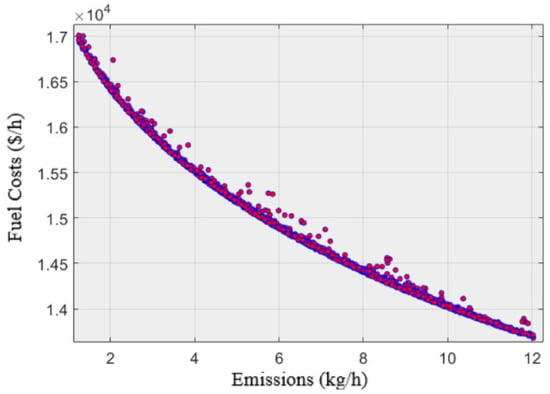
Figure 3.
Development of Pareto set over the course of iterations with the proposed MTLSBA for the CHPEED problem.
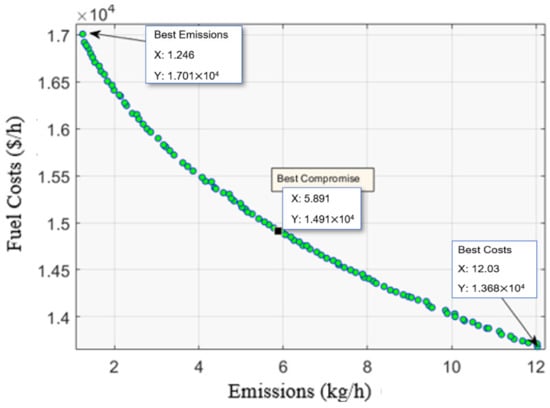
Figure 4.
Final Pareto set with the proposed MTLSBA for the CHPEED problem.

Table 2.
Results of best fuel costs and emissions of test system 1 using the proposed MTLSBA.
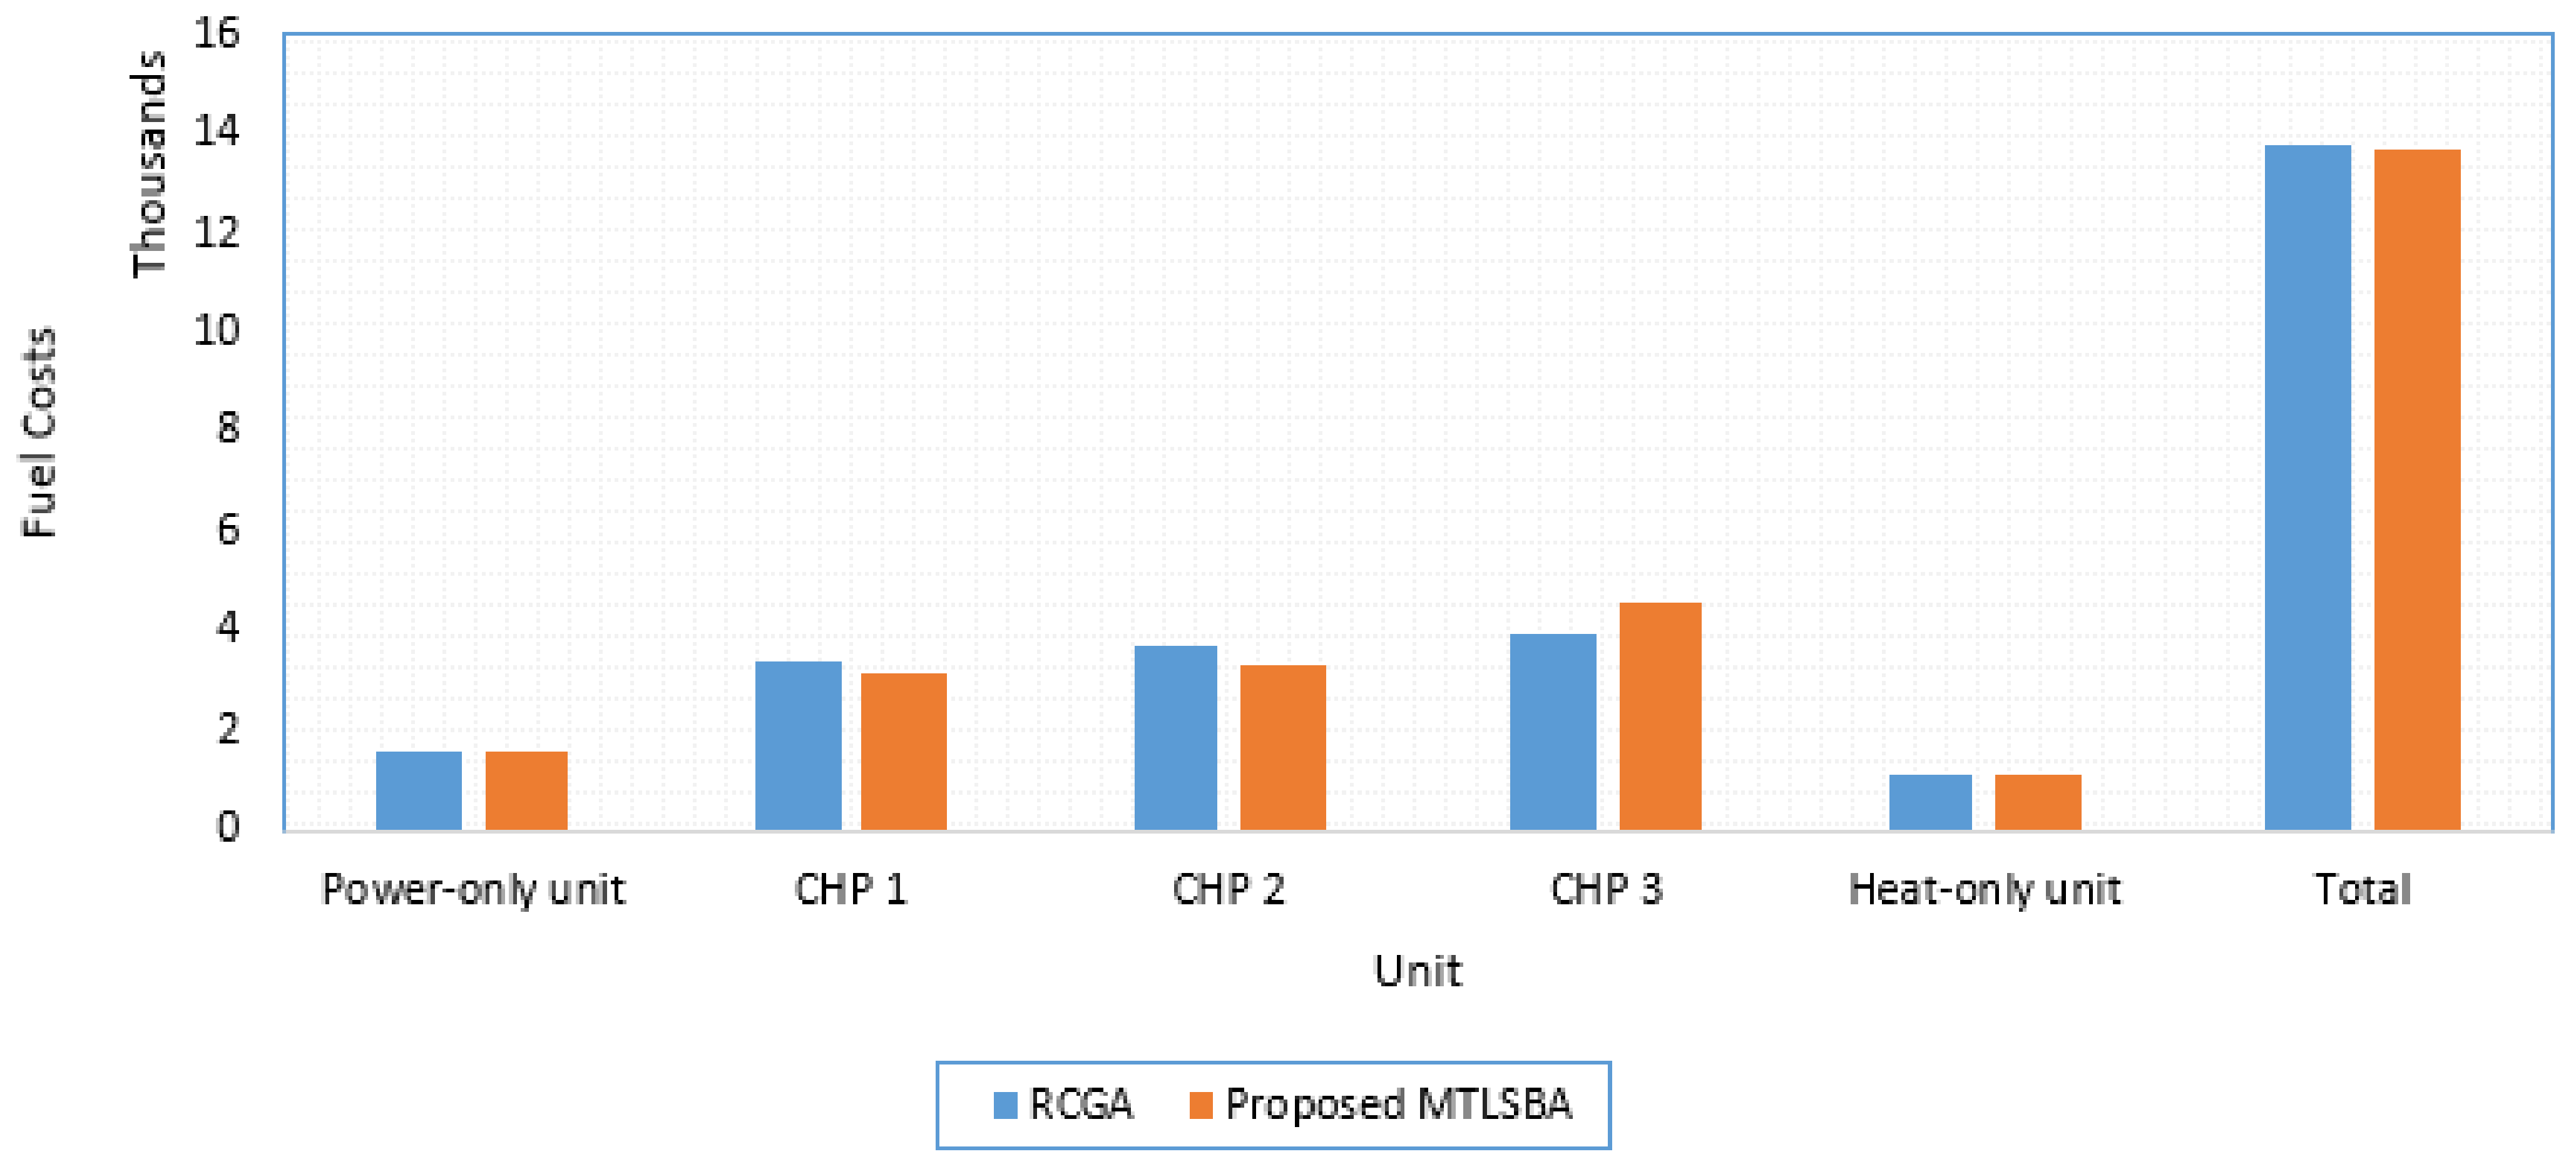
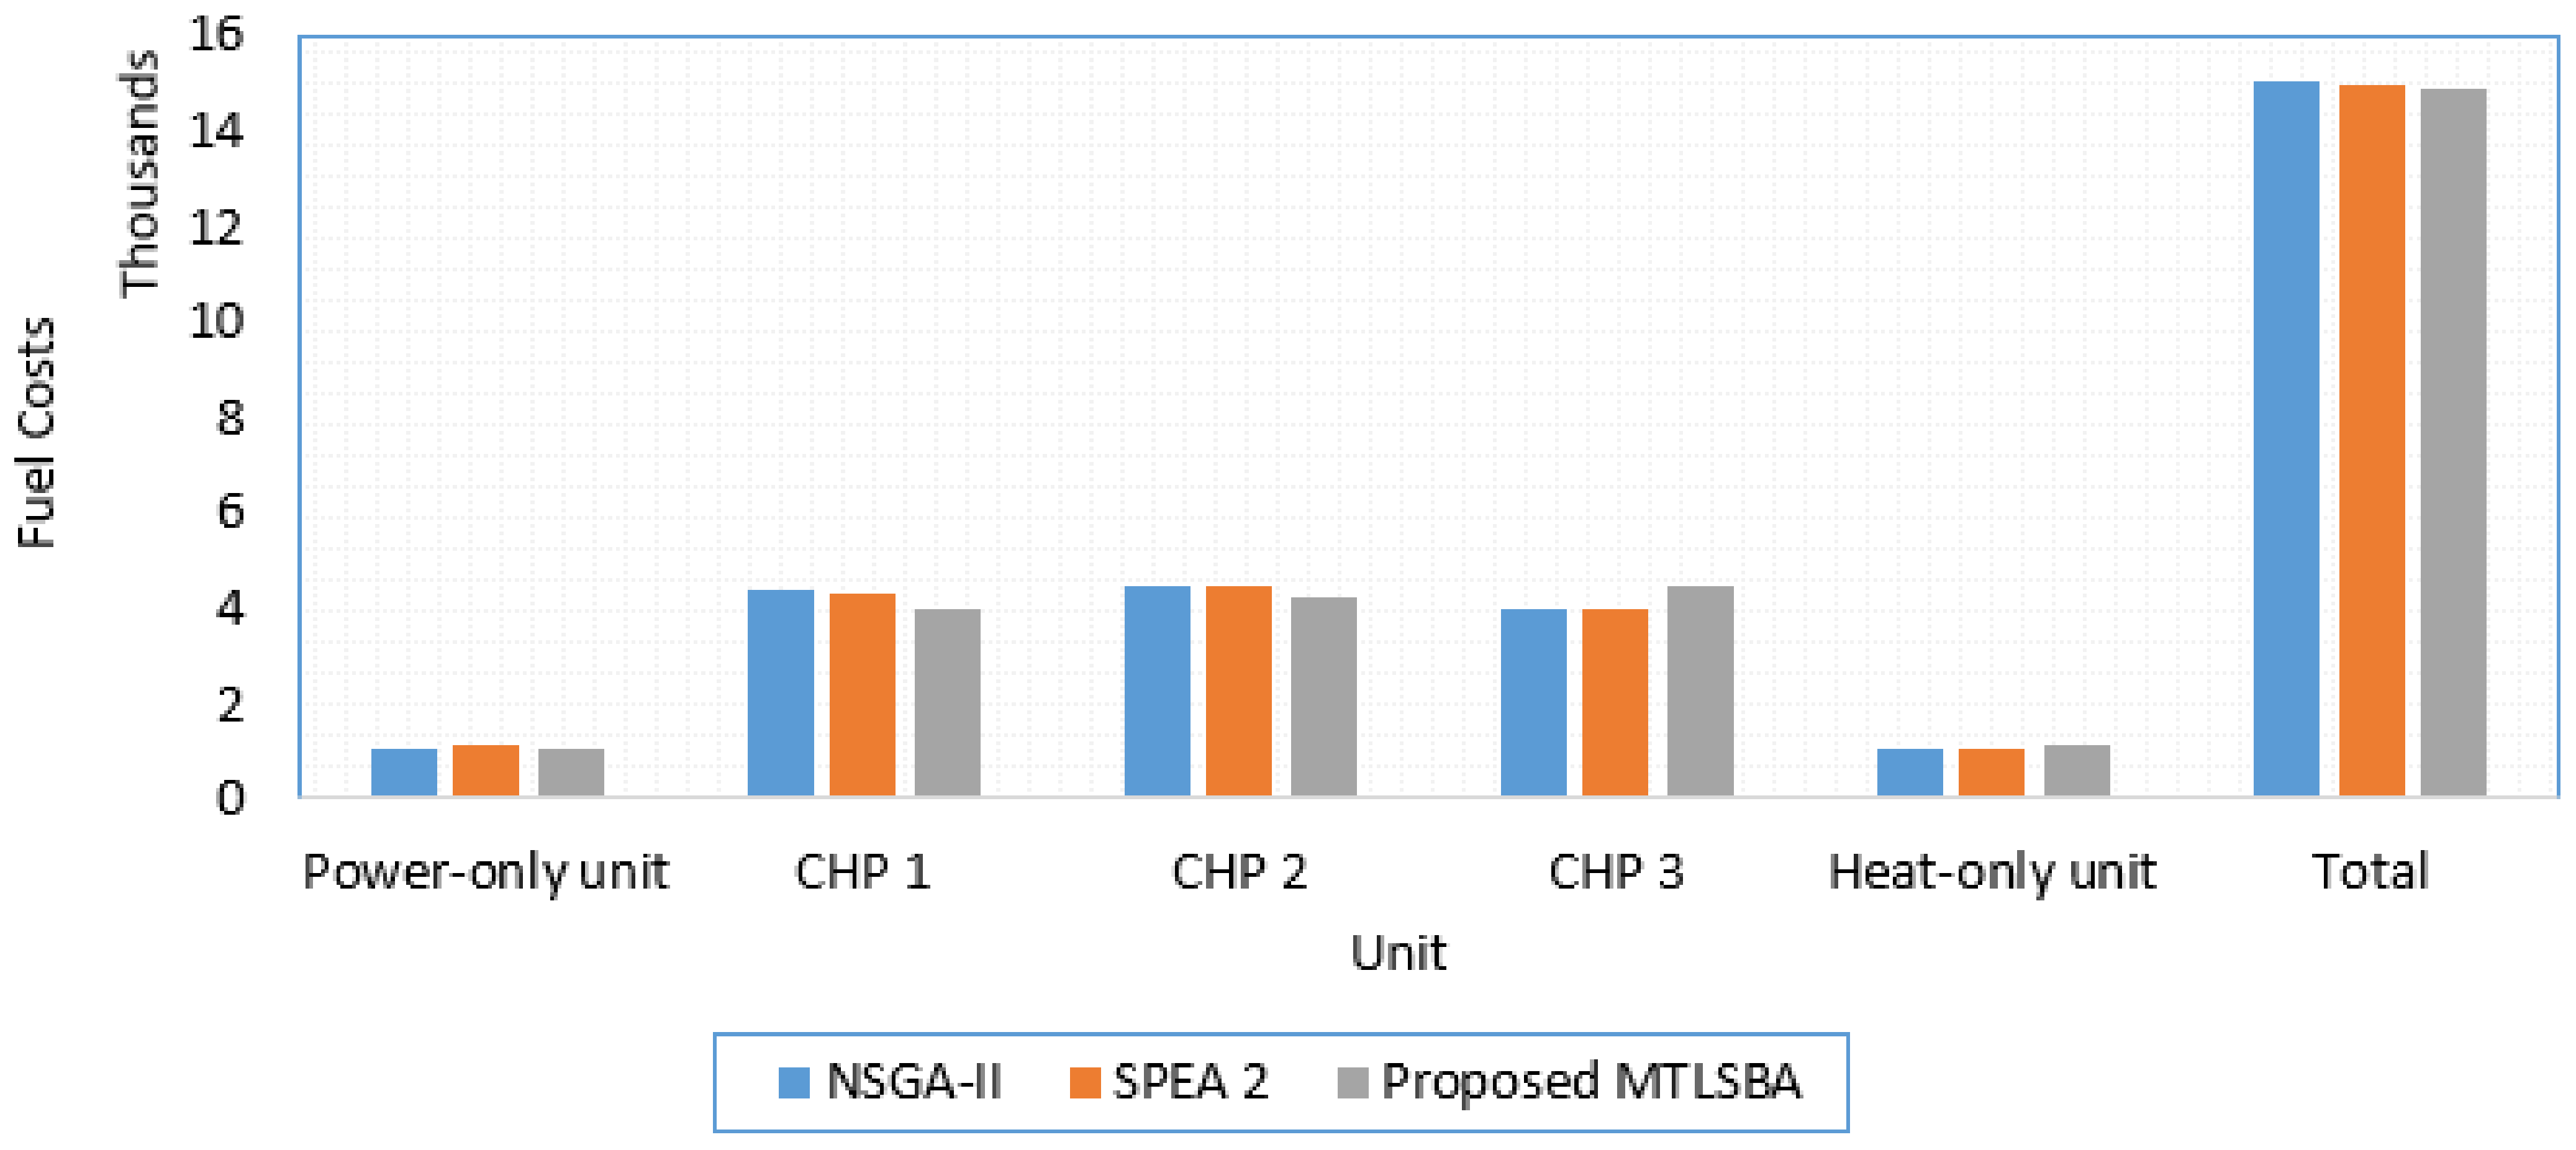
From Table 2, the outputs of H2 and P4 are high compared to the others related to the best fuel costs with 77.9339 MWth and 105 MW. To explain this remark, Figure 5 displays the related fuel costs of each unit. As shown, the proposed algorithm achieves lower total costs compared to the RCGA by minimizing the aggregation costs of the units. Despite the higher outputs of H2 and P4, the corresponding costs of CHP 1 and CHP 3 are USD 3387.226376 and 3955.060417/h, which represent 24.58% and 28.71% of the total costs of USD 13,712.35/h. Moreover, the outputs of P3 and H3 are much smaller, at 16.3906 MW and 19.3727 MWth, respectively. The related costs of CHP2 are USD 3737.447419/h, representing 27.12% of the total costs of USD 13,712.35/h. Finally, the proposed algorithm searches for the minimization of the aggregated costs, not their individuals. This minimization target is achieved based on the proposed MTLSBA compared to the RCGA.
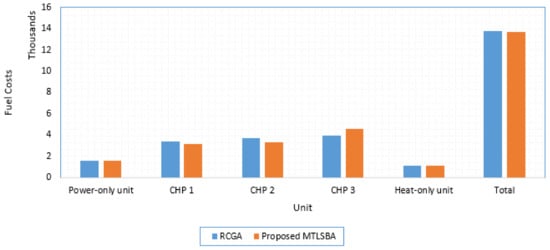
Figure 5.
Fuel costs for each unit related to the best fuel costs in Table 2.
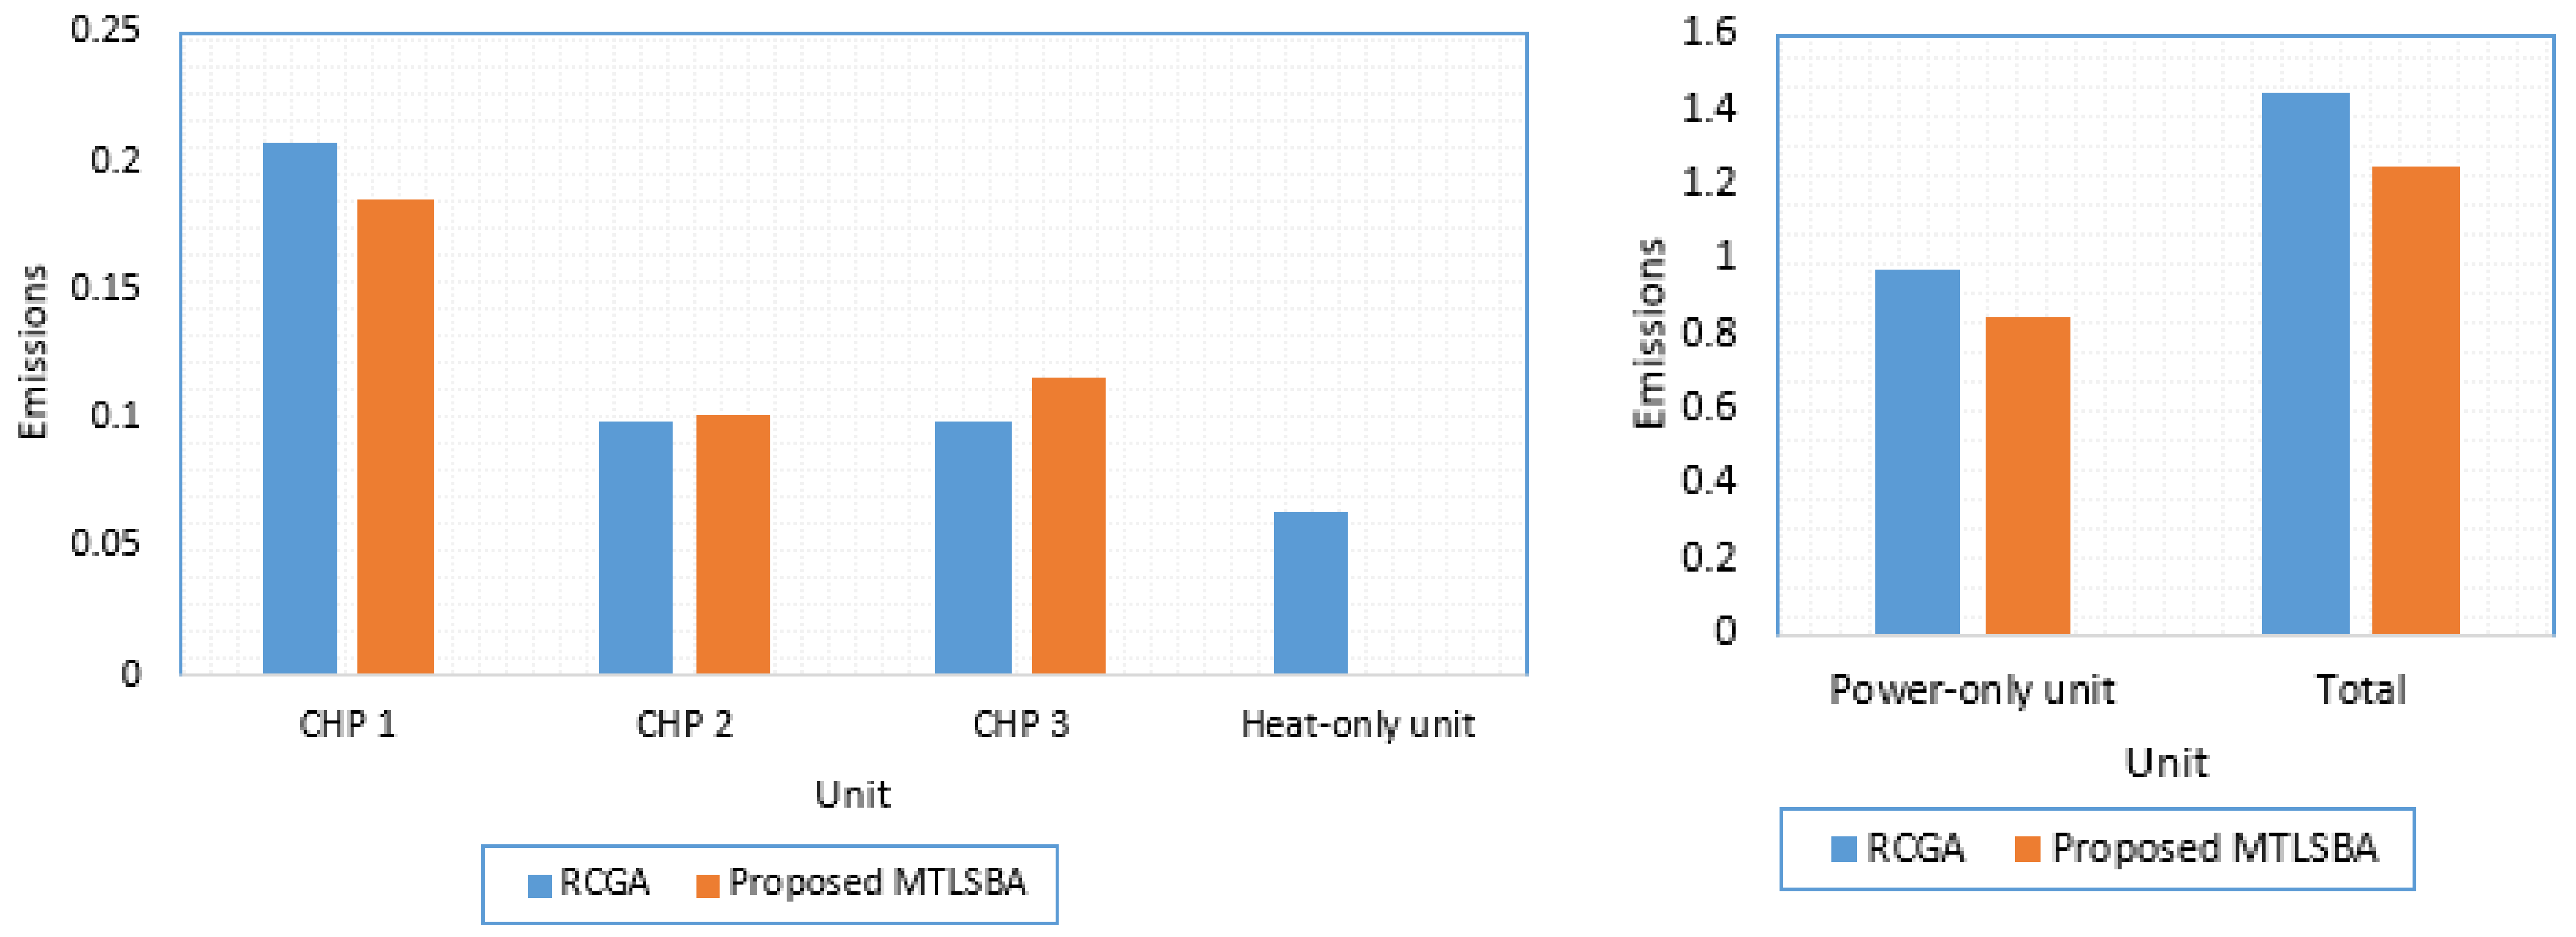
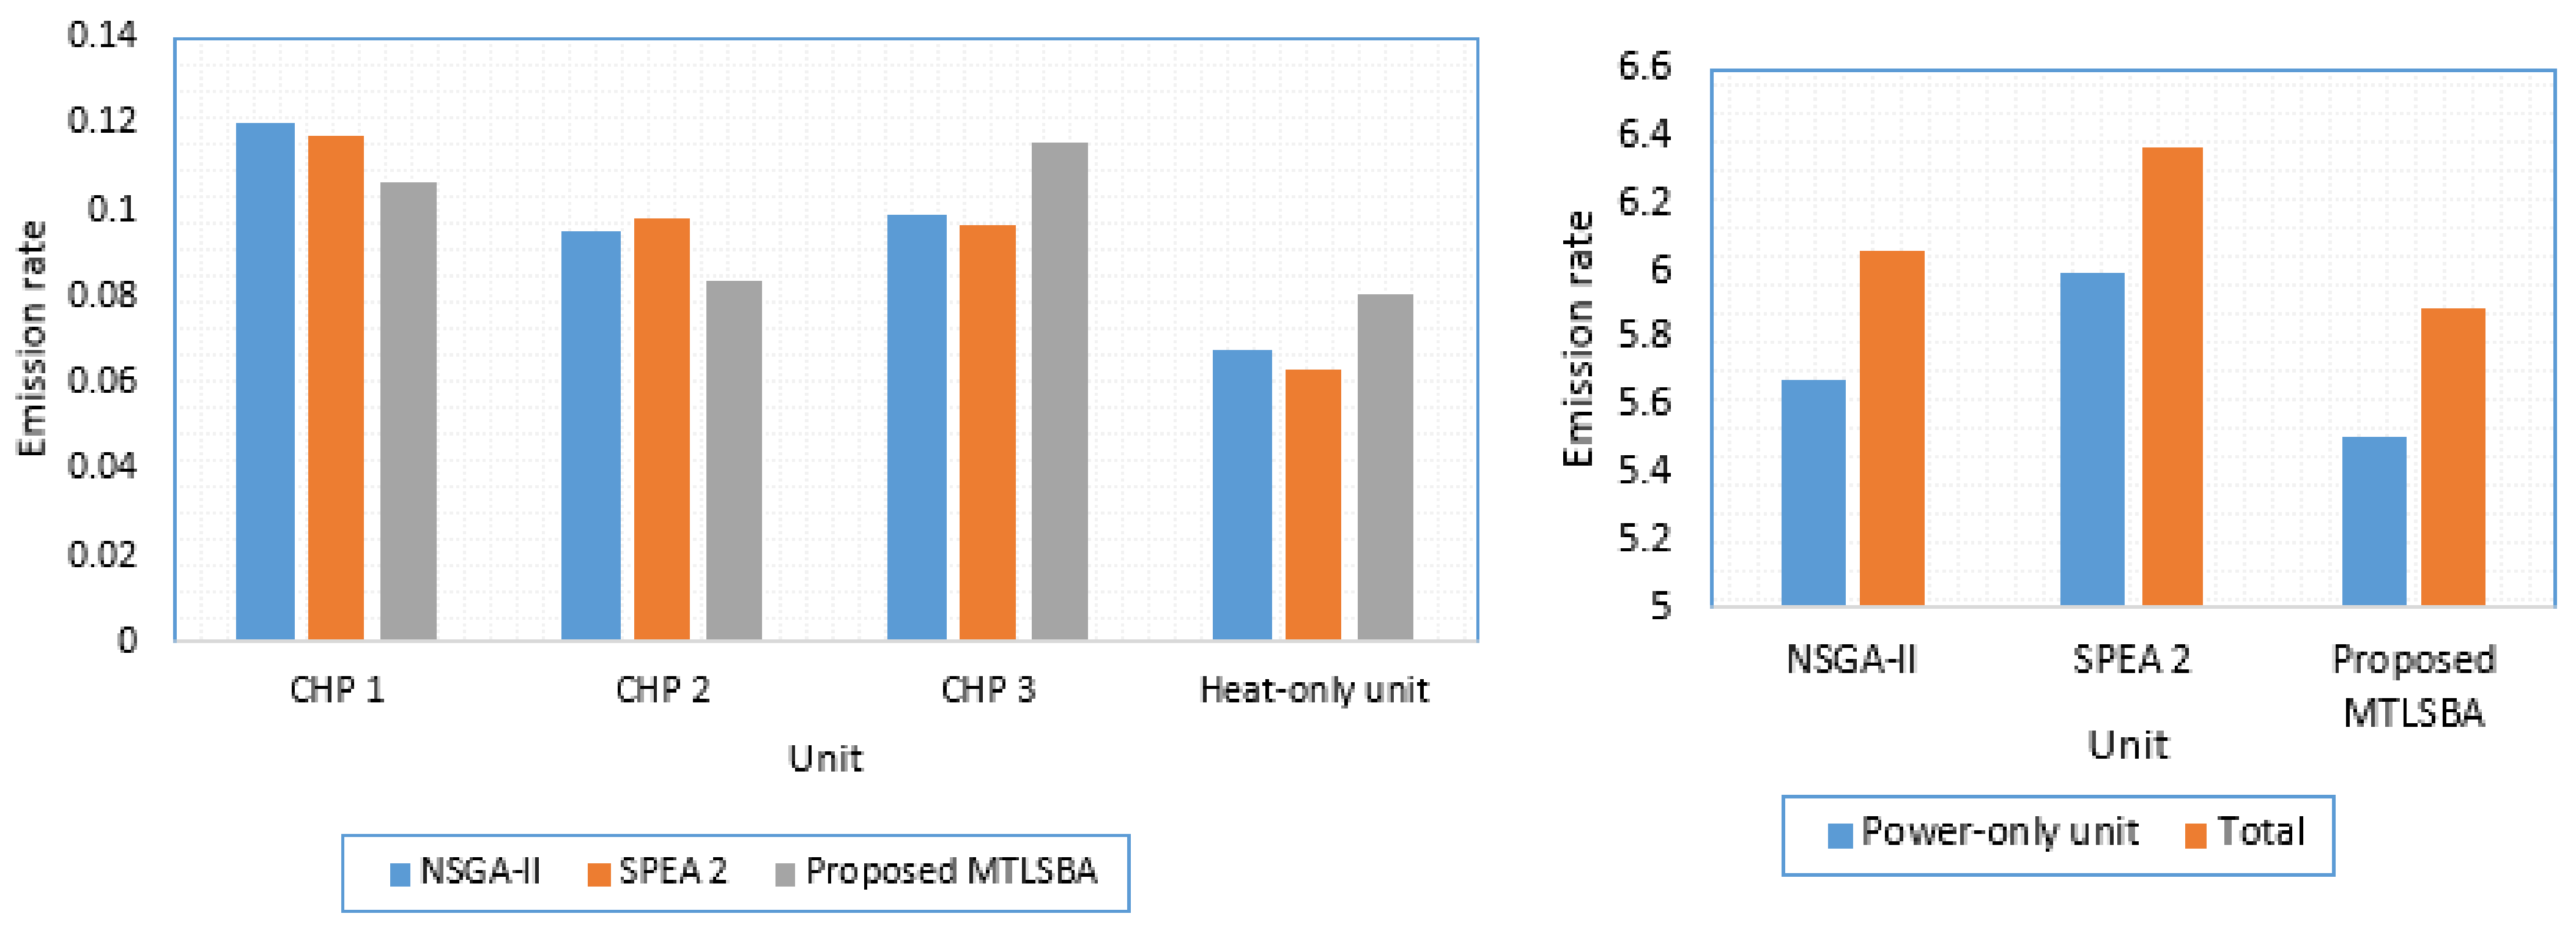
Similarly, from Table 2, the outputs of H2 and P4 are high compared to the others related to the emission rate, at 107 MWth and 105 MW. Figure 6 displays the related emission rates of each unit. Despite the higher outputs of H2 and P4, the corresponding emissions of CHP 1 and CHP 3 are 0.18516927 and 0.1155 kg/h, which do not exceed 15% of the total emissions of 1.245768323 kg/h. For this case, the main share in minimizing the total emissions is the power-only unit with an output of 36.4542 MW, resulting in emissions of 0.8431908729 kg/h, representing 67.68% of the total emissions.
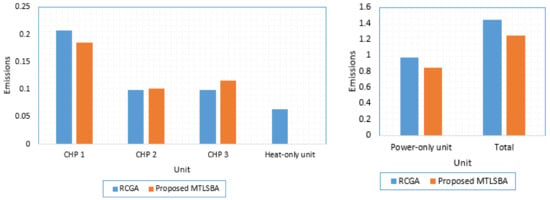
Figure 6.
Emission rates for each unit related to the best emissions in Table 2.
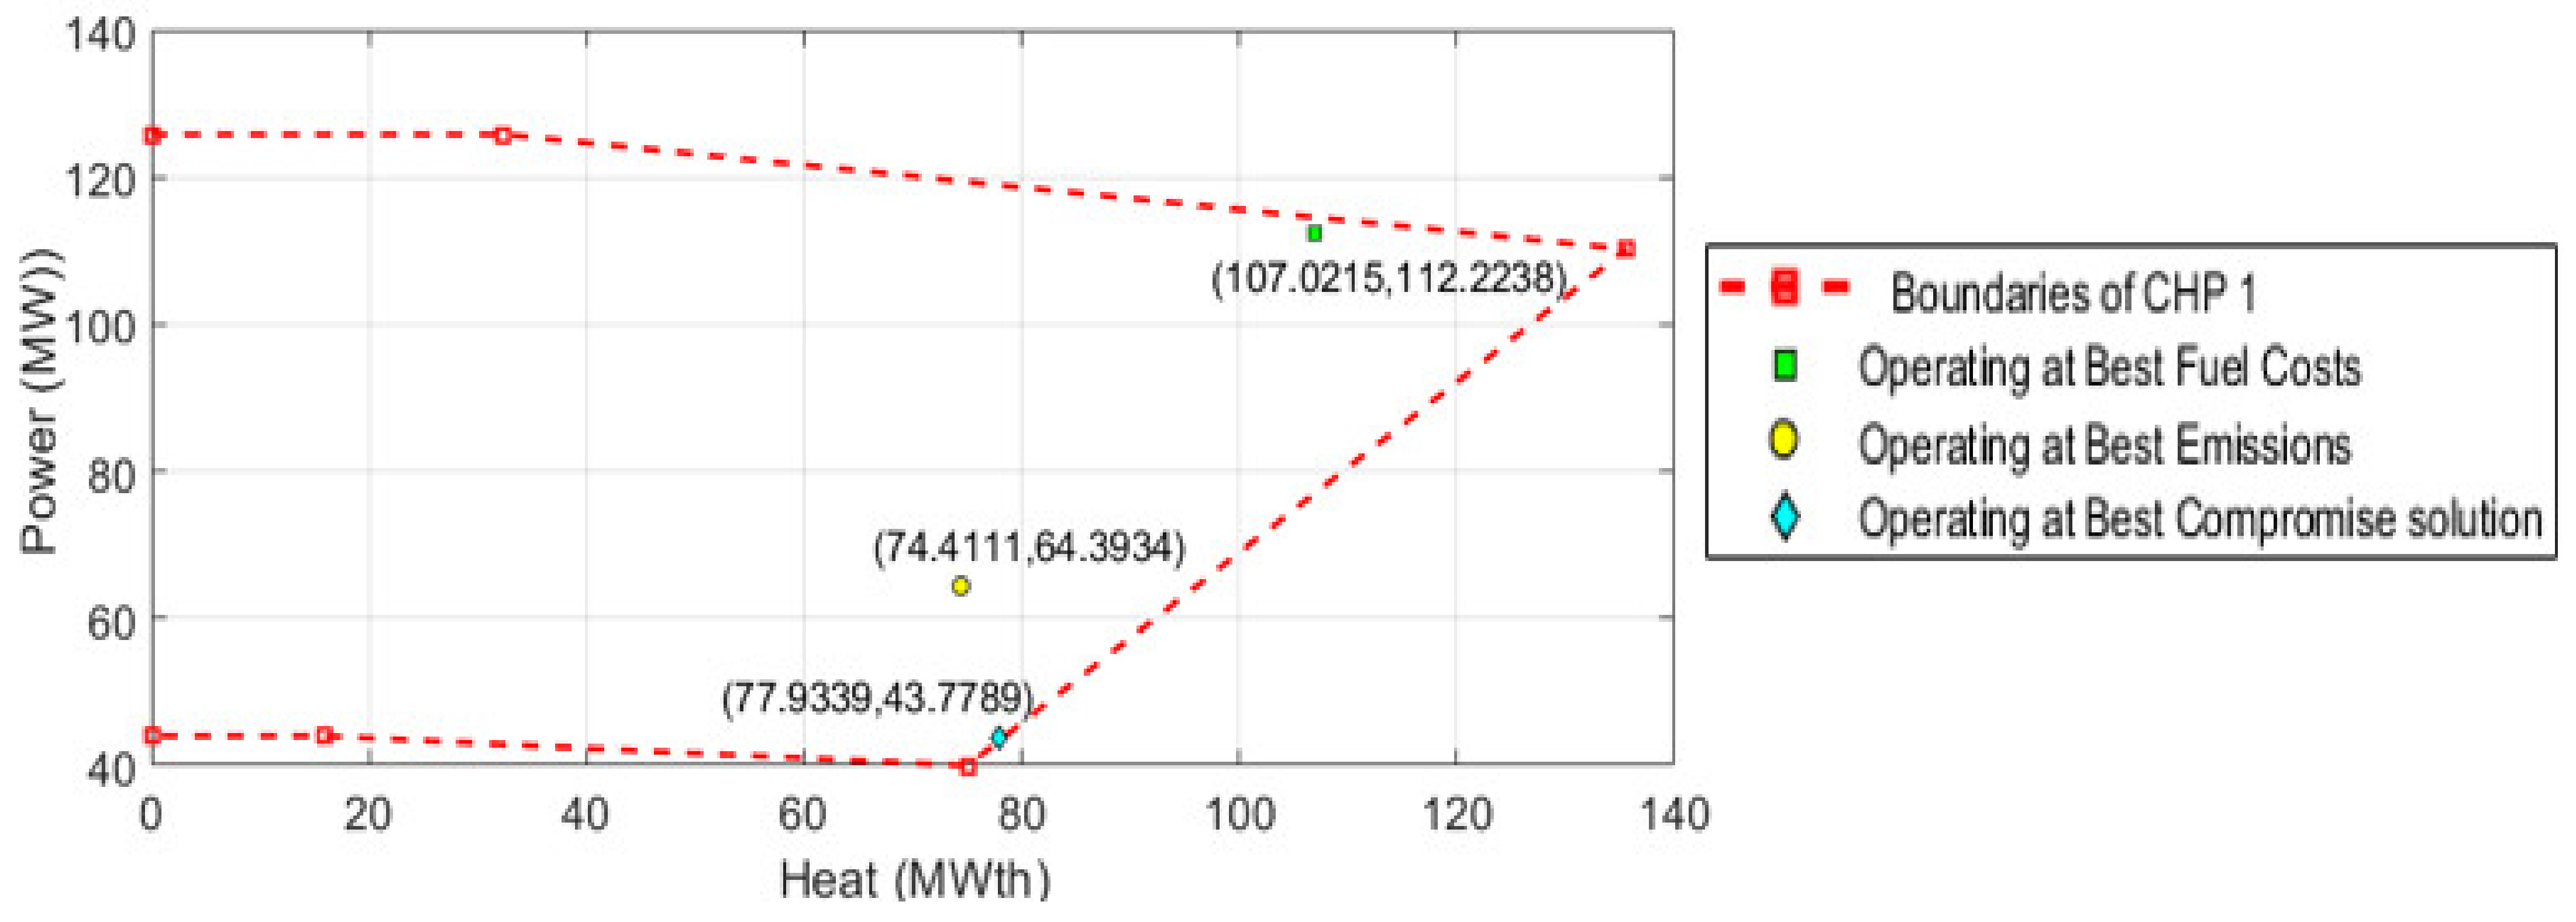
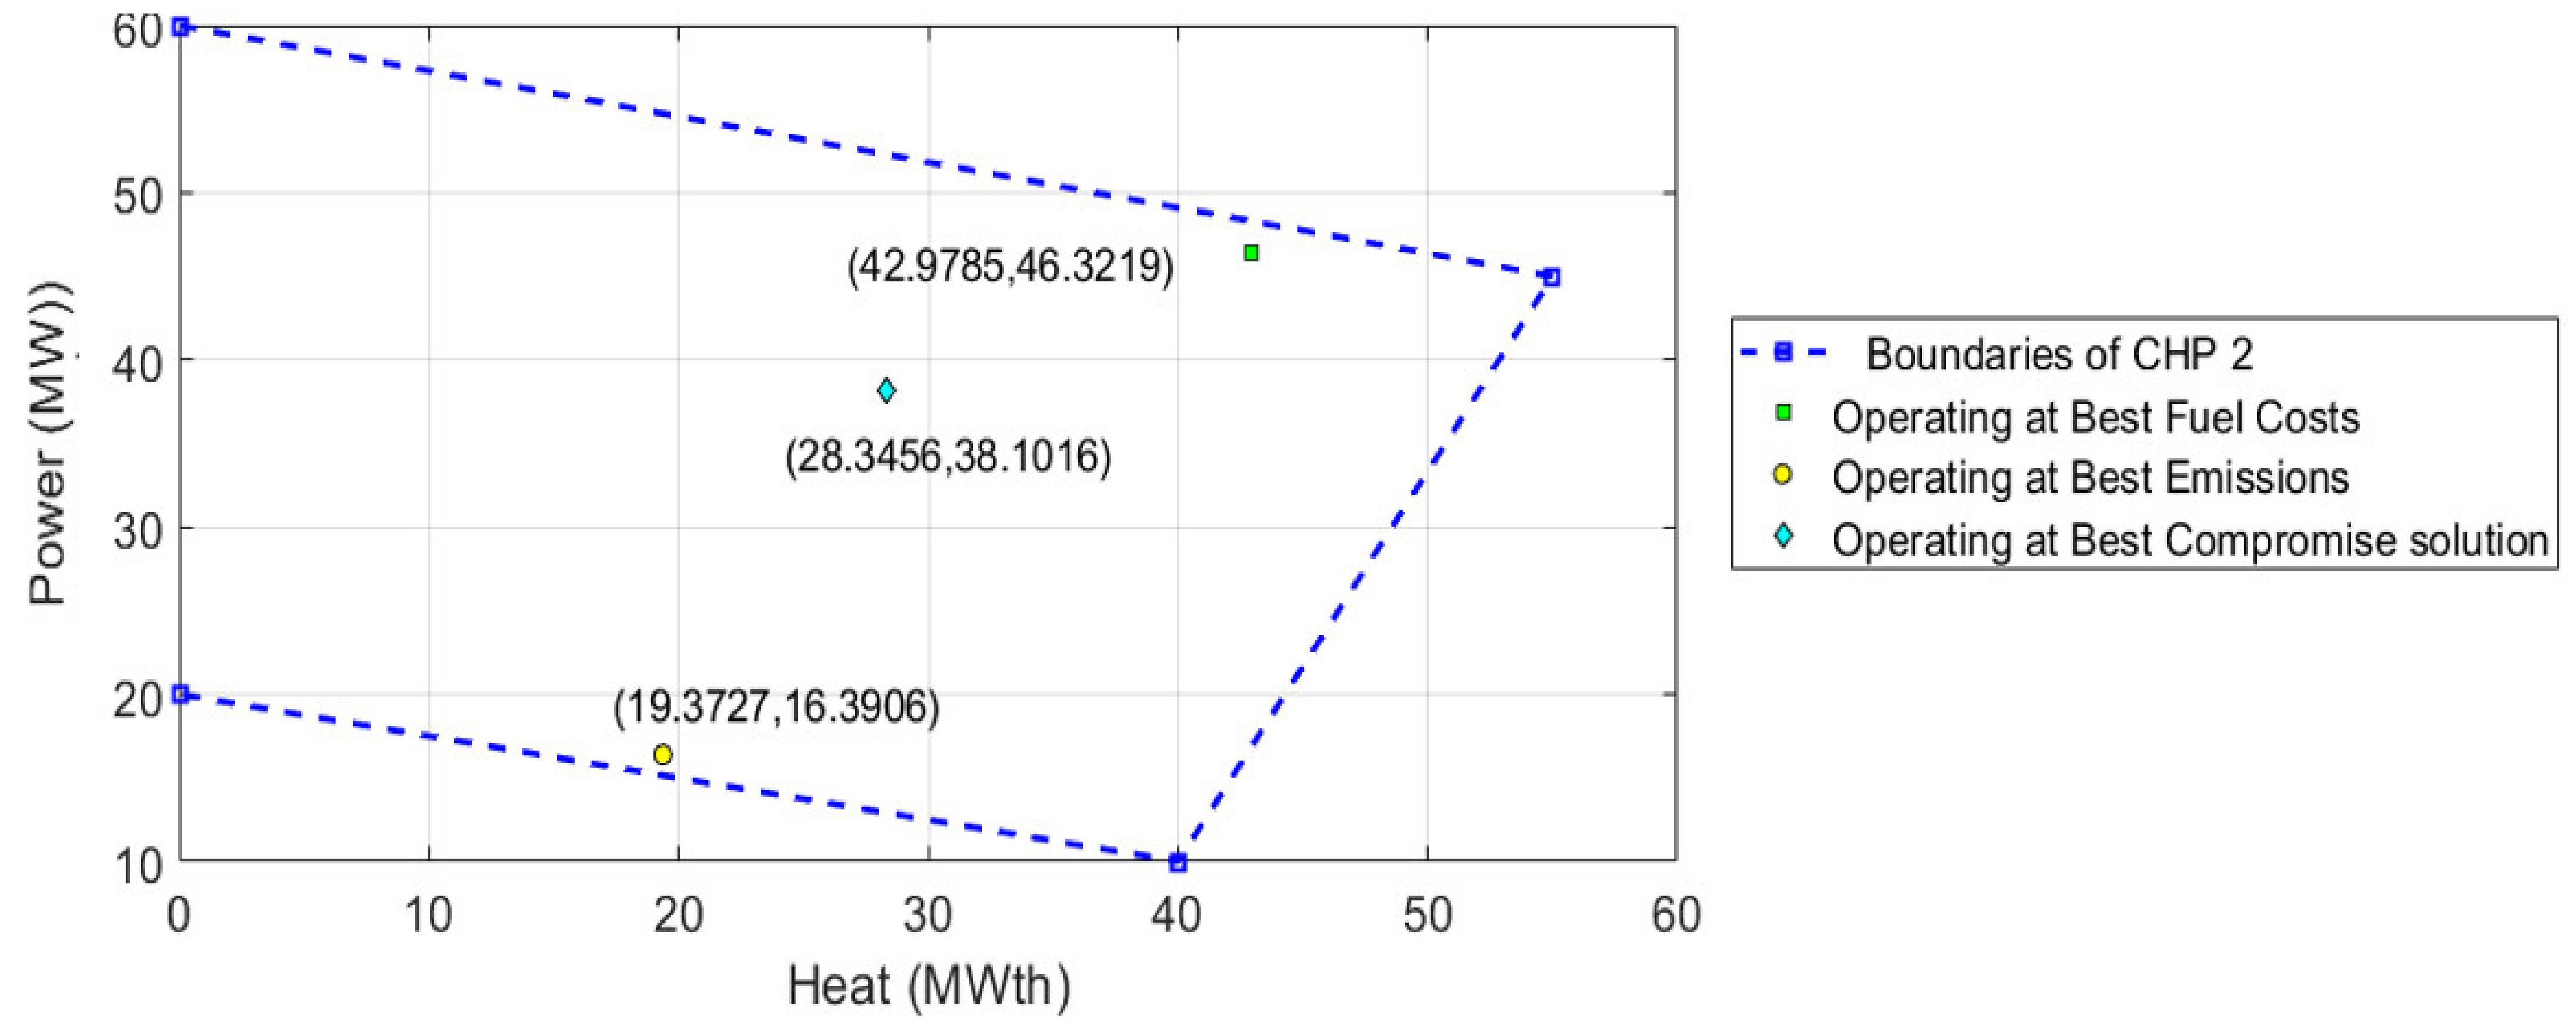
From Figure 4, the best compromise solution is extracted using the fuzzy technique and the corresponding operating point is tabulated in Table 3. As shown, the best compromise fuel costs and emissions using the proposed MTLSBA are USD 14,909.27/h and 5.891332 kg/h, respectively. Compared to the NSGA-II and SPEA 2 [48], the proposed MTLSBA dominates their obtained results, where NSGA-II [48] obtains compromise fuel costs and emissions of USD 15,008.7/h and 6.0563 kg/h, respectively, while SPEA 2 [48] obtains compromise fuel costs and emissions of USD 14,964.3/h and 6.3667 kg/h, respectively. Additionally, the operating points of CHP 1 and 2 are depicted in Figure 7 and Figure 8, provided by the proposed MTLSBA, ensuring their feasibility of the limits for the extreme points and the best compromise solution. As shown, all colored points are inside the permissible area.

Table 3.
Best compromise results of test system 1 using the proposed MTLSBA.
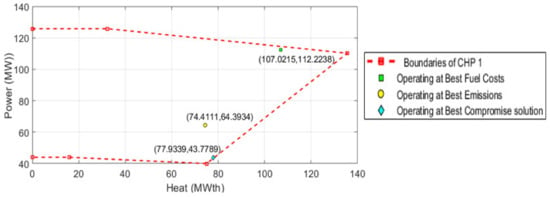
Figure 7.
CHP 1 operating point versus its boundaries.
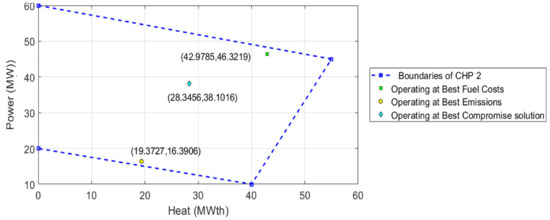
Figure 8.
CHP 2 operating point versus its boundaries.
From Table 3, the outputs of H2 and P4 are high compared to the others related to the best compromise solution. Figure 9 and Figure 10 display the related fuel costs and emission rates of each unit. Despite the higher outputs of H2 and P4, the corresponding emissions of CHP 1 and CHP 3 do not exceed 15% of the total emissions, whereas the main share in minimizing the total emissions is the power-only unit.
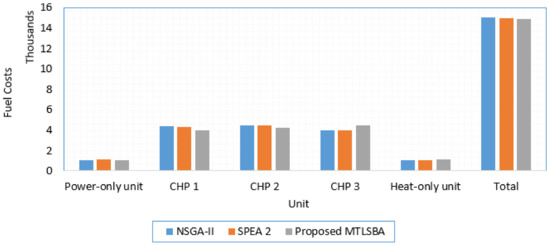
Figure 9.
Fuel costs for each unit related to the best compromise results in Table 3.
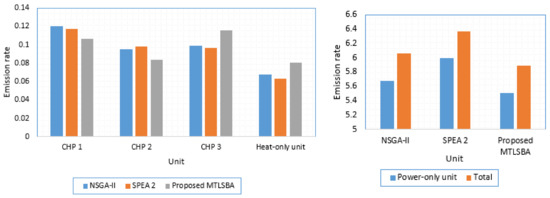
Figure 10.
Emission rates for each unit related to the best compromise results in Table 3.
As seen in Table 3, the proposed MTLSBA finds a non-dominated best compromise solution of fuel costs and emissions compared to NSGA-II and SPEA 2. Based on the fuel costs, the proposed MTLSBA achieves an improvement of 0.6625% and 0.3677% compared to NSGA-II and SPEA 2, respectively. Based on the emissions, the proposed MTLSBA achieves an improvement of 2.723% and 7.4669% compared to NSGA-II and SPEA 2, respectively.
4.2. Application for Test System 2
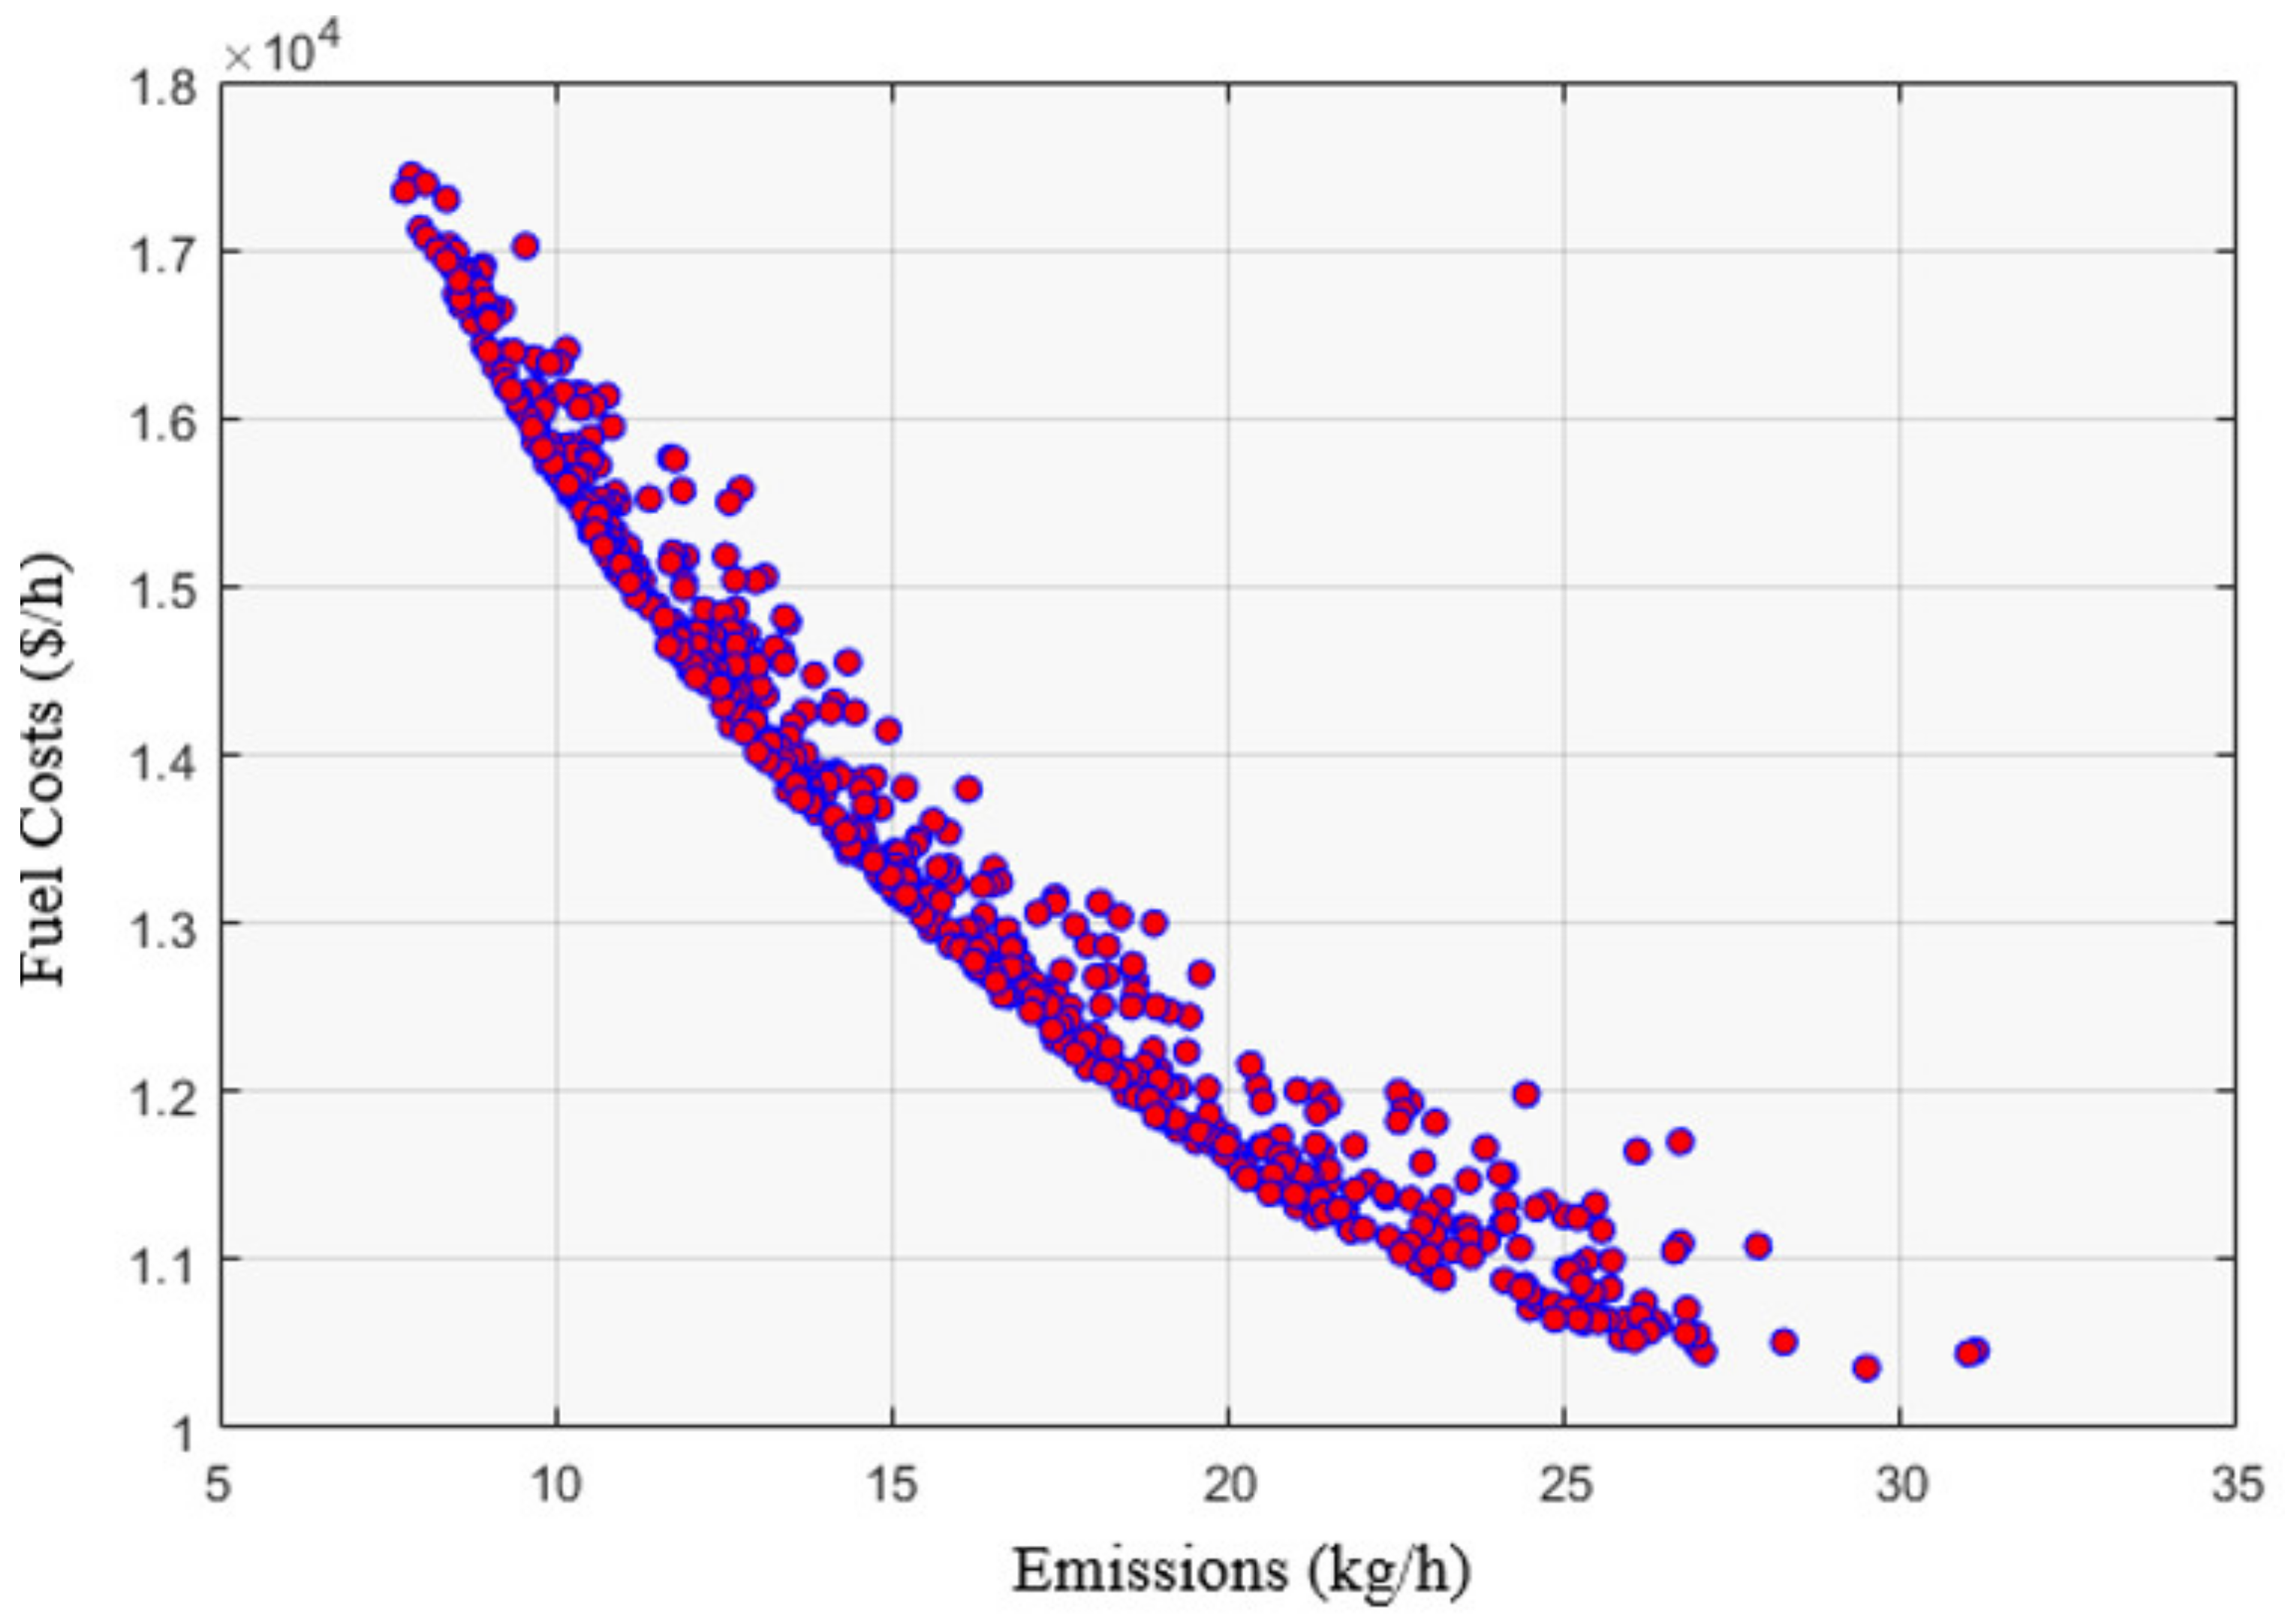
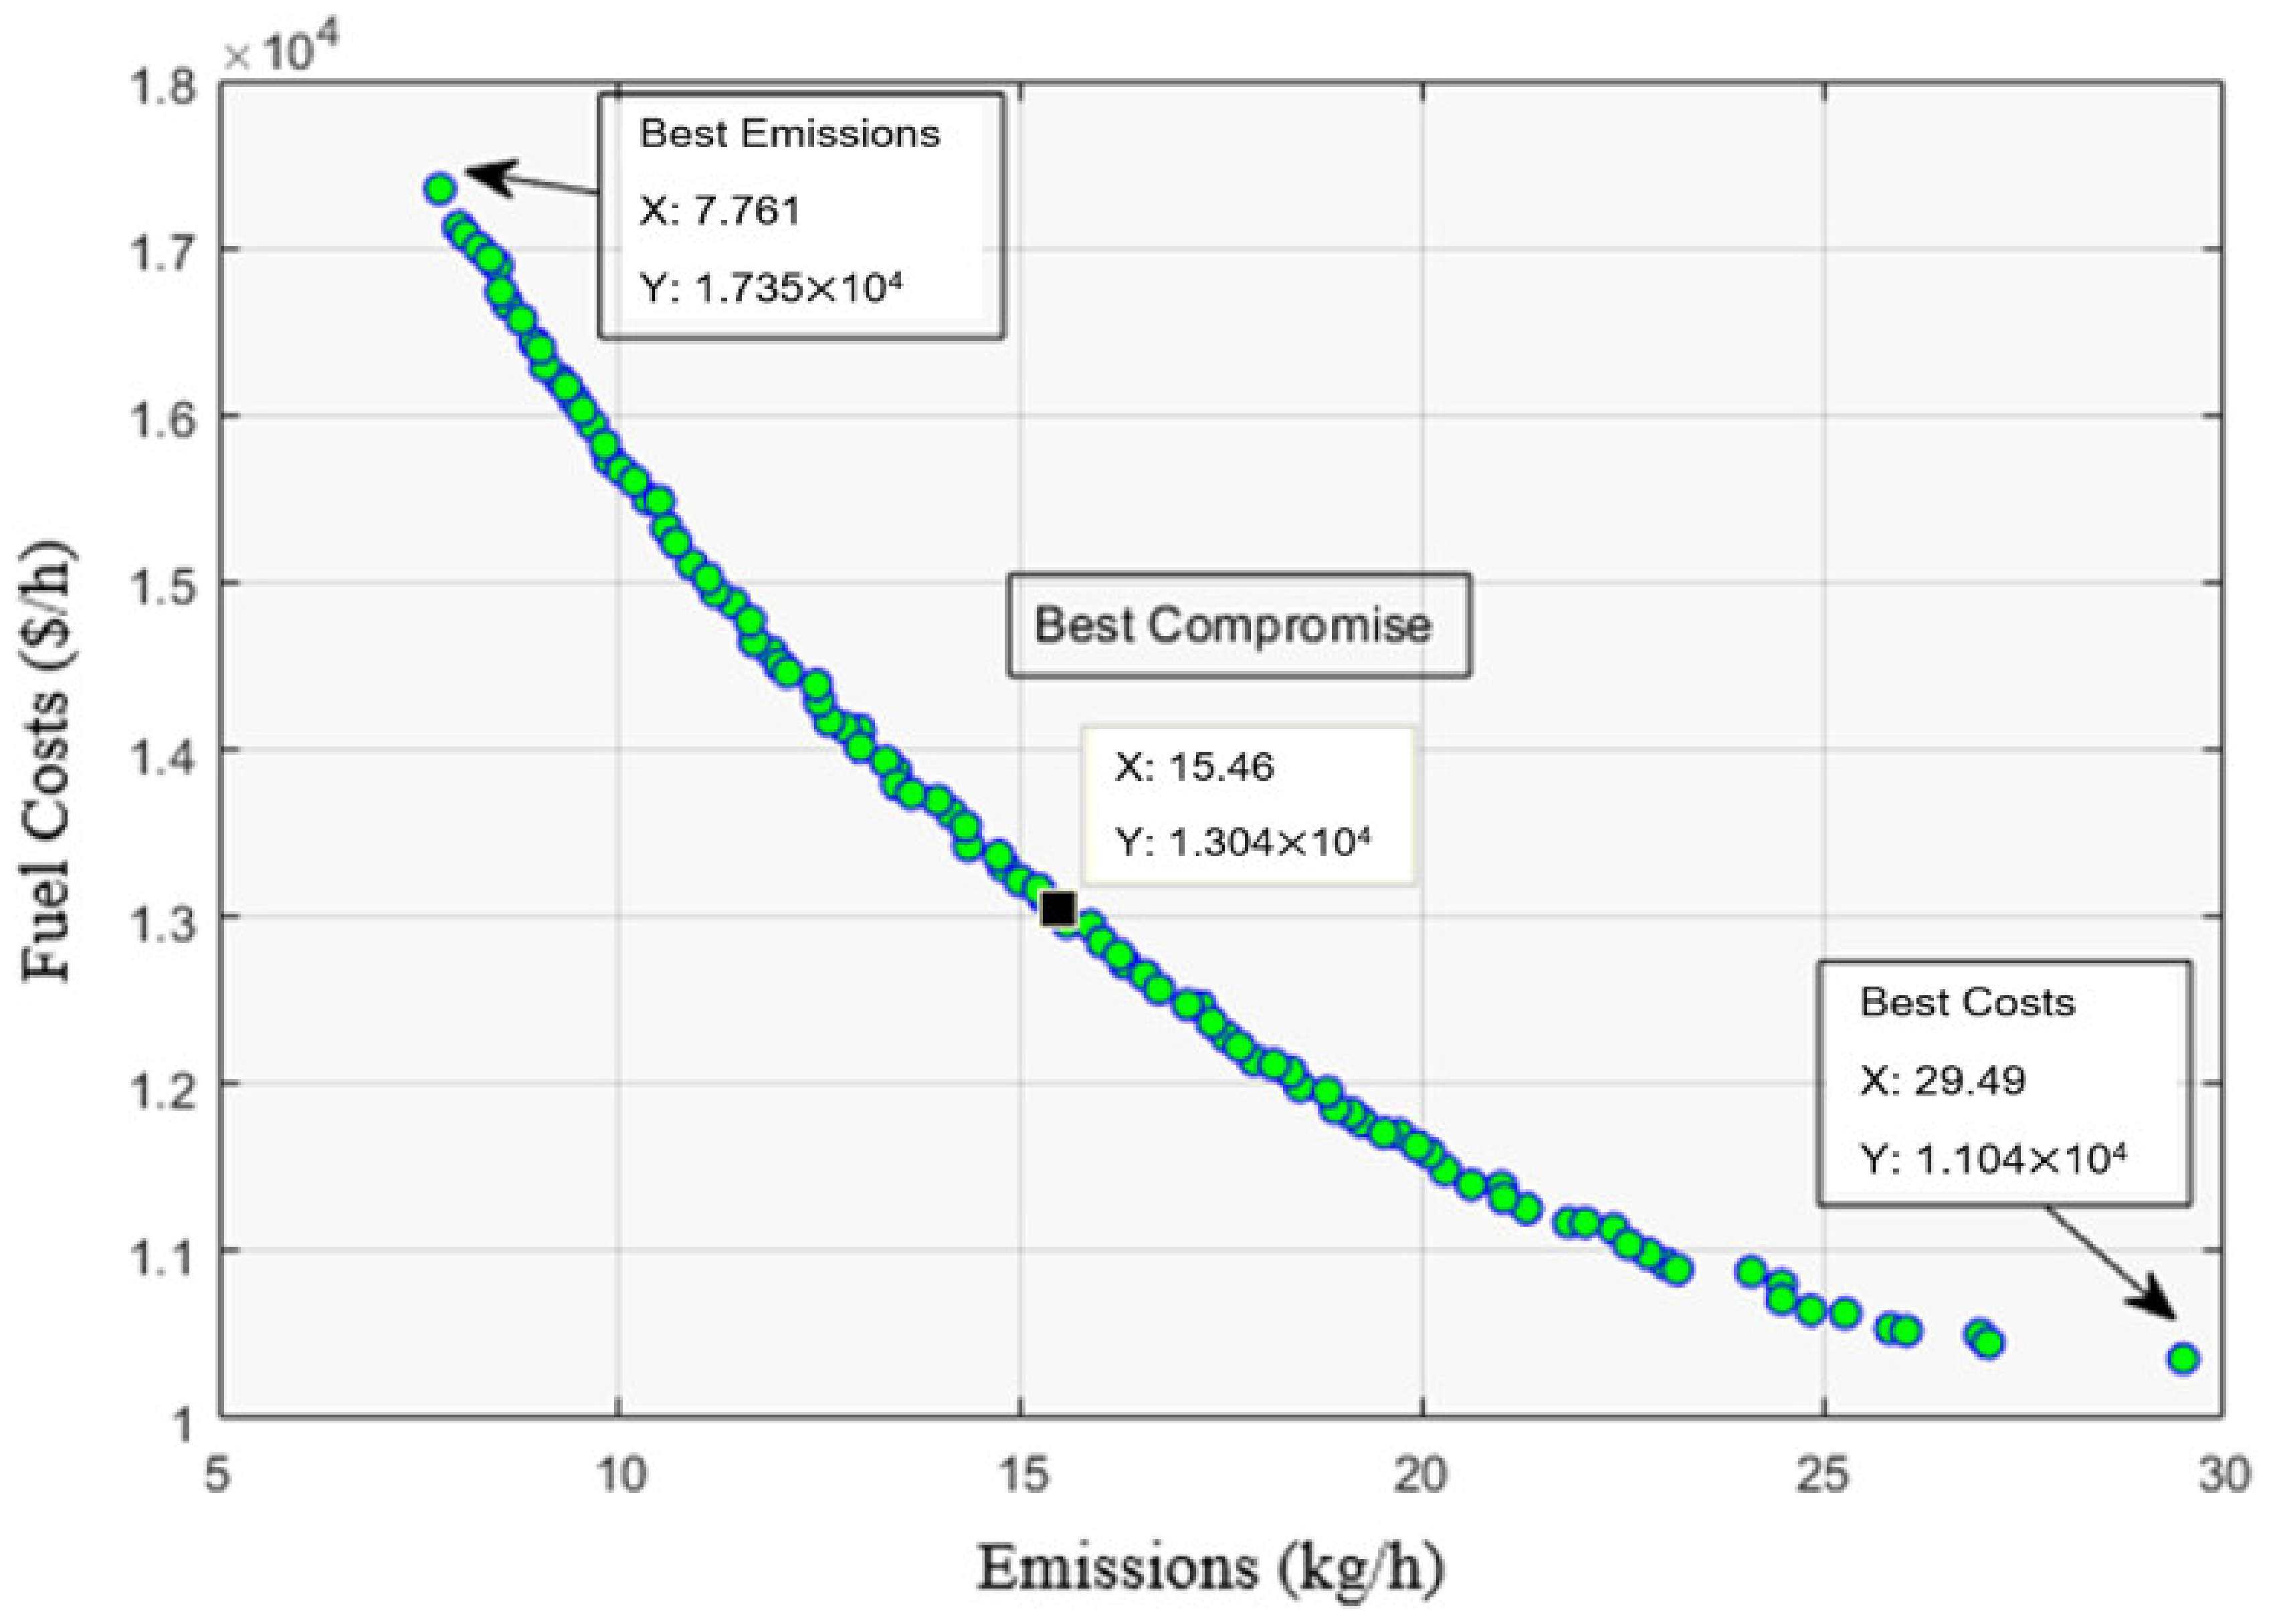
For this system, the proposed MTLSBA is applied for minimizing the targets of costs and emissions as a multi-objective optimization of the CHPEED problem. Figure 11 describes the development of the Pareto set over the course of iterations for the optimal operation of the CHPEED problem, while Figure 12 illustrates the final Pareto set solutions.
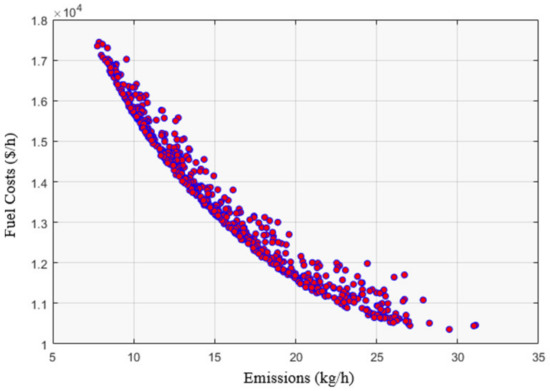
Figure 11.
Development of Pareto set over the course of iterations with the MTLSBA for the CHPEED problem.
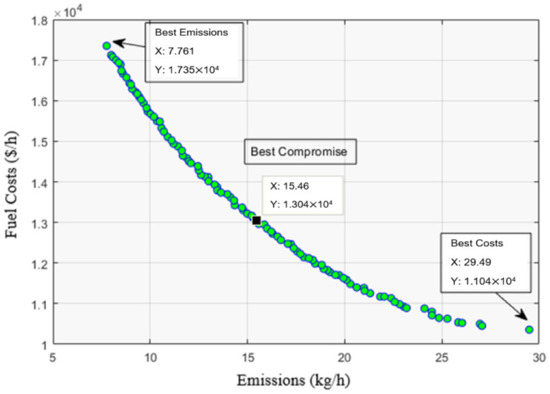
Figure 12.
Final Pareto set with the proposed MTLSBA for the CHPEED problem.
Table 4 describes the results related to the best fuel costs and emissions of the design variables using the proposed MTLSBA. From Table 4, the outputs of P2, P5 and H7 are high compared to the others related to the best compromise solution, since they present lower individual costs and emission rates compared to the other units. Based on the proposed MTLSBA, the fuel costs and emission goals are each reduced independently, as illustrated. Fuel expenditures are USD 10,358.18/h and emissions are 29.4863 kg/h, according to the cost minimization criterion. However, in the event of emission minimization, the cost rises to USD 17,349.57023/h and the emissions fall to 7.760708 kg/h. Compared to the RCGA [48], the proposed MTLSBA provides a reduction of 3.3% for minimizing the costs. In addition, the proposed MTLSBA provides a higher reduction of 53.88% for minimizing the emissions. From Figure 12, the best compromise solution is extracted using the fuzzy technique and the corresponding operating point is tabulated in Table 5.

Table 4.
Results of best fuel costs and emissions of test system 2 using the proposed MTLSBA.

Table 5.
Best Compromise results of test system 2 using the proposed MTLSBA.
As shown, the best compromise fuel costs and emissions using the proposed MTLSBA are USD 13,040/h and 15.4553988 kg/h, respectively. Compared to the NSGA-II and SPEA 2 [48], the proposed MTLSBA dominates their obtained results, where NSGA-II [48] obtains compromise fuel costs and emissions of USD 13,433.19/h and 25.8262 kg/h, respectively, while SPEA 2 [48] obtains compromise fuel costs and emissions of USD 13,448.95/h and 25.78 kg/h, respectively.
As seen in Table 5, the proposed MTLSBA finds a non-dominated best compromise solution of fuel costs and emissions compared to NSGA-II and SPEA 2. Based on the fuel costs, the proposed MTLSBA achieves an improvement of 2.927% and 3.041% compared to NSGA-II and SPEA 2, respectively. Based on the emissions, the proposed MTLSBA achieves an improvement of 40.156% and 40.050% compared to NSGA-II and SPEA 2, respectively.
4.3. Application for Test System 3
4.3.1. Proposed TLSBA versus Standard TLBA
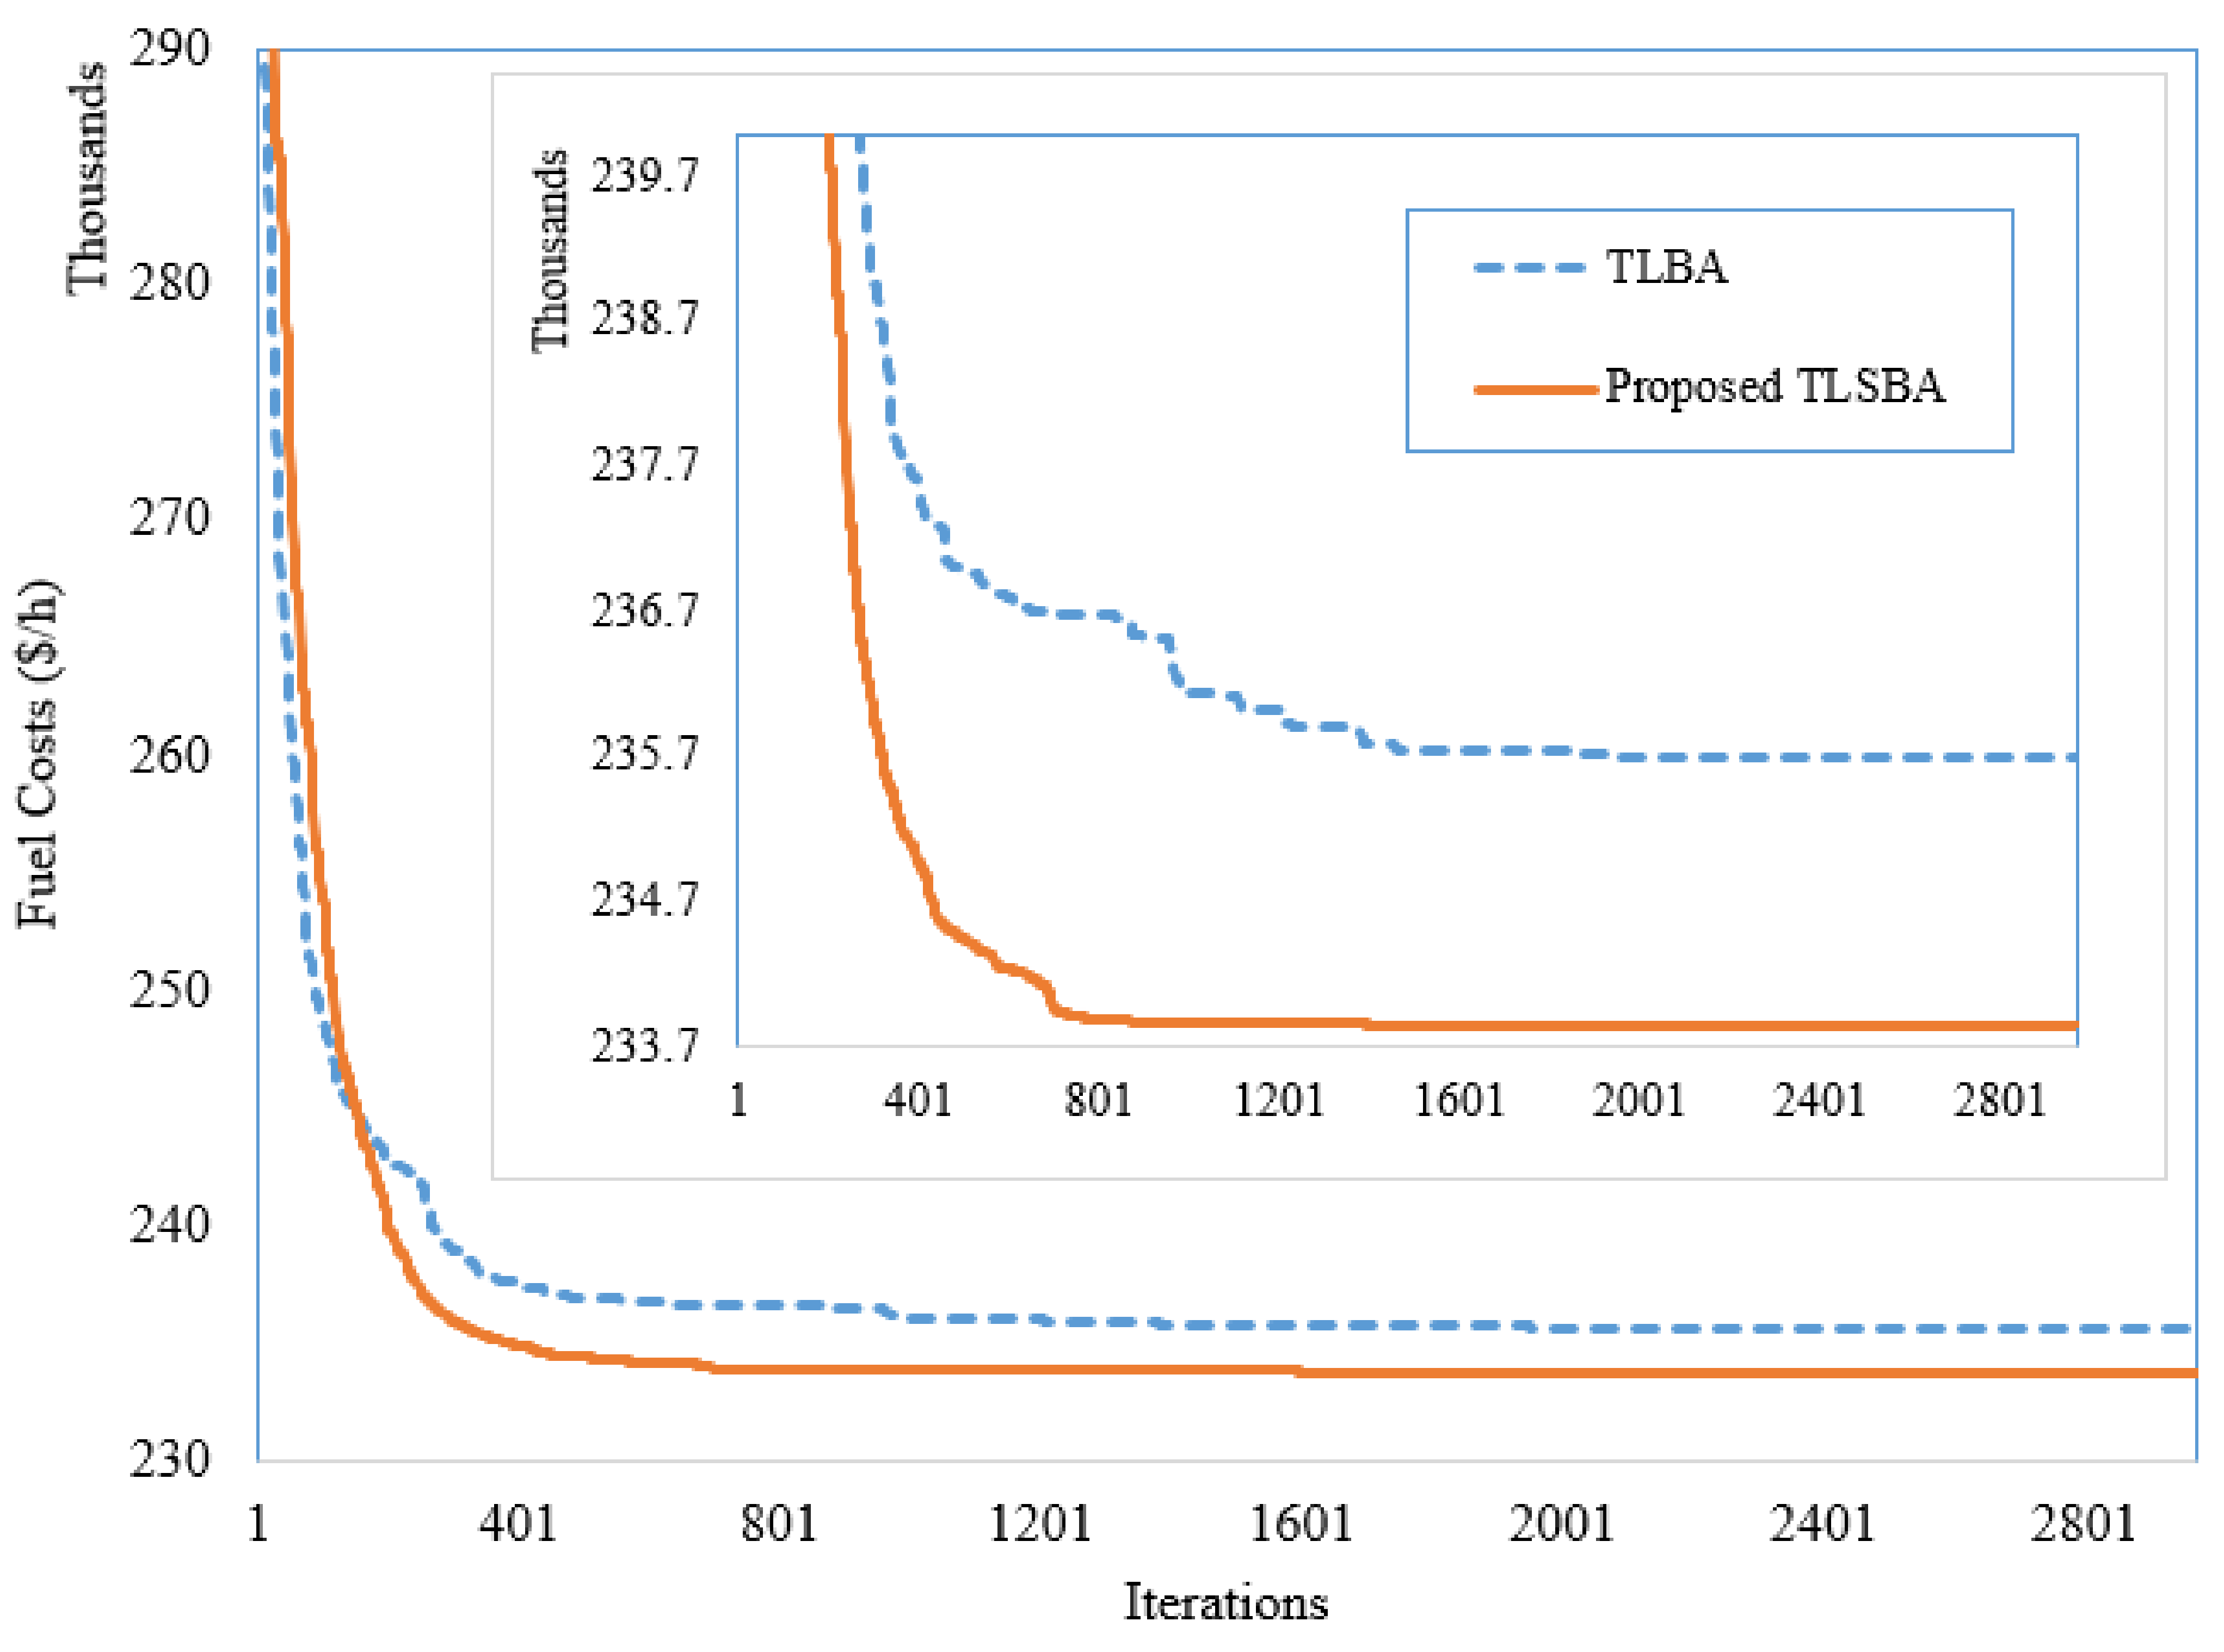
For this system, the proposed TLSBA and the standard TLBA are applied for minimizing the fuel costs as a single objective optimization problem. Table 6 summarizes the system’s design variables using both the proposed TLSBA and the standard TLBA. As shown, lower fuel costs in the CHPED system of USD 233,838.8/h are obtained compared to USD 235,697/h by the standard TLBA. Added to that, the convergence rates of conventional TLBA and the proposed TLSBA for this system are demonstrated in Figure 13.

Table 6.
Results of the 96-unit CHPED system from conventional TLBA and proposed TLSBA.
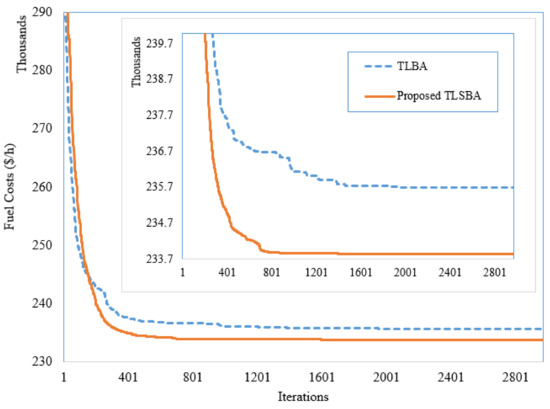
Figure 13.
Convergence rates of the TLBA and the proposed TLSBA for test system 3.
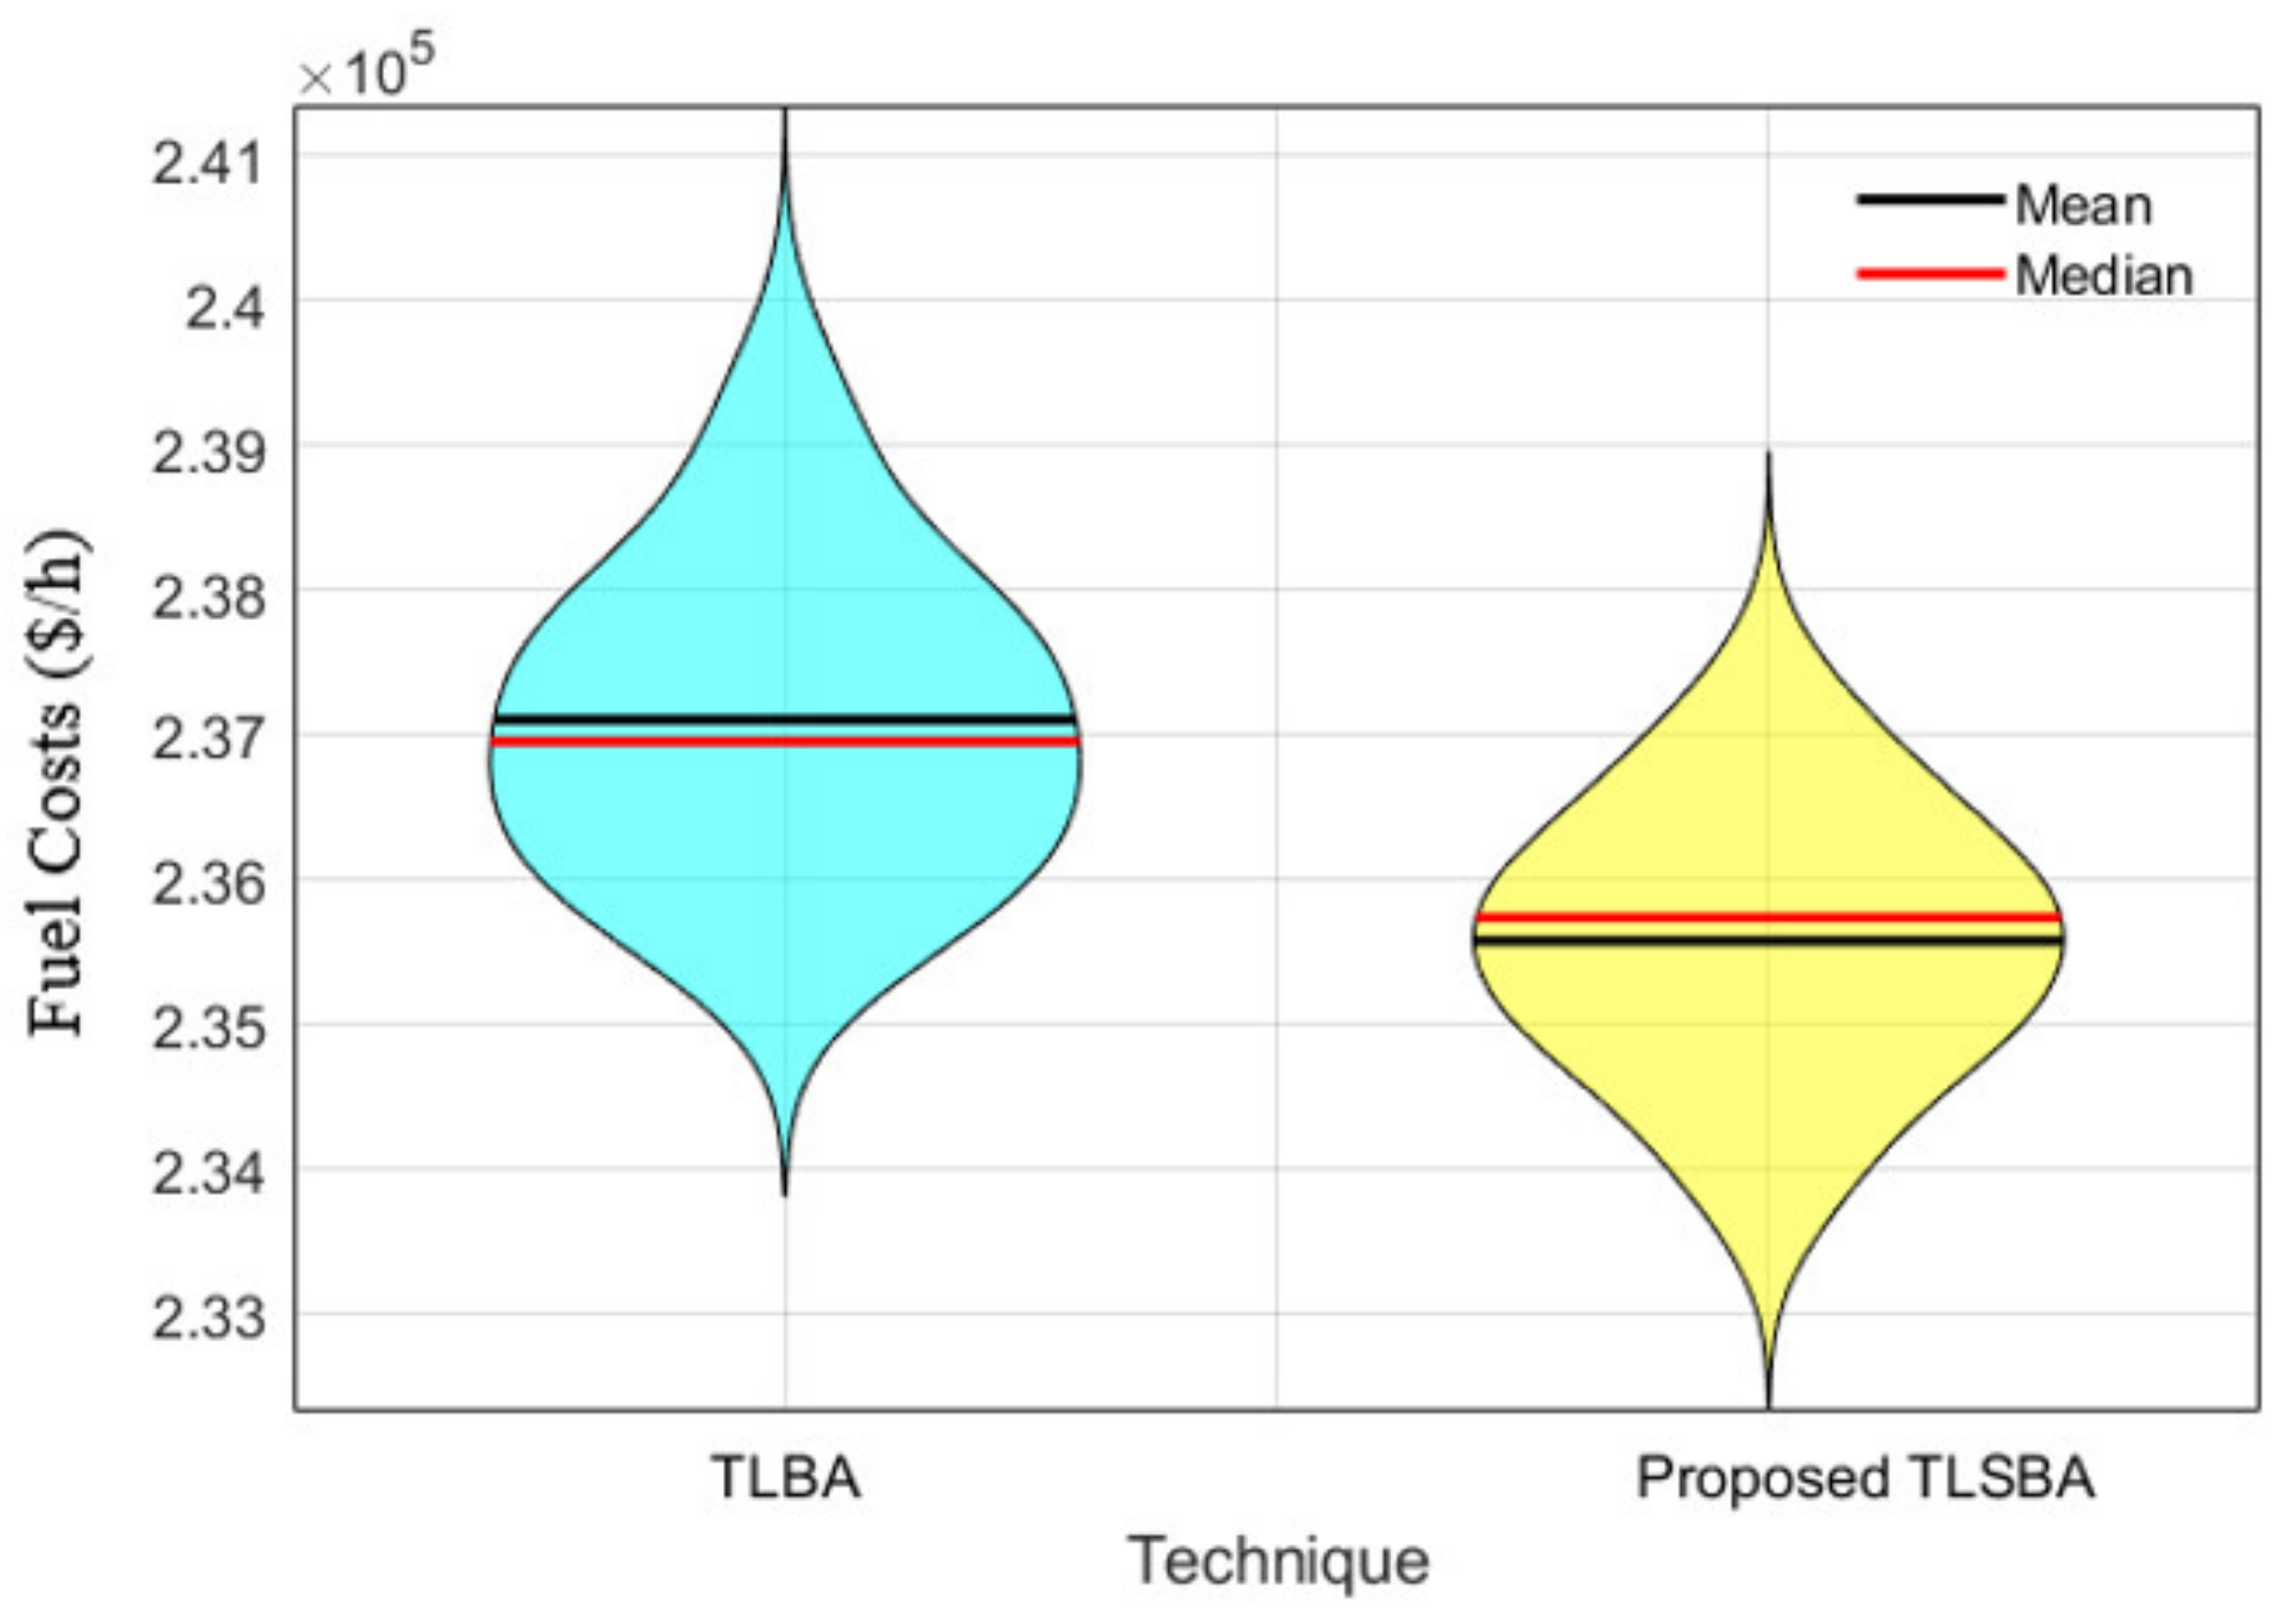
In addition, Figure 14 shows the violin plot for the TLBA and TLSBA with 30 different running periods. As shown, the suggested TLSBA achieves the least minimum, mean, maximum and standard deviation of USD 233,838.8, 235,628.7686, 237,431.351 and 860.8502762/h, respectively. On the other hand, the TLBA achieves minimum, mean, maximum and standard deviation of USD 235,697, 237,146.68, 239,432.7871 and 1014.716949/h, respectively. In this comparison, the suggested TLSBA outperforms the standard TLBA version in terms of performance and stability.
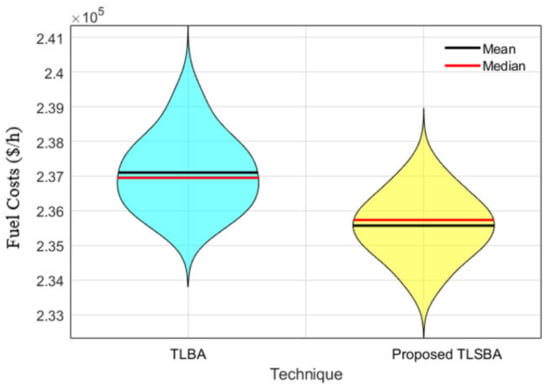
Figure 14.
Violin plot obtained by TLBA and TLSBA for test system 3.
4.3.2. Proposed TLSBA versus Several New Algorithms
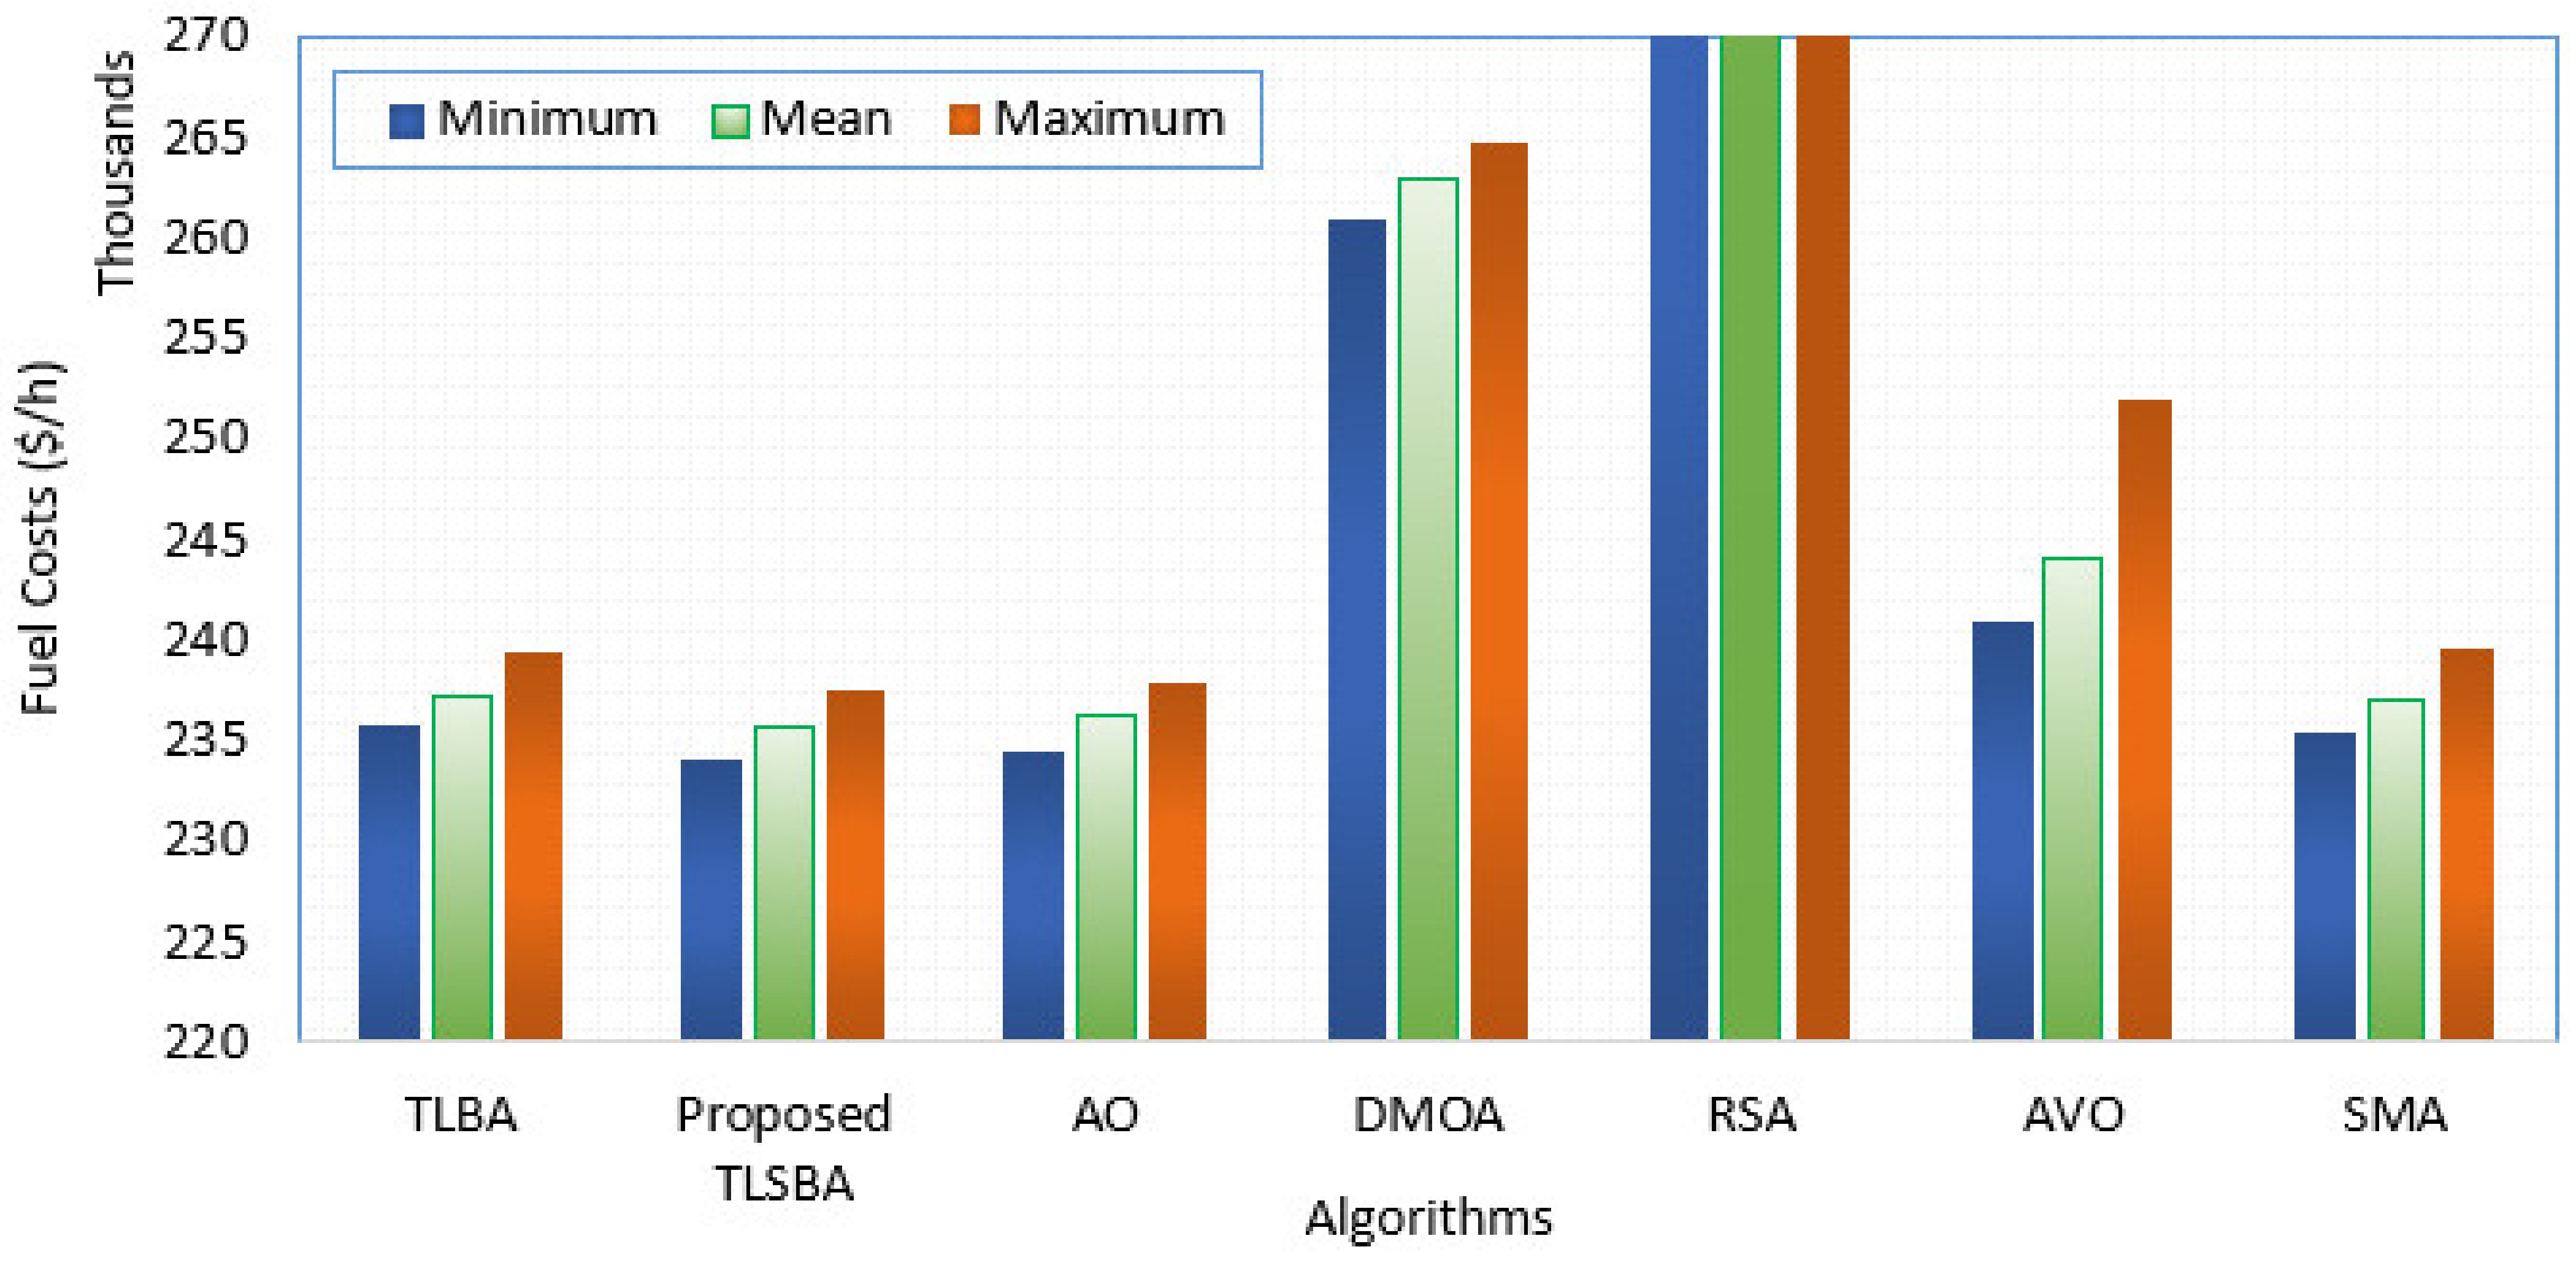
Several new algorithms are implemented, such as the aquila optimizer (AO) [50], reptile search algorithm (RSA) [51], dwarf mongoose optimization algorithm (DMOA) [52], African vultures optimization (AVO) [53] and slim mould algorithm (SMA) [54]. For fair comparisons, similar circumstances are followed for all applied methods—in particular, the same number of function evaluations, population size and maximum number of iterations of 300,000, 100 and 3000. Otherwise, the same boundaries of the power-only units, CHP units and heat-only units are maintained for all compared methods. Figure 15 represents a bar chart describing the minimum, mean and maximum obtained fitness using the compared techniques. This comparison illustrates the significant superiority of the proposed TLSBA, not only against the standard TLBA, but also over several new algorithms (AO, RSA, DMOA, AVO and SMA). The proposed TLSBA demonstrates the highest ability to find the least minimum, mean and maximum fitness of USD 233,838.8157, 235,628.7686 and 237,431.351/h, respectively.
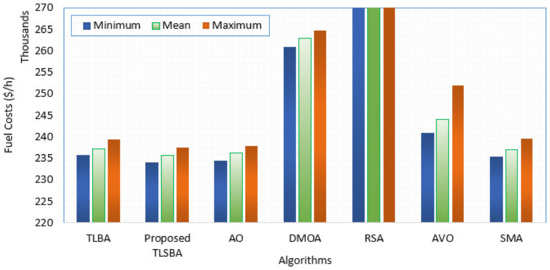
Figure 15.
Minimum, mean and maximum obtained fitness by the compared techniques for test system 3.
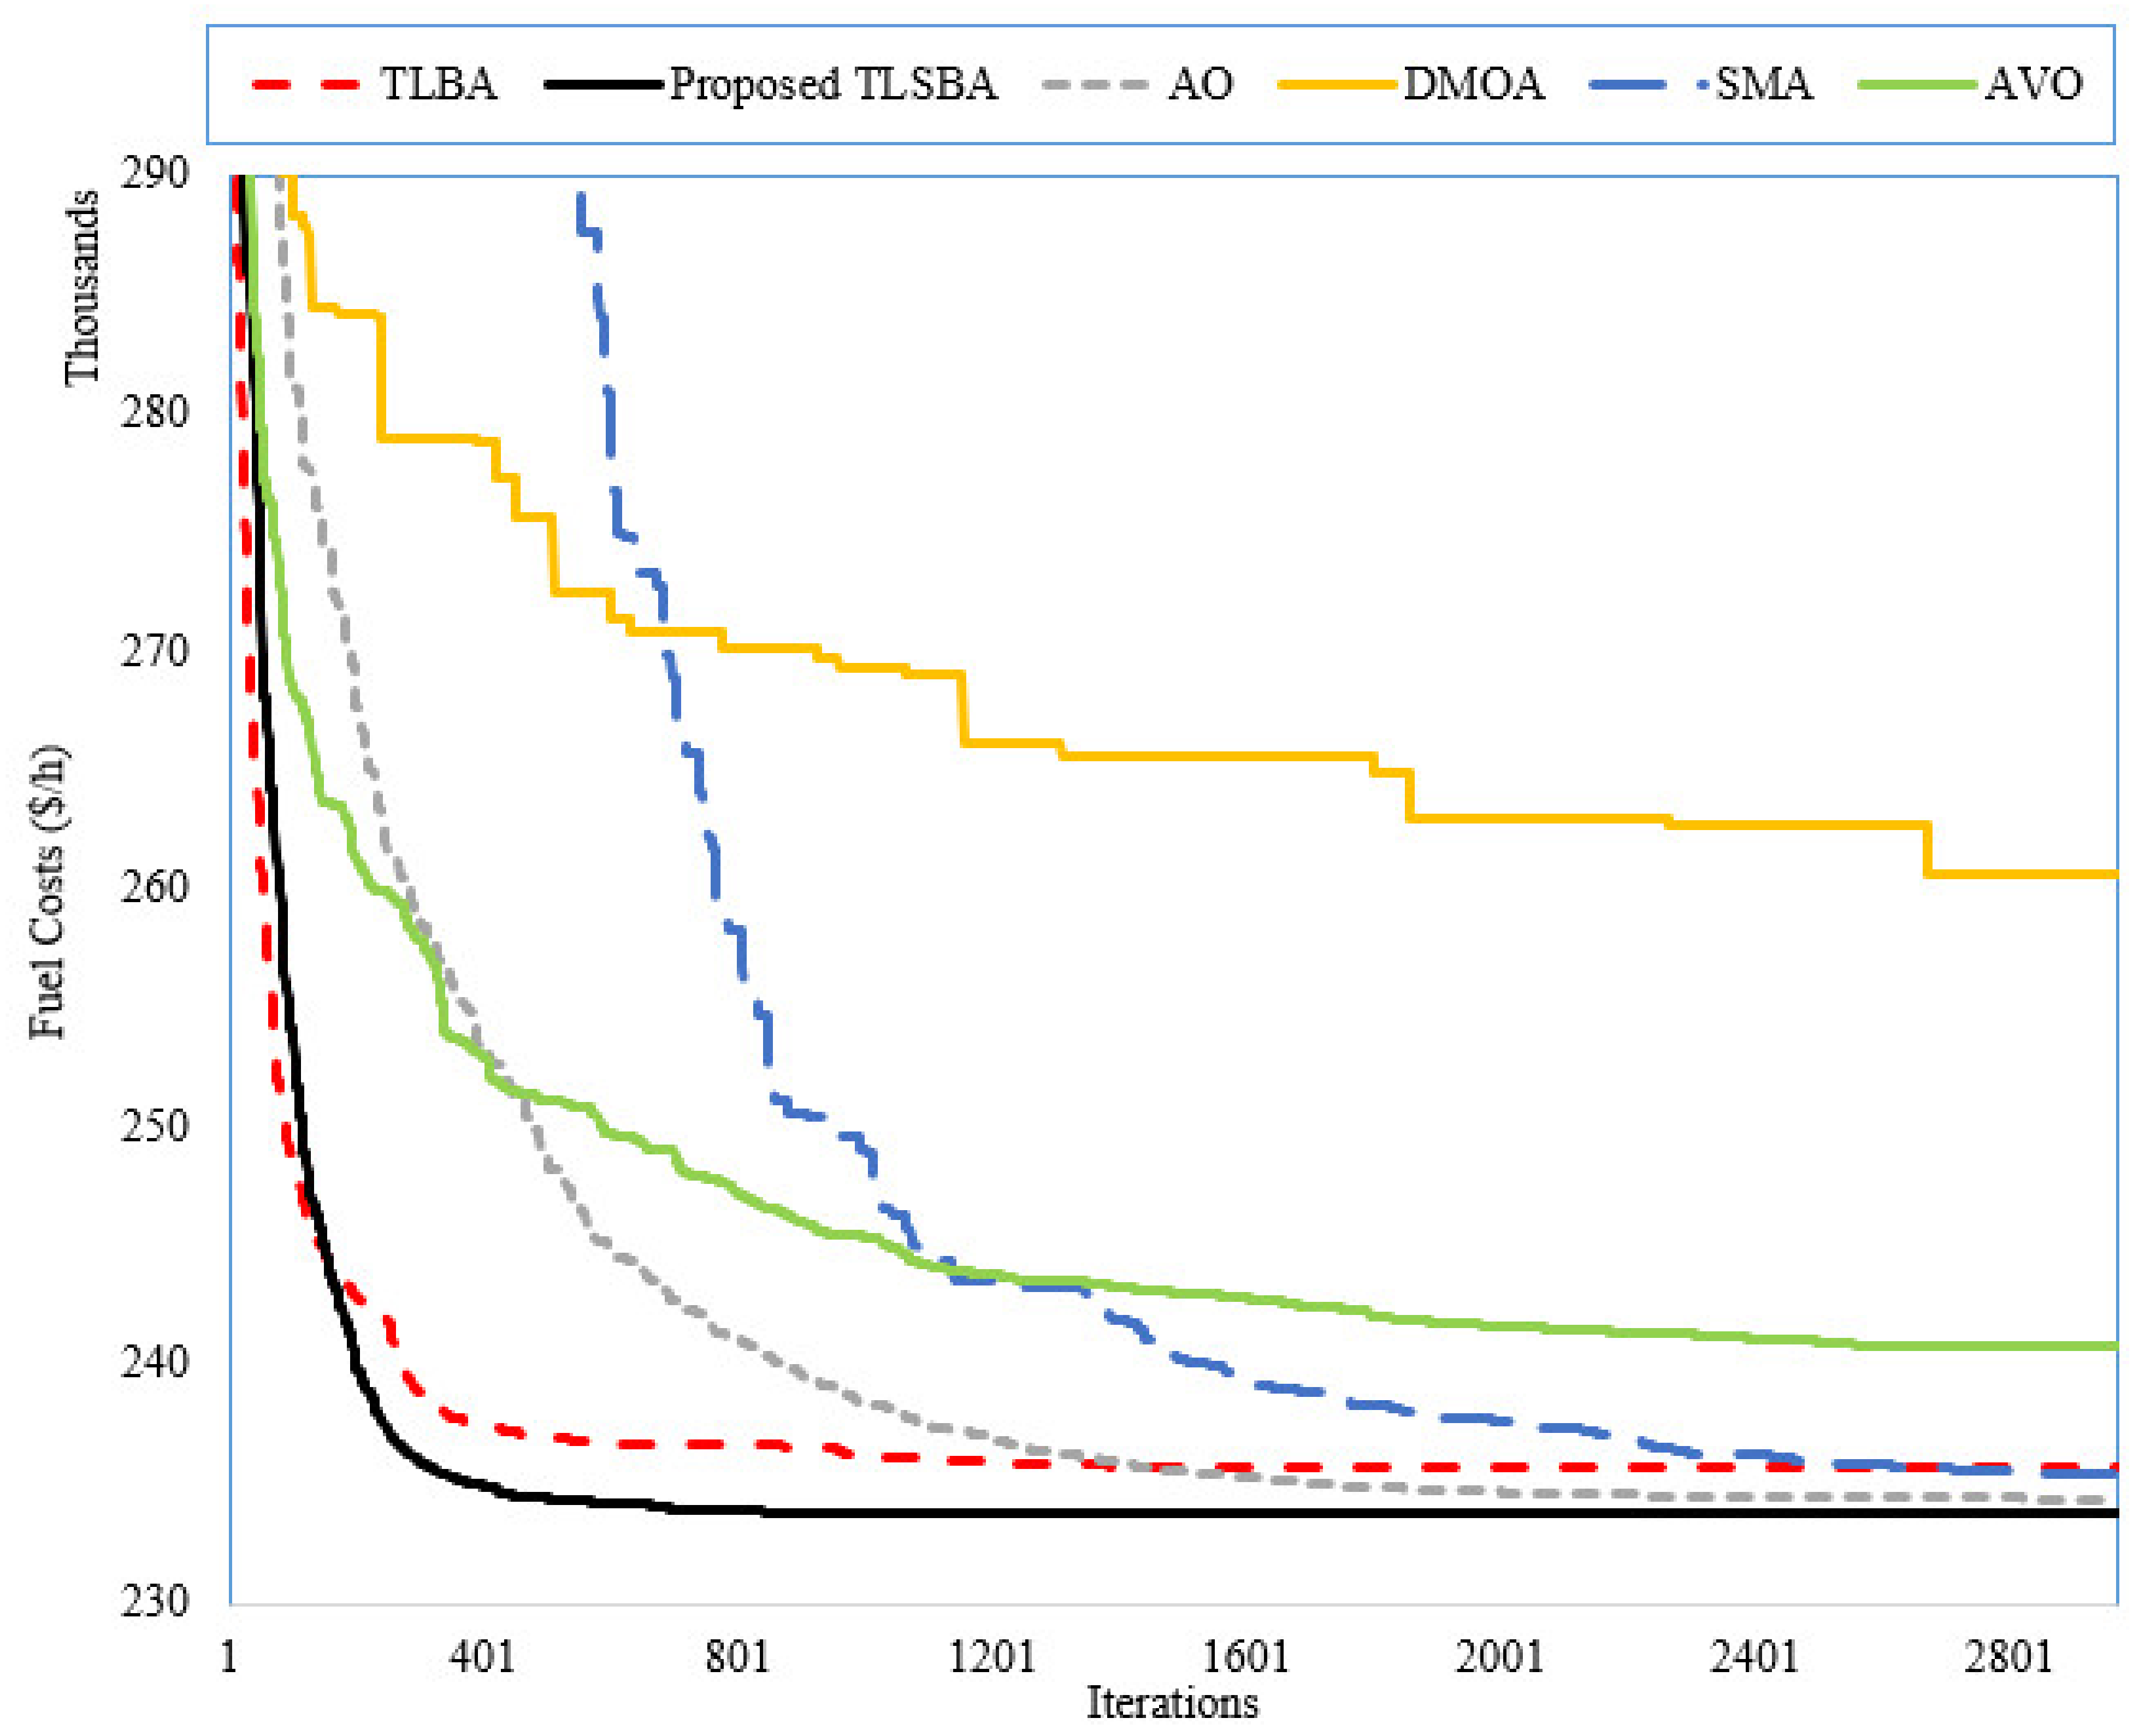
Figure 16 shows the convergence rates of the compared techniques for this system. In this figure, the suggested TLSBA provides higher speed in reaching the most stable zone compared to the others.
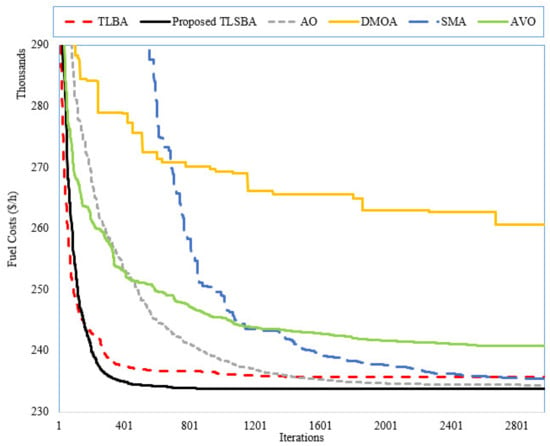
Figure 16.
Convergence rates of the compared algorithms for test system 3.
4.3.3. Friedman Ranking Test for Test System 3
In this subsection, a Friedman ranking test of the minimum, mean, maximum and standard deviation achieved is performed for this system for the proposed TLSBA, TLBA, AO, DMOA, RSA, AVO and SMA, as depicted in Table 7. As shown, the significant enhancement of the proposed TLSBA is achieved by acquiring the first rank in the four indices and their aggregation. The AO is ranked in second place, while SMA, TLBA, DMOA, AVO and RSA come in sequentially.

Table 7.
Friedman ranking test of the compared algorithms for test system 3.
4.3.4. ANOVA Test for Test System 3
The ANOVA test is also used, and each technique has a statistical distribution depending on the end results of its separate computations. Table 8 describes the relevant results using Friedman’s ANOVA Spreadsheet. As shown, the null hypothesis is constantly disproved, and the possibility of a p-value is consistently very small at 5.37112 × 10−67.

Table 8.
ANOVA testing for test system 3.
4.3.5. Proposed TLSBA versus Previous Reported Outcomes
Table 9 contrasts the proposed TLSBA’s results with those of other contemporary optimization schemes such as MRFO [42], IMPA [23], WOA [49], HT [19], WVO [55], WVO-PSO [55], PSO-TVAC [56] and HT-JFSO [25,57], with the optimal generation cost adopting the suggested approach. This table shows that the proposed TLSBA has the lowest cost and achieves the highest performance among the various optimizers. This comparison validates the suggested TLSBA’s efficacy and superiority. As a result, the suggested TLSBA outperforms the traditional TLBA and other optimizers in terms of robustness.

Table 9.
Comparison of TLSBA, TLBA and reported techniques for test system 3.
5. Conclusions
A multi-objective teaching–learning studying-based algorithm (MTLSBA) is proposed for solving the Combined Heat and Power Economic Environmental Dispatch problem. The proposed TLSBA is updated by incorporating an extra Pareto archive to preserve the non-dominated solutions. An iterative dynamic adaptation of the fitness feature is employed by varying the fitness function form. Furthermore, a fuzzy decision-making technique is activated to finally pick the best compromise solution of the CHPEED for the large-scale dispatch of combined electrical power and heat energies. The proposed MTLSBA is applied to three test systems and compared with other algorithms reported in the literature. The suggested MTLSBA outperforms the others in terms of effectiveness and robustness indices, according to the numerical data. In comparison to the original TLBA, the TLSBA provides greater quality for the ultimate optimum solution, and more power to escape from convergence to local optima. Additionally, the proposed TLSBA shows higher superiority compared to several new algorithms, such as the aquila optimizer (AO), reptile search algorithm (RSA), dwarf mongoose optimization algorithm (DMOA), African vultures optimization (AVO) and slim mould algorithm (SMA). It also reaches the most stable zone more quickly than the others. Moreover, a Friedman ranking test derives the significant enhancement for the proposed TLSBA by acquiring the first rank compared to AO, DMOA, RSA, AVO and SMA. The simulation results show that the proposed TLSBA has the lowest cost and achieves the highest performance among the various optimizers. This comparison validates the suggested TLSBA’s efficacy and superiority. As a result, the suggested TLSBA outperforms the traditional TLBA and other optimizers in terms of robustness.
Future Work and Limitations
Given the great effectiveness of the proposed TLSBA in the preceding tests, it is recommended that the proposed approach be examined for adequacy in future attempts to tackle the OPF issue with the increased penetration of renewable energies. With the use of contemporary voltage source converters, it may also be constructed for AC–DC electrical networks. The limitations of the approach used in this study, similar to the other optimization algorithms, are determined by the parameter values and their high computational burden for large-scale nonlinear problems. Interestingly, the presented TLSBA is an adaptive method with only two specified parameters, which are the number of iterations and the size of the population.
Author Contributions
Conceptualization, S.S., R.E.-S. and A.S.; methodology, A.S.; software, A.S.; validation, R.E.-S. and M.G.; formal analysis, A.S. and R.E.-S.; investigation, A.S. and M.G.; resources, M.G. and R.E.-S.; data curation, S.S.; writing—original draft preparation, S.S. and A.S.; writing—review and editing, R.E.-S.; visualization, M.G.; supervision, R.E.-S. All authors have read and agreed to the published version of the manuscript.
Funding
This research received no external funding.
Institutional Review Board Statement
Not applicable.
Informed Consent Statement
Not applicable.
Data Availability Statement
Not applicable.
Conflicts of Interest
The authors declare no conflict of interest.
References
- Knypiński, Ł. Performance analysis of selected metaheuristic optimization algorithms applied in the solution of an unconstrained task. COMPEL-Int. J. Comput. Math. Electr. Electron. Eng. 2021. [Google Scholar] [CrossRef]
- Daqaq, F.; Kamel, S.; Ouassaid, M.; Ellaia, R.; Agwa, A.M.; Sa, A.M.A. Non-Dominated Sorting Manta Ray Foraging Optimization for Multi-Objective Optimal Power Flow with Wind/Solar/Small-Hydro Energy Sources. Fractal Fract. 2022, 6, 194. [Google Scholar] [CrossRef]
- Elkasem, A.H.A.; Khamies, M.; Hassan, M.H.; Agwa, A.M.; Kamel, S. Optimal Design of TD-TI Controller for LFC Considering Renewables Penetration by an Improved Chaos Game Optimizer. Fractal Fract. 2022, 6, 220. [Google Scholar] [CrossRef]
- Nwulu, N. Combined heat and power dynamic economic emissions dispatch with valve point effects and incentive based demand response programs. Computation 2022, 8, 101. [Google Scholar] [CrossRef]
- Rabiee, A.; Jamadi, M.; Mohammadi-Ivatloo, B.; Ahmadian, A. Optimal non-convex combined heat and power economic dispatch via improved artificial bee colony algorithm. Processes 2020, 8, 1036. [Google Scholar] [CrossRef]
- Zhao, J.; Chen, L.; Wang, Y.; Liu, Q. A review of system modeling, assessment and operational optimization for integrated energy systems. Sci. China Inf. Sci. 2021, 64, 1–23. [Google Scholar] [CrossRef]
- Yu, W.; Li, C.; Yu, X.; Wen, G.; Lü, J. Economic power dispatch in smart grids: A framework for distributed optimization and consensus dynamics. Sci. China Inf. Sci. 2018, 61, 1–16. [Google Scholar] [CrossRef] [Green Version]
- Wang, Y.; Li, B.; Yuan, B. Hybrid of comprehensive learning particle swarm optimization and SQP algorithm for large scale economic load dispatch optimization of power system. Sci. China Ser. F Inf. Sci. 2010, 53, 1566–1573. [Google Scholar] [CrossRef]
- Yan, L.; Qu, B.; Zhu, Y.; Qiao, B.; Suganthan, P.N. Dynamic economic emission dispatch based on multi-objective pigeon-inspired optimization with double disturbance. Sci. China Inf. Sci. 2019, 62, 70210-1. [Google Scholar] [CrossRef] [Green Version]
- Wang, K.; Fu, Z.; Xu, Q.; Chen, D.; Wang, L.; Yu, W. Distributed fixed step-size algorithm for dynamic economic dispatch with power flow limits. Sci. China Inf. Sci. 2021, 64, 1–13. [Google Scholar] [CrossRef]
- Bagherian, M.A.; Mehranzamir, K. A comprehensive review on renewable energy integration for combined heat and power production. Energy Convers. Manag. 2020, 224, 113454. [Google Scholar] [CrossRef]
- Al-Bahrani, L.; Seyedmahmoudian, M.; Horan, B.; Stojcevski, A. Solving the real power limitations in the dynamic economic dispatch of large-scale thermal power units under the effects of valve-point loading and ramp-rate limitations. Sustainability 2021, 13, 1274. [Google Scholar] [CrossRef]
- Li, L.; He, D.; Jin, J.; Yu, B.; Gao, X. Multi-objective load dispatch control of biomass heat and power cogeneration based on economic model predictive control. Energies 2021, 14, 762. [Google Scholar] [CrossRef]
- Jiang, Y.; Wan, C.; Botterud, A.; Shahidehpour, M. Convex Relaxation of Combined Heat and Power Dispatch. IEEE Trans. Power Syst. 2021, 36, 1442–1458. [Google Scholar] [CrossRef]
- Beigvand, S.D.; Abdi, H.; la Scala, M. Combined heat and power economic dispatch problem using gravitational search algorithm. Electr. Power Syst. Res. 2016, 133, 160–172. [Google Scholar] [CrossRef]
- Mehdinejad, M.; Mohammadi-Ivatloo, B.; Dadashzadeh-Bonab, R. Energy production cost minimization in a combined heat and power generation systems using cuckoo optimization algorithm. Energy Effic. 2016, 10, 81–96. [Google Scholar] [CrossRef]
- Zhou, S.; Hu, Z.; Gu, W.; Jiang, M.; Chen, M.; Hong, Q.; Booth, C. Combined heat and power system intelligent economic dispatch: A deep reinforcement learning approach. Int. J. Electr. Power Energy Syst. 2020, 120, 106016. [Google Scholar] [CrossRef]
- Kim, M.J.; Kim, T.S.; Flores, R.J.; Brouwer, J. Neural-network-based optimization for economic dispatch of combined heat and power systems. Appl. Energy 2020, 265, 114785. [Google Scholar] [CrossRef]
- Ginidi, A.R.; Elsayed, A.M.; Shaheen, A.M.; Elattar, E.E.; El-Sehiemy, R.A. A Novel Heap based Optimizer for Scheduling of Large-scale Combined Heat and Power Economic Dispatch. IEEE Access 2021, 9, 83695–83708. [Google Scholar] [CrossRef]
- Ara, A.L.; Shahi, N.M.; Nasir, M. CHP Economic Dispatch Considering Prohibited Zones to Sustainable Energy Using Self-Regulating Particle Swarm Optimization Algorithm. Iran. J. Sci. Technol.-Trans. Electr. Eng. 2020, 44, 1147–1164. [Google Scholar] [CrossRef]
- Mellal, M.A.; Williams, E.J. Cuckoo optimization algorithm with penalty function and binary approach for combined heat and power economic dispatch problem. Energy Rep. 2020, 6, 2720–2723. [Google Scholar] [CrossRef]
- Zou, D.; Gong, D. Differential evolution based on migrating variables for the combined heat and power dynamic economic dispatch. Energy 2022, 238, 121664. [Google Scholar] [CrossRef]
- Shaheen, A.M.; Elsayed, A.M.; Ginidi, A.R.; L-Sehiemy, R.A.E.; Alharthi, M.M.; Ghoneim, S.S.M. A novel improved marine predators algorithm for combined heat and power economic dispatch problem. Alex. Eng. J. 2021, 61, 1834–1851. [Google Scholar] [CrossRef]
- Nazari-Heris, M.; Mohammadi-Ivatloo, B.; Gharehpetian, G.B. A comprehensive review of heuristic optimization algorithms for optimal combined heat and power dispatch from economic and environmental perspectives. Renew. Sustain. Energy Rev. 2018, 81, 2128–2143. [Google Scholar] [CrossRef]
- Shaheen, A.M.; El-Sehiemy, R.A.; Elattar, E.; Ginidi, A.R. An Amalgamated Heap and Jellyfish Optimizer for economic dispatch in Combined heat and power systems including N-1 Unit outages. Energy 2022, 246, 123351. [Google Scholar] [CrossRef]
- Rao, R.V.; Savsani, V.J.; Vakharia, D.P. Teaching-Learning-Based Optimization: An optimization method for continuous non-linear large scale problems. Inf. Sci. 2012, 183, 1–15. [Google Scholar] [CrossRef]
- Zou, F.; Chen, D.; Xu, Q. A survey of teaching–learning-based optimization. Neurocomputing 2019, 335, 366–383. [Google Scholar] [CrossRef]
- Xue, R.; Wu, Z. A Survey of Application and Classification on Teaching-Learning-Based Optimization Algorithm. IEEE Access 2022, 8, 1062–1079. [Google Scholar] [CrossRef]
- Alghamdi, A.S. A New Self-Adaptive Teaching-Learning-Based Optimization with Different Distributions for Optimal Reactive Power Control in Power Networks. Energies 2022, 15, 2759. [Google Scholar] [CrossRef]
- Ayalew, M.; Khan, B.; Alaas, Z.M. Optimal Service Restoration Scheme for Radial Distribution Network Using Teaching Learning Based Optimization. Energies 2022, 15, 2505. [Google Scholar] [CrossRef]
- Wu, D.; Jia, H.; Abualigah, L.; Xing, Z.; Zheng, R.; Wang, H.; Altalhi, M. Enhance Teaching-Learning-Based Optimization for Tsallis-Entropy-Based Feature Selection Classification Approach. Processes 2022, 10, 360. [Google Scholar] [CrossRef]
- Jalalzad, S.H.; Yektamoghadam, H.; Haghighi, R.; Dehghani, M.; Nikoofard, A.; Khosravy, M.; Senjyu, T. A Game Theory Approach Using the TLBO Algorithm for Generation Expansion Planning by Applying Carbon Curtailment Policy. Energies 2022, 15, 1172. [Google Scholar] [CrossRef]
- Yang, N.C.; Liu, S.W. Multi-objective teaching–learning-based optimization with pareto front for optimal design of passive power filters. Energies 2021, 14, 6408. [Google Scholar] [CrossRef]
- Safari, M.; de Sousa, R.J.A.; Rabiee, A.H.; Tahmasbi, V. Investigation of dissimilar resistance spot welding process of aisi 304 and aisi 1060 steels with tlbo-anfis and sensitivity analysis. Metals 2021, 11, 1324. [Google Scholar] [CrossRef]
- Elshaboury, N.; Abdelkader, E.M.; Al-Sakkaf, A.; Alfalah, G. Teaching-learning-based optimization of neural networks for water supply pipe condition prediction. Water 2021, 13, 3546. [Google Scholar] [CrossRef]
- Le, P.N.; Kang, H.J. Robot Manipulator Calibration Using a Model Based Identification Technique and a Neural Network with the Teaching Learning-Based Optimization. IEEE Access 2020, 8, 105447–105454. [Google Scholar] [CrossRef]
- Yaqoob, M.T.; Rahmat, M.K.; Maharum, S.M.M. Modified teaching learning based optimization for selective harmonic elimination in multilevel inverters. Ain Shams Eng. J. 2022, 13, 101714. [Google Scholar] [CrossRef]
- Ashtiani, M.N.; Toopshekan, A.; Astaraei, F.R.; Yousefi, H.; Maleki, A. Techno-economic analysis of a grid-connected PV/battery system using the teaching-learning-based optimization algorithm. Sol. Energy 2020, 203, 69–82. [Google Scholar] [CrossRef]
- Mi, X.; Liao, Z.; Li, S.; Gu, Q. Adaptive teaching–learning-based optimization with experience learning to identify photovoltaic cell parameters. Energy Rep. 2021, 7, 4114–4125. [Google Scholar] [CrossRef]
- Li, L.; Xiong, G.; Yuan, X.; Zhang, J.; Chen, J. Parameter Extraction of Photovoltaic Models Using a Dynamic Self-Adaptive and Mutual-Comparison Teaching-Learning-Based Optimization. IEEE Access 2021, 9, 52425–52441. [Google Scholar] [CrossRef]
- Akbari, E.; Ghasemi, M.; Gil, M.; Rahimnejad, A.; Gadsden, S.A. Optimal Power Flow via Teaching-Learning-Studying-Based Optimization Algorithm. Electr. Power Compon. Syst. 2021, 49, 584–601. [Google Scholar] [CrossRef]
- Shaheen, A.M.; Ginidi, A.R.; El-Sehiemy, R.A.; Elattar, E.E. Optimal economic power and heat dispatch in Cogeneration Systems including wind power. Energy 2021, 225, 120263. [Google Scholar] [CrossRef]
- Li, Y.; Wang, J.; Zhao, D.; Li, G.; Chen, C. A two-stage approach for combined heat and power economic emission dispatch: Combining multi-objective optimization with integrated decision making. Energy 2018, 162, 237–254. [Google Scholar] [CrossRef] [Green Version]
- Cho, H.J.; Oh, S.Y.; Choi, D.H. Hybrid evolutionary programming technique using subpopulations with completely different evolution mechanisms. Electron. Lett. 1998, 34, 964–965. [Google Scholar] [CrossRef]
- Chou, J.S.; Truong, D.N. Multiobjective optimization inspired by behavior of jellyfish for solving structural design problems. Chaos Solitons Fractals 2020, 135, 109738. [Google Scholar] [CrossRef]
- Bai, Y.; Wu, X.; Xia, A. An enhanced multi-objective differential evolution algorithm for dynamic environmental economic dispatch of power system with wind power. Energy Sci. Eng. 2021, 9, 316–329. [Google Scholar] [CrossRef]
- El-Ela, A.A.A.; El-Sehiemy, R.A.; Shaheen, A.M.; Elllien, A.R. Multiobjective coyote optimization algorithm for techno-economic simultaneous placement of DGs and FCLs in distribution networks. Int. Trans. Electr. Energy Syst. 2021, 31, e13050. [Google Scholar] [CrossRef]
- Basu, M. Combined heat and power economic emission dispatch using nondominated sorting genetic algorithm-II. Int. J. Electr. Power Energy Syst. 2013, 53, 135–141. [Google Scholar] [CrossRef]
- Nazari-Heris, M.; Mehdinejad, M.; Mohammadi-Ivatloo, B.; Babamalek-Gharehpetian, G. Combined heat and power economic dispatch problem solution by implementation of whale optimization method. Neural Comput. Appl. 2019, 31, 421–436. [Google Scholar] [CrossRef]
- Abualigah, L.; Yousri, D.; Elaziz, M.A.; Ewees, A.; Al-qaness, M.; Gandomi, A. Aquila Optimizer: A novel meta-heuristic optimization Algorithm. Comput. Ind. Eng. 2021, 157, 107250. [Google Scholar] [CrossRef]
- Abualigah, L.; Elaziz, M.A.; Sumari, P.; Geem, Z.W.; Gandomi, A.H. Reptile Search Algorithm (RSA): A nature-inspired meta-heuristic optimizer. Expert Syst. Appl. 2022, 191, 116158. [Google Scholar] [CrossRef]
- Agushaka, J.O.; Ezugwu, A.E.; Abualigah, L. Dwarf Mongoose Optimization Algorithm. Comput. Methods Appl. Mech. Eng. 2022, 391, 114570. [Google Scholar] [CrossRef]
- Abdollahzadeh, B.; Gharehchopogh, F.S.; Mirjalili, S. African vultures optimization algorithm: A new nature-inspired metaheuristic algorithm for global optimization problems. Comput. Ind. Eng. 2021, 158, 107408. [Google Scholar] [CrossRef]
- Sarhan, S.; Shaheen, A.M.; El-Sehiemy, R.A.; Gafar, M. An Enhanced Slime Mould Optimizer That Uses Chaotic Behavior and an Elitist Group for Solving Engineering Problems. Mathematics 2022, 10, 1991. [Google Scholar] [CrossRef]
- Dolatabadi, S.; El-Sehiemy, R.A.; GhassemZadeh, S. Scheduling of combined heat and generation outputs in power systems using a new hybrid multi-objective optimization algorithm. Neural Comput. Appl. 2020, 32, 10741–10757. [Google Scholar] [CrossRef]
- Mohammadi-Ivatloo, B.; Moradi-Dalvand, M.; Rabiee, A. Combined heat and power economic dispatch problem solution using particle swarm optimization with time varying acceleration coefficients. Electr. Power Syst. Res. 2013, 95, 9–18. [Google Scholar] [CrossRef]
- Ginidi, A.; Elsayed, A.; Shaheen, A.; Elattar, E.; El-Sehiemy, R. An Innovative Hybrid Heap-Based and Jellyfish Search Algorithm for Combined Heat and Power Economic Dispatch in Electrical Grids. Mathematics 2021, 9, 2053. [Google Scholar] [CrossRef]
Publisher’s Note: MDPI stays neutral with regard to jurisdictional claims in published maps and institutional affiliations. |
© 2022 by the authors. Licensee MDPI, Basel, Switzerland. This article is an open access article distributed under the terms and conditions of the Creative Commons Attribution (CC BY) license (https://creativecommons.org/licenses/by/4.0/).

