Article

Product Design Scheme Generation and Optimization Decisions While Considering Remanufacturability

1
Key Laboratory of Metallurgical Equipment and Control Technology, Ministry of Education, Wuhan University of Science and Technology, Wuhan 430081, China
2
School of Electromechanical and Automobile Engineering, Huanggang Normal University, Huanggang 438000, China
3
Precision Manufacturing Institute, Wuhan University of Science and Technology, Wuhan 430081, China
4
Hubei Key Laboratory of Mechanical Transmission and Manufacturing Engineering, Wuhan University of Science and Technology, Wuhan 430081, China
5
School of Architecture, Technology and Engineering, University of Brighton, Brighton BN2 4GJ, UK
*
Author to whom correspondence should be addressed.
Mathematics 2022, 10(14), 2477; https://doi.org/10.3390/math10142477
Submission received: 6 June 2022 / Revised: 10 July 2022 / Accepted: 12 July 2022 / Published: 16 July 2022

Abstract

:
Social awareness of the environment has promoted the vigorous development of remanufacturing. Traditional product design does not consider the remanufacturability, which leads to improper disposal at the end of the product’s life, resulting in environmental pollution and resource waste. In this paper, a method for the generation and optimization of product design schemes was established, in which remanufacturability was included at the early design stage of the product. Firstly, based on axiomatic design, the Z-shaped mapping was upgraded to the tree topology mapping, which was then incorporated into the scheme generation model, and seven remanufacturability design constraint criteria were used as constraints to obtain a product design set of scenarios. Secondly, the entropy weight method and analytic hierarchy process were combined to calculate the weights of the four evaluation indicators: functionality, economy, stability, and environment; and a differential evolution algorithm was used to optimize the scheme. Finally, a lathe was taken as a case to illustrate the applicability and effectiveness of the proposed methodology. The results showed that the method could successfully generate product design schemes that improved remanufacturability and met the needs of users.

1. Introduction

With the rapid economic development, the competition among enterprises has become increasingly fierce, and customers’ demand for product functions has also increased. Product design, as one of the essential steps in product development, is a major means to improve product quality and competitiveness. However, traditional product design principally is mainly focused on function and performance, while the product’s remanufacturability at end-of-life is neglected at the design stage, resulting in non-remanufacturable used products and associated serious environmental pollution and a large amount of resource waste. Therefore, at the initial stage of product design, full consideration of the remanufacturability after a project’s retirement can promote the manufacturing industry to achieve maximum resource utilization and minimum environmental pollution, which has far-reaching research significance [1].
Design for remanufacturing can effectively improve the efficiency of resource use and reduce environmental pollution, which is one of the effective means to promote green recycling development of resources and the environment. In recent years, design for remanufacturing has attracted much attention [2]. Whether a retired product can be remanufactured, as well as the remanufacturing performance, depend largely on the initial design stage. Design for remanufacturing is different from traditional product design, since it not only considers the factors of new product design, but also includes the remanufacturability at the end of life of the product as part of the product design. Design for remanufacturing is systematically considered at the preliminary design to ensure the remanufacturability of the product at the end of its life [3]. At the beginning of the product design, comprehensive considerations are given to the reuse rate of parts and components at the end of product’s lifecycle, the environmental impact, and the feasibility of remanufacturing while taking into account the design constraints, including remanufacturing processes; e.g., disassembly, assembly, sorting, cleaning, and other remanufacturability factors. In the process of material selection and structure design, factors such as easy maintenance, easy disassembly, and remanufacturability should be taken into full consideration to improve the efficiency of material use and realize environmentally friendly development [4].
Based on this, this article proposes a novel method of scheme generation and optimization of product design while considering remanufacturability, which addresses the problems of a low material-utilization rate and serious environmental pollution in current product design research. The focus was to increase a product’s remanufacturing performance. If the whole machine or parts can be remanufactured after a life cycle, the optimal utilization of product resources can be achieved. Consideration of remanufacturability at design stage plays a major role in improving product quality, life, and remanufacturability, shortening remanufacturing times and reducing costs, resource waste, and environmental pollution. It improves product remanufacturing capabilities and increases social and economic benefits.

2. Literature Review

A product design scheme considers many factors; e.g., the product market demand information, designer inspiration and basic knowledge, and so on. Its purpose is to realize the sustainable development of resources and the environment while integrating the product design requirements. In order to further the study of design for remanufacturing and optimize the product design scheme, this paper took the constraint criterion as input and the qualitative structural design scheme as output to realize the mapping and decomposition between function and structure and obtain the optimal product design scheme. Product design mainly includes two stages: scheme generation and scheme optimization.
The scheme generation of product design is based on the mapping process between user requirements, product functions, and design theory, which can realize and respond to user needs and preferences by generating candidate scheme sets that meet various constraints. The topic of product scheme generation has been researched extensively. This paper mainly reviews the methods of the functional method tree and axiomatic design and its extension, which are commonly adapted for scheme generation. The functional method tree describes the design process of functional decomposition; that is, product functions are decomposed step by step in the form of functions, and finally the possible solution sets of product design schemes are generated. For example, Christophe et al. [5] integrated a product conceptual design and knowledge model, and proposed a product conceptual design model based on function tree method to realize the automation of some conceptual design of construction machinery. This approach is only applicable to specific fields. Based on the feasibility of design to match product function with structural parameters, Deng et al. [6] proposed a product design model based on a function tree. Axiomatic design, a hot spot in the field of design, provides a scientific basis and principal guidance for product design. Yang et al. [7] proposed a hybrid axiomatic design method of iterative matching to satisfy independent axioms and attribute constraints. This method could minimize the information requirement and improve the design quality. Sarath et al. [8] proposed an additive manufacturing design guide based on AD and TRIZ methods for an actual product design framework. In addition, extension is a regular method of product design that uses a formal method to study the possibilities of how things expand, as well as design for development and innovation. Li et al. [9] and Ren et al. [10] integrated extension theory into the axiomatic design and TRIZ method, realizing the optimization of the product design process and manufacturing path. The former made use of a design-decoupling approach to make the process of turning customer requirements into functional requirements, design parameters, and process variables more clear. The latter provided a new model for the preliminary study of low carbon design, the effectiveness of which was verified by an innovative design scheme of a screw air compressor with a dual conflict problem.
The optimal product design scheme is a key to realizing the optimal decision from several candidate schemes, according to the product market demand. In recent years, many scholars have carried out extensive research on the optimization of product design schemes, employing methods such as the analytic hierarchy process (AHP), ant colony algorithm, genetic algorithm, extension transformation method, and differential evolution algorithm. Yeo et al. [11] used the AHP method to evaluate the conceptual design scheme of a fixture system. Lin et al. [12] proposed a design method combining AHP and TOPSIS to assist designers in identifying customer needs and design characteristics more efficiently, thus achieving an effective evaluation of design schemes. Wan et al. [13] used an ant colony algorithm to optimize the environmental benefits of ecological mining areas based on classification index formulas and comprehensive index formulas, and established an environmental benefit evaluation model. To generate the optimal process planning, Wang et al. [14] proposed a fault feature optimization method for remanufacturing process planning, which combined a genetic algorithm (GA) and an artificial neural network (ANN) to optimize the remanufacturing process plan. Yan et al. [15] proposed an improved differential evolution algorithm based on multiobjective parameter optimization to identify the best design schemes.
Traditional product design is mainly focused on product functions and performance design, yet the remanufacturing capacity at the end of the product’s life is neglected at the design stage, which makes remanufacturing difficult and causes serious environmental pollution and resource waste [16]. Many remanufacturing enterprises have realized that in practice, if the relevant requirements to facilitate the end-of-life recovery and remanufacturing are taken into consideration in the design phase of new products, the benefits of remanufacturing can be significantly improved. Based on this, scholars proposed a remanufacturing-oriented product design method in which remanufacturing was fully considered as a design constraint to improve the efficiency of resource reuse and achieve green and sustainable development of manufacturing [17]. As designers often lack remanufacturing knowledge, Jiang et al. [18] proposed a method of subjective mixed multiattribute decision making for remanufacturing design schemes to overcome the influence of subjective factors in the design process. Ijomah et al. [19] elaborated on the importance of considering remanufacturability at the early stage of product design. Other studies [20,21,22] presented a product design strategy on the basis of a generalized game. It is very important to consider the remanufacturability at the initial stage of product design. According to Fegade et al. [23], the combination of product design and remanufacturing can make remanufacturing design the mainstream of product design. It can be seen that the optimal product design scheme has a profound impact on a product’s entire life cycle, and considering its remanufacturability at the beginning of product design is one of the effective means to achieve sustainable development resources and protect the environment.
The above research resulted in the generation and optimization of product design schemes. The review on remanufacturability design showed that there was relatively little research that took remanufacturability into consideration at the beginning of the product design, which seriously hinders the pace of sustainable development. Therefore, this article mainly focused on product design as the research object, and on the basis of design scheme generation, established a product design scheme generation and optimization model while considering remanufacturability. In this study, the Z-mapping of axiomatic design was upgraded to a tree topology mapping, which was then integrated into the scheme generation model. This provided specific implementation means for axiomatic design between domains, and clearly expressed the hierarchical relationship and mapping process between function requirements (FRs) and design parameters (DPs). The optimal design scheme was realized by using seven constraint criteria, including remanufacturing, as constraints in the scheme generation process. Then, the entropy method and AHP were combined to calculate the weights of the four indicators more accurately. On this basis, the differential evolution algorithm was established to solve the optimization problem of the combination explosion, and an optimal product design scheme that included remanufacturing was obtained. The specific calculation process is shown in Figure 1.

3. Scheme Generation Based on Improved Axiomatic Design

The modeling of the scheme generation will not only assist designers when generating the possible design schemes, but also will act as a conduit for the accumulation and transfer of remanufacturing product design knowledge. Traditional product design methods rely largely on the intuition and reasoning of designers, so there is a certain gap between the actual function and theoretical function of the product in the design process. Therefore, this chapter firstly analyzes the tree topology mapping process in detail, then integrates the tree topology mapping process into the design scheme generation process model based on the idea of a directed graph model. The relationship between graphs is given in detail, and the feasible DP is solved by FRs. Then, seven remanufacturing constraint criteria affecting product design are summarized as constraints of the design goal of the product. Finally, the optimal design scheme while considering remanufacturability is obtained.

3.1. Analysis of Tree Topology Mapping Process

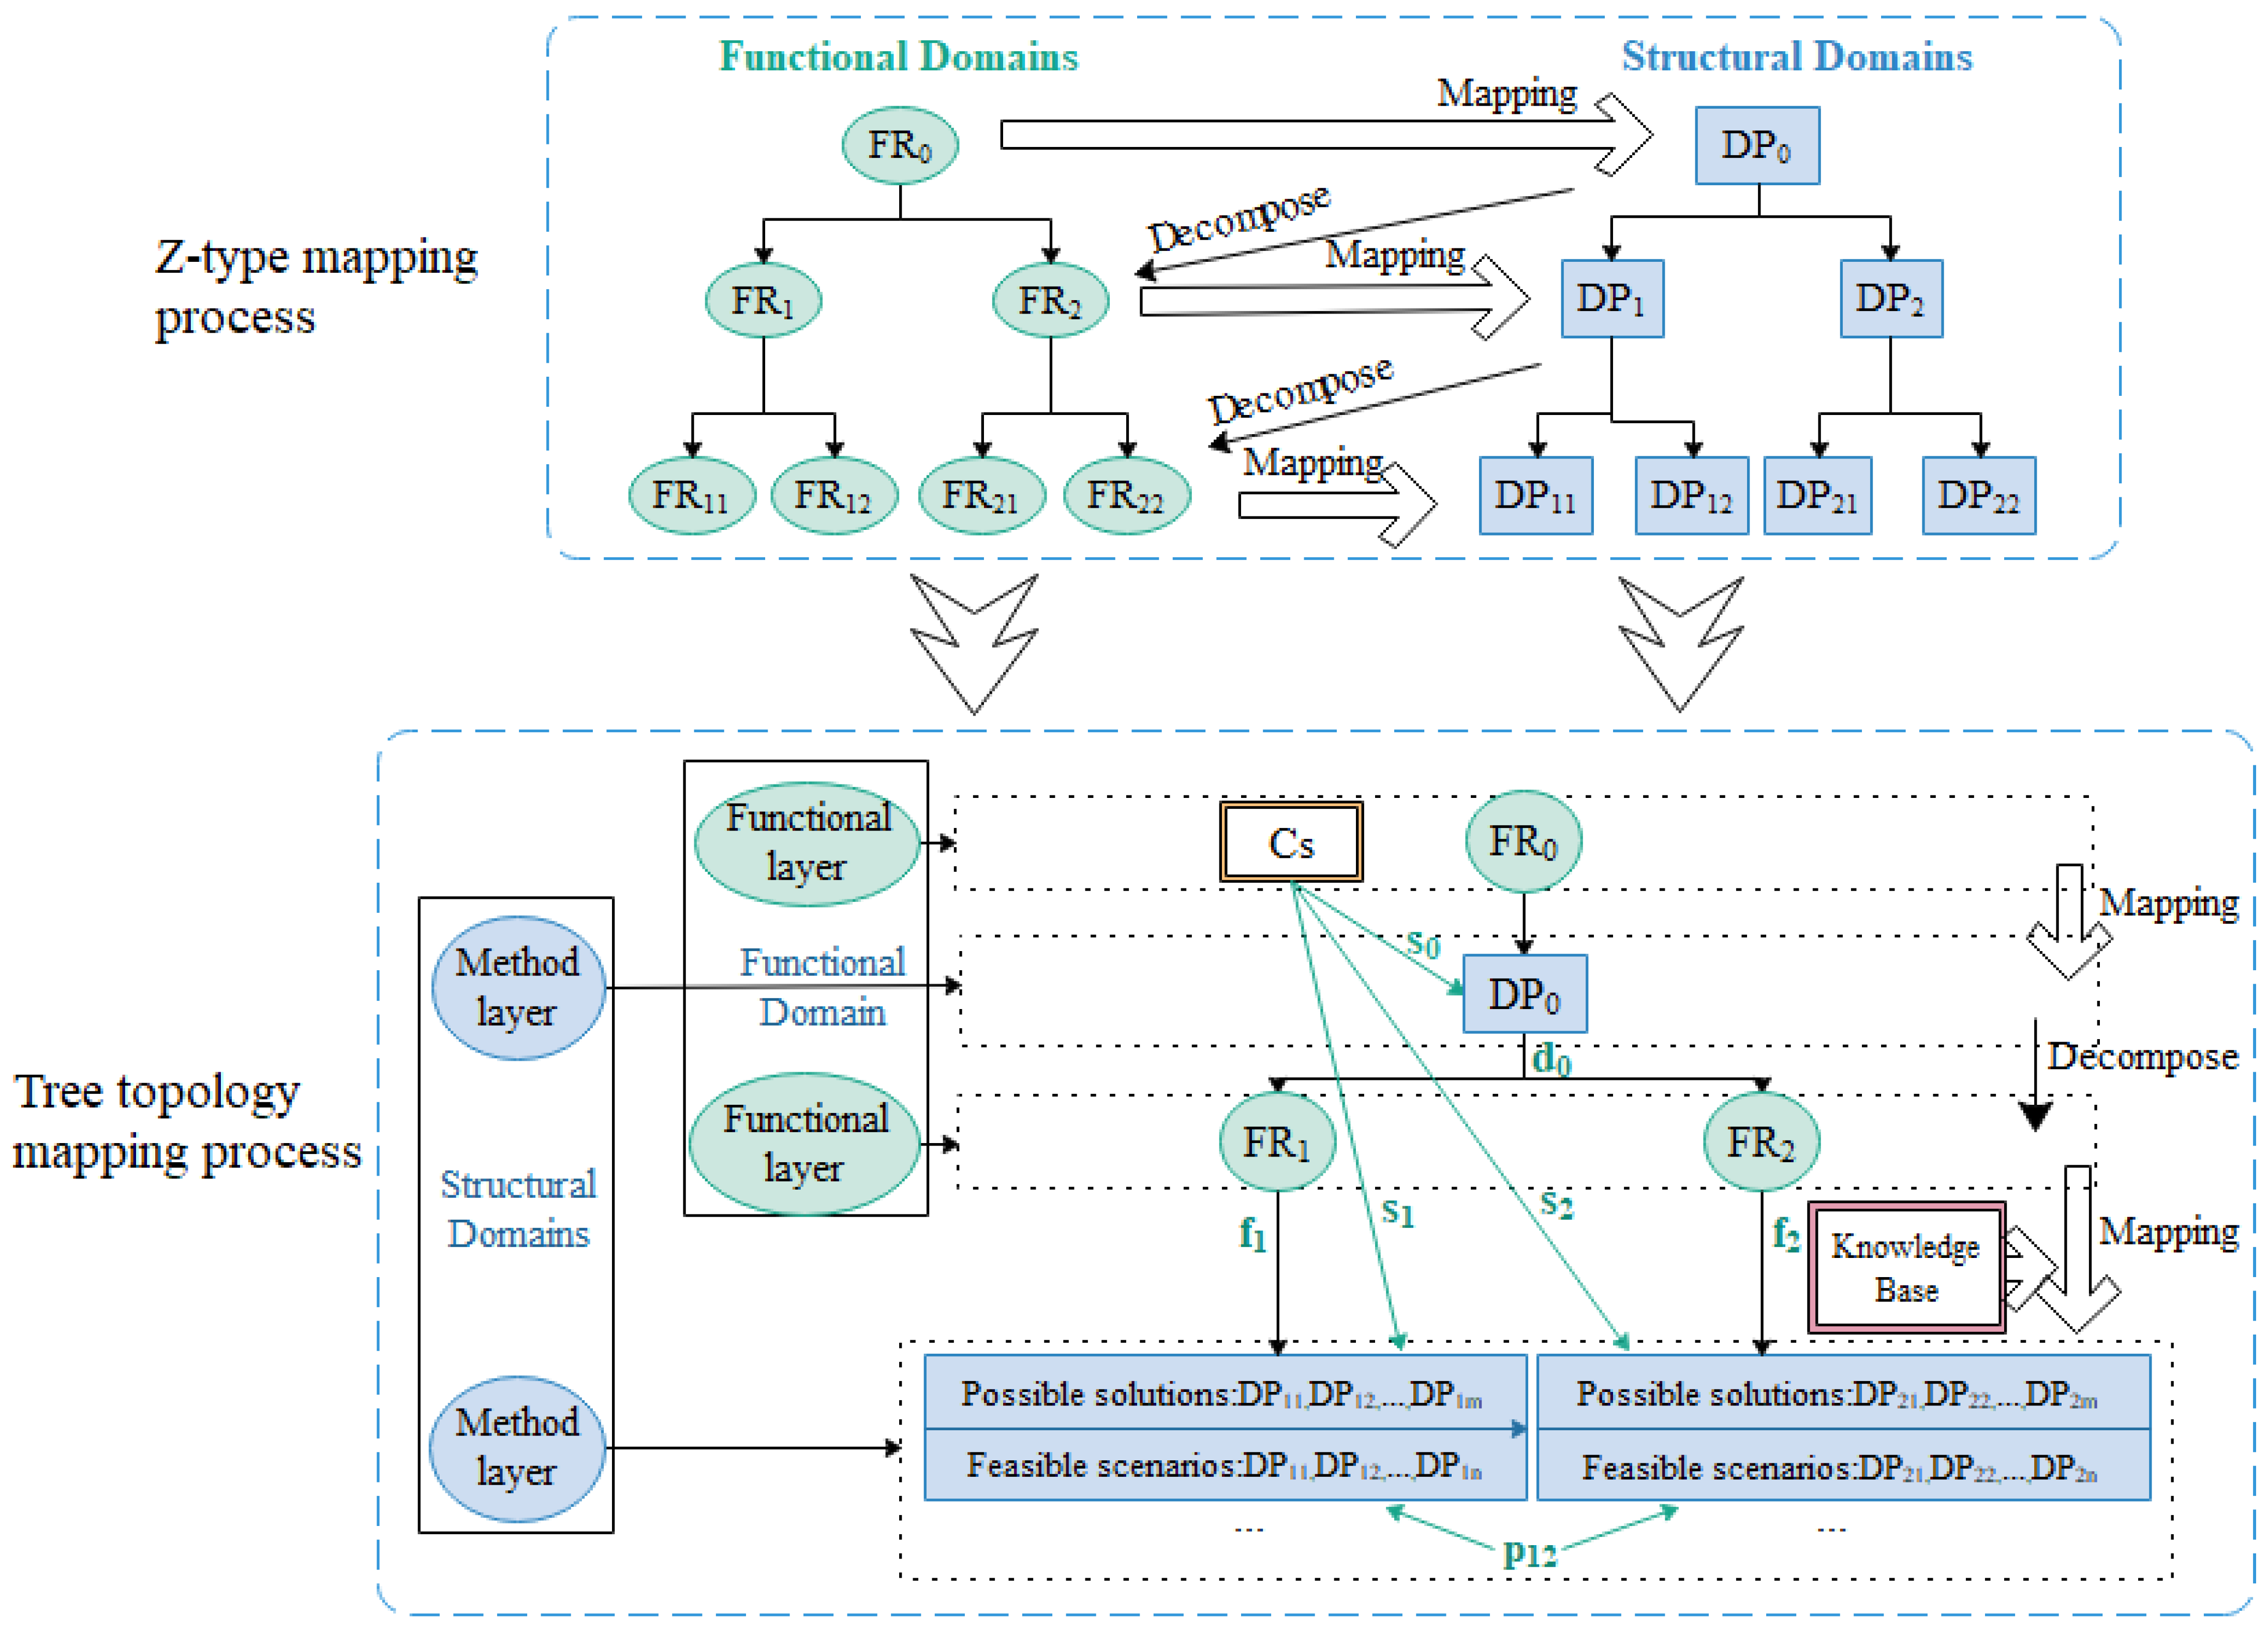
The traditional Z-shaped mapping process itself belongs to the mapping method of the function tree. In this study, the Z shaped mapping and function tree were combined to establish the tree topology mapping process, which mainly consisted of two parts, namely functional domain and method domain. The functional domain is represented by the FRS, remanufacturability design constraint criteria, and other constraints CS. The method domain is represented by the candidate design method DPim (i, m ∈ Z) and the feasible design method DPin (i, n ∈ Z). Both the functional domain and method domain include multiple levels, so the functional layer and method layer can be connected through a knowledge base to map and decompose alternately. Figure 2 shows the functional method tree diagram.
In this study, DPS in axiomatic design were used to replace the method in the functional method tree, and the general idea of the tree topology mapping process was as follows. Firstly, FR0 (total functional requirements) was determined, and the corresponding knowledge base was established. Then, DP0 (total design parameter) was determined according to FR0, and the functional layer and method layer were mapped and decomposed by the knowledge base. FR0 was decomposed into multiple subfunctional requirements; the possible design methods DP11, DP12, …, DPim (i, m ∈ Z); and the feasible design methods DP11, DP12, …, DPin (i, n ∈ Z). By analogy, the mapping and decomposition of the functional layer and method layer were carried out in the next step to form a tree topological mapping process, as shown in Figure 3 (where S indicates the design parameters that can meet the constraints, D represents the subfunctions generated by feasible design methods, F represents the possible design methods that can meet the functional requirements, and P is the influence between design methods).
As can be seen in Figure 3, in the process of tree topological mapping, the function layer and method layer are always adjacent layers: the upper and lower levels, showing the causes and effects between functions and methods, which reflects the decomposition and mapping process between functions and methods. It can be concluded that the tree topological mapping process has many similarities to the Z-shaped mapping process, yet offering certain advantages, as follows:
(1)
Taking axiomatic design as the guideline and supporting its design concept, it provides concrete implementation means from function domain to method domain for axiomatic design to make the mapping process clearer.
(2)
Based on a certain knowledge base, it can guide the whole mapping process through a variety of design experience, knowledge information, and past design cases.

3.2. Establishment of Scheme Generation Process Model

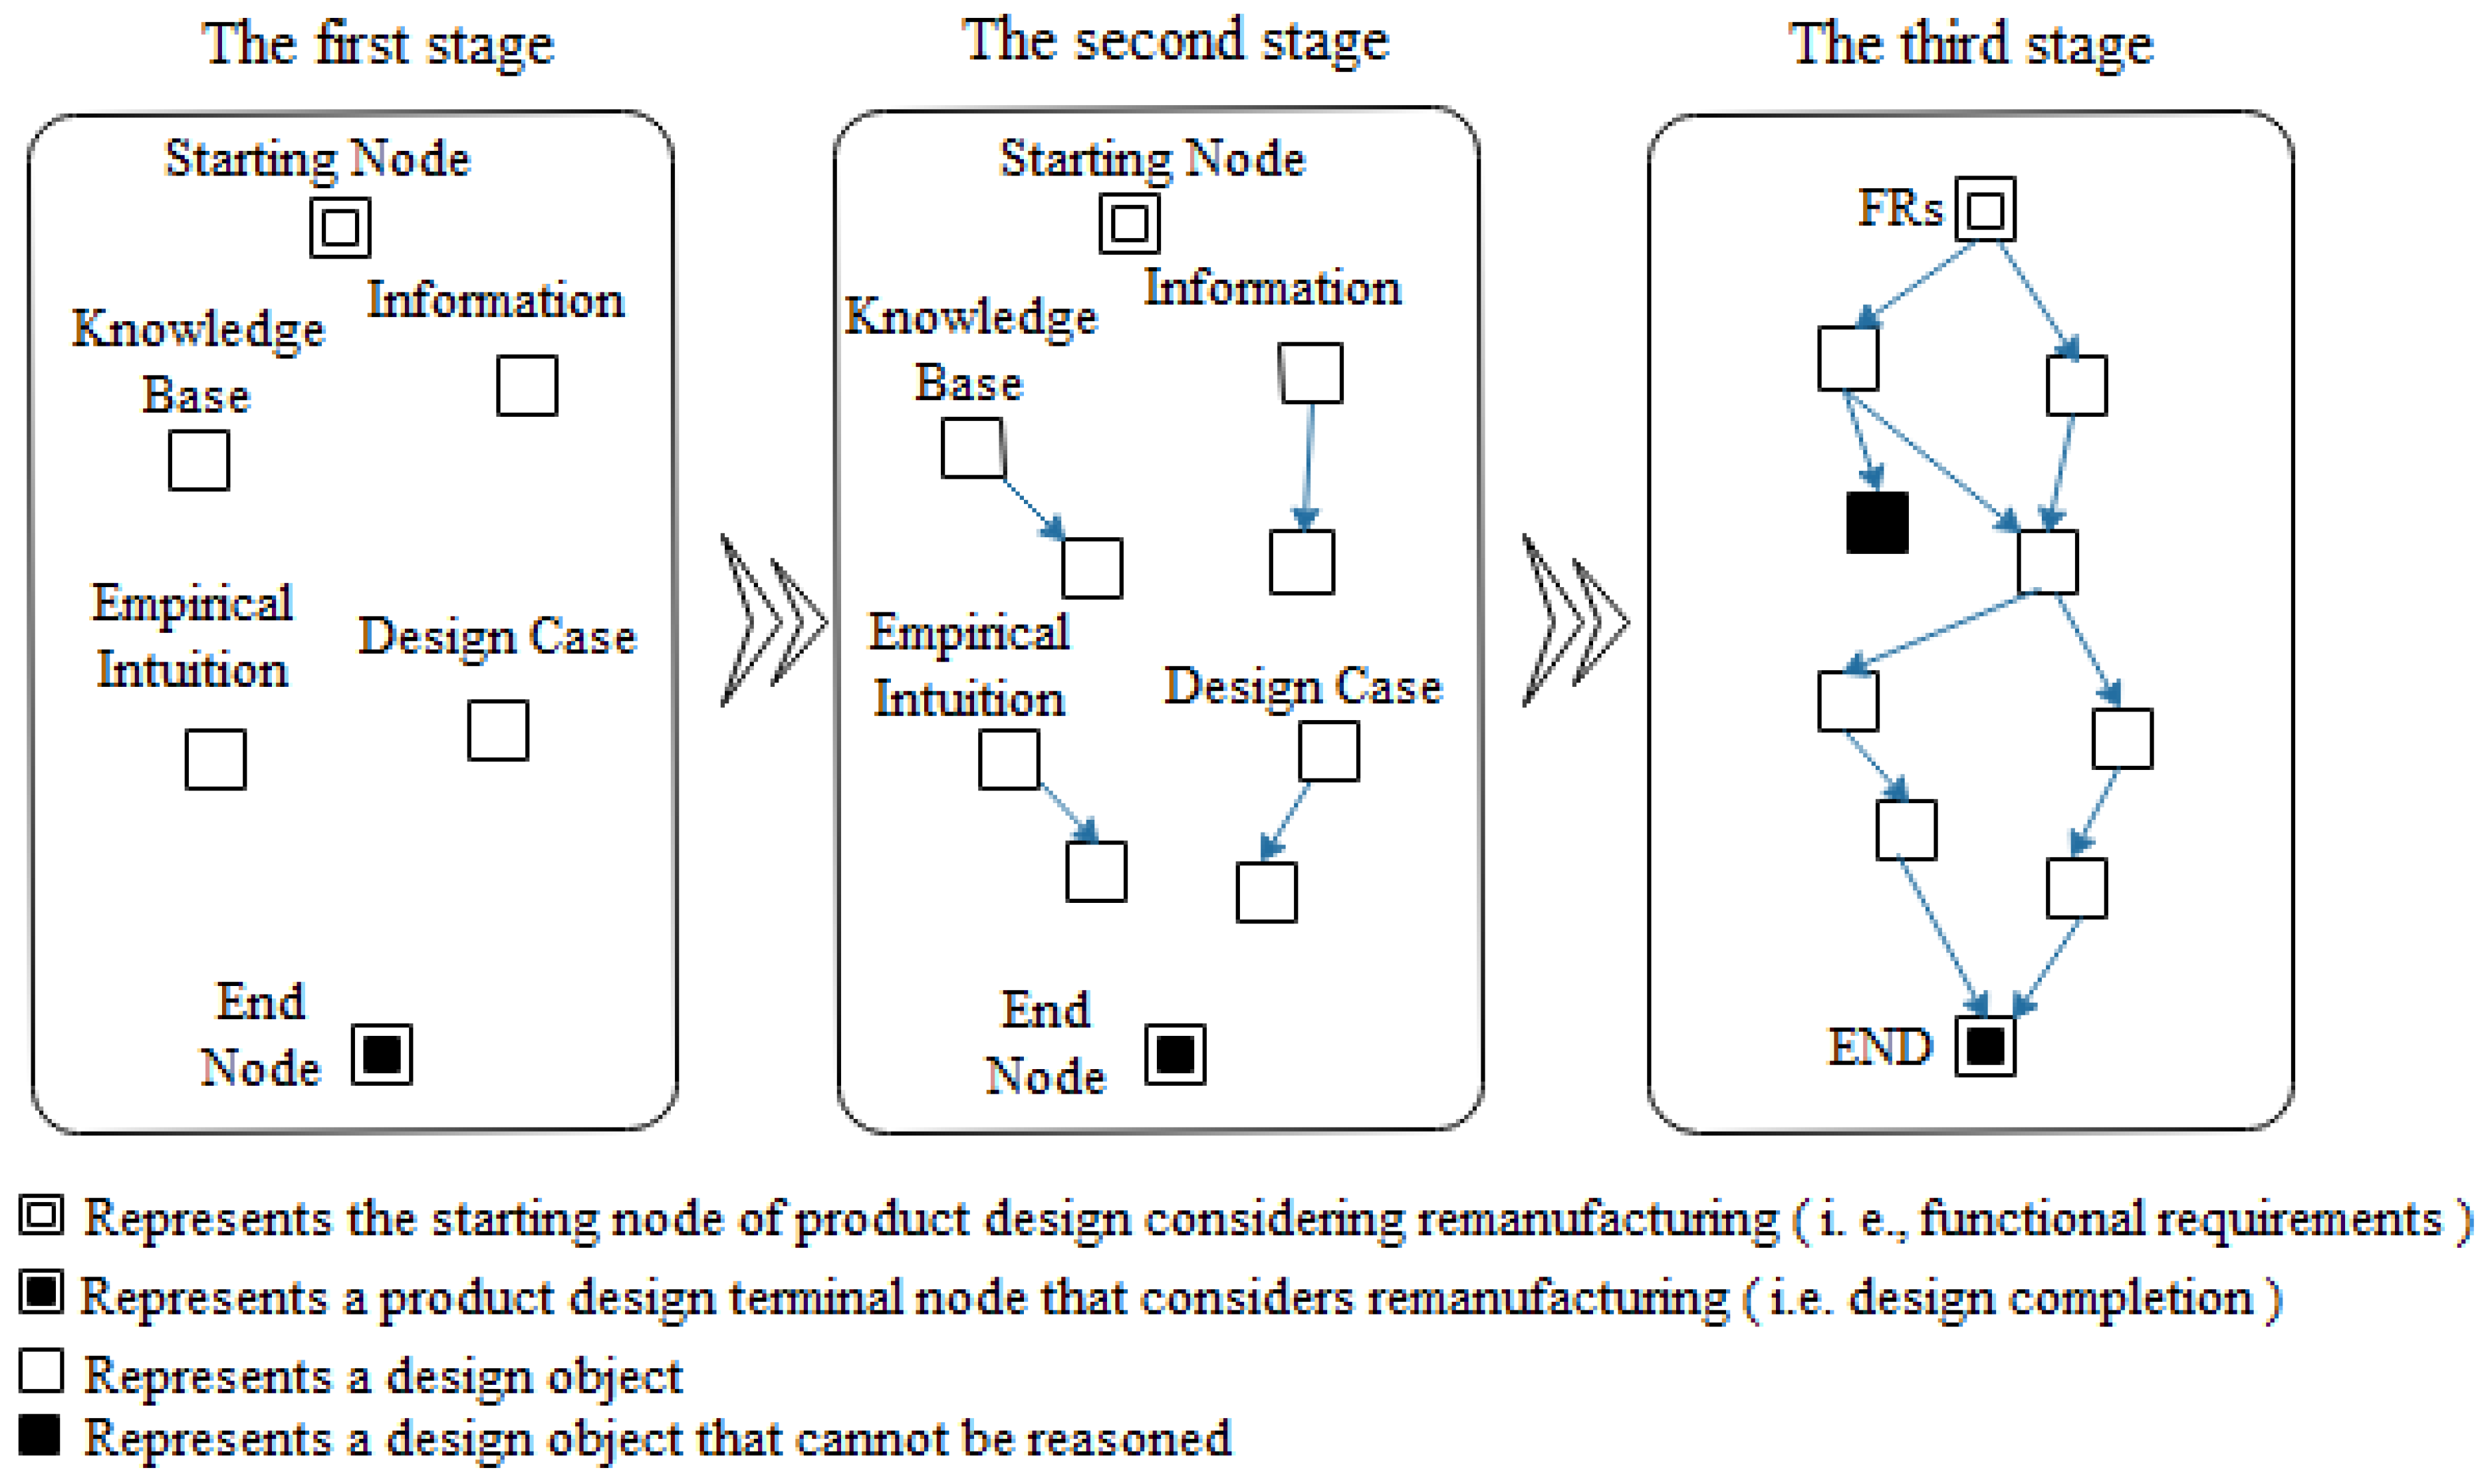
The mapping process from functional domain to method domain is the key step of scheme generation. The existing research results showed that the generation of a product design scheme is the path setting from the initial node to the terminal node. The initial node represents the functional requirement FR, and the terminal node represents the design method DP. All paths are presented in a network structure, which can be divided into three stages. The first stage is to generate discrete design points from the design object. The second stage is to conceive a design combination to partially produce design network. The third stage is to conceive the overall design method to produce the scheme network.
Figure 4 shows the product design solution generation process with remanufacturability in mind, which can effectively improve product design efficiency. However, due to the ambiguity and overlap of the three-stage design, it was difficult to achieve a clear distinction. In order to better realize the generation of product design scheme, the scheme generation process was combined with the directed graph model, which is defined in detail as follows:
(1)
The scheme generation process model is a weighted directed graph, M = {V(M), E(M), G(M)}, which is defined as follows:
  • V(M) represents the set of nodes, V(M) = {FR, ED, DP, D(M)}, where FR (functional requirement set) is the starting node; ED (terminal node) indicates the end of the design; DP (terminal node-set) represents the design object; and D(M) (dead point set) represents objects that cannot be inferred or designed incorrectly.
  • E(M) = {(Vi, Vj)} represents the set of directed arcs of different elements in V(M). One of the directed arcs from nodes Vi to Vj can be represented by an ordered dual (Vi, Vj). The directivity of the directed arcs enables the design objects to be connected to form a scheme network.
  • G(M) = {g (Vi, Vj)} = {gi, j} is the set of function weights.
(2)
The scheme represents the set of feasible paths from the initial node FR to the terminal node DP. As long as the path from FR to DP can be connected, it is called the feasible path.

3.3. The Scheme Generation Model Incorporating the Tree Topological Mapping Process Is Established

In tree topology mapping, the mapping process is represented by the hierarchical structure of function domain and method domain. The process model of product design scheme generation while considering remanufacturing can be supplemented by the tree topology mapping process. Therefore, this section specifically analyzes how the tree topology mapping process generates the process model by applying a product design scheme. The details are shown in Figure 5 (“AND” relationship between functions and “OR” relationship between methods). The steps of the generation of candidate design scheme were as shown below:
(1)
Knowledge base is established. The knowledge base is composed of expert knowledge, customer requirements, existing achievements, and technical requirements as input.
(2)
Total functional requirement FR0 is determined. The design requirements and knowledge base are used to solve FR0, graph M0 is employed to describe the generation process, and the total design method DP0 is then obtained.
(3)
The subfunctional requirements FR1 and FR2 are solved. DP0 is decomposed to obtain FR1 and FR2, represented as the starting nodes of M1 in Figure 5. The possible design methods are found in the knowledge base, and the feasible design methods DP11, DP21, and DP22 are selected according to the constraints of remanufacturability criteria and design requirements.
(4)
Compatibility judgment. The compatibility of FR1 and FR2 is judged. The compatible nodes continue to be decomposed downward, while redundant nodes are eliminated. Therefore, the design matrix of the feasible design method is obtained using Equations (1) and (2).
b i j {   x     denote   node   compatibility 0    denote   nodes   repel   each   other
                    DP 11 B = [ x x ] DP 21 DP 22
(5)
Decompose DP11, DP21, and DP22. The design methods DP11, DP21, and DP22 are decomposed respectively to obtain the subfunctional requirements, which are expressed in the starting nodes of M11, M21, and M22 in Figure 5.
(6)
Repeat the above steps to decompose downward until it cannot be decomposed further, and then stop the cycle.

3.4. Design Constraint Criteria While Considering Remanufacturability

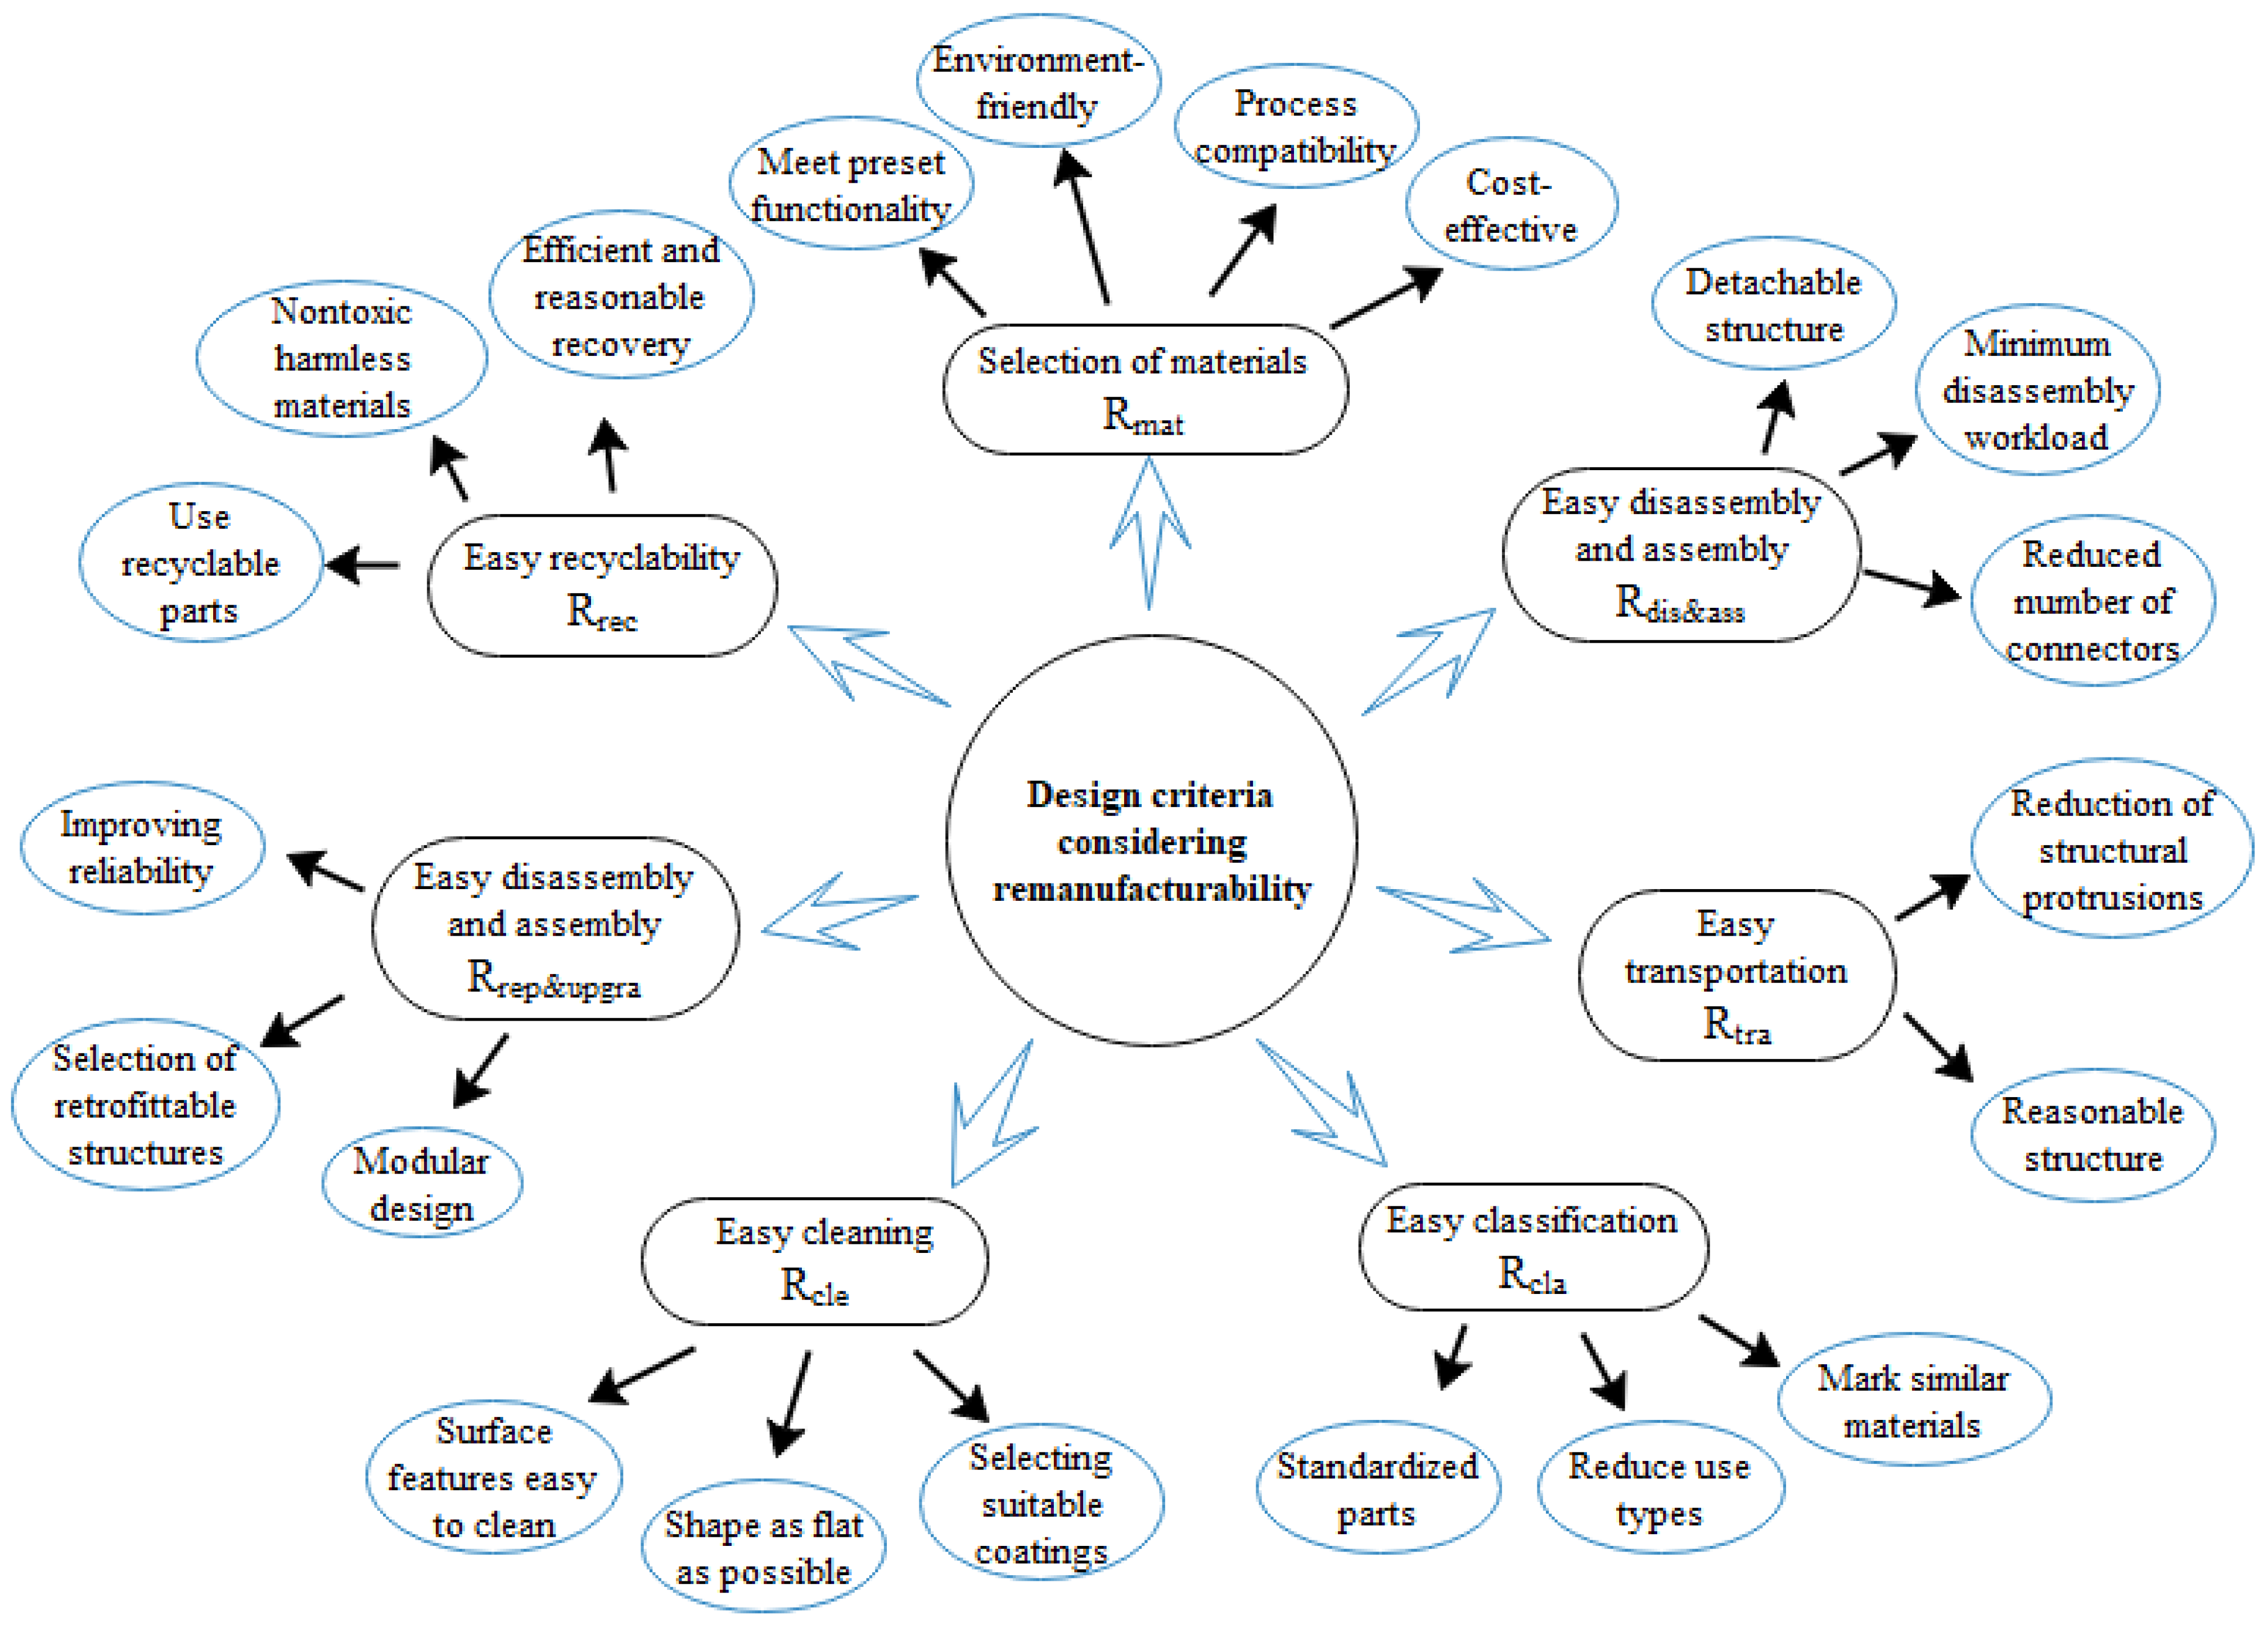
The remanufacturability of a product should be fully considered at the product design stage, so that the product has good remanufacturability at the end of its life. Wu et al. [24] defined remanufacturability as an inherent attribute of the product itself. An efficient remanufacturability evaluation system can improve the remanufacturing efficiency of used products, which is of far-reaching significance in realizing the sustainable development of resources and the environment [25]. Therefore, this paper summarized the remanufacturability design constraint criteria that may be subjected to in the design process into the following categories, as shown in Figure 6.
Figure 6 shows the seven design standards, including the selection of materials, disassembly and assembly, transport, standardization, cleanliness, maintenance upgrades, and recycling. At the same time, by combining these with the design personnel’s design experience and the existing process, optimal remanufacturing product design schemes can be generated.

4. Scheme Optimization Based on Differential Evolution Algorithm

As it well known, accumulation of errors takes place in product design and operation, and this is difficult to eliminate in downstream stages. Scheme optimization is a multicriteria decision-making problem that cannot rely on a single local evaluation attribute or standard. In this chapter, four evaluation indexes and a comprehensive evaluation system of functionality, economy, stability, and environment are established firstly. Then, the weight of indexes is determined by combining EW and AHP. Finally, based on a differential evolution algorithm, Python programming is employed to optimize the scheme.

4.1. Establishment of Evaluation Index System

(1)
Functional indicator ( U F I )
Different design schemes may result in different product performances, so functional indicators are used to measure performance. U F I represents the gap between theoretical design and actual function, and is expressed by expert evaluation. The evaluation results of the jth possible design scheme U F I j can be divided into { A , B , C , D , E } , the values of which are assigned as {1, 0.75, 0.5, 0.25, 0}, respectively. The smaller the value is, the better it is. Therefore, the functional indicator is shown as Equation (3):
U F I i = U F I j j = 1 n U F I j
where n represents the number of possible design methods in the product design scheme, and U F I i represents the functional index of the product design scheme of the ith product.
(2)
Economic indicator ( U E I )
As far as enterprises are concerned, economic benefits have always been the goal of their pursuit. Different design schemes have increased differences in economic benefits. The lower the cost and the higher the remanufacturability, the higher the economic benefits. The economic indicators of the product design scheme are expressed as Equation (4):
U E I i = j = 1 n U C j max ( U C ) × n
where U E I i represents the ith product design scheme of U E I , U C j refers to the cost of the jth possible design method in the product design scheme, and max ( U C ) represents the highest cost of all feasible schemes.
(3)
Stability indicator ( U S I )
The stability of a product is very important to the later operation and maintenance, and is directly linked to the economic benefits of the enterprise. U S I represents the frequency of failure during the operation of the product and is calculated using the failure rate function λ ( t ) .The specific calculation is shown in Equation (5):
U S I i = j = 1 n λ j ( t ) max ( λ ( t ) ) × n
where U S I i refers to the ith product idea design scheme U S I , λ j ( t ) refers to the failure rate function of the function module corresponding to the jth possible design scheme, t represents the running time of the remanufactured product, and max ( λ ( t ) ) represents the highest failure rate in the jth related function module.
(4)
Environmental indicator ( U E Q )
U E Q refers to the systematic environmental benefit assessment of the entire remanufacturing process, including recycling, cleaning, disassembly, etc. The environmental indicator is a qualitative evaluation table that combines historical remanufacturing data with expert evaluation to obtain its specific value. The evaluation results were expressed in the form of fuzzy quantization {severe pollution, major pollution, fair pollution, minor pollution, little pollution}, and the corresponding values were {0.95, 0.75, 0.55, 0.35, 0.15}, respectively. Finally, the weighted summation method was adopted for comprehensive evaluation of environmental impact. The smaller the value, the better. Detailed calculations can be found in Equations (6) and (7):
E Q j = D i s j + C l e j + T e s j + R e m j + A s s j 5
U E Q i = j = 1 n E Q j n
where E Q j refers to the environmental index of the jth possible design method in product design, and U E Q i refers to the environmental index of the ith product design scheme. D i s j , C l e j , T e s j , R e m j , and A s s j respectively represent the environmental evaluation scores of the pollution caused by the disassembly, cleaning, testing, remanufacturing and assembly processes.
(5)
Comprehensive evaluation index ( U C E )
In order to comprehensively evaluate the scheme, a weight coefficient was introduced to evaluate the four indicators of the product design scheme. The calculation method was as follows:
U C E i = W 1 × U F I i + W 2 × U E I i + W 3 × U S I i + W 4 × U E Q i
In Equation (8), W 1 , W 2 , W 3 and W 4 respectively refer to the weight of U F I i , U E I i , and U E Q i . U C E i refers to the comprehensive evaluation result of the ith product design scheme.

4.2. EW-AHP Method to Determine the Weight of Indicators

Index weight is an important step to determine whether the selected method is reasonable, which affects the accuracy of the evaluation results. Considering the advantages and disadvantages of the objective and subjective weighting methods, this paper combined the subjective entropy weighting method (EW) with the objective analytic hierarchy process (AHP) to comprehensively evaluate the target object to ensure the accuracy and rationality of the evaluation [26]. The specific steps were as follows:
Step 1: Generate the comparison matrix by comparing each two indicators U = [ u i j ] a × a .
Step 2: Calculate the relative weight w i E W of each index using Equations (9)–(11):
E i = 1 ln a j = 1 a u i j ln u i j
D i = 1 E i
w i E W = D j i = 1 a D j
where a refers to the number of rows of the comparison matrix, and E i represents the entropy value of the ith product design scheme.
Step 3: Calculate the relative weight w i A H P of each index using Equations (12)–(14):
M i = j = 1 a u i j
w i ¯ = M i 6
w i A H P = w i ¯ / i = 1 a w i ¯
Step 4: Determine the composite weight. In this paper, the weight distribution coefficient α was introduced to comprehensively obtain the weight coefficient through AHP and EW methods, and the comprehensive weight can be calculated using Equation (15):
w i w e i g h t s = α × w i A H P + ( 1 α ) × w i E W

4.3. Optimization of Scheme

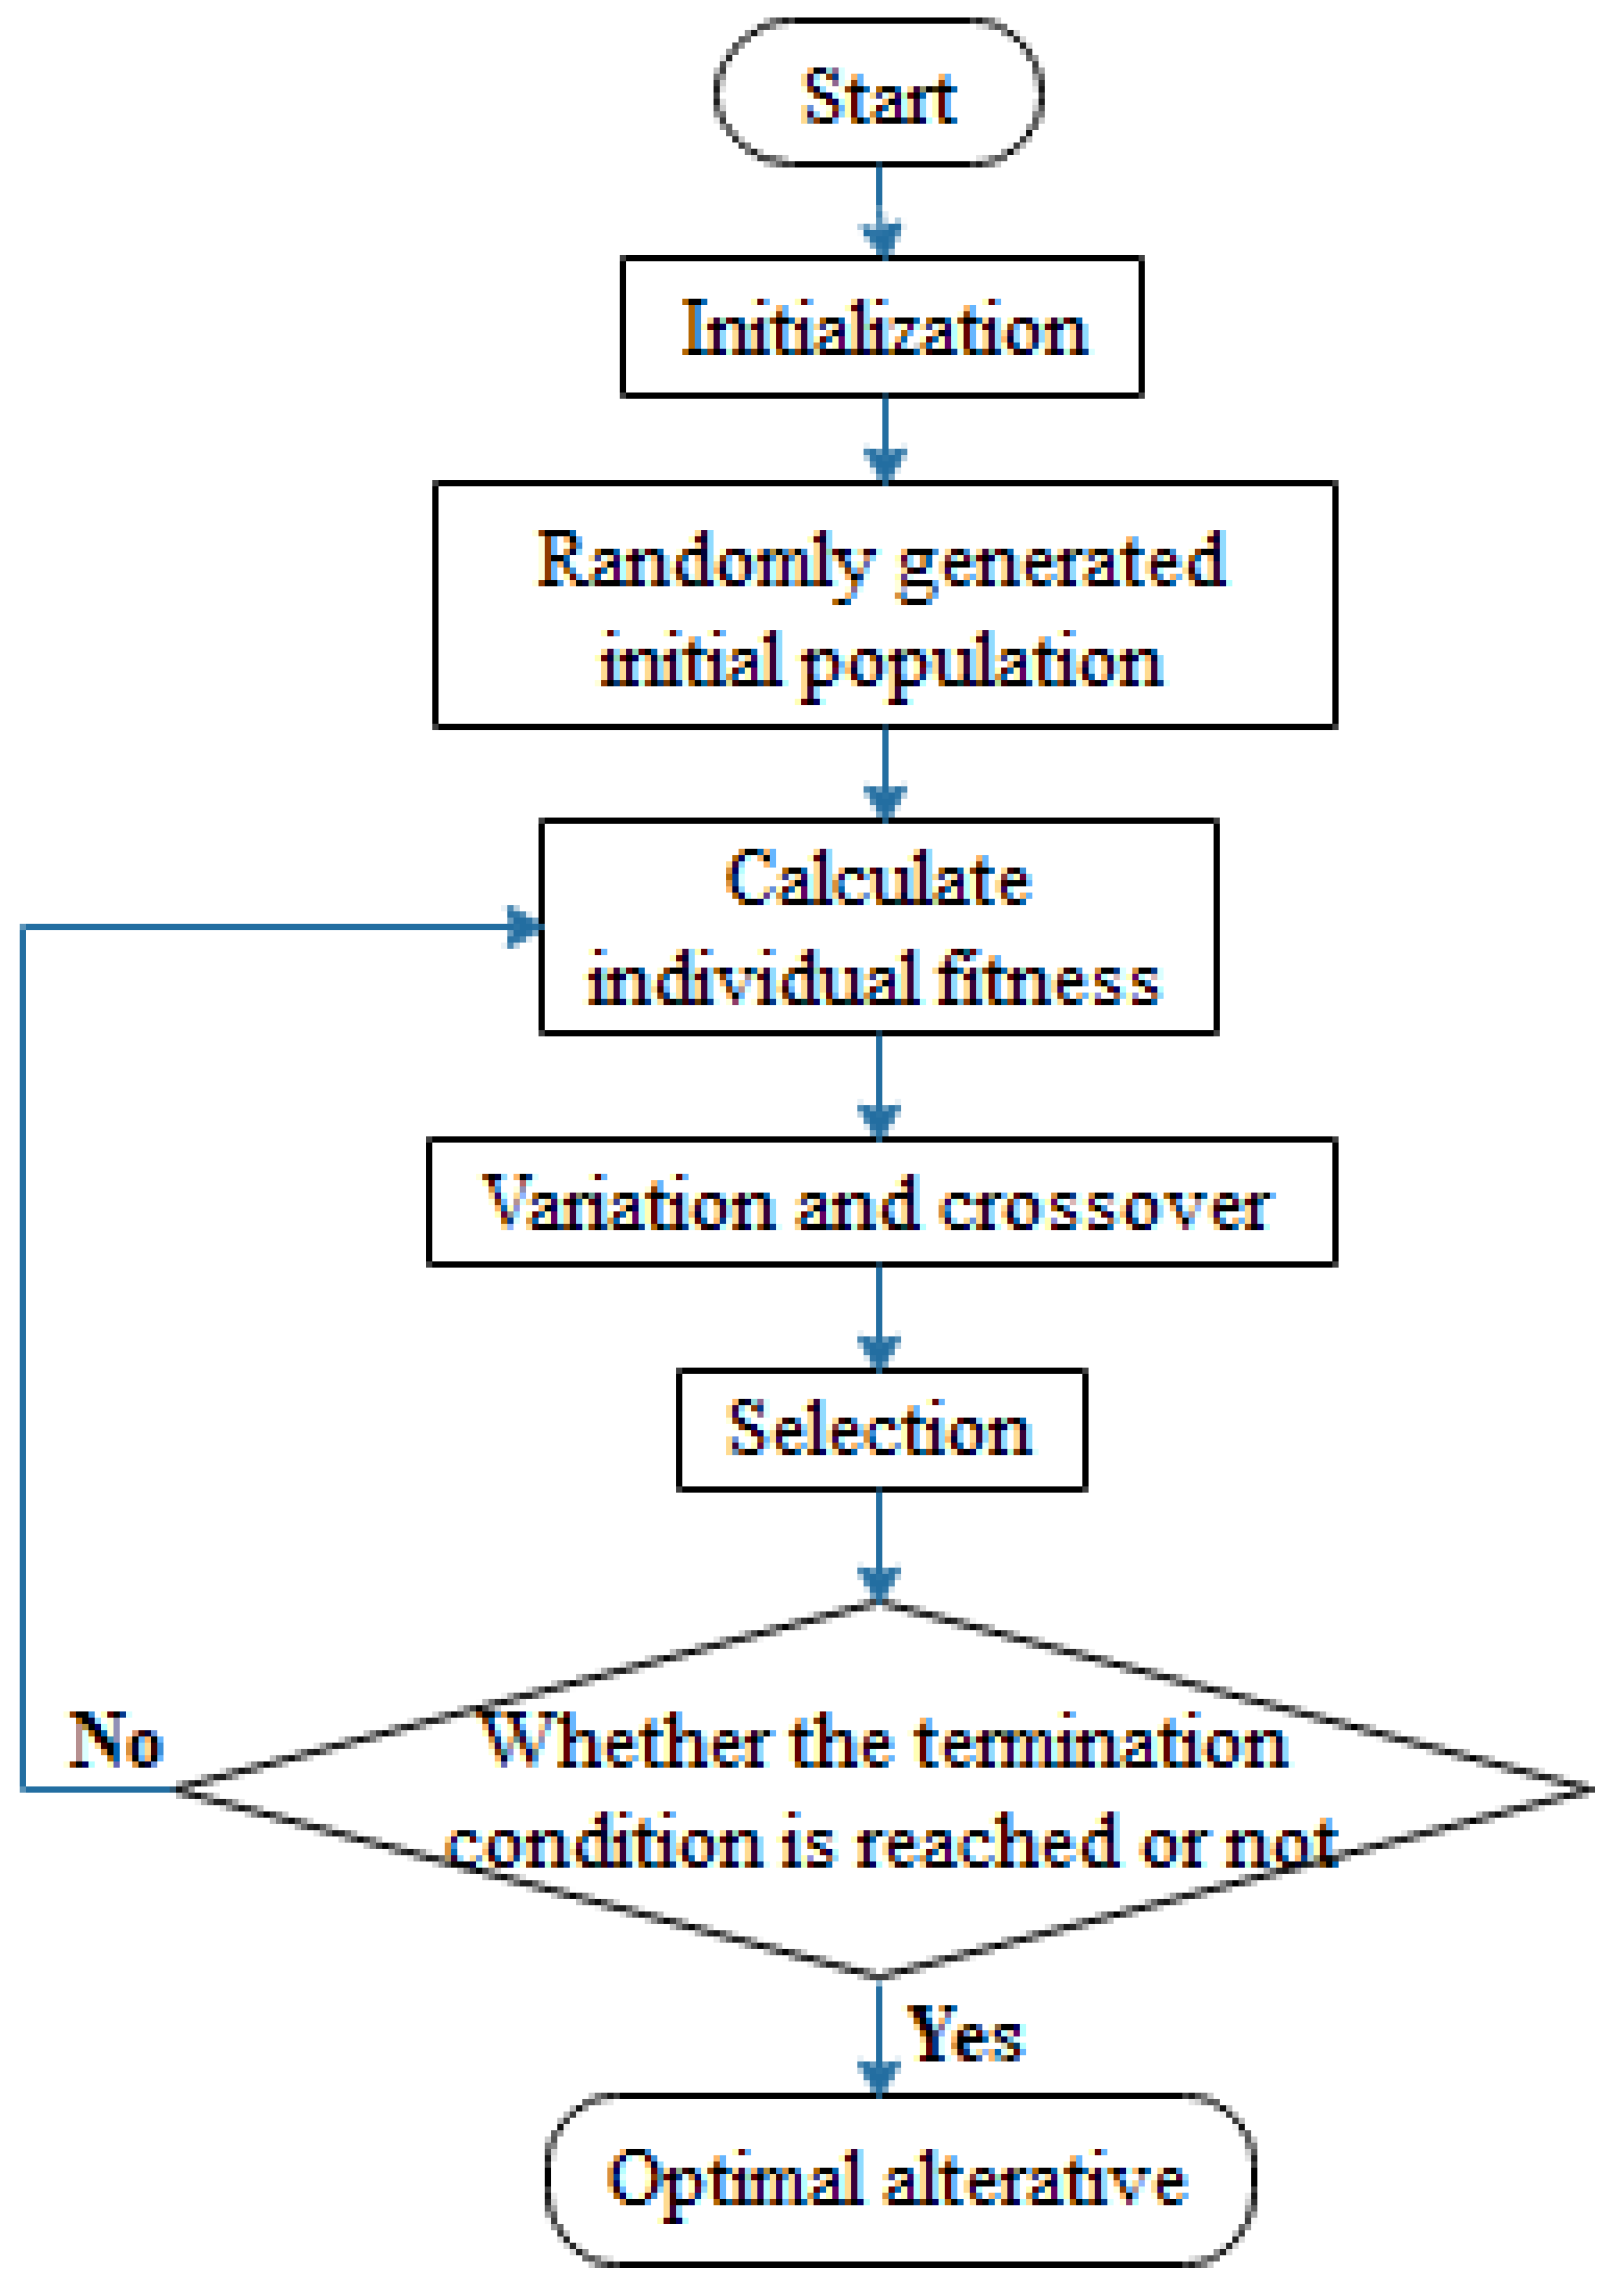
Differential evolution (DE) is a global optimization algorithm. Its basic idea is to optimize the scheme by comparing the differences between populations and adopting the biological theory of “survival of the fittest”, as shown in Figure 7.
(1)
Parameter initialization
The parameters to be initialized in this program are population size, index weights, deviation amplification coefficient (f), crossover coefficient (CR), and shape parameter. Among them, the population number control program randomly generates the number of product design schemes. The index weight is the relative weight of each index. The deviation amplification coefficient is the influence degree of the bias in the population variation. The crossover coefficient refers to the probability of crossover in the population. Shape parameters control the generation rules of a product design scheme.
(2)
Random generation of an initial population
To effectively explain rules for generating product design, in the concept design process of the hypothesis of the n functional requirements, each functional requirement has three possible options available for the design method, which are numbered as 0, 1, 2, respectively. For each functional requirement, one of the corresponding design methods is randomly selected. The composition of the vector generates an initial population; for example, p l a n = [ 0 , 0 , , 0 ] 1 × n . This paper used Python programming to generate several populations and develop tools to achieve the generation of the initial population ( I P ).
(3)
Calculate individual fitness
The individual fitness here refers to the comprehensive benefit of each product design scheme, which is obtained by combining the weight coefficient calculation method.
(4)
Variation
The mutation operation of the differential evolution algorithm is different from that of the genetic algorithm. Three different populations should be randomly selected from the generated populations, and then Equation (16) should be calculated:
V = x 1 + f × ( x 2 x 3 )
where V represents new individuals; x 1 , x 2 , and x 3 represent three individuals randomly selected from the generated population; and f represents the deviation amplification factor. A mutation operation needs to perform the above operations on each individual in the I P , and the three randomly selected individuals cannot be the individuals performing the mutation operations. Therefore, according to this mutation operation, an intermediate population ( U P ) with the same I P number can be generated.
(5)
Cross
Unlike the genetic algorithm, the crossover operation here is the only dimension for the entire population, and the second intermediate population ( V P ) will be generated after crossover. The calculation formula of crossover operation of differential evolution algorithm is given as Equation (17):
I P i j = U P i j         I F   r < CR   or   s = j
where i and j represent the numbers of rows and columns, CR represents the crossover rate, r represents a random decimal between 0 and 1, and s represents a random integer between 0 and D ( D is the number of columns of the population).
(6)
Detection of boundary conditions
The initial population I P becomes the intermediate population V P after mutation and crossover. However, there may be many unqualified individuals in V P , which shall be detected and deleted in this section. In addition, new individuals with the same number of deleted individuals shall be added to V P .
(7)
Choice
According to the greed criterion, the differential evolution algorithm selects individuals from the intermediate population V P as the individuals from the next-generation population I P . The specific selection method is given as Equation (18):
I P i = { V P i I P i       I F   V P i   i s   b e t t e r   t h a n   I P i O t h e r w i s e

5. Case Analysis

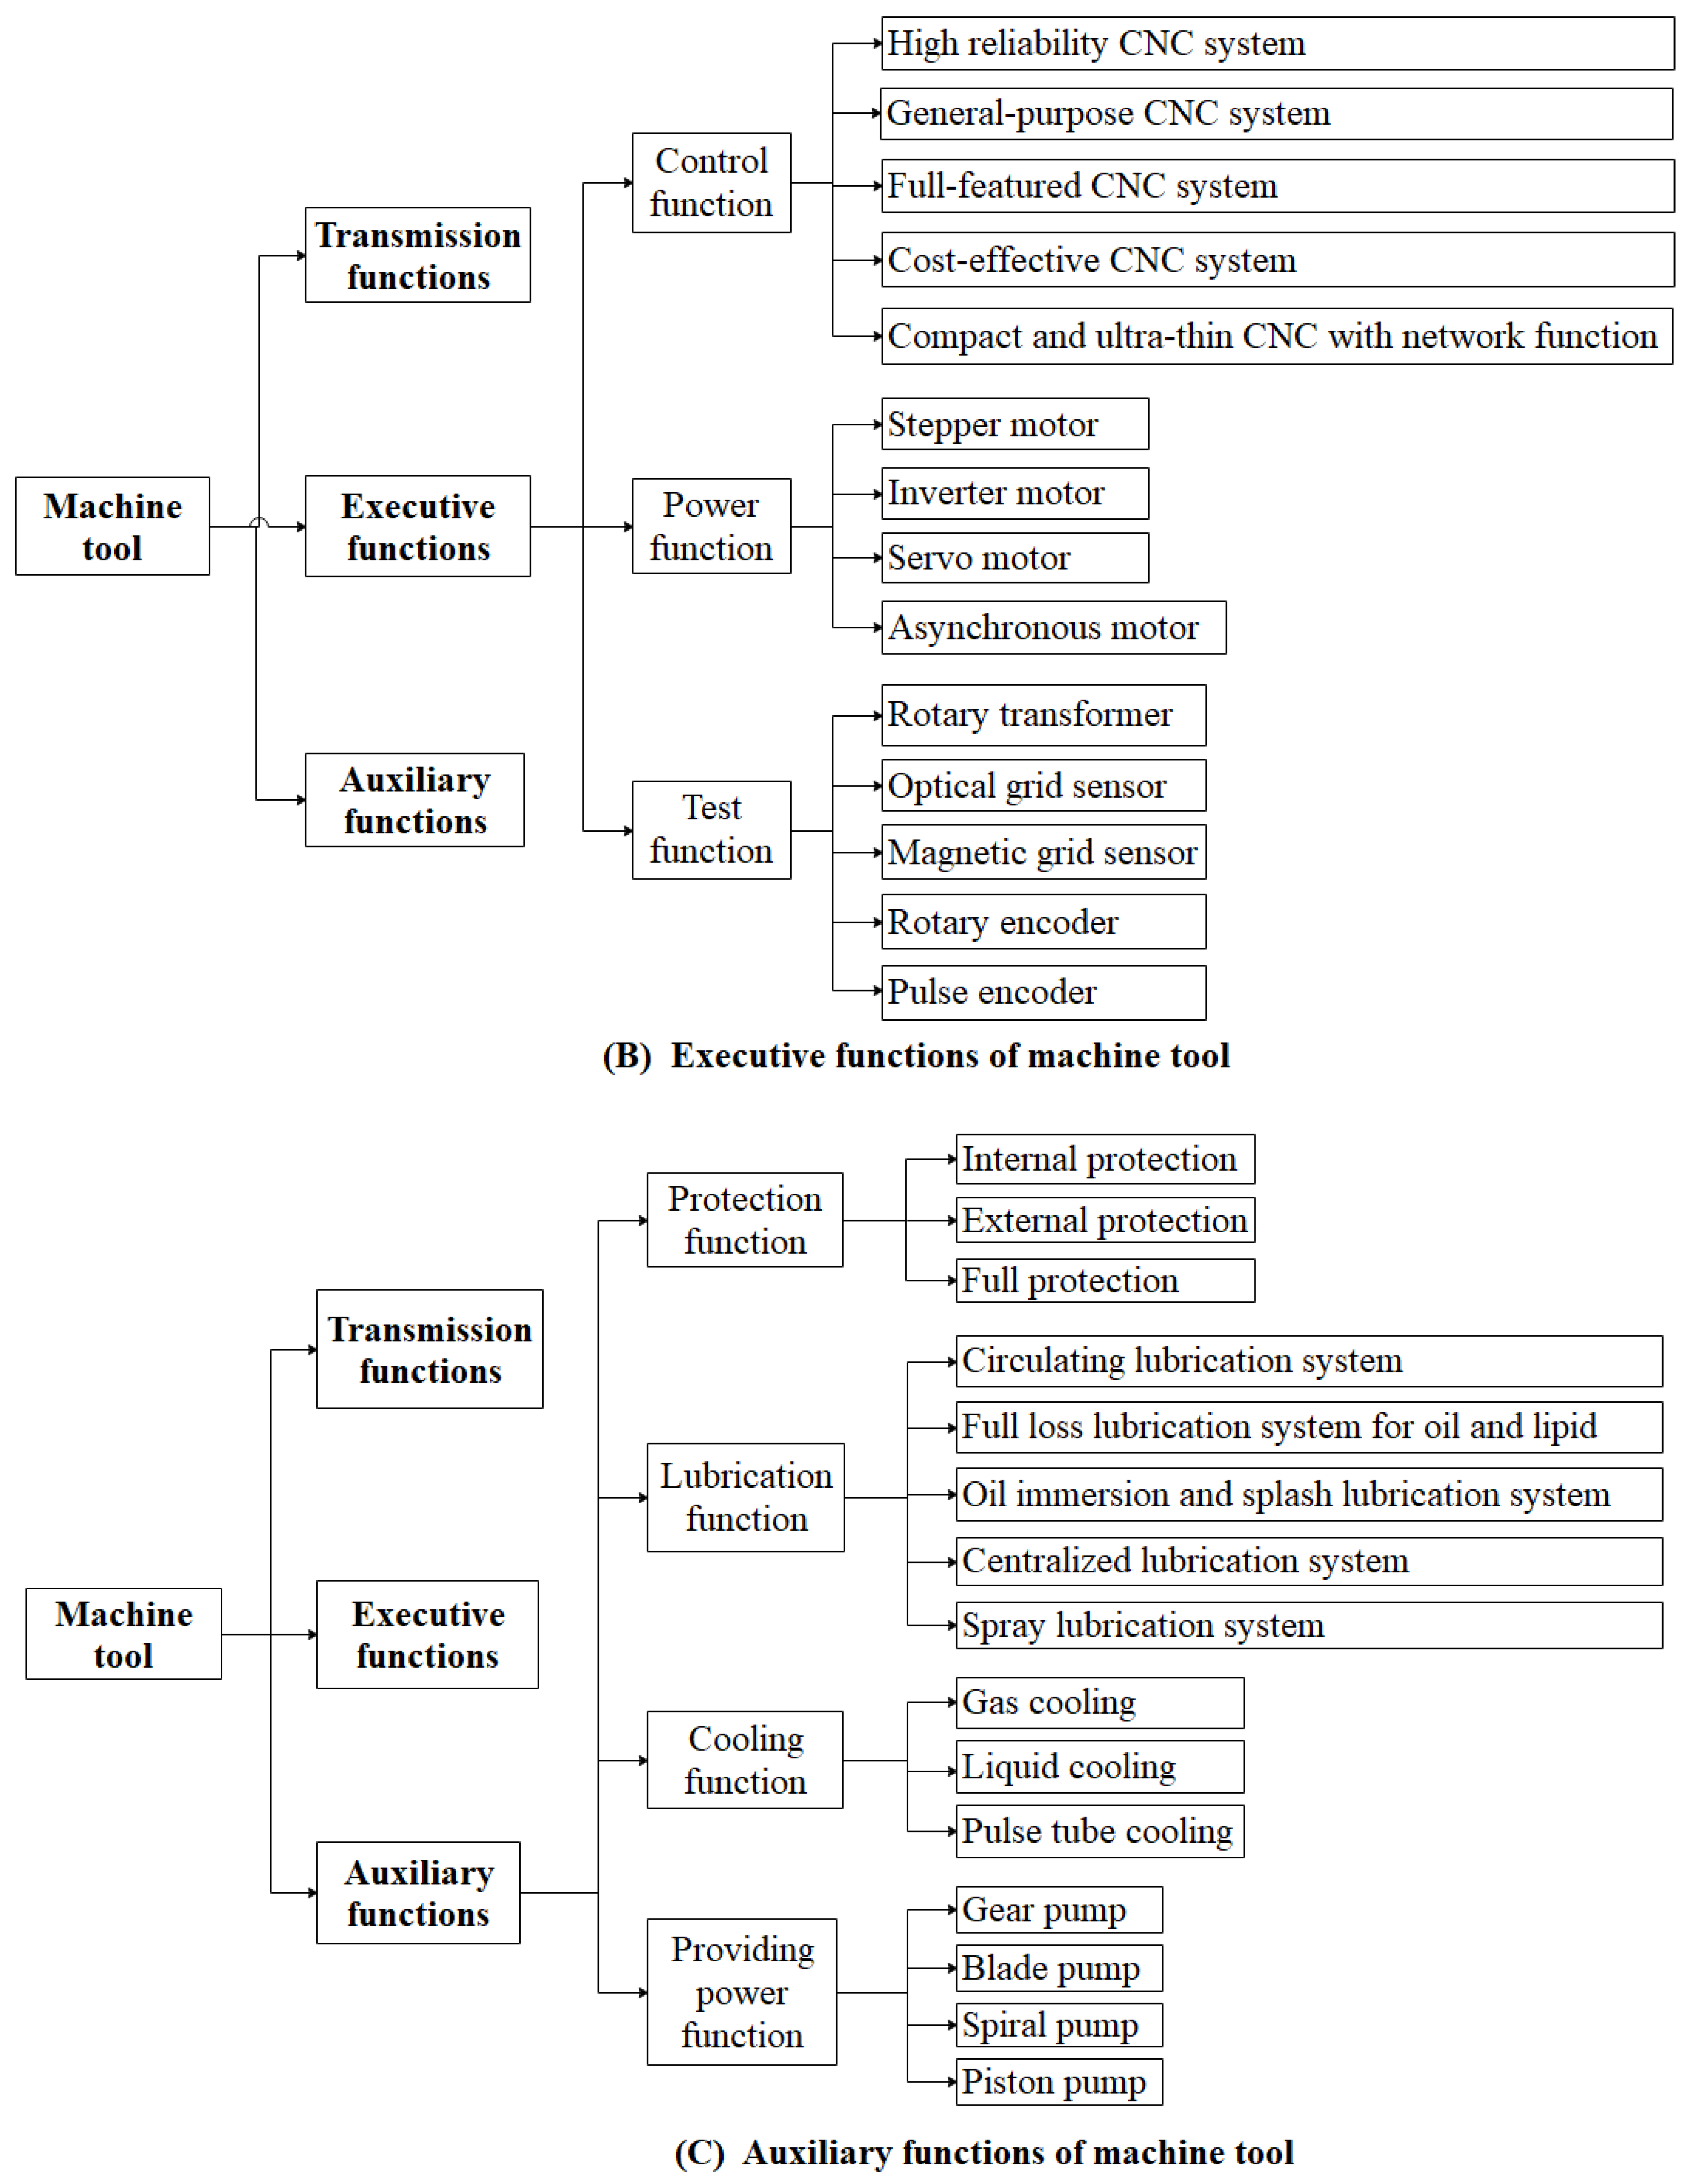
Lathes are commonly used machine tools that rotate work pieces that are turned with turning tools. It is particularly important to take remanufacturability into consideration when designing lathe products. This paper took the lathe as an example to verify the scheme generation and optimization method proposed above and prove its feasibility. Lathes are generally composed of mechanical devices with transmission functions, electrical devices with executive functions, and auxiliary devices with auxiliary functions. The specific structure is shown in Figure 8.

5.1. Scheme Generation Process

(1)
Firstly, the total functional requirements of lathe FR0 were determined, and then the lathe knowledge base was used to analyze the scheme generation process model.
(2)
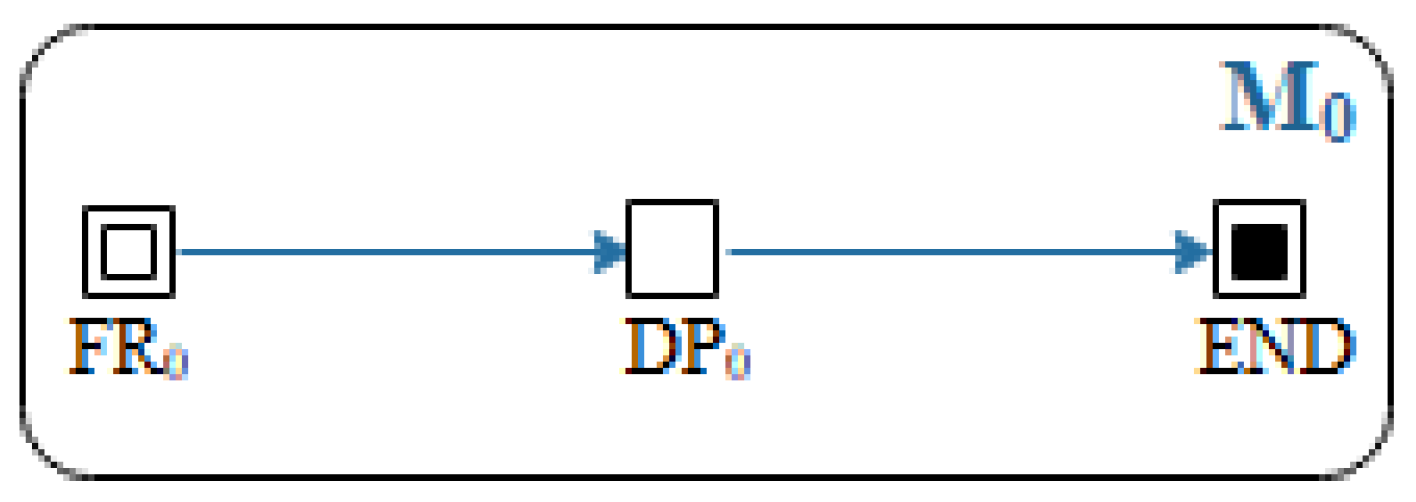
Solve FR0. The scheme generation process M0 is represented in Figure 9, and the total design parameter DP0 was obtained. Table 1 is the list of FR0, while Table 2 is the list of terminal nodes of FR0.
(3)
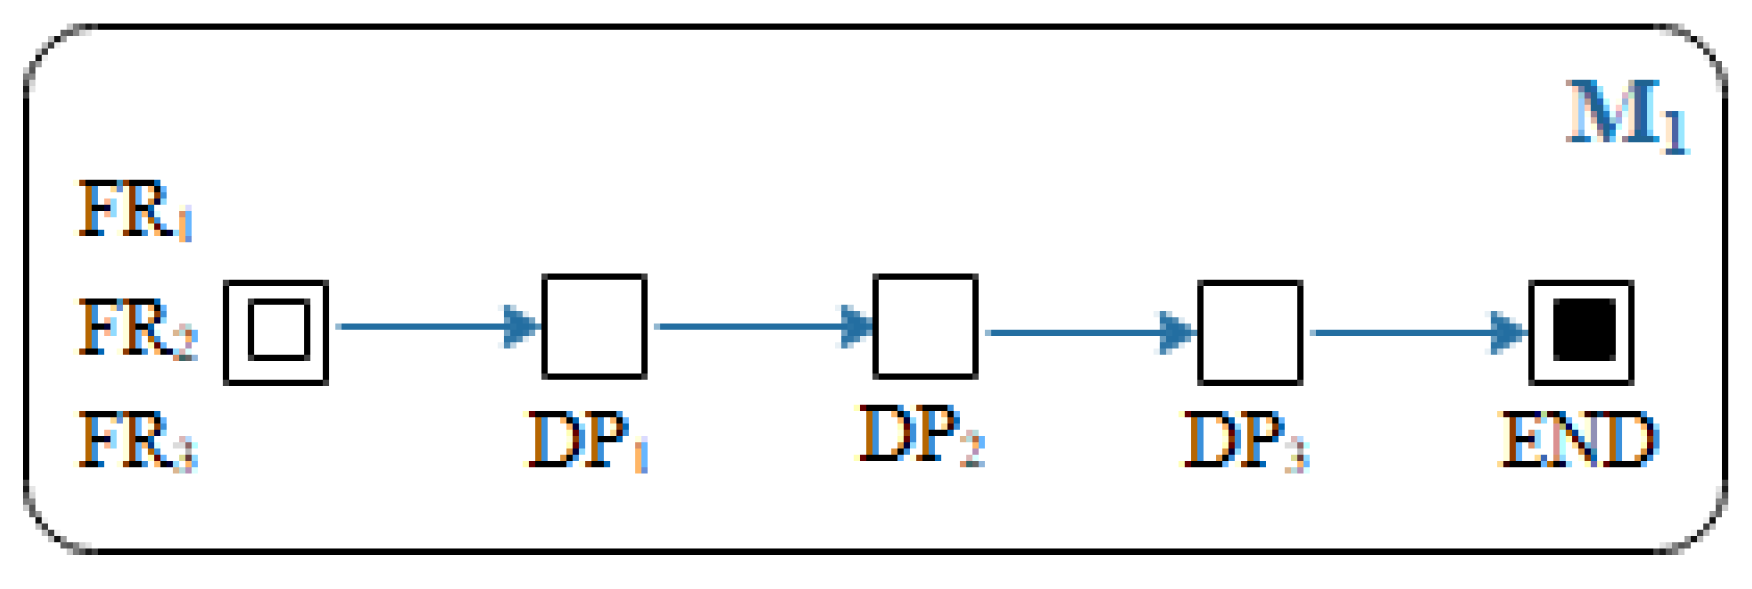
The total function was decomposed using tree topology mapping to obtain the subfunctions FR1, FR2, and FR3. According to the subfunctions, the feasible design parameters DP1, DP2, and DP3 were obtained. Among them, DP1 and DP2 were interrelated with DP2 and DP3. The scheme generation process diagram M1 is shown in Figure 10. Table 3 is the list of FR1, FR2, and FR3; and Table 4 is the list of its terminal nodes.
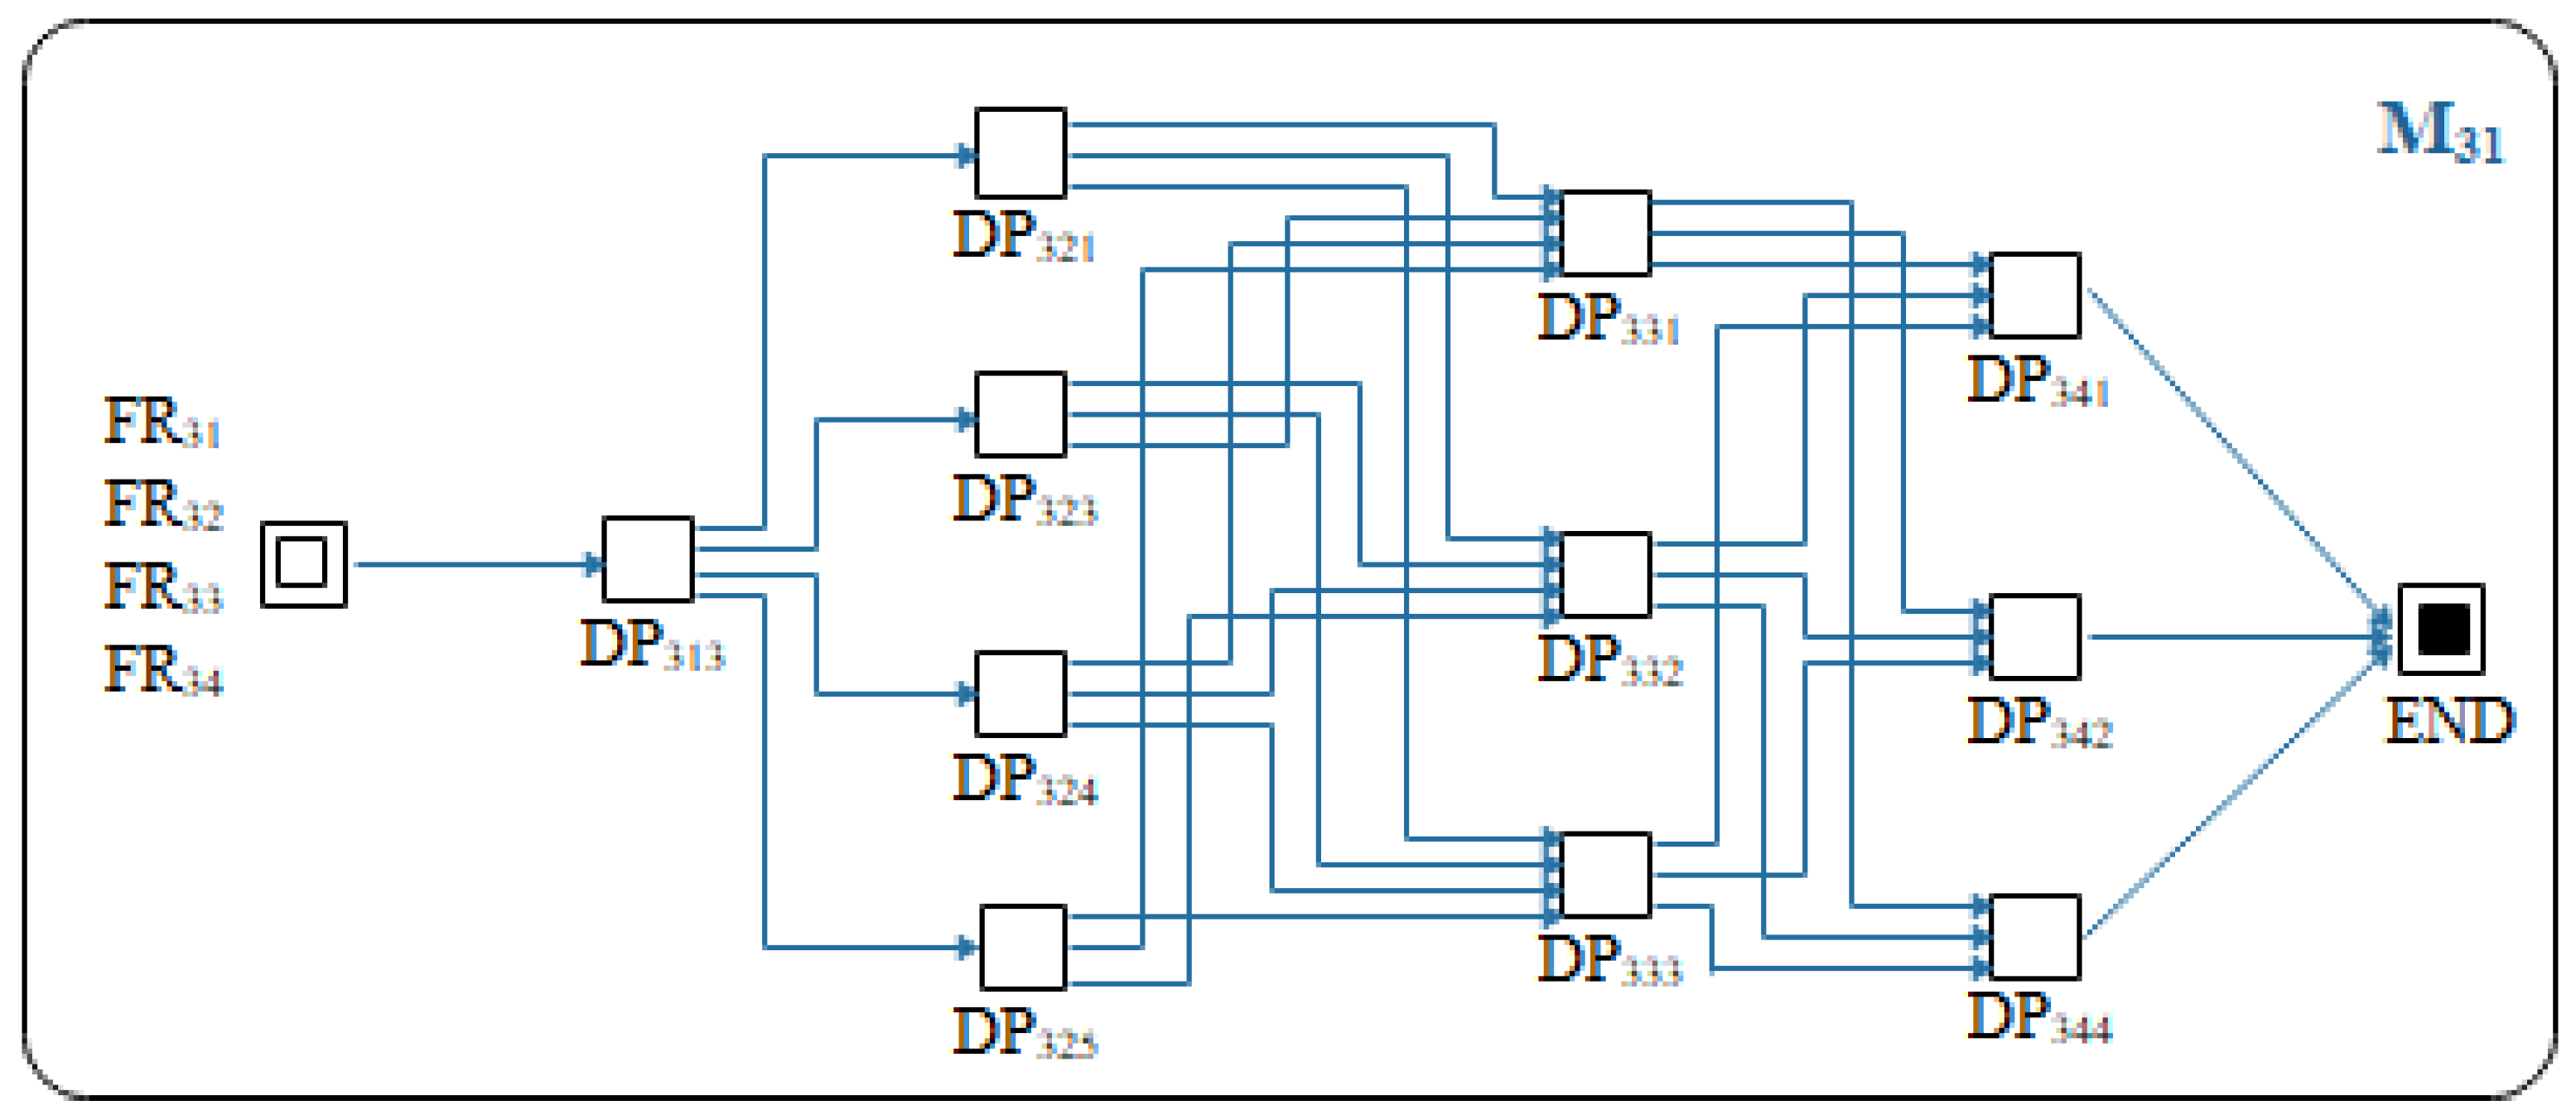
According to the feasible design methods DP1, DP2, and DP3, the subfunctions were further decomposed. DP1 was used to decompose FR1 to obtain the FR11 to FR16 subfunctions, and M11 was established as shown in Figure 11. FR21, FR22, and FR23 were obtained by decomposing FR2 with DP2, and M21 was established, as shown in Figure 12. FR3 was decomposed by DP3 to obtain the FR31 to FR34 subfunctions, and M31 was established as shown in Figure 13.
(1) The possible design methods to meet the requirements of FR11 were DP111, DP112, DP113, DP114, DP115, and DP116. According to the remanufacturability constraint criteria, the feasible design methods were DP111, DP112, and DP114. Similarly, we concluded that the feasible design methods satisfying FR12 were DP121, DP122, DP124, and DP126, and the association matrix B 1 1 shown in Equation (19) satisfying FR11 and FR12 was established.
                                    DP 111           DP 112         DP 114 B 1 1 = [                     x                     x                     x x                     x                     x x                     x                     x x                     x                     x                     ]         DP 121 DP 122 DP 124 DP 126
The feasible design methods for FR13 were DP132, DP134, and DP135, and the association matrix B 1 2 shown in Equation (20) for FR12 and FR13 was established.
                                        DP 121       DP 122       DP 124       DP 126 B 1 2 = [                     x                     x                     x                     x x                     x                     x                     x x                     x                     x                     x                     ]         DP 132 DP 134 DP 135
The feasible design methods satisfying FR14 were DP141, DP142, DP143, and DP145, and the association matrix B 1 3 shown in Equation (21) satisfying FR13 and FR14 was established.
                                      DP 132       DP 134       DP 135 B 1 3 = [                     x                     x                     x x                     x                     x x                     x                     x x                     x                     x                     ]         DP 141 DP 142 DP 143 DP 145
The feasible design methods to satisfy FR15 were DP151, DP152, DP153, and DP154, and the association matrix B 1 4 shown in Equation (22) to satisfy FR14 and FR15 was established.
                                        DP 141       DP 142       DP 143       DP 145 B 1 4 = [                     x                     x                     x                     x x                     x                     x                     x x                     x                     x                     x x                     x                     x                     x                     ]         DP 151 DP 152 DP 153 DP 154
The feasible design methods satisfying FR16 were DP161, DP162, DP163, and DP164, and the association matrix B 1 5 shown in Equation (23) satisfying FR15 and FR16 was established.
                                      DP 151       DP 152       DP 153       DP 154 B 1 5 = [                     x                     x                     x                     x x                     x                     x                     x x                     x                     x                     x x                     x                     x                     x                     ]         DP 161 DP 162 DP 163 DP 164
According to the association matrices B 1 1 , B 1 2 , B 1 3 , B 1 4 , and B 1 5 , incompatible node connections could be obtained. Moreover, the model figure M11 of the schematic generation process diagram was established, as shown in Figure 11. Table 5 is the list of FR11, FR12, FR13, FR14, FR15, and FR16; and Table 6 is the list of its terminal nodes.
(2) The possible design methods for FR21 were DP211, DP212, DP213, DP214, and DP215. According to the remanufacturability constraint criteria, the feasible design methods were DP211, DP212, and DP214. Similarly, DP222, DP223, and DP224 were the feasible design methods to meet the requirements of FR22, and the association matrix B 2 1 shown in Equation (24) to meet the requirements of FR21 and FR22 was established.
                                    DP 211         DP 212         DP 214 B 2 1 = [                     x                     x                     x x                     x                     x x                     x                     x                     ]         DP 222 DP 223 DP 224
The feasible design methods to satisfy FR23 were DP231, DP232, DP233, and DP235, and the association matrix B 2 2 shown in Equation (25) to satisfy FR22 and FR23 was established.
                                          DP 222       DP 223       DP 224 B 2 2 = [                     x                     x                     x x                     x                     x x                     x                     x x                     x                     x                     ]         DP 231 DP 232 DP 233 DP 235
According to the correlation matrices B 2 1 and B 2 2 , the noncompatible node connections were obtained. The model figure M21 of the scheme generation process was established as shown in Figure 12. Table 7 is the list of FR21, FR22, and FR23; and Table 8 is the list of its terminal nodes.
(3) The possible design methods for FR31 were DP311, DP312, and DP313. According to the remanufacturability constraint criteria, DP313 was the feasible design method. Similarly, the feasible design methods satisfying FR32 were DP321, DP323, DP324, and DP325, and the association matrix meeting FR31 and FR32 was established by Equation (26).
                                      DP 313 B 3 1 = [                     x x x x                     ]         DP 321 DP 323 DP 324 DP 325
The feasible design methods to satisfy FR33 were DP331, DP332, and DP333, and the association matrix B 3 2 shown in Equation (27) to satisfy FR32 and FR33 was established.
                                        DP 321       DP 323       DP 324       DP 325 B 3 2 = [                     x                     x                     x                     x x                     x                     x                     x x                     x                     x                     x                     ]         DP 331 DP 332 DP 333
The feasible design methods to satisfy FR34 were DP341, DP342, and DP344, and the association B 3 3 matrix to satisfy FR33 and FR34 was established as shown in Equation (28):
                                      DP 331       DP 332       DP 333 B 3 3 = [                     x                     x                     x x                     x                     x x                     x                     x                     ]         DP 341 DP 342 DP 344
According to the association matrices B 3 1 , B 3 2 , and B 3 3 , basically incompatible node connections were obtained. Therefore, the schematic generation process diagram for M31 was established, as shown in Figure 13. Table 9 is the list of FR31, FR32, FR33, and FR34; and Table 10 is the list of its terminal nodes.
According to the above process, multiple alternative drawings such as M1, M11, M21 and M31 were obtained, and the overall design scheme set was obtained by sorting them as shown in Figure 14.

5.2. Scheme-Optimization Process

The weight coefficient of the comprehensive performance evaluation of product design schemes is usually determined jointly by enterprises and consumers. Considering the familiarity of stakeholders with lathe design, six designers and four equipment users from the remanufacturing company were selected to form a group of experts. A 10-expert group evaluated the four indicators of the lathe design scheme, including functionality, economy, stability, and environment; the comparison matrix is shown in Table 11.
Based on the above comparison matrix, the EW-AHP method was used to calculate the weight coefficients of the four indicators, and the results were as follows ( α = 0.5 ):
w E W = { 0.0241 , 0.2706 , 0.5514 , 0.1538 }
w A H P = { 0.1509 , 0.2821 , 0.3387 , 0.2283 }
w W e i g h t s = { 0.0875 , 0.2764 , 0.4451 , 0.1911 }
The research group took the above feasible design methods as the research object, and the functionality, cost, failure rate, and environmental impacts of the design methods as the research objective to collect all the data needed to realize the optimization of the design methods. The functional and environmental data were collected through a questionnaire survey, and the cost and failure rate were collected through market research and network channels. The obtained data are shown in Table 12.
In order to simplify the program editing and optimize the efficiency of the algorithm, the data in the above table were preprocessed. The steps were as follows: (1) convert {A, B, C, D, E} in the functional data into {1, 0.75, 0.5, 0.25, 0} accordingly; (2) the functional, failure rate, and environmental data were transformed into a 4 × 12 matrix in a specific order. The nodes were numbered according to the possible schemes. When there were only three feasible design methods for a certain function, 0 was used to supplement it. In order to meet the market demand for machine tools and improve the degree of remanufacturability, with this as the product design goal, the possible design schemes to achieve each function were sorted, and the final system design scheme was optimized according to the constraint conditions.
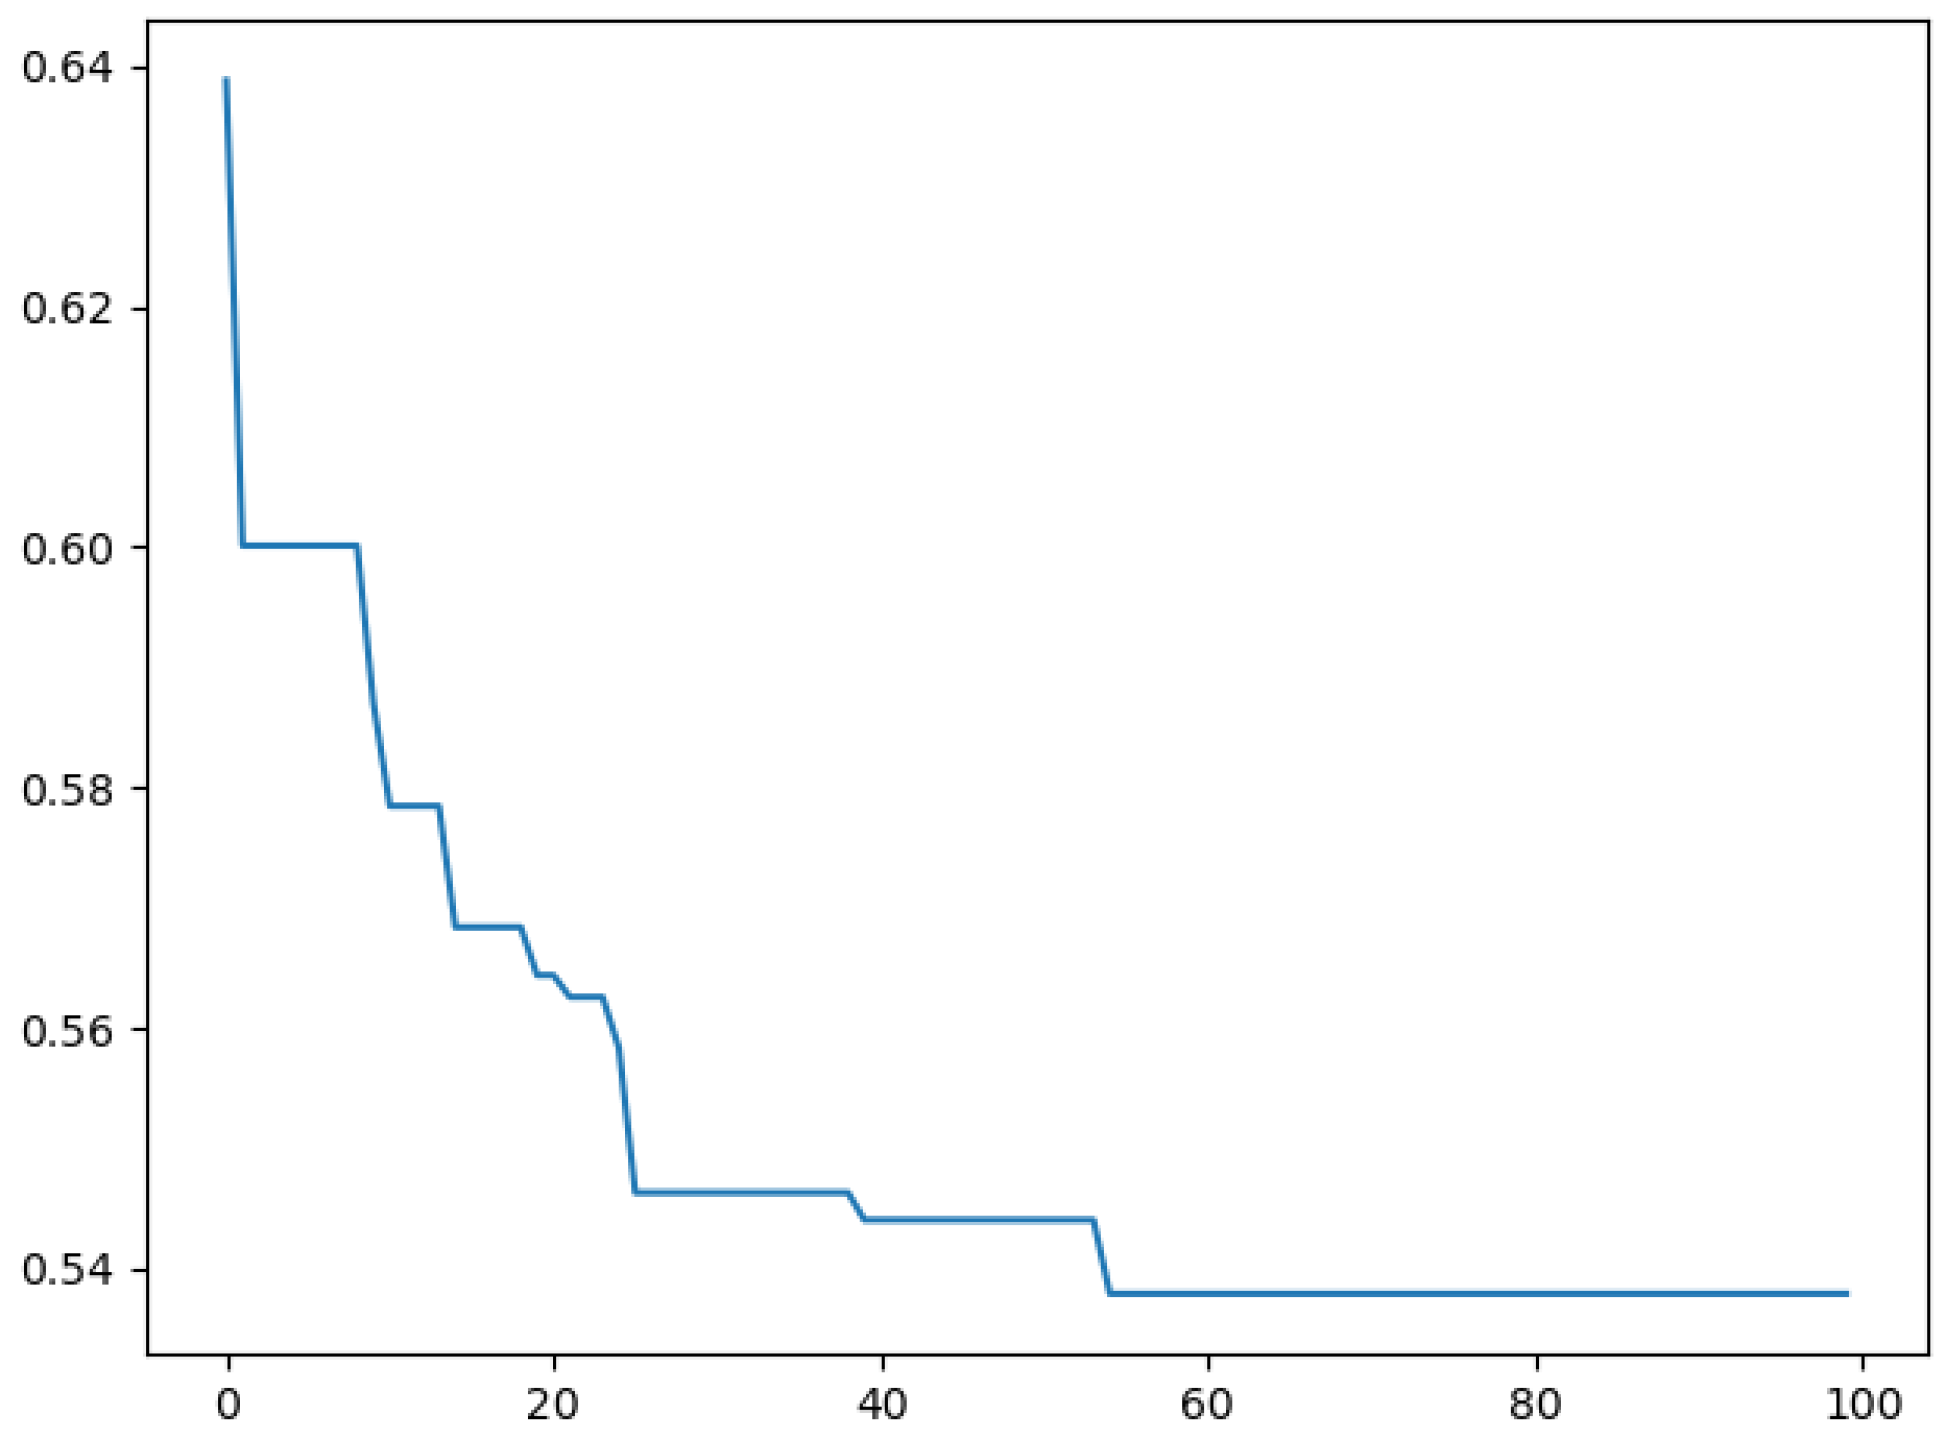
According to the optimization method proposed in Section 3, each individual in the population was comprehensively evaluated, which was taken as the loss function. A differential evolution algorithm was applied to perform mutation, crossover, and selection operations for each individual within the scope of the population, and the continuous iteration was carried out until the number of iterations reached the predetermined target 100 times. Finally, Python language 3.8. 3 (created by Guido van Rossum, Netherlands) was used to write and run the scheme-optimization program. The final optimization result is shown in Table 13, and the optimization process is shown in Figure 15.
As shown in Figure 15, the differential evolution algorithm could complete the convergence before the 60th generation, and the loss function did not show any repeated fluctuations. Therefore, the difference algorithm had a high stability and convergence. The optimal product design scheme while considering remanufacturability after convergence was [0 1 0 2 3 0 0 3 0 0 0 0 0], as shown in Figure 16.

6. Discussion

Traditional product design is based on market demand, while sustainable development such as reuse of resources is neglected, resulting in a large amount of resource waste and serious environmental pollution. In this paper, the remanufacturability of products was considered as the starting point, and the mapping between product functions and methods was realized by using a tree topology structure, generating many product possibilities. Finally, an entropy weight method was combined with AHP, and a differential evolution algorithm was used to optimize the product design scheme while considering remanufacturability. The case study results showed that the comprehensive benefits of the candidate design schemes were quite different. Figure 16 shows that the machine tool design scheme in this study was taken as the object to realize the optimal selection while considering product functionality, economy, stability, and environmental benefits. Although this study had some achievements, it still had some limitations, as follows:
(1)
Research on remanufacturability of existing products mainly relies on the accumulation of knowledge and experience of designers, and there is no unified evaluation standard, resulting in a strong subjectivity of such research. Future research can be undertaken for objective remanufacturability constraint criteria to increase the accuracy of decision making.
(2)
The four evaluation indicators established were only judged by simple formulas without a detailed explanation of each index. Future research can put forward more detailed evaluation indicators to further improve the accuracy of judgment.
(3)
The case analysis only considered the optimization of a machine tool remanufacturability design scheme, and the amount of data was small, resulting in a final fitting result that may not have been the optimal result. The employment of big data analtyics in the future will provide the possibility of building a more comprehensive, stable, efficient, and intelligent product design scheme optimization.

7. Conclusions

Product design, including the generation and optimization of schemes, is a very important step in manufacturing. Based on the analysis of functional requirements of product market and basic design principles, an optimization model of a product design scheme while considering remanufacturability was put forward that improved the remanufacturability of waste products and has profound practical and theoretical significance for realizing green and sustainable development of resources and the environment. The main contributions of this paper were as follows:
(1)
The Z-shaped mapping in axiomatic design was improved to a tree topology mapping process, which not only took axiomatic design as the guiding principle, but also provided the functional domains to the specific implementation method of the domain method. Based on a certain knowledge base, the entire scheme-generation process was guided, and the hierarchical relationship and mapping process of FRS and DPS were clearly expressed.
(2)
Aiming at the problem that product design does not consider the inherent value of end-of-life products, remanufacturing was integrated into product design, and the remanufacturing constraint criteria were established to limit the method decisions in the process of scheme generation. Remanufacturing was considered in the stage of product design to improve the remanufacturability, thus reducing resource waste and environmental pollution.
(3)
The combination of EW and AHP was used to calculate the weight of the index, the differential evolution algorithm was used to optimize the scheme, the “survival of the fittest” was used to guide the search to identify the optimal solution, and the Python programming language was used to automatically solve the optimization design scheme.
In this study, the optimal product design scheme for remanufacturing was considered as the objective, and the feasibility of the proposed model was verified by taking a machine tool design scheme as an example. However, the research method still mainly relied on the knowledge and experience of experts or designers, and the overall method lacked consideration of machine learning. Therefore, future research will be devoted to the study of an intelligent, data-based, and reliable systematic design scheme.

Author Contributions

S.X.: Conceptualization, Data curation, Writing—original draft, Formal analysis; Z.J.: Conceptualization, Supervision; X.Z.: Conceptualization, Supervision, Methodology; Y.W.: Conceptualization, Supervision. All authors have read and agreed to the published version of the manuscript.

Funding

This work was supported by National Natural Science Foundation of China (grant number 52075396) and the National Key R&D Program of China (grant number 2018YFB2002103).

Institutional Review Board Statement

Not applicable.

Informed Consent Statement

Not applicable.

Data Availability Statement

Not applicable.

Conflicts of Interest

The authors declare no conflict of interest.

References

  1. Zhang, X.G.; Ao, X.Y.; Jiang, Z.G.; Zhang, H.; Cai, W. A remanufacturing cost prediction model of used parts considering failure characteristics. Robot. Comput. Integr. Manuf. 2019, 59, 291–296. [Google Scholar] [CrossRef]
  2. Liu, Q.T.; Shang, Z.Y.; Ding, K.; Guo, L.; Zhang, L. Multi-process routes based remanufacturability assessment and associated application on production decision. J. Clean. Prod. 2019, 240, 118114. [Google Scholar] [CrossRef]
  3. Peters, K. Methodological issues in life cycle assessment for remanufactured products: A critical review of existing studies and an illustrative case study. J. Clean. Prod. 2016, 126, 21–37. [Google Scholar] [CrossRef]
  4. Fatimah, Y.A.; Biswas, W.K. Sustainability Assessment of Remanufactured Computers. Procedia CIRP 2016, 40, 150–155. [Google Scholar] [CrossRef] [Green Version]
  5. Christophe, F.; Bernard, A.; Coatanéa, É. RFBS: A model for knowledge representation of conceptual design. CIRP Ann. Manuf. Technol. 2010, 59, 155–158. [Google Scholar] [CrossRef]
  6. Deng, Y.M.; Zhu, Y.W. Function to structure/material mappings for conceptual design synthesis and their supportive strategies. Int. J. Adv. Manuf. Technol. 2009, 44, 1063–1072. [Google Scholar] [CrossRef]
  7. Yang, T.; Gao, X.; Dai, F. New Hybrid AD Methodology for Minimizing the Total Amount of Information Content: A Case Study of Rehabilitation Robot Design. Chin. J. Mech. Eng. 2020, 33, 86. [Google Scholar] [CrossRef]
  8. Sarath, C.; Renjith, K.; Park, G. A Design Framework for Additive Manufacturing: Integration of Additive Manufacturing Capabilities in the Early Design Process. Int. J. Precis. Eng. Manuf. 2020, 21, 329–345. [Google Scholar]
  9. Li, W.J.; Song, Z.H.; Mao, E.R.; Suh, S. Using Extenics to Describe Coupled Solutions in Axiomatic Design. J. Eng. Des. 2019, 30, 1–31. [Google Scholar] [CrossRef]
  10. Ren, S.D.; Gui, F.Z.; Zhao, Y.W.; Xie, Z.W. Accelerating preliminary low-carbon design for products by integrating TRIZ and Extenics methods. Adv. Mech. Eng. 2017, 9, 1–18. [Google Scholar] [CrossRef] [Green Version]
  11. Yeo, S.H.; Mak, M.W.; Balon, S.A.P. Analysis of decision-making methodologies for desirability score of conceptual design. J. Eng. Des. 2004, 15, 195–208. [Google Scholar] [CrossRef]
  12. Lin, M.C.; Wang, C.C.; Chen, M.S.; Chang, C.A. Using AHP and TOPSIS approaches in customer-driven product design process. Comput. Ind. 2008, 59, 17–31. [Google Scholar] [CrossRef]
  13. Wan, L.; Du, C. An approach to evaluation of environmental benefits for ecological mining areas based on ant Colony algorithm. Earth Sci. Inform. 2021, 14, 797–808. [Google Scholar] [CrossRef]
  14. Wang, H.; Jiang, Z.G.; Zhang, X.G.; Wang, Y.N. A fault feature characterization based method for remanufacturing process planning optimization. J. Clean. Prod. 2017, 161, 708–719. [Google Scholar] [CrossRef]
  15. Yan, J.F.; Guo, C.F. An Improved Differential Evolution and Its Application in Function Optimization Problem. Adv. Mat. Res. 2011, 267, 632–634. [Google Scholar] [CrossRef]
  16. Hatcher, G.D.; Ijomah, W.L.; Windmill, J.F.C. Design for remanufacture: A literature review and future research needs. J. Clean. Prod. 2011, 19, 2004–2014. [Google Scholar] [CrossRef]
  17. Omwando, T.A.; Otieno, W.A.; Farahani, S.; Ross, A.D. A Bi-Level fuzzy analytical decision support tool for assessing product remanufacturability. J. Clean. Prod. 2018, 174, 1534–1549. [Google Scholar] [CrossRef]
  18. Jiang, Z.G.; Wang, H.; Zhang, H.; Wang, Y.; Gong, Q.S. Hybrid Multi-attribute Decision Making for Remanufacturing Design Based on Subjectivity Reduction. J. Nanjing Univ. Aeronaut. Astronaut. 2020, 52, 73–78. [Google Scholar]
  19. Ijomah, W.L.; Mcmahon, C.A.; Hammond, G.P. Development of robust design-for-remanufacturing guidelines to further the aims of sustainable development. Int. J. Prod. Res. 2007, 45, 4513–4536. [Google Scholar] [CrossRef]
  20. Chiodo, J.D.; Ijomah, W.L. Use of active disassembly technology to improve remanufacturing productivity: Automotive application. Int. J. Comput. Integr. Manuf. 2014, 27, 361–371. [Google Scholar] [CrossRef]
  21. Soh, S.L.; Ong, S.L.; Nee, A.Y.C. Design for assembly and disassembly for remanufacturing. Assem. Autom. 2016, 36, 12–24. [Google Scholar] [CrossRef]
  22. Geda, M.W.; Kwong, C.K.; Jiang, H. Fastening method selection with simultaneous consideration of product assembly and disassembly from a remanufacturing perspective. Int. J. Adv. Manuf. Technol. 2019, 101, 1481–1493. [Google Scholar] [CrossRef]
  23. Fegade, V.; Shrivatsava, R.L.; Kale, A.V. Design for Remanufacturing: Methods and their Approaches. Mater. Today Proc. 2015, 2, 1849–1858. [Google Scholar] [CrossRef]
  24. Wu, C.H. Product-design and pricing strategies with remanufacturing. Eur. J. Oper. Res. 2012, 222, 204–215. [Google Scholar] [CrossRef]
  25. Zhang, X.G.; Tang, Y.J.; Zhang, H.; Jiang, Z.G.; Cai, W. Remanufacturability evaluation of end-of-life products considering technology, economy and environment: A review. Sci. Total Environ. 2021, 764, 142922. [Google Scholar] [CrossRef]
  26. Zhang, X.G.; Wang, Y.L.; Xiang, Q.; Zhang, H.; Jiang, Z.G. Remanufacturability evaluation method and application for used engineering machinery parts based on fuzzy-EAHP. J. Manuf. Syst. 2020, 57, 133–147. [Google Scholar] [CrossRef]
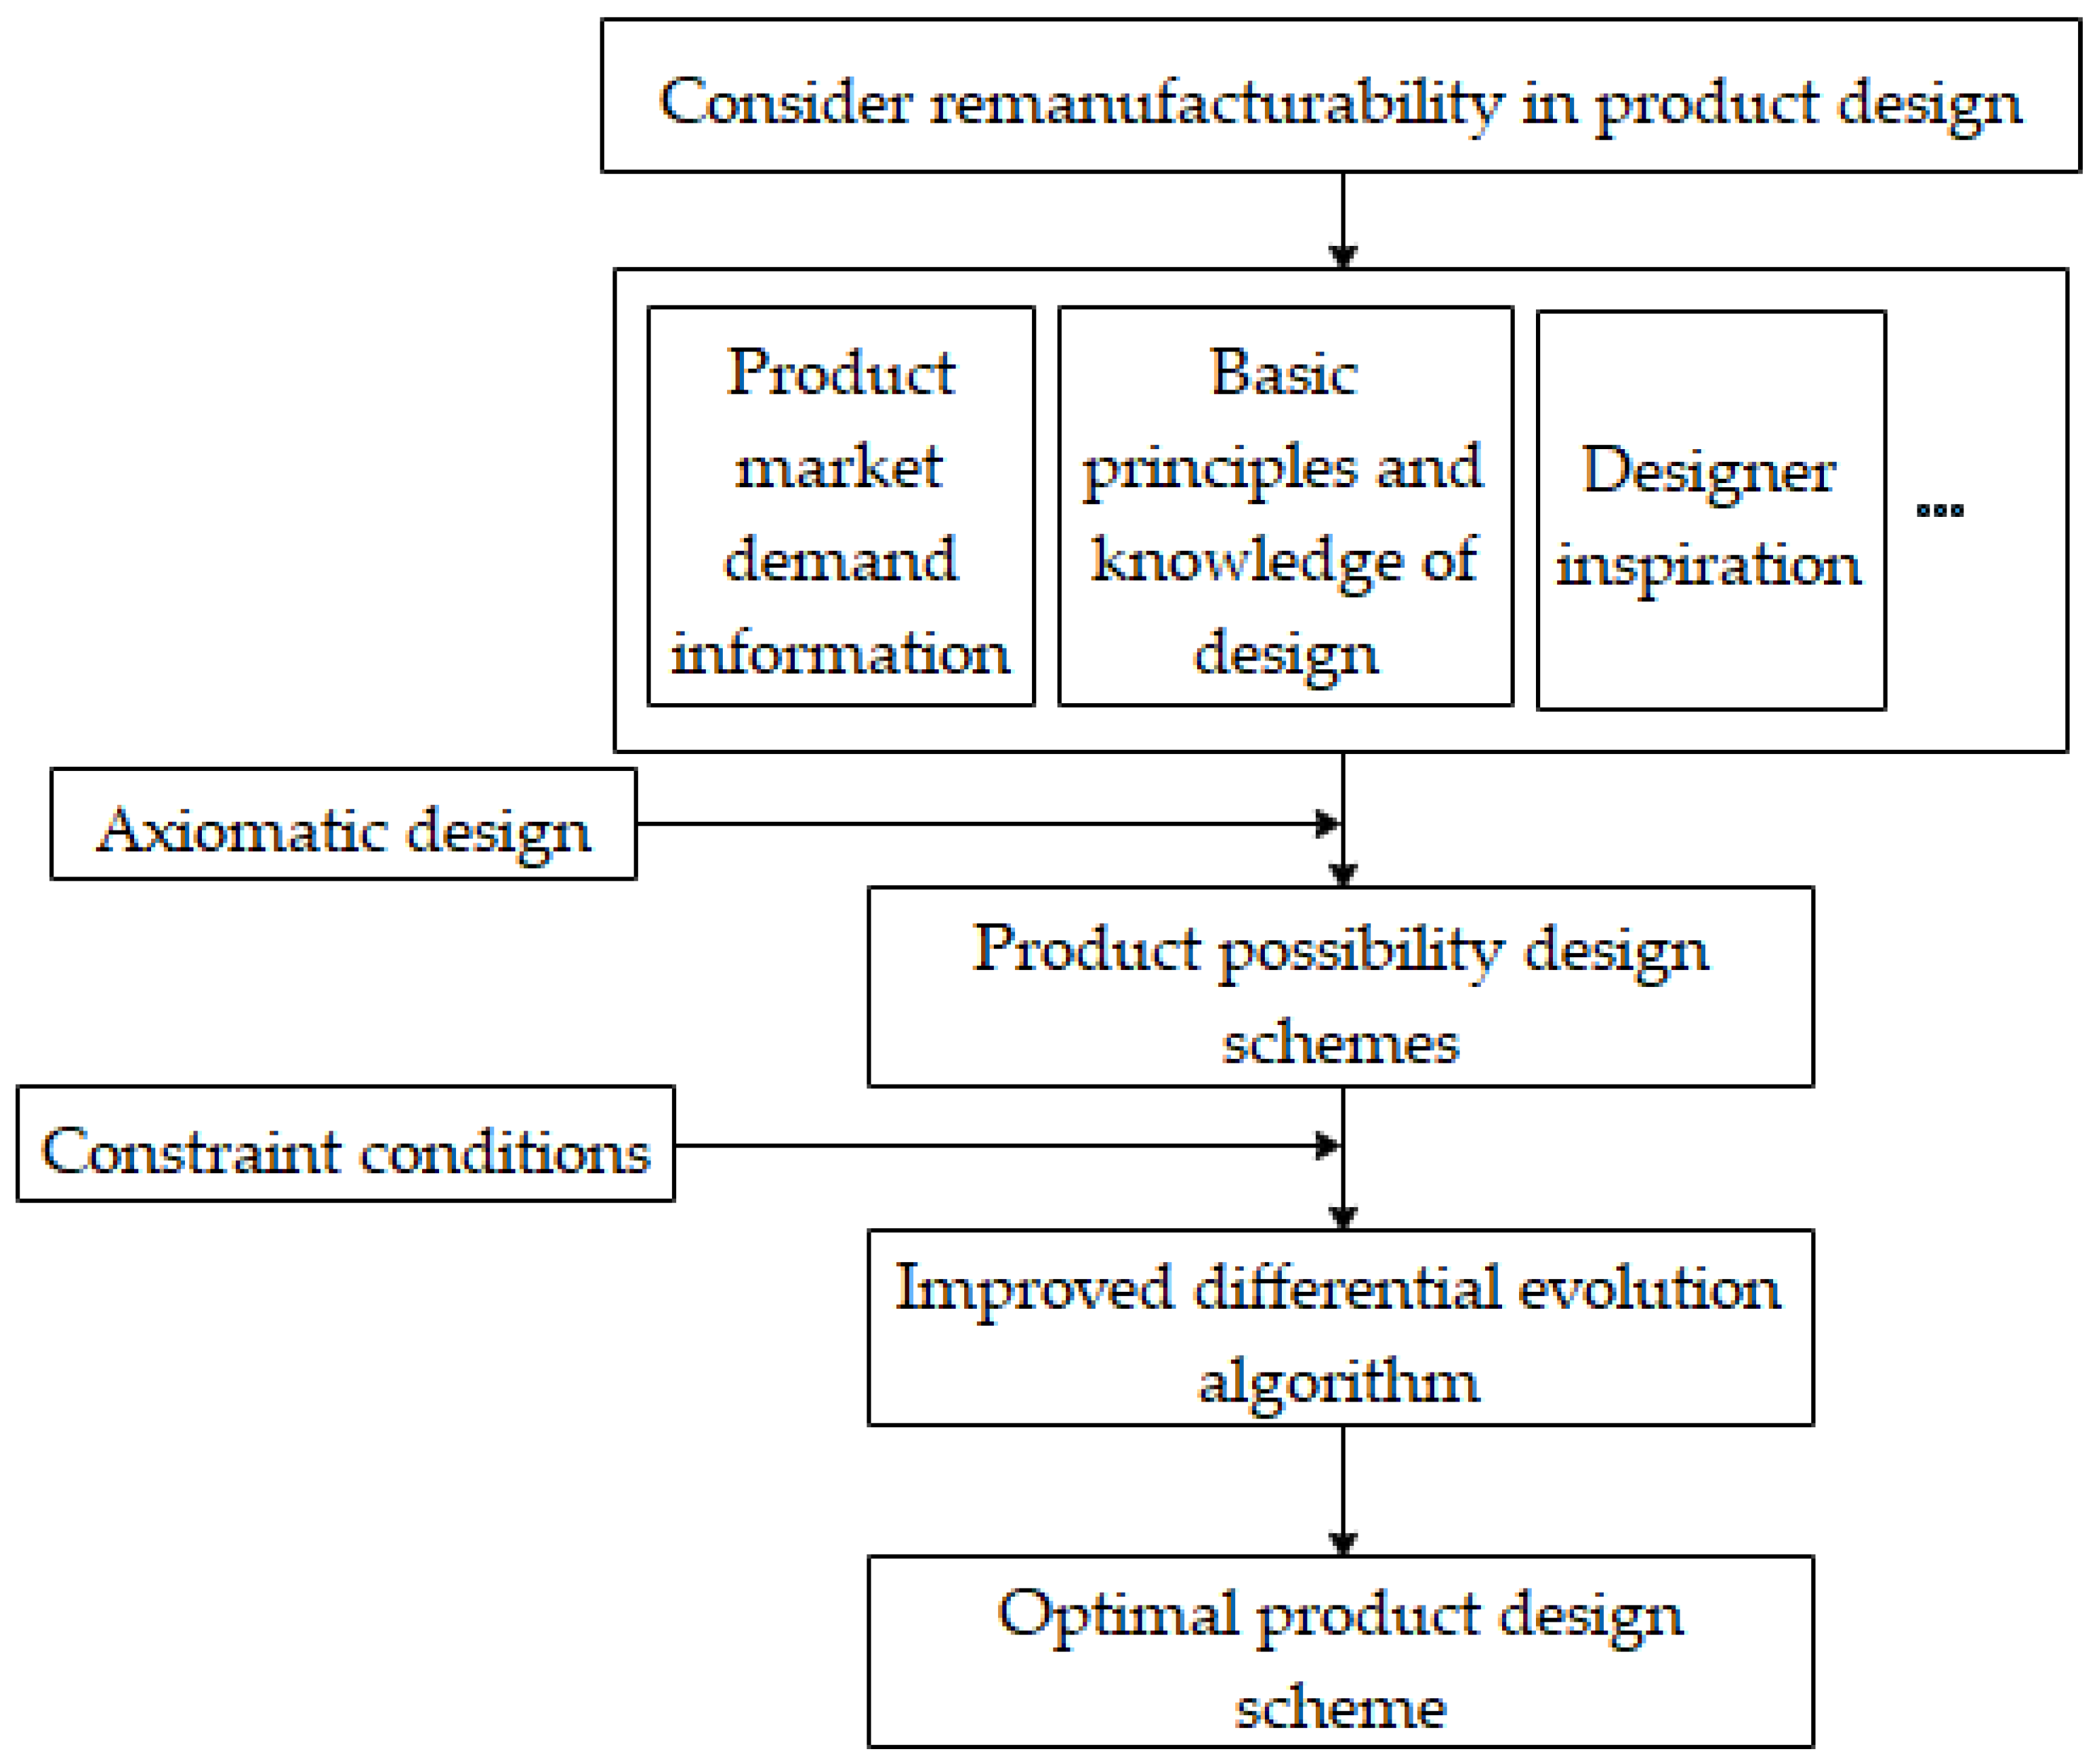
Figure 1. Product design optimization process while considering remanufacturing.
Mathematics 10 02477 g001
Figure 2. Functional method tree diagram.
Mathematics 10 02477 g002
Figure 3. Tree topology mapping process.
Mathematics 10 02477 g003
Figure 4. A three-stage product design process that considers remanufacturability.
Mathematics 10 02477 g004
Figure 5. The scheme generation process based on tree topological mapping.
Mathematics 10 02477 g005
Figure 6. The design criterion diagram while considering remanufacturability.
Mathematics 10 02477 g006
Figure 7. Differential evolution algorithm program block diagram.
Mathematics 10 02477 g007
Figure 8. Lathe knowledge base.
Mathematics 10 02477 g008aMathematics 10 02477 g008b
Figure 9. Schematic generation process diagram of FR0.
Mathematics 10 02477 g009
Figure 10. Schematic generation process diagram for FR1, FR2, and FR3.
Mathematics 10 02477 g010
Figure 11. Schematic generation process diagram of FR11, FR12, FR13, FR14, FR15, and FR16.
Mathematics 10 02477 g011
Figure 12. Schematic generation process diagram of FR21, FR22, and FR23.
Mathematics 10 02477 g012
Figure 13. Schematic generation process diagram of FR3s.
Mathematics 10 02477 g013
Figure 14. The overall product design scheme collection of the lathe.
Mathematics 10 02477 g014
Figure 15. Convergence curve.
Mathematics 10 02477 g015
Figure 16. Optimal product design scheme while considering remanufacturability.
Mathematics 10 02477 g016
Table 1. List of FR0.
Source of Function Requirements (FRS)Design Requirements
FR0Turning the rotating workpiece
Table 2. List of terminal nodes for FR0.
NameFeasible Design MethodWhether It Could Be Broken Down
Turning mechanismDP0Yes
Table 3. List of FR1, FR2, and FR3.
Source of Function Requirements (FRS)DP0 Turning Mechanism
Code nameDescription of FR
FR1Transmission function
FR2Executive function
FR3Auxiliary function
Table 4. List of terminal nodes for FR1, FR2, and FR3.
NameFeasible Design MethodWhether It Could Be Broken Down
Mechanical deviceDP1Yes
Electrical deviceDP2Yes
Auxiliary devicesDP3Yes
Table 5. List of FR11, FR12, FR13, FR14, FR15, and FR16.
Source of Function Requirements (FRS)DP1 Mechanical Device
Code nameDescription of FR
FR11Rotating work piece function
FR12Coordinated transmission component function
FR13Servo drive function
FR14Guide function
FR15Tool drive function
FR16Supporting and providing track function
Table 6. List of terminal nodes for FR11, FR12, FR13, FR14, FR15, and FR16.
NameFeasible Design MethodWhether It Could Be Broken Down
Belt spindleDP111No
Straight junction spindleDP112No
Motorized spindleDP114No
Sliding gear transmission mechanismDP121No
Swing shift tower gear shifting mechanismDP122No
Multiplying variable speed mechanismDP124No
Return crank gear variable speed mechanismDP126No
Ball screwDP132No
Sliding screwDP134No
Static pressure screwDP135No
Linear guideDP141No
Linear roller guidewayDP142No
Steel guide railDP143No
Swallowtail groove guide railDP146No
Row turretDP151No
Electric tool holderDP152No
Vertical tool holderDP153No
Horizontal tool holderDP154No
Flat bedDP161No
Inclined bedDP162No
Horizontal bed inclined guide bedDP163No
Upright bedDP164No
Table 7. List of FR21, FR22, and FR23.
Source of Function Requirements (FRS)DP2 Electrical Equipment
Code nameDescription of FR
FR21Control function
FR22Power function
FR23Test function
Table 8. List of terminal nodes for FR21, FR22, and FR23.
NameFeasible Design MethodWhether It Could Be Broken Down
High-reliability Computer Numerical Control (CNC) systemDP211No
General-purpose CNC systemDP212No
Cost-effective CNC systemDP214No
Inverter motorDP222No
Servo motorDP223No
Asynchronous motorDP224No
Rotary transformerDP231No
Optical grid sensorDP232No
Magnetic grid sensorDP233No
Pulse encoderDP235No
Table 9. List of FR31, FR32, FR33, FR34.
Source of Function Requirements (FRS)DP3 Auxiliary Device
Code nameDescription of FR
FR31Protection function
FR32Lubrication function
FR33Cooling function
FR34Providing power function
Table 10. List of terminal nodes for FR31, FR32, FR33, and FR34.
NameFeasible Design MethodWhether It Could Be Broken Down
Full protectionDP313No
Circulating lubrication systemDP321No
Oil immersion and splash lubrication systemDP323No
Centralized lubrication systemDP324No
Spray lubrication systemDP325No
Gas coolingDP331No
Liquid coolingDP332No
Pulse tube coolingDP333No
Gear pumpDP341No
Blade pumpDP342No
Piston pumpDP 344No
Table 11. Comparison matrix U .
U U F I U E I U S I U E Q
U F I 10.50.250.5
U E I 210.672
U S I 41.511.33
U E Q 20.50.751
Table 12. Comprehensive data table of feasible design methods.
Feasible Design MethodFunctionalityCostFailure RateEnvironmental
Belt spindleE32000.0120.15
Straight junction spindleD33000.0140.19
Motorized spindleC35000.0170.23
Slip gear change mechanismE24500.0050.23
Swing shift tower gear shifting mechanismE25000.0030.19
Multiplying variable speed mechanismD28500.0120.31
Return crank gear variable speed mechanismC32000.0150.27
Ball screwD7100.0150.19
Sliding screwC10800.0330.27
Static pressure screwD9800.0270.23
Linear guideC8900.0290.39
Linear roller guidewayC7300.0320.27
Steel guide railD6500.0210.15
Swallow tail groove guide railD6000.0270.23
Row turretC17500.0060.31
Electric tool holderC23100.0070.35
Vertical tool holderD18000.0070.23
Horizontal tool holderD16500.0020.19
Flat bedE55000.0030.23
Inclined bedC65000.0070.27
Horizontal bed inclined guide bedC63000.0110.31
Upright bedD63500.0050.23
High-reliability CNC systemD78000.0030.35
General-purpose CNC systemE35000.0150.15
Cost-effective CNC systemE56500.0130.27
Inverter motorD7300.0140.19
Servo motorE8000.0090.23
Asynchronous motorD6800.0070.19
Rotary transformerC8600.0370.35
Optical grid sensorD10200.0440.31
Magnetic grid sensorE9300.0190.23
Pulse encoderE7800.0210.27
Circulating lubrication systemD26000.0170.15
Oil immersion and splash lubrication systemC42000.0230.31
Centralized lubrication systemC45000.0220.43
Spray lubrication systemD34000.0190.23
Gas coolingE27800.0110.19
Liquid coolingD36000.0140.27
Pulse tube coolingE35600.0130.23
Gear pumpD3900.0080.15
Blade pumpC4500.0090.19
Piston pumpB5600.0090.19
Table 13. Optimization results.
Parameter NameCrossover Probability (CR)GenerationPopulation Sizef
Value0.3100501
Publisher’s Note: MDPI stays neutral with regard to jurisdictional claims in published maps and institutional affiliations.