Abstract
As a popular passive investment strategy, a sparse index tracking strategy has advantages over a full index replication strategy because of higher liquidity and lower transaction costs. Sparsity and nonnegativity constraints are usually assumed in the construction of portfolios in sparse index tracking. However, none of the existing studies considered sector risk exposure of the portfolios that prices of stocks in one sector may fall at the same time due to sudden changes in policy or unexpected events that may affect the whole sector. Therefore, sector neutrality appeals to be critical when building a sparse index tracking portfolio if not using full replication. The statistical approach to sparse index tracking is a constrained variable selection problem. However, the constrained variable selection procedure using Lasso fails to produce a sparse portfolio under sector neutrality constraints. In this paper, we propose a high-dimensional constrained variable selection method using TLP for building index tracking portfolios under sparsity, sector neutrality and nonnegativity constraints. Selection consistency is established for the proposed method, and the asymptotic distribution is obtained for the sparse portfolio weights estimator. We also develop an efficient iteration algorithm for the weight estimation. We examine the performance of the proposed methodology through simulations and an application to the CSI 300 index of China. The results demonstrate the validity and advantages of our methodology.
Keywords:
constrained variable selection; high-dimensional variable selection; sparse index tracking; sector neutrality; TLP; ADMM algorithm MSC:
62H12; 62F12; 62F30; 62P05
1. Introduction
Despite various types and goals, portfolio managing strategies can be classified into two main groups according to styles, namely, active and passive strategies. The former ones attempt to beat the market by exploiting market inefficiency, whereas the latter ones prefer to follow the market. However, the majority of actively managed funds do not outperform the market in the long run [1]. On the contrary, passive funds provide market-level profits without taking an active risk. Passive funds become more popular in recent years. U.S. equity index fund assets have surpassed the assets of their actively managed counterparts for the first time, according to Morningstar’s latest fund flows report. This trend is also growing in other parts of the world.
The most commonly used passive investing strategy is index tracking, which aims to mimic the performance of a specified basket of underlying assets. Without exposure to active risk, an index tracking fund needs to follow the targeting index as closely as possible. The performance of an index tracker is measured by tracking error [2], which is defined as the divergence between the index tracker and the targeting index. Tracking error gives investors a sense of how “tight” the index tracker goes after the index. Smaller tracking error means less exposure to active risk.
A straightforward method to construct an index tracking portfolio is full replication, which is to buy appropriate quantities of all assets composing the index. Theoretically, the performance of a full replication portfolio should match that of the targeting index perfectly. However, full replication portfolios often incur higher transaction and administration costs than portfolios of relatively fewer stocks. An alternative to full replication is sparse index tracking, which is to replicate the performance of an index by holding a representative sample of the securities in the index [3,4,5]. The challenge of building a sparse index tracking portfolio lies in the trade-off between transaction costs and tracking efficiency. A sparse index tracking portfolio manager attempts to hold as few securities as possible to reduce the transaction costs and eliminate potential illiquid stocks and curb the tracking error to maintain tracking efficiency at the same time. Sparse index portfolios are often constructed via portfolio optimization. Such an algorithm-driven portfolio aims to minimize the tracking error in both training samples and testing samples. Specifically, index tracking optimization needs to incorporate certain constraints, such as no short selling and balance among industrial sectors. The latter constraint aims at taming sector risk of sparse portfolios that a set of factors particular to a sector drags down the sector’s overall performance in financial risk management. Upon the occurrence of events affecting the entire sector, such as sudden policy changes or technology innovation, the stock prices of many of the companies in the same sector may undergo drastic changes simultaneously. Unbalanced allocation of assets among different sectors can result in the failure of index tracking for a portfolio. In Table 1, we present several periods when sector risk appears for China CSI300 Index. The table shows the performance of the index, the sector gainers and losers during the selected period. The large divergence between the index and the gainers or losers indicates that inappropriate exposure to sector risk can inflate the tracking error and undermine the portfolio performance. To manage the sector risk with index tracking, it is necessary to build a sector-neutral portfolio in which the total weight of stocks within each sector remains the same as that in the index. In particular, a sector-neutral strategy means not to overweight or underweight any given sector compared to its weight in the index, so as to ensure the performance of the portfolio will be stable and accordingly will be not affected by style switch in the market. Therefore, a sector-neutral portfolio can closely fit and help track the performance of a benchmark index, and essentially it turns out to be a passive investment strategy.

Table 1.
The periods with sector risk for CSI300 index from 2014 to 2018.
To overcome the drawbacks of full replication and accommodate the sector risk in traditional sparse portfolios, we propose a novel method to construct sparse index-tracking portfolios, assuming that short positions are forbidden and no cash is allowed in the constructed portfolios. Finally, we formulate the sparse index tracking problem with sector neutrality as the minimization of the tracking error under constraints of nonnegativity, sparsity, and sector neutrality.
2. Literature Review
There is a vast amount of research on quantitative methods for index tracking. Ref. [6] studied the traditional Markowitz asset allocation problem and proposed an algorithm for designing a sparse index fund. This algorithm yields a locally optimal index portfolio with a fixed number of securities. Ref. [7] investigated the relation between error measures in statistical tracking and asset allocation restrictions expressed as admissible weight ranges. It addressed the relationship between tracking errors caused by active portfolio management and given tactical asset allocation ranges. Ref. [8] imposed the no-short-sale constraint on the Markowitz mean-variance optimization and gave an insightful explanation and demonstration of why the constraints help. Ref. [9] considered maximizing the index fund’s tracking accuracy by rebalancing the composition of the index fund’s tracking portfolio in response to new market information and cash deposits and withdrawals from investors. Ref. [10] investigated the inclusion of portfolio liquidity constraints for the construction of index tracking portfolios and proposed two liquidity modelling approaches for index tracking.
Many statistical regularization methods have been applied to the index tracking problem recently. In general, a sparse index tracking portfolio can be constructed via variable selection, which removes non-informative features and yields sparse models, especially for the high-dimensional data, and consequently facilitates inference, interpretability and prediction. Ref. [11] formulated sparse index tracking problem as an optimization problem that minimizes the tracking error, subject to the number of selected assets less than or equal to a preset threshold. Ref. [12] formulated the index tracking as a regression problem whose objective was to minimise the tracking error and adds a penalty on weights corresponding to the amount to invest in each stock, then solved the optimization problem with stochastic neural networks. Ref. [13] investigated the applications of sparse auto-encoder deep-learning architectures with regularization in selecting representative stocks from the index constituents. Ref. [14] analyzed the constraints effect on covariance regularization for index tracking, and developed an and norm constrained minimum-variance portfolio. Ref. [15] reformulated the classical Markowitz mean-variance framework as a constrained least-squares regression problem and added a penalty function to construct a sparse index tracking portfolio. They emphasized that adding an penalty on weights to the objective function may bring several advantages, including promoting sparsity and stabilizing the out-of-sample performance. Ref. [16] offered deep mathematical insights into the utility approximations with the gross-exposure constraint and gave a theoretical justification for the empirical results by [8]. These approaches consist in solving index tracking problems through constraining portfolio norms, for example, the norm as implied in Lasso and the norm as imposed in ridge regression. Besides, many other variable selection methods introduced in various fields can be applied to the index tracking problems as well. Truncated penalty (TLP) [17] has advantages over Lasso [18] in that Lasso gives biased parameter estimates and possibly inconsistent variable selection. Intuitively, unlike Lasso which penalizes all variables, TLP does not penalize variables of large values, and thus enables us to incorporate more complicated constraints into optimization as in Section 3. We asserted in Section 1 that the novelty of our method lies in the construction of a sparse index tracking portfolio with exposure to sector risk. Sector neutrality can be achieved by constrained variable selection procedures. The constrained Lasso [19] introduced additional equality and inequality constraints to the traditional Lasso method for asset allocation, which generalized the work of [16]. However, with the constrained Lasso, the nonnegativity and sector neutrality constraints nullify the Lasso penalty and cause the method fails to give sparsity. More details will be discussed further in Section 3. Ref. [20] followed and added a ridge term into the objective function in constrained Lasso so that it may work in a high-dimensional case where sparsity is necessary.
Computationally solving a constrained variable selection problem is not an easy task, especially when complex penalty functions and constraints are used. The alternating direction method of multipliers (ADMM) algorithm [21] is an efficient and scalable optimization algorithm for convex optimization. Ref. [22] exploited the structure of distributed optimization framework and illustrated this framework via applications such as mean and variance filtering. The idea of the ADMM algorithm is to break the original optimization into iterations of easier problems. However, optimization with the TLP term is not a convex problem. To solve this nonconvex problem, ref. [17] presented an efficient algorithm based on a difference of convex (DC) decomposition [23] and a coordinate descent (CD) algorithm [24,25]. The DC method decomposes the nonconvex constraint into a difference of two convex functions to produce a sequence of approximating convex constraints. Thus the original nonconvex optimization is broken down into a series of convex optimization problems. In minimization of a multivariate function, the CD algorithm iteratively minimizes the objective function with respect to each coordinate direction until convergence. This is an efficient algorithm for large-scale convex optimization problems.
In this paper, we propose a novel method to solve the sparse index tracking problem with sector neutrality. An error bound for variable selection is obtained for the method, and then variable selection consistency and asymptotic distribution are established for effective inference. An efficient minimization algorithm is developed by combining the ADMM algorithm, DC decomposition and CD algorithm. The new procedure is tested via numerical simulations under different data generation settings. An application is given to index tracking in the Chinese stock market. Both the numerical experiments and application confirm the good performance of our method in general.
This paper is organized as follows. Section 3 formulates the sparse index tracking with sector neutrality as an optimization problem under constraints. Section 4 discusses the theory for high-dimensional constrained variable selection. Section 5 describes the algorithm for the optimization problem. Section 6 presents the results of the simulated experiments. Section 7 shows the application of the proposed method to index tracking portfolio construction. Summary and discussion are given in Section 8. Technical proofs and some tables are relegated to the Appendix A.
3. Methodology
From a statistical point of view, index tracking is a linear regression problem:
with the response and the covariates , where n is the sample size and p is the dimension of covariates. is the parameter of covariates , and is the error term, we assume , where I is the identity matrix. In index tracking, and represent the returns of an index and its constituents, respectively, and is the weight vector of the index’s constituents.
Suppose that there are q sectors. We rewrite the covariates , where are the covariates in the i-th sector, and is the number of stocks in the i-th sector, . Accordingly, we write , and .
For sparse index tracking, three categories of constraints are under consideration:
- (1)
- the sparsity constraint within sector: ;
- (2)
- the sector neutrality constraint: , for ;
- (3)
- the nonnegativity constraint: , for .
Here are constants satisfying . Each is the sum of the original constituent weights in the i-th sector. These original non-sparse weights are pre-specified by portfolio managers and hence are known in advance from the definition of the index.
The penalty function needs to be chosen carefully. The Lasso penalty is widely used in variable selection problems because of its ease of computation. Nevertheless, it turns out that the Lasso penalty fails to yield a sparse portfolio under sector neutrality and nonnegativity constraints for index tracking, as explained below. Under the nonnegativity constraint, the Lasso penalty becomes , while the sector neutrality constraint makes this sum a constant: . Therefore, the Lasso penalty becomes invalid and gives no penalty on the portfolio size.
To solve this problem, we take to be the truncated penalty (TLP) function [17], which can achieve sparse portfolio selection under the sector neutrality and nonnegativity constraints. TLP can be thought of as a truncated version of the penalty approximating the -function. As a piecewise linear function, TLP permits efficient computation and adaptive variable selection. TLP is defined as
where is a tuning parameter controlling the degree of approximation. With the TLP function, the estimation of coefficients is obtained by minimization:
where is the tracking error. This is the dual problem corresponding to the constrained primal problem
The dual problem is not equivalent to the constrained primal problem in general. However, with the TLP as the penalty function, the two optimization problems are equivalent [17]. In the remainder of the paper, we will consider only the unconstrained dual problem for its computational advantages. Minimization of (2) reduces to a general weighted Lasso problem, which can be solved by many efficient algorithms [18,26,27].
The tracking error can assume many forms [28], for example, the empirical tracking error (ETE), defined as
With TLP and the empirical tracking error, we can rewrite (2) as
4. Theory
Let us first introduce some notations. The true value of is denoted by . Without loss of generality, we assume that the last component of is nonzero for . By virtue of the sector neutrality constraint, we can solve for the last component in each sector:
We write
For any subscripts set , we use to denote the matrix consisting of the columns of with subscripts in ; likewise, comprises all the elements of with subscripts in .
Let
be the set of subscripts of all nonzero true coefficients in . We denote the cardinality of as , and the minimal value of nonzero true coefficients as .
Define
We expand to be the oracle estimator by letting if , and obtaining by Equation (5).
Let be the global minimizer of (4), and let
be the estimated set of nonzero coefficients.
We now give two key assumptions when establishing theoretical results regarding the error bound and asymptotic distribution of the coefficient estimator, and model selection consistency.
Assumption 1.
For some constants and , , where
Assumption 2.
For some constants and ,
where and denote the minimum and maximum eigenvalues of a matrix, respectively.
Theorem 1.
Assume that Assumption 1 holds, and . Then is upper bounded by
where is the distribution function of .
Theorem 2.
Assume there are constants , , , and satisfying
where for two sequences and we say if both sequences and are bounded. Also assume that the conditions of Theorem 1 and Assumption 2 hold. Then
- (A)
- Selection consistency:
- (B)
- Asymptotic distribution: Let denote the distribution function of, and the distribution function of -dimensional standard multivariate normal distribution. We have
Remark 1.
Theorems 1 and 2 stabilize the index tracking problem. They encourage the non-negativity and sector neutrality in constructing sparse index tracking portfolios in high dimensional cases and allow practical and empirical work with only a moderate size of training data. The proofs of Theorems 1 and 2 are displayed in Appendix A.1.
5. Computation
The minimization of (4) with TLP can be treated as a sequence of weighted Lasso problems [17] and can be solved iteratively. However, the sector neutrality constraint and the nonnegativity constraint in (4) are not easy to handle directly. Fortunately, the alternating direction method of multipliers (ADMM) algorithm [21,22] can be applied to solve the constrained minimization problem (4).
We are now to put our optimization problem in the ADMM framework. First, using the Lagrangian multiplier method, we transform the original optimization into minimization of the objective function
over the new parameter space :
It is straightforward to verify that the new parameter space is convex and the objective function f in (8) is a convex loss function plus a piecewise linear regularization function. Using the results in [21,29], our optimization problem is equivalent to
where is the indicator function of space (i.e., = 0 for , and for ). This is a standard starting form of the ADMM algorithm. Before following three steps in the ADMM algorithm, we write the augmented Lagrangian for (9),
where is a scaled dual variable associated with the constraint . Here is a penalty parameter.
In each iteration of ADMM, we perform alternating minimization of the augmented Lagrangian over and . At the k-th iteration we update variables , and by the following steps:
where denotes the Euclidean projection onto space . In the first step of ADMM, we fix and and update the value of by minimization of the augmented Lagrangian; in the second step, we fix and and update the value of by projection onto space ; and finally, we we fix and and update the dual variable . Algorithm 1 summarizes the framework of our algorithm and the details are referred to Appendix A.2.
| Algorithm 1 ADMM algorithm for the minimization of (10). |
|
6. Simulation Results
In this section, we show the performance of our estimation procedure via simulations and discuss the selection of appropriate tuning parameters , and in the augmented Lagrangian (10).
The detailed information about the simulation study, including the model and its variations, the methods to conduct the experiments and the choice of tuning parameters are given in Appendix A.3.
The performance of various methods is evaluated by both variable selection performance and estimation accuracy. In terms of variable selection, we use four criteria: the mean true positive(TP), the mean false positive(FP), positive selection rate(PSR), and negative selection rate(NSR) [30], respectively. The true positive(TP) is defined as , which counts the variables with true non-zero coefficients and estimated non-zero coefficients. The false positive (FP) is defined as , which counts the variables with true zero coefficients but estimated as non-zero coefficients. Additionally, PSR is the ratio of TP and the total number of the true non-zero coefficients. Similar to PSR, NSR is the ratio of FP and the total number of the true zero coefficients. Regarding estimation accuracy, we adopt the mean and the standard deviation of model errors (ME) as criteria, where the model error is defined as , and the expectation is taken only with respect to new observation . The running time of each method is evaluated using the machine with Intel Core i5 CPU, 2.4 GHz, 8 GB RAM. All methods were implemented in R.
6.1. Case 1
In this case , five methods are compared. The first one is our method, named as constrained TLP method (CTLP). The second method uses the Lasso penalty for sparsity constraint instead of TLP, and we name it the constrained method (C). This method will fail to give a sparse portfolio because of the neutrality constraint, as is pointed out in Section 3; we present the results of C here for confirmation. The third method uses TLP for the sparsity constraint, but ignores the sector neutrality, and we refer to this method as TLP. The fourth and fifth methods are the index tracking procedures in the following form,
with being empirical tracking error (ETE) and Huber empirical tracking error (HETE), which are denoted by ETE and HETE, respectively. In ETE, is defined in (3), while in HETE, where , and
with M being the Huber parameter. Note that ETE and HETE methods ignore the sector-neutral constraints. These two methods can be carried out using R-package sparseIndexTracking [31].
We first investigate the case when the covariates have an independent structure. Table 2 shows the simulation results for both and settings. For the setting, methods CTLP and C have smaller model errors than ETE and HETE, and the model errors of ETE and HETE are much smaller than that of TLP. When it comes to the variable selection ability, all methods correctly select non-zero variables. CTLP, ETE and HETE perform similarly, and better than C in that C tends to select too many trivial variables and thus fails to produce sparse portfolios, which confirms our earlier assertion. On the other hand, TLP makes the fewest mistakes in selecting both trivial and non-trivial variables. When the variance of error terms becomes larger, the simulated data are noisier. For the setting, CTLP and C still have the smallest model error while TLP performs quite poorly in terms of model errors. Every method selects almost all nontrivial variables except for TLP, which selects slightly fewer nontrivial and trivial variables.
Table 2.
The comparison of five methods in the case of , independent correlation matrix.
Now we investigate the simulation settings when the covariates have correlation, without and with group structures. Similar conclusions can be reached from Table 3 and Table 4. In the large signal-to-noise ratio setting (), the model errors of CTLP and C are similar and smaller than that of their competitors. Besides, CTLP, ETE and HETE maintain a good balance between selections of trivial and nontrivial variables whereas C selects too many trivial variables. TLP gives good variable selection results but has poor estimation accuracy. In the small signal-to-noise ratio setting (), the model errors of all five methods become larger than those in the case of the large signal-to-noise ratio setting above. However, the relative performances of the five methods are similar in terms of model errors and variable selection ability as well.
Table 3.
The comparison of five methods in the case of , correlation matrix without group structure.
Table 4.
The comparison of five methods in the case of , correlation matrix with group structure.
6.2. Case 2
When , the variable selection becomes a high-dimensional problem and necessitates sparsity. Theoretically, the C method with the Lasso penalty fails to yield sparse models due to sector neutrality and nonnegativity constraints. However, we can solve the convex optimization problem using some common convex optimizers like CVXR [32] to obtain an approximate solution C. Table 5, Table 6 and Table 7 present the results of this case.
Table 5.
The comparison of four methods in the case of , independent correlation matrix.
Table 6.
The comparison of four methods in the case of , correlation matrix without group structure.
Table 7.
The comparison of four methods in the case of , correlation matrix with group structure.
The results are similar to that of the low-dimensional case, but all four methods have larger model errors and select fewer nontrivial variables. In the large signal-to-noise ratio setting (), CTLP has smaller model errors than other methods. CTLP, ETE and HETE have a similar ability in variable selection. TLP has larger model errors and it tends to select fewer nontrivial variables. The average model error of C is between CTLP and other methods. It usually selects about 20% trivial variables as in tables if we consider the numbers less than as 0. As the accuracy of numbers increases, more trivial variables are selected. No estimated coefficients of variables are exactly 0 with moderate accuracy, which proves that C is just an approximate solution and the term does not work. In the small signal-to-noise ratio setting (), there is no significant difference between CTLP and ETE in terms of model errors, but CTLP selects fewer trivial variables. As to the other two methods, HETE gives less accurate estimation, and TLP performs less well in terms of both variable selection and estimation. Although C yields the smallest model errors, it cannot provide the exact solution with the sparsity that we need. All five methods run faster than in the case due to the smaller sample size. CTLP is still the slowest one while ETE is the fastest one.
In conclusion, although CTLP takes more time to run, it performs similarly or better than the competitors in terms of both model errors and variable selection ability.
7. Real Data Results
Now we are to apply the proposed methodology to sparse index tracking for the CSI 300 Index. In this application, we use the daily return series of the CSI 300 Index and all stocks in this index from 2014 to 2018. The CSI 300 is a capitalization-weighted stock market index designed to replicate the performance of the top 300 stocks traded in the Shanghai and Shenzhen stock exchanges. The index is compiled by the China Securities Index and is considered a blue chip index for Mainland China stock exchanges. The return series, the methodology of the CSI 300 Index, the names and weights of the index constituents, and the corresponding sectors are available from China Securities Index (http://www.csindex.com.cn/) (accessed on 31 September 2018).
According to the guidelines for the industry classification by the Global Industry Classification Standard (GICS) and the weights of constituents making up the CSI 300 Index, the stocks can be divided into 11 major sectors, including Materials, Communication services, Real estate, Industrials, Utilities, Financials, Consumer Discretionary, Energy, Consumer Staples, Information Technology and Health Care. In the composition of the CSI 300 index, the constituents, as well as their weights, are reviewed every six months. As a consequence, every six months, the stock numbers and the weights of sectors will change. Due to its dynamic properties, we must update our model periodically. We train and tune the model on the first day after constituent adjustment is implemented with the daily return series of the index and its renewed constituents before half a year. The total weights within sectors are calculated based on the renewed weights as well. Then the model will be tested with daily return series before the next adjustment day. These steps are in accordance with the practical procedure.
We treat the estimated coefficients as the weights of stocks in building an index-tracking portfolio. The daily tracking error or prediction error is adopted to evaluate the model performance. The daily tracking error measures the deviation of the index daily return from the portfolio daily return, defined as , where is the daily return of the index, is the daily return of the constructed portfolio. We will compare our method CTLP with TLP, ETE and HETE as described in Section 6.1 in terms of tracking errors. Since the training sample size is smaller than the number of index constituents, there is no exact solution without sparsity, but an approximate solution by a common convex optimizer. Thus, we show the C solution as in Section 6.2. For an additional comparison in the Lasso family, we give the performance of standard sparse group lasso [33] by SGL. To give a more intuitive view of the advantages of the proposed method, we also present the performance of portfolios created by traditional methods, including equal-weighted portfolio (EW) and inverse volatility weighted portfolio (IVW). Both portfolios consist of 300 stocks. The weights in the EW portfolio are equal while the weights in the IVW portfolio are inversely proportional to their historical volatility.
The CSI 300 index has been adjusted eight times from December 2014 to November 2018. Each time the constituents of the index were adjusted, we update the model and test it with the return series for the next six months. Table 8 presents the mean and standard deviation of the daily tracking errors in each test set. It also shows the number of stocks building the portfolio. We highlight the method with the smallest mean daily tracking error in each period. It is clear that in a majority of periods, CTLP has the smallest mean tracking error among its competitors. Even in the period, such as 2017H1 and 2017H2, when CTLP is not the best, it is still very close to the best one. In terms of the standard deviation of tracking errors, CTLP has a slightly larger standard deviation than ETE and HETE, but significantly smaller than TLP. However, TLP and HETE tend to yield sparser portfolios than CTLP and ETE. As to tracking errors, C performs not bad. But it has difficulties to give a sparse portfolio in several periods which violates our motivation to propose this research. The standard sparse group lasso (SGL) may provide negative coefficients but satisfy sector-neutral constraints. Although it has sparse enough solutions, its tracking errors are the largest. The traditional EW and IVW portfolios are not sparse and yield unstable performance. In some periods they track the index tightly, while in other periods they produce large tracking errors. We also present the average runtime of the first four methods in Table 9, indicating that CTLP and HETE run more slowly than the other four methods. Even though the computation of CTLP requires longer computation time due to additional sector neutral constraints, it is still worthwhile for its competitive performance and the fact that this computation is not a frequent task.
Table 8.
The performance of the selected portfolio. By different methods in eight periods. Mean, Std. Dev and Num stand for the mean, the standard deviation of tracking error and the number of stocks in the portfolio. In the columns of period, for example, 2018H1 stands for the first half year of 2018.
Table 9.
The average runtime of different methods.
As illustration, we display analysis results for the most recent two periods – the first and second half of 2018, in Figure 1 and Figure 2, Table 10 and Table 11. Figure 1 and Figure 2 draw the cumulative profit and loss of CTLP, TLP, ETE, HETE and the index. The closer of the cumulative profit and loss line to the red line, which represents that of the index, the better the method. It is clear that the CTLP replicates the index the best among all four methods. Table 10 and Table 11 present the number of stocks and the total weights of different sectors. Compared with the index, all portfolios built by five methods are sparse. However, the portfolio given by TLP consists of such a small number of stocks that it cannot track the index well. In the TLP portfolio, some sectors even have zero weights. CTLP and C selected a portfolio with sector weights strictly equal to that of the index because of the sector neutrality constraint, whereas ETE and HETE produced sparse portfolios with sector weights only roughly equal to that of the index.
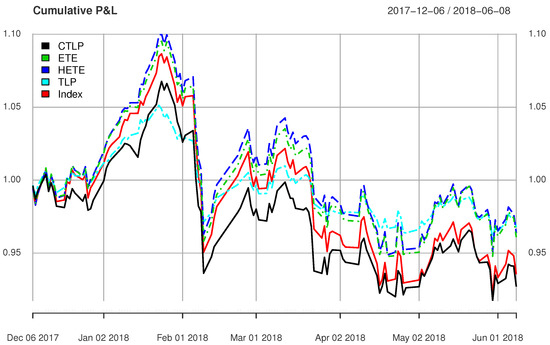
Figure 1.
The cumulative profit and loss of portfolios built by different methods and the index in 2018H1.
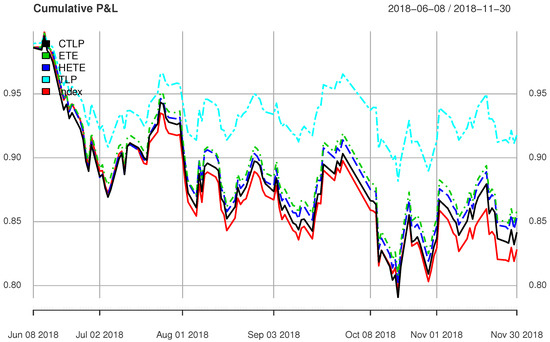
Figure 2.
The cumulative profit and loss of portfolios built by different methods and the index in 2018H2.
Table 10.
The number of stocks and the sum of weights within sectors in selected portfolio by different methods and the index in 2018H1.
Table 11.
The number of stocks and the sum of weights within sectors in selected portfolio by different methods and the index in 2018H2.
In summary, the proposed CTLP method demonstrates its advantages over the competitive methods in sparse index tracking. The sector neutrality constraint of CTLP guarantees the resulted sparse portfolio has the same sector risk exposure as the index. Most of the time, the CTLP method also gives smaller tracking errors. In addition, the non-negativity and sparsity of the CTLP portfolios are often desired properties in practical applications.
8. Summary
Motivated by a sparse index tracking problem, we propose a new method to do sparse variable selection under constraints. Our methodology extends the traditional variable selection with added constraints. Constraints either represent the lower dimensional structure of the data or special characteristics of practical applications.
In the sparse index tracking problem, sparsity, sector neutrality, and nonnegativity constraints are necessary to build an efficient, sector-risk neutral portfolio with lower transaction costs to track the performance of the index. We proved the consistency and asymptotic distribution for the constrained high-dimensional variable selection using our method. We also developed an efficient algorithm for the estimation of the stock weights of the sparse portfolio. Both simulations and the real application confirmed the validity and advantages of the new methodology.
In portfolio management applications, additional constraints may be incorporated into index tracking, for example, low volatility or size neutrality constraints. We leave these problems for future investigations.
Author Contributions
Conceptualization, Y.C.; Data curation, Y.C.; Investigation, Y.C.; Methodology, S.C.; Software, S.C.; Supervision, X.L.; Validation, S.C.; Writing—original draft, Y.C.; Writing—review & editing, X.L. All authors have read and agreed to the published version of the manuscript.
Funding
Liu’s research is partially sponsored by the Shanghai Pujiang Program (21PJC056) and Shanghai Institute of International Finance and Economics.
Data Availability Statement
Publicly available datasets were analyzed in this study. This data can be found here: http://www.csindex.com.cn/.
Acknowledgments
The authors would like to thank the editor and anonymous referees for their helpful comments and suggestions. Our appreciation goes to Mathematics for consideration of publishing our work.
Conflicts of Interest
The authors declare no conflict of interest. The funders had no role in the design of the study; in the collection, analyses, or interpretation of data; in the writing of the manuscript; or in the decision to publish the results.
Appendix A
Appendix A.1. Proof of Theorems
Proof of Theorem 1.
For , by the definition of , the variance of is a diagonal entry of matrix . Therefore,
The variance of is , where is the coefficient vector for the linear combination of on the right hand side of Equation (5) using only nonzero values of . Note that is a -dimensional vector consisting of 0’s and ’s only, The variance of is bounded above by . Thus,
It follows that
Proof of Theorem 2.
We firstly show that as . From Mill’s ratio [35] it follows that
Hence,
and
Since , , , , , it follows that
Similarly,
Because and , it follows that
and
Appendix A.2. The Details of Algorithm
The objective function in the first minimization step (11) is a quadratic function plus a TLP function. This is a non-convex minimization which can be solved by the difference of the convex (DC) method [17,23]. The DC method is used to decompose a non-convex function into the difference of convex functions so that the algorithms and properties of convex optimization can be applied. By DC decomposition and some calculations, the minimization subproblem (11) is equivalent to minimize (A5) with regard to ,
Let us begin with the DC decomposition of the objective function , where
It is clear that is a convex function of . Using the DC decomposition, a sequence of linear approximations of is constructed. Let be the subgradient of . At the m-th iteration, replacing by its majorization, we obtain
where denotes the vector obtained by replacing each component of with its absolute value. After ignoring the terms that are independent of , the becomes
Minimizing (A6) gives the updated value . Repeat the process procedure until convergence.
Note that the second term in (A7) is a separable function in variable . This property enables us to use coordinate descent algorithm [24,25] for minimization. Similar to the results of regular Lasso [36], the updating formula for is
were , , is the j-th column of , is the matrix with the j-th column of deleted, and is defined similarly. is the soft-thresholding operator. Updating Formula (A8) is cycled through all variables in turn. Repeated iteration of (A8) until convergence gives the estimate .
Finally, with the inner iteration (A8) and outer iteration Algorithm A1, we solve the minimization subproblem (11).
We summarize the DC algorithm for minimization (11) below.
| Algorithm A1 DC algorithm for the minimization of (11). |
|
Next, we note that computing the projection (12) directly is not easy. Let . We divide the projection into two easier sequential projections: the first one is the projection from onto space , and the second one is the projection from to . The Theorem A1 below will guarantee the equivalence between the direct projection on and the two sequential projections.
Theorem A1.
In Euclidean space, projection onto space is equivalent to the sequential projections onto space and space :
There exists a closed-form solution for .
Let . Assume there are elements in the i-th group . We have
The computation of the second projection is given in the proof of Theorem A1. The composition of these two sequential projections updates the value of . The third step (13) is a direct calculation.
Proof of Theorem A1.
Without loss of generality, we assume that all variables belong to the same group. The proof is similar to the case when the number of groups for variables is more than 1. The parameter space becomes .
Denote , and , where , and . The closed-form formula for is given by (A10).
Now we are to calculate the projection . We assume that has u positive elements, v zero elements, and negative elements:
Let . The projection is given by
Appendix A.3. The Details of Simulation
In the simulation study, we consider the model . The covariates are generated from a multivariate normal distribution with all marginal distributions being standard normal distribution . The correlation matrix of is denoted by .
We assume three settings for the correlation matrix :
- (1)
- Independence structure: is the identity matrix;
- (2)
- correlation without group structure: , where for ;
- (3)
- correlation with group structure: , where for and for and , .
As to the dimension of the covariates , two cases and will be considered. We use . The parameter vector is divided into 5 groups, with 20 elements in each group. The numbers of non-zero elements in each group are 3, 3, 1, 2, and 5, respectively. The true values of are
The sum of coefficients for each group are , , , , and , respectively. Besides, the numbers of zero elements in each group are 17, 17, 19, 18, and 15, respectively. The sample size n is set to be 50 and 2000, for low- and high-dimensional cases. The distribution of error term is the normal distribution , and the scaling parameter takes two values: and .
In each experiment, we randomly divide a dataset into training, tuning, and testing sets of 60%, 20%, and 20% of original sample sizes, respectively. We repeat the experiment 100 times and report the means of ME, TP, FP, PSR, NSR and the standard error of ME for each of the simulation settings.
As to tuning parameter selection, we will use five-fold cross-validation. The optimal choice of tuning parameters and can be found by grid search [17]. Finding an optimal value for is not a straightforward problem [22], however, ref. [21] provides many heuristics that work well in practice. Here, we find out that a good choice of is around 1.
References
- Barber, B.M.; Odean, T. Trading is hazardous to your wealth: The common stock investment performance of individual investors. J. Financ. 2000, 55, 773–806. [Google Scholar] [CrossRef]
- Jansen, R.; Van Dijk, R. Optimal benchmark tracking with small portfolios. J. Portf. Manag. 2002, 28, 33–39. [Google Scholar] [CrossRef]
- Ben-David, I.; Franzoni, F.; Moussawi, R. Exchange-traded funds. Annu. Rev. Financ. Econ. 2017, 9, 169–189. [Google Scholar] [CrossRef]
- Fuller, S.L. The evolution of actively managed exchange-traded funds. Rev. Secur. Commod. Regul. 2008, 41, 89–96. [Google Scholar]
- Santos, A.A. Beating the market with small portfolios: Evidence from Brazil. EconomiA 2015, 16, 22–31. [Google Scholar] [CrossRef][Green Version]
- Tabata, Y.; Takeda, E. Bicriteria Optimization Problem of Designing an Index Fund. J. Oper. Res. Soc. 1995, 46, 1023–1032. [Google Scholar] [CrossRef]
- Ammann, M.; Zimmermann, H. Tracking Error and Tactical Asset Allocation. Financ. Anal. J. 2001, 57, 32–43. [Google Scholar] [CrossRef]
- Jagannathan, R.; Ma, T. Risk reduction in large portfolios: Why imposing the wrong constraints helps. J. Financ. 2003, 58, 1651–1684. [Google Scholar] [CrossRef]
- Strub, O.; Baumann, P. Optimal construction and rebalancing of index-tracking portfolios. Eur. J. Oper. Res. 2018, 264, 370–387. [Google Scholar] [CrossRef]
- Vieira, E.B.F.; Filomena, T.P.; Sant’anna, L.R.; Lejeune, M.A. Liquidity-constrained index tracking optimization models. Ann. Oper. Res. 2021, 1–46. [Google Scholar] [CrossRef]
- Li, X.P.; Shi, Z.L.; Leung, C.S.; So, H.C. Sparse Index Tracking with K-Sparsity or ε-Deviation Constraint via ℓ0-Norm Minimization. IEEE Trans. Neural Netw. Learn. Syst. 2022. [Google Scholar] [CrossRef]
- Zheng, Y.; Chen, B.; Hospedales, T.M.; Yang, Y. Index tracking with cardinality constraints: A stochastic neural networks approach. In Proceedings of the AAAI Conference on Artificial Intelligence, New York, NY, USA, 7–12 February 2020; Volume 34, pp. 1242–1249. [Google Scholar]
- Zhang, C.; Liang, S.; Lyu, F.; Fang, L. Stock-index tracking optimization using auto-encoders. Front. Phys. 2020, 8, 388. [Google Scholar] [CrossRef]
- Demiguel, V.; Garlappi, L.; Nogales, F.; Uppal, R. A Generalized Approach to Portfolio Optimization: Improving Performance by Constraining Portfolio Norms. Manag. Sci. 2009, 55, 798–812. [Google Scholar] [CrossRef]
- Brodie, J.; Daubechies, I.; De Mol, C.; Giannone, D.; Loris, I. Sparse and stable Markowitz portfolios. Proc. Natl. Acad. Sci. USA 2009, 106, 12267–12272. [Google Scholar] [CrossRef]
- Fan, J.; Zhang, J.; Yu, K. Vast portfolio selection with gross-exposure constraints. J. Am. Stat. Assoc. 2012, 107, 592–606. [Google Scholar] [CrossRef]
- Shen, X.; Pan, W.; Zhu, Y. Likelihood-based selection and sharp parameter estimation. J. Am. Stat. Assoc. 2012, 107, 223–232. [Google Scholar] [CrossRef]
- Tibshirani, R. Regression shrinkage and selection via the lasso. J. R. Stat. Soc. Ser. B (Methodol.) 1996, 58, 267–288. [Google Scholar] [CrossRef]
- James, G.M.; Paulson, C.; Rusmevichientong, P. Penalized and Constrained Optimization: An Application to High-Dimensional Website Advertising. J. Am. Stat. Assoc. 2019, 115, 1–31. [Google Scholar] [CrossRef]
- Gaines, B.R.; Kim, J.; Zhou, H. Algorithms for Fitting the Constrained Lasso. J. Comput. Graph. Stat. 2018, 27, 861–871. [Google Scholar] [CrossRef]
- Boyd, S.; Parikh, N.; Chu, E.; Peleato, B.; Eckstein, J. Distributed optimization and statistical learning via the alternating direction method of multipliers. Found. Trends Mach. Learn. 2011, 3, 1–122. [Google Scholar] [CrossRef]
- Wahlberg, B.; Boyd, S.; Annergren, M.; Wang, Y. An ADMM algorithm for a class of total variation regularized estimation problems. IFAC Proc. Vol. 2012, 45, 83–88. [Google Scholar] [CrossRef]
- Tao, P.D.; An, L.T.H. Convex analysis approach to dc programming: Theory, algorithms and applications. Acta Math. Vietnam. 1997, 22, 289–355. [Google Scholar]
- Wu, T.T.; Lange, K. Coordinate descent algorithms for lasso penalized regression. Ann. Appl. Stat. 2008, 2, 224–244. [Google Scholar] [CrossRef]
- Wright, S.J. Coordinate descent algorithms. Math. Program. 2015, 151, 3–34. [Google Scholar] [CrossRef]
- Efron, B.; Hastie, T.; Johnstone, I.; Tibshirani, R. Least angle regression. Ann. Stat. 2004, 32, 407–499. [Google Scholar] [CrossRef]
- Osborne, M.R.; Presnell, B.; Turlach, B.A. On the lasso and its dual. J. Comput. Graph. Stat. 2000, 9, 319–337. [Google Scholar]
- Benidis, K.; Feng, Y.; Palomar, D.P. Sparse Portfolios for High-Dimensional Financial Index Tracking. IEEE Trans. Signal Process. 2018, 66, 155. [Google Scholar] [CrossRef]
- Wang, Y.; Yin, W.; Zeng, J. Global convergence of ADMM in nonconvex nonsmooth optimization. J. Sci. Comput. 2015, 78, 29–63. [Google Scholar] [CrossRef]
- Chen, Z.; Chen, J. Tournament screening cum EBIC for feature selection with high-dimensional feature spaces. Sci. China Ser. A Math. 2009, 52, 1327–1341. [Google Scholar] [CrossRef]
- Benidis, K.; Palomar, D.P. sparseIndexTracking: Design of Portfolio of Stocks to Tracks an Index; R Package Version 0.1.0. Available online: https://CRAN.R-project.org/package=sparseIndexTracking (accessed on 1 September 2019).
- Fu, A.; Narasimhan, B.; Boyd, S. CVXR: An R Package for Disciplined Convex Optimization. J. Stat. Soft. 2020, 94, 1–34. [Google Scholar] [CrossRef]
- Simon, N.; Friedman, J.; Hastie, T.; Tibshirani, R. A sparse-group lasso. J. Comput. Graph. Stat. 2013, 22, 231–245. [Google Scholar] [CrossRef]
- Shen, X.; Pan, W.; Zhu, Y.; Zhou, H. On constrained and regularized high-dimensional regression. Ann. Inst. Stat. Math. 2013, 65, 807–832. [Google Scholar] [CrossRef] [PubMed][Green Version]
- Gasull, A.; Utzet, F. Approximating Mills ratio. J. Math. Anal. Appl. 2014, 420, 1832–1853. [Google Scholar] [CrossRef]
- Friedman, J.; Hastie, T.; Höfling, H.; Tibshirani, R. Pathwise coordinate optimization. Ann. Appl. Stat. 2007, 1, 302–332. [Google Scholar]


Publisher’s Note: MDPI stays neutral with regard to jurisdictional claims in published maps and institutional affiliations. |
© 2022 by the authors. Licensee MDPI, Basel, Switzerland. This article is an open access article distributed under the terms and conditions of the Creative Commons Attribution (CC BY) license (https://creativecommons.org/licenses/by/4.0/).