In this section, experiments are conducted to evaluate these local seeding algorithms on a number of networks and analyze the experimental results. Before presenting the results, we briefly describe the evaluation metrics and the experimental setting.
6.2. Results on Real Networks
We apply eight widely used real networks with ground-truth communities for this experiment. These networks include (online) social networks, copurchasing networks and collaboration networks.
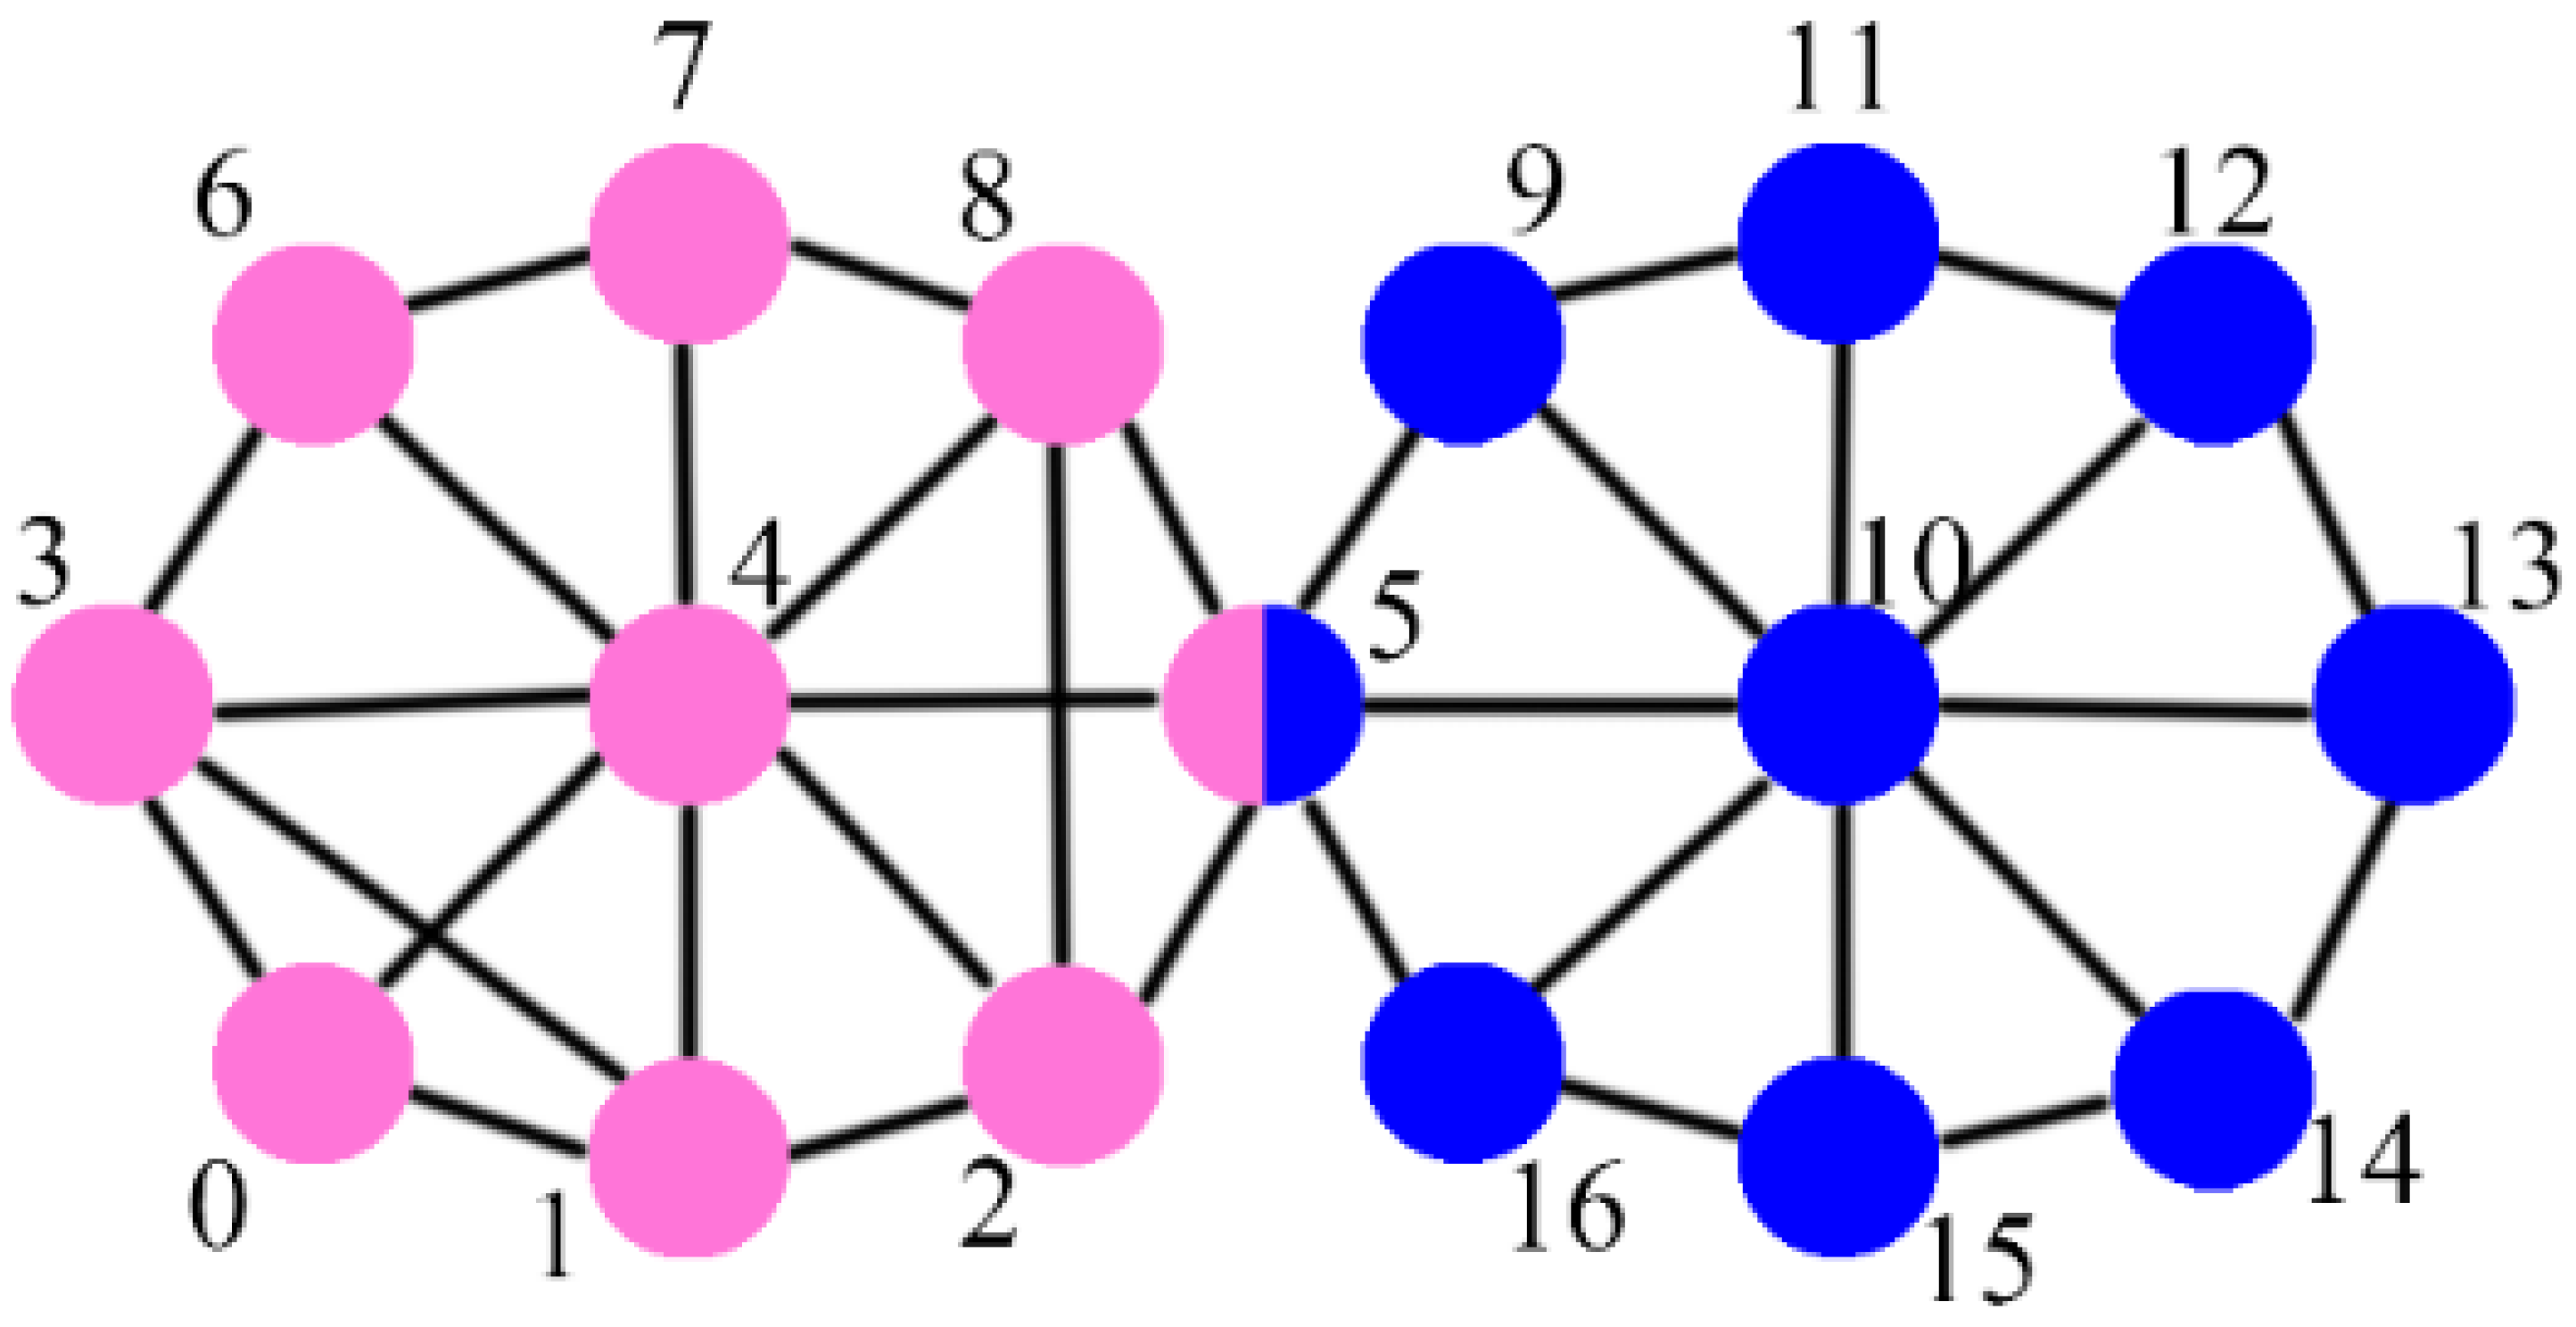
Table 3 shows the information of these networks. The scale of these networks ranges from tens of nodes and edges up to millions of nodes and billions of edges; the number of ground-truth communities spans from several to millions (see the columns “Nodes”, “Edges” and “Coms” for the scale information). The Karate network indicates 78 relationships among 32 members, such as trainees, coaches and administrators, in a karate club. There are two ground-truth communities shown in
Figure 2a, and they represent different fractional conflicts. The Dolphin network indicates the communications among 62 dolphins over 7 years, and the ground-truth communities are shown in
Figure 3a. The Football network indicates the American college football matches held in 2000. The nodes represent football teams participating in a match, and the edges between two nodes indicate the two corresponding teams that played against each other in the match; the teams from the same conference form one ground-truth community. The Amazon network represents products as nodes, each edge indicates a copurchasing relation, and the ground-truth communities are equivalent to product categories. The DBLP network is a coauthorship network, and the ground-truth communities are created by grouping authors that publish in the same conference or the same journal. The YouTube, LJ and Orkut networks are online social networks, where the nodes represent users and the edges represent the interactions between users; the user-defined groups are considered the ground-truth communities. More detailed information about these networks can be found in the corresponding references, which are listed in the “Ref” in
Table 3.
The numbers of seeds and the coverage of the resulting communities by different seeding algorithms are shown in
Table 4 and
Table 5, respectively. The average F1-score and average Nvi are shown in
Table 6, and the modularity and average conductance are shown in
Table 7. From
Table 4, we can see that the degree-based algorithms clearly select fewer seeds over large networks, especially LM-ACCD and LM-EXTD, while the denseness-based algorithms clearly select more seeds, especially LM-DE and LM-LCC. However, there are two exceptions: LM-NM (a denseness-based algorithm) and LM-COREDPA (a core-based algorithm) select fewer seeds than LM-D (a degree-based algorithm) in most cases. This is because both LM-NM and LM-COREDPA prefer nodes with large degrees, since LM-NM takes the node mass as the centrality metric, which evaluates the denseness of a neighborhood by counting the number of edges between neighbors without normalization by degree, and LM-COREDPA takes the core dominance with preference attachment as the centrality metric, which evaluates the influence of a node by the multiplication of degrees. The coverage of the resulting communities, shown in
Table 5, is almost positively correlated with the number of seeds, i.e., the more seeds there are, the higher the coverage is.
From
Table 6, we can see that all the seeding algorithms lead to relatively high F1-scores and Nvi over small networks, such as Karate, Dolphin and Football and relatively low F1-scores and Nvi over large networks such as Amazon, DBLP, YouTube, LJ and Orkut. In terms of the F1-score, the denseness-based algorithms work best overall, except LM-NM which selects much fewer seeds in many cases. Regarding the degree-based algorithms and core-based algorithm, the latter ones are better overall than the former ones. However, there is an exception: LM-COREDPA performs worse than LM-ACCD, which is the best among the degree-based algorithms, in most cases. LM-COREDJ performs best overall among the core-based algorithms. Moreover, the degree-based algorithms and core-based algorithms can produce much better results over small networks than over large networks. In terms of Nvi, the degree-based algorithms perform best, especially LM-ACCD, which produces the highest Nvi on all the networks except, Dolphin, Football and Orkut (it also produces competitive Nvi values on these three networks). The denseness-based algorithms perform worst overall, except that LM-NM is competitive and LM-CE can produce a good Nvi on some networks, such as Karate, Dolphin and Orkut. Among the core-based algorithms, LM-COREDPA performs best. In summary, over small networks, the degree-based algorithms lead to both a good F1-score and a good Nvi, but over large networks, the result is different: the degree-based algorithms, LM-NM and LM-COREDPA always lead to lower F1-scores but higher Nvi, and among the denseness-based algorithms, LM-DE and LM-LCC always lead to higher F1-scores but lower Nvi, and LM-CE leads to relatively competitive F1-scores and Nvi over all the networks, except YouTube and LJ.
From
Table 7, we can see that over the Orkut network, which is relatively dense, all the algorithms lead to very low modularity and very high conductance, which is probably because the relatively high density of the network makes the boundary between communities unclear. In terms of modularity, the core-based algorithms and the degree-based algorithms perform best; among the core-based algorithms, the best algorithm overall is LM-COREDJ, followed by LM-COREDP. The denseness-based algorithms perform worst, except that LM-NM performs quite well (on the networks YouTube and LJ, LM-NM produces the best modularity). In terms of conductance, the degree-based algorithms perform best, among which LM-ACCD is the best. In summary, the core-based algorithms and degree-based algorithms perform best in terms of modularity and conductance, and the denseness-based algorithms perform worst, except LM-NM, which leads to competitive results with those of the core-based and degree-based algorithms.
From the analysis above, we can see that, in terms of F1-score and Nvi, almost all the seeding algorithms lead to much worse results on large networks than on small networks, implying that seeding as well as detecting communities in large networks is complicated and requires more studies. Further, an overall trend in large networks can be inferred from
Table 4,
Table 5,
Table 6 and
Table 7: the evaluation metrics Nvi, modularity and conductance generally prefer the obtained community structures that have low coverage (usually corresponding to fewer seeds), while the F1-score metric prefers the ones that have high coverage (usually corresponding to many more seeds). As seen in the last five columns in
Table 4,
Table 5,
Table 6 and
Table 7, the degree-based algorithms, LM-NM and LM-COREDPA always yield the lowest coverage, while the corresponding Nvi, modularity and conductance are almost the best (over the Orkut network, the conductance metric does not follow this pattern); the denseness-based algorithms, except LM-NM, always yield the highest coverage, and the corresponding F1-scores are the highest. To explain this, we explore the results from the aspects of network, ground-truth communities, position of seeds, detected communities and evaluation metrics, and find that in the case where the coverage is low, there are fewer seeds selected and those seeds are generally hub nodes, resulting in fewer but large detected communities with relatively good structure (see LM-D and LM-COREDPA for examples); in the case where the coverage is high, a large number of seeds are selected with many improper seeds, resulting in a large number of detected communities but many of them are not good (see LM-DE and LM-LCC for examples). Consequently, the modularity and conductance are generally better in the former case since these two metrics are structural metrics, and the F1-score is generally higher in the latter case, since the large number of detected communities increase the possibility of intersection between the ground truth and the detected communities. The Nvi is generally higher in the former case, which is partially because that several ground-truth communities (probably with overlaps) may be included by a detected community and the conditional entropy of the ground truth with respect to the detected communities is very low according to its definition. However, the comprehensive explanation for the results of F1-score and Nvi needs further study, because many factors, such as the ground-truth communities, detected communities and evaluation metrics themselves, can influence the results, which is quite a complicated issue, and we leave this for future work. The results imply, to some extent, that there is a lack of “perfect” metrics for community evaluation, which is a further challenge to the task of community detection. From the analysis and discussion above, it can be seen that the result of LM-NM is quite different from the ones of the other denseness-based seeding algorithms (i.e., LM-CE, LM-DE and LM-LCC) in many cases. From Equations (
3)–(
6) it can be seen that NM evaluates a node’s local centrality by counting the internal edges of its neighborhood without normalization, while CE, DE and LCC are all normalized. This causes NM to prefer nodes with high degree compared with CE, DE and LCC, resulting in LM-NM behaving differently.
It is still difficult to infer a clear conclusion, such as which algorithms work better on which networks, since these seeding algorithms perform differently in terms of different evaluation metrics. To obtain a general comparison result, over each network, we rank the algorithms according to each metric and obtain an average rank. For instance, over the Karate network, the LM-D rank is 3 according to the coverage metric since it leads to the third highest coverage; its rank is 1 according to the F1-score, Nvi and conductance metrics; and its rank is 2 according to the modularity metric. Thus, the average rank of LM-D over the Karate network is 1.6. Then, for each network, we list the best and the second best ranked algorithms according to the average rank; see
Table 8. We can see that the degree-based algorithms, the core-based algorithms (except LM-COREDP), LM-NM ranks highest over Karate (1.6), followed by LM-CE (2.2); LM-CE ranks highest over Dolphin (1.4), followed by LM-EXTD, LM-NM, LM-COREDC and LM-COREDJ (2.0); LM-D ranks highest over Football (2.4), followed by LM-NM (3.4); LM-COREDJ ranks highest over Amazon (3.8), followed by LM-NM (4.4); LM-EXTD, LM-ACCD and LM-COREDJ rank highest over DBLP (4.8), followed by LM-NM (5.0); LM-NM ranks highest over YouTube (5.0), followed by LM-D (5.2); LM-EXTD ranks highest over LJ (3.8), followed by LM-COREDPA (4.2); and LM-COREDJ ranks highest over Orkut (2.8), followed by LM-COREDP (3.6). Further, we can obtain that the core-based algorithms perform best over four networks (three of them are large networks, and over the three large networks, LM-COREDJ is the best algorithm) and perform second best over three networks (two of them are large networks); the degree-based algorithms perform best over four networks (two of them are large networks), and perform second best over two networks (one of them is a large network); the denseness-based algorithms perform best over three networks (one of them is a large network), and perform second best over five networks (two of them are large networks). Overall, the core-based algorithms perform best, and among them, LM-COREDJ performs best; LM-EXTD performs best among the degree-based algorithms, and LM-NM performs best among the denseness-based algorithms.
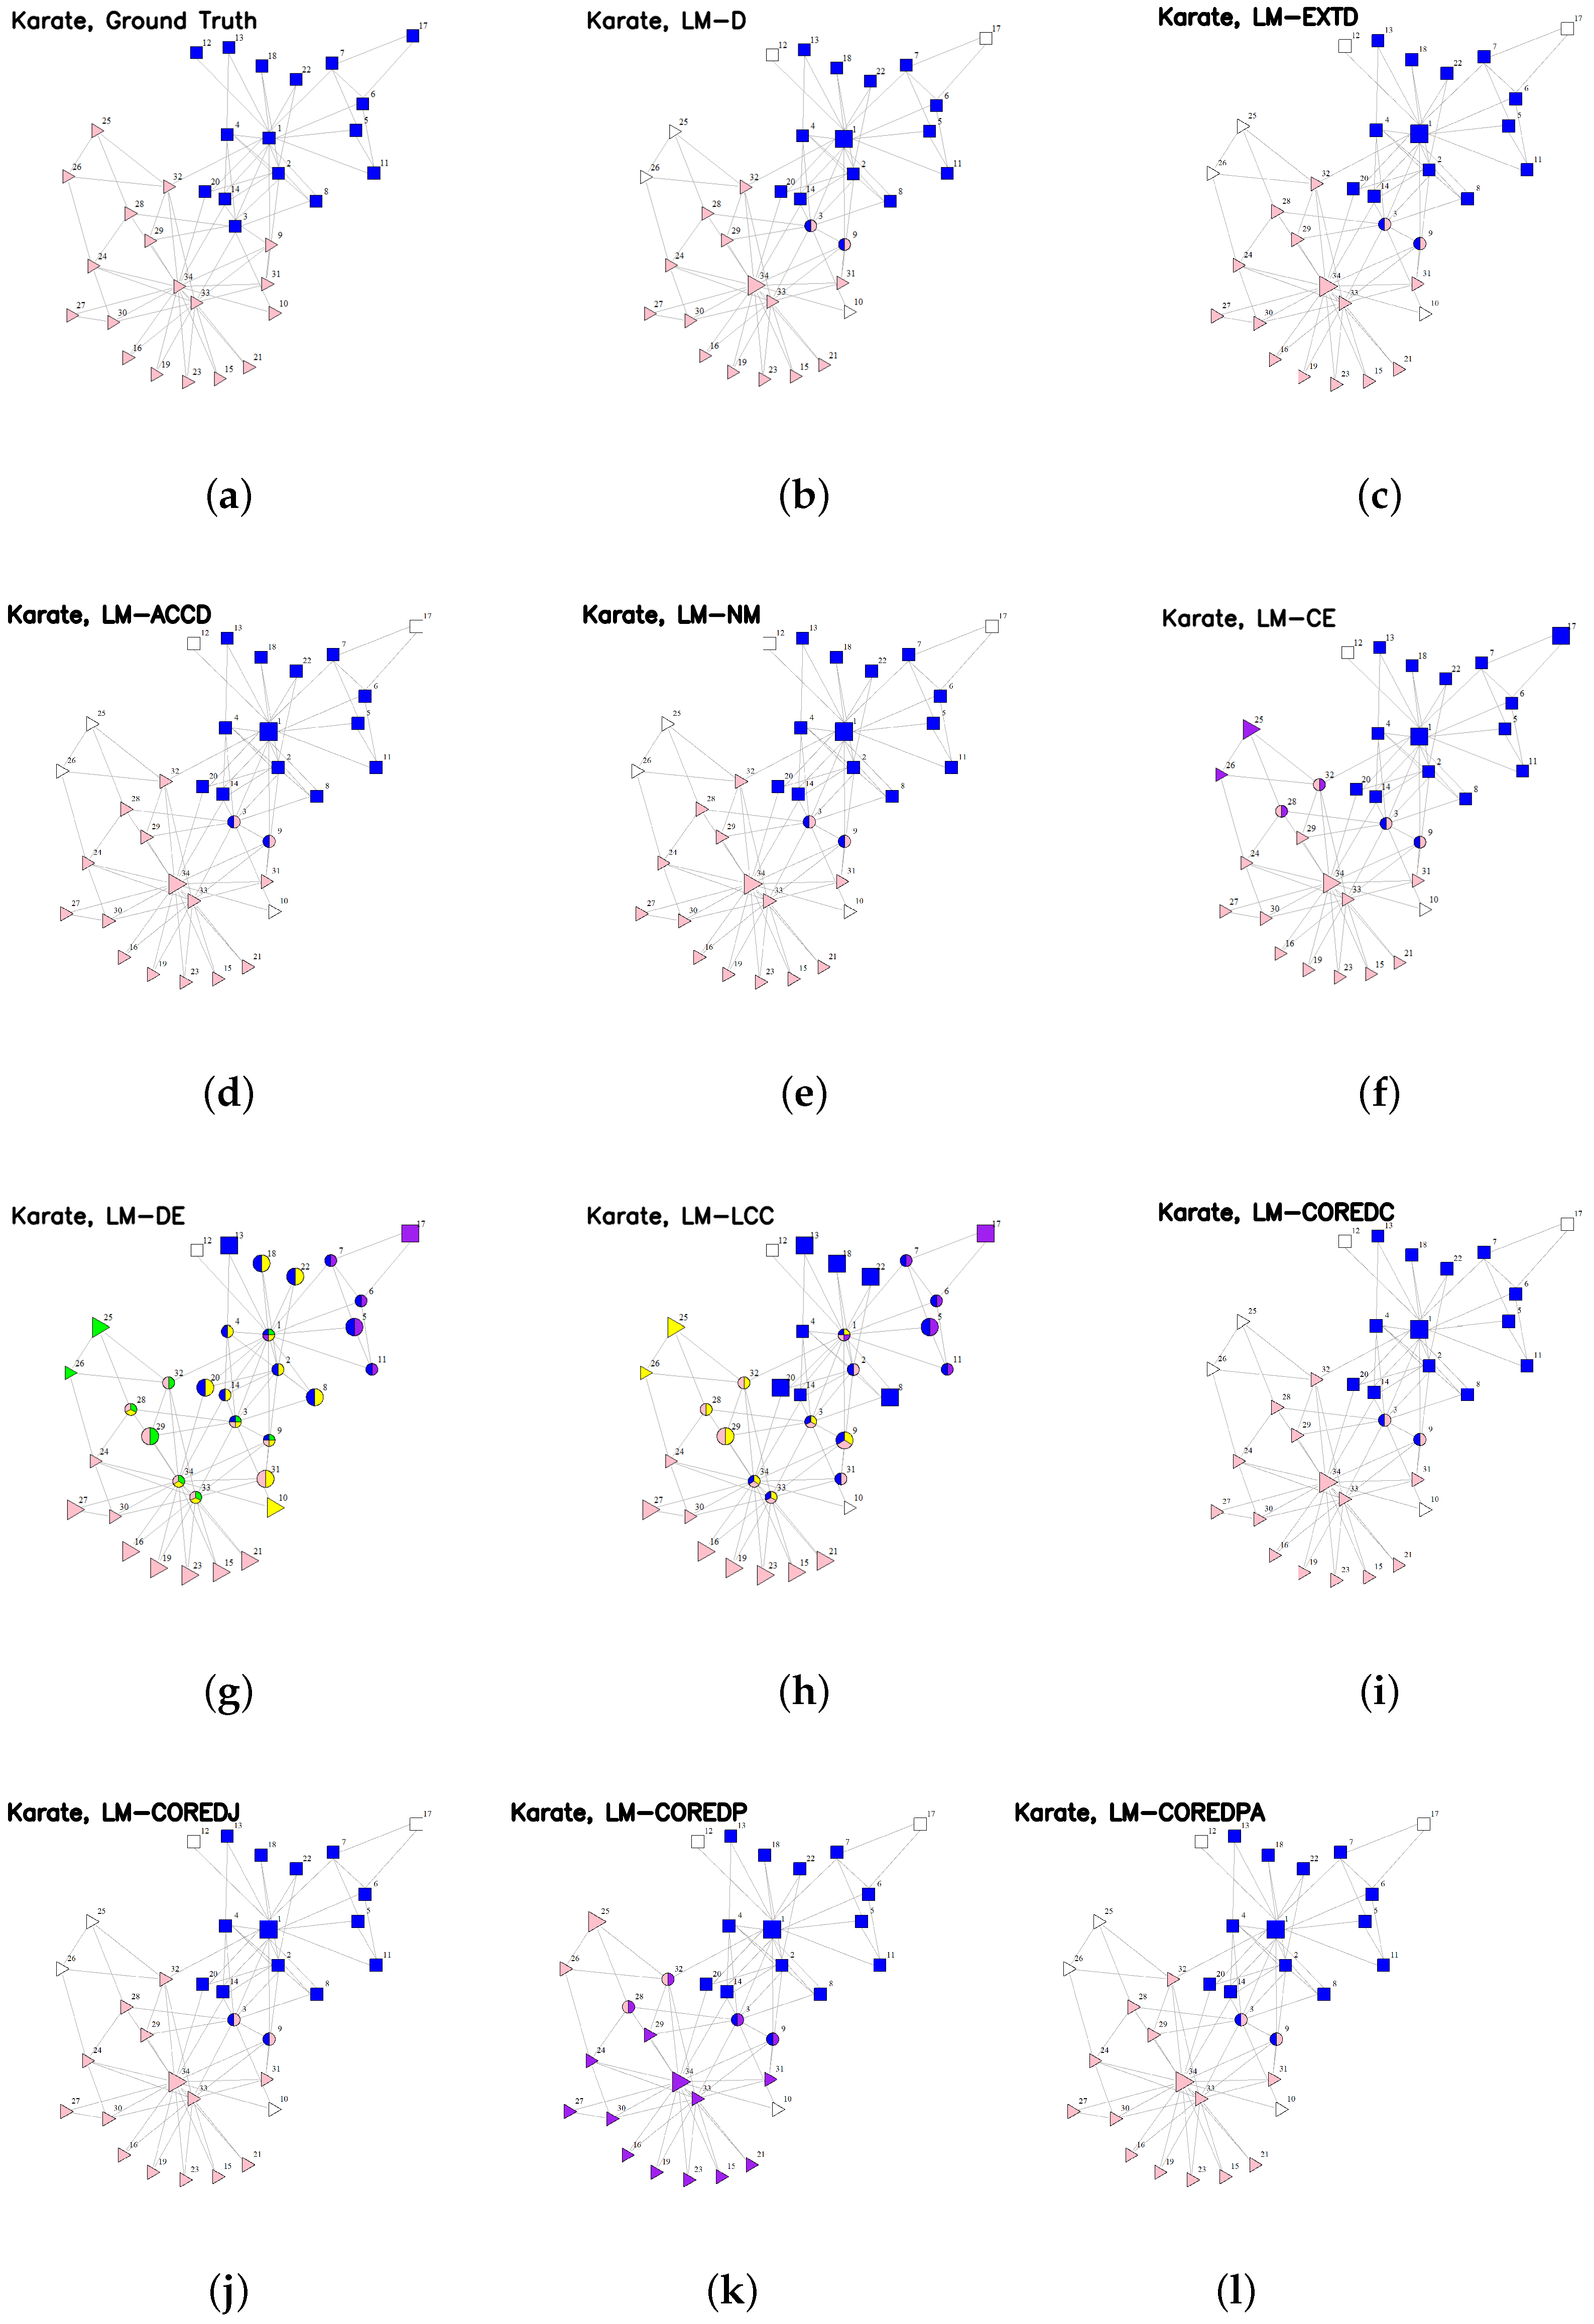
To compare different local seeding algorithms in a fine-grained way, for the two smallest networks, Karate and Dolphin, we visualize the seeds and the communities resulting from different local seeding algorithms, while for the remaining networks, we present the approximations of the ground-truth communities obtained by different local seeding algorithms. Moreover, for the large networks, we only consider the top 5000 ground-truth communities, which are the ones of highest quality (for the YouTube network, only the top 3355 ground-truth communities are provided), since not all the ground-truth communities are structurally good [
21].
The visualizations of ground-truth communities and detected communities for the Karate and Dolphin networks are shown in
Figure 2 and
Figure 3, respectively. The ground-truth communities are distinguished by different shapes, i.e., squares and triangles. The members of each detected community are marked with one color, and the overlapping members are indicated by a circle with several colors corresponding to belonging to communities. The nodes not belonging to any community are colored white, and the seeds are enlarged in size. Over the Karate network, the degree-based algorithms and the core-based algorithms (except LM-COREDP) select the same seeds (i.e., nodes 1 and 34) and therefore yield exactly the same results, which are two communities with two overlapping nodes (nodes 3 and 9) and five nodes not belonging to any community (nodes 10, 12, 17, 25 and 26). This result is relatively consistent with the ground truth. From the network structure, we can see that node 12 connects to only one member of the “square” community and is therefore not detected in this community, and node 3 is adjacent to the same number of members in both communities and is therefore taken as an overlapping member. Because of node 3, node 9 is also taken as an overlapping member. Nodes 25 and 26 are relatively far away from the seed, i.e., node 34, so they are not detected in the “triangle” community. LM-CE selects two seeds for each ground-truth community and splits each ground-truth community into two subcommunities. However, for the “square” community, the two corresponding subcommunities merge into one community that is very similar to the ground-truth community. LM-COREDP selects two seeds, i.e., nodes 25 and 30, for the “triangle” community, and splits it into two subcommunities, but these two subcommunities are merged into one that is very similar to the ground-truth community; it selects two seeds, i.e., nodes 4 and 6, for the “square” community, and the communities detected from these two seeds are quite different from the ground-truth community. For LM-ED and LM-LCC, the detected communities are quite different from the ground truth, since many unreasonable seeds are selected.
Over the Dolphin network, there are also two ground-truth communities, which can be seen from the visualization in
Figure 3. The detected communities that are most similar to the ground truth are yielded by LM-CE, and the only difference is that node 8 is taken as an overlapping member and node 40 is taken as a member of the “square” community. Although LM-CE selects two seeds for the “square” community, this ground-truth community is detected perfectly because the community detected from seed 61 is a subset of the one detected from seed 14. For the “triangle” community, four seeds are chosen by LM-CE, and the ground-truth community is determined by merging the communities expanded from these seeds. LM-EXTD selects nodes 14 and 15 as seeds, and LM-NM, LM-COREDC and LM-COREDJ select the same seeds, which are nodes 14, 15, 46 and 48; but they yield the same communities that very similar to the ones by LM-CE, and the only difference is that nodes 5 and 12 are not detected in the “triangle” community. LM-D selects one seed for the “square” community, and from this seed, the ground-truth community is well detected, except that nodes 49 and 61 are not taken as members, due to their sparse connections to other members. For the “triangle” community, LM-D selects three seeds, and the communities expanded from these seeds are merged into one, where nodes 2, 8, 20, 28, and 55 are taken as overlapping members due to the fuzzy boundary. In addition, nodes 5, 12 and 40 are not taken as members. LM-ACCD selects nodes 15 and 58 as seeds and yields communities that take nodes 8 and 37 as overlap. LM-COREDPA yields communities that are similar to those yielded by LM-CE and LM-D. LM-COREDP selects nodes 14 and 28 as seeds for the “square” community, and this community is well detected by merging the two subcommunities obtained from the seeds, but it selects nodes 34, 46 and 48 as seeds for the “triangle” community, resulting in unreasonable detected communities. For LM-DE and LM-LCC, the detected communities are quite different from the ground truth because too many nodes are chosen as seeds.
Overall, the visualization results for the two smallest networks are consistent with the results shown in
Table 5,
Table 6 and
Table 7. The degree-based algorithms, the core-based algorithms (except LM-COREDP) and LM-NM perform best over Karate, followed by LM-CE; LM-CE performs best over Dolphin, followed by LM-NM, the core-based algorithms (except LM-COREDP) and the degree-based algorithms, which are very similar to each other; and LM-DE and LM-LCC always select too many seeds and cannot discover the ground-truth communities well. In addition, some nodes that have small egonets are chosen as seeds by LM-CE, e.g., nodes 17 and 25 in Karate. These nodes are obviously not the best choices for seeds, which further influences the result of community detection. Other local seeding algorithms have similar disadvantages, especially LM-DE and LM-LCC. A few attempts have been made to filter out those nodes, e.g., Gleich and Seshadhri further excluded the nodes of local minimal conductance whose degrees are lower than a specified value [
37], and Whang et al. first removed the nodes with lower degrees by extracting the largest biconnected component of the network and then performed seeding on the largest biconnected component [
16]. However, how to eliminate those nodes from the seed set is still a critical issue, which we will study in future work.
The approximations to the (top) ground-truth communities for the remaining networks are presented in
Figure 4. The x-axis depicts ground-truth community, and the y-axis is the Jaccard similarity between the ground-truth community and the corresponding detected community. It can be seen that over the Football network, this result is consistent with that corresponding to the F1-score metric, which is reasonable since all 12 ground-truth communities are considered here. Over Amazon, LM-COREDJ and LM-CE yield communities that are most similar to the ground truth, followed by LM-COREDP; over DBLP and YouTube, LM-CE performs best, followed by LM-COREDJ and LM-LCC, respectively; over LJ, LM-CE performs best, followed by LM-DE, LM-LCC and LM-COREDJ; and over Orkut, LM-LCC and LM-DE perform best, followed by LM-CE. The degree-based algorithms, LM-NM and LM-COREDPA always yield the worst results for the large networks, which further indicates to some extent that using only metrics such as Nvi, modularity and conductance to evaluate detected communities is one sided.
To evaluate the efficiency, we compare not only the running times consumed by seeding but also those consumed by detecting communities. Here, we do not consider the Karate, Dolphin and Football networks because both seeding and detecting communities over these networks are performed very quickly, and in many cases, the running time is close to zero. To clearly compare the running times of different algorithms, we compute the relative running time for each algorithm over each network. Specifically, for each network, we scale the running time of each algorithm to the range of [0, 1] by dividing by the maximal running time on this network. The relative running times are shown in
Figure 5. The most efficient algorithm is LM-D, followed by LM-EXTD and LM-COREDPA. The most time-consuming algorithms are the denseness-based ones overall, among which LM-DE costs the most running time, followed by LM-LCC, LM-CE and LM-NM; the difference among LM-CE, LM-DE and LM-LCC is small, but in the phases of seed expansion and merging, LM-CE takes much less time compared with LM-DE and LM-LCC. This is because LM-DE and LM-LCC select many more seeds than LM-CE, which almost directly determines the running times of seed expansion and merging. Among the core-based algorithms, LM-COREDPA is the most efficient one, and the difference between the other three ones is not large. The running times at the phases of seed expansion and merging for the seeding algorithms are positively related to the number of chosen seeds; for example, because they select the fewest seeds, LM-ACCD, LM-EXTD and LM-COREDPA take the least running time at the phases of seed expansion and merging, followed by LM-D.


