Article

A Creative Statistical Model of Geometric Area Index Number for Adequate Estimation of ESG, DESG Goals Achievement, and Other Macroeconomic (Im)balances Dynamics

1
Faculty of Economic Sciences and Law, University of Pitesti, 1st, Targu din Vale Street, 110040 Pitesti, Romania
2
Regina Maria School, Apusului Street 71-73, 062282 Bucharest, Romania
3
Faculty of Organizational Sciences, University of Belgrade, Jove Ilica 154, 11000 Belgrade, Serbia
4
Faculty of Economic Cybernetics, Statistics and Informatics, Bucharest University of Economic Studies, Piața Romană 6, 010374 Bucharest, Romania
*
Author to whom correspondence should be addressed.
Mathematics 2022, 10(16), 2853; https://doi.org/10.3390/math10162853
Submission received: 18 July 2022 / Revised: 6 August 2022 / Accepted: 8 August 2022 / Published: 10 August 2022
(This article belongs to the Section Probability and Statistics)

Abstract

:
This paper can be considered as a brief answer to an old research question. Why do researchers need new statistical instruments based on geometric science? In the introduction, one can find some detailed significances, questions, premises, and hypotheses of the article’s research redistributed in the logic of the section, as only a reminder can do it. There are no mandatory access conditions equivalent to “Let no one ignorant of geometry enter here” from the portal of Plato’ s Academy during the literature review of index numbers (IN) or the index numbers method (INM). The originality of a geometric area index number (GAIN) and the simple description of a statistical instrument are the main characteristics of the next section, which is dedicated to its methodology and data. Therefore, this original statistical model of a classical index number is placed in a continuous changing of geometric coordinates and surfaces, caused by alternate states of disequilibrium and equilibrium in macroeconomic life or existence. Whenever the statistical index method has been considered a dead or obsolete solution, this false conclusion has been because it was conceived without its innovative history and multidimensional mathematical perspective. The complex structure of the article also required a section dedicated to practical approaches through macroeconomic indices systems. In the context of dynamic imbalances, this aspect limits the selective options of the new concept of a statistical model of a geometric area index to several inscribable but also regular polygons (“n-gons”) at the same time. These polygons take on stellar shapes as soon as they capture real dynamics by ensuring a significant degree of coverage of simultaneous evolutions. In the pragmatic section of results and discussions, the new statistical model of the geometric area index is built essentially not only as a new type of statistical-mathematical approach to complex and associated or correlated aggregative variations but also from the idea of practically replacing concrete variants with their functions. The final remarks underline some instrumental specificities concerning both constructive advantages and disadvantages but especially to the limitations and perspectives, which are closely related to some symmetries and asymmetries characteristic of the investigated phenomena.

1. Introduction

In this article, the multidisciplinary significance proposed to geometry in an approach that is simultaneously logical, philosophical, and mathematical is opposed by the simplicity of solutions and accessibility to all the Platonic exclusions’ remarkable scientific disciplines [1]. The geometric adjective in the research title was creatively attached but also integrative to the index number (IN) to reveal a model of statistical-mathematical construction with classical Greek origins and modern aggregative rigors. Focused on extended logical reasoning, ancient Greek geometry was a starting point for scientific demonstrative knowledge, starting from simple associations or confrontations; through the formulation of axioms, statements, and hypotheses; to end with postulates or theorems. Through “Thales and Euclid, Greek geometry perfected proportional evaluations, with the help of Apollonius he initiated the outline of a prolific theory of polar coordinatesto finallymeasure increasingly diverse areas or surfaces extracted from a complex reality”, taking advantage of the brilliant creativity of Archimedes [2]. This study adds insights into the statistical application of the axiomatic approach to geometry as well as uniqueness of perfect polynomials and polyhedra, following the famous motto on the frontispiece of Plato’s Academy motto, which does not discriminate but arranges or hierarchizes access in an admirably undisguised way: “Let no one ignorant of geometry enter here.” (Katz, 2009, p. 41) [3]. Relevance of this study is in proposing, with a Platonic admiration, an innovative selection of polynomials inscribed in a circle of stationary radius in a simplified and standardized percentage (R = 100%), able to describe more correctly and more adequately states of imbalance or macroeconomic equilibrium, always reconstructible in the coherent and validating spirit of geometry.
The relevance of the topic is emphasized by the frequent and common usage of the statistical indices in research and practice. Having a vital role in every field of economic, cultural, healthcare, administrative, and many other issues, statistical indices give basis to track the past performance, estimate the current state, and plan the future development for almost every human activity. The research gap still exists in innovative methods to revitalize, improve, and revive a classic method such as the index method—whenever the statistical index method has been considered a dead solution, this false conclusion has been based on the fact that it was conceived without its innovative history and multidimensional realism of the mathematical perspective. The first and major research question of this article is related to the ability of the statistical-mathematical method of indices as a method creatively enriched by the contribution of geometry to quantify variability and, especially, the state of equilibrium in various phenomena of economic or social life. An original statistical model of a classical index number is therefore placed in a continuous change of geometric coordinates and surface caused by alternate states of disequilibrium and equilibrium in macroeconomic or social life. In the face of associative or correlative diversified phenomena but also of the complexity of the surfaces of (inter)correlation of the new realities in a permanent dynamic, the mathematical statistics generate solutions of deep methodological knowledge as well as adequate instrumental quantification. The use of a series of variables with distinctive databases and the selection of relevant variables, geometric programs, or with its geometry and the collection of data from various points or spaces provided the formulation of premises and hypotheses to understand how various complex phenomena vary or are influenced by the meanings or redefinitions of geometry. This research aims to succeed in a new instrument of modern mathematical statistics to measure creatively, precisely, and adequately the (multi)layering and multidimensionality of complex phenomena. Further, our proposition can be developed into the theoretical approach concerning the assessment of achieving sustainable development goals in all demographic, environmental, social, and governing (DESG) aspects. Our article gives an explanation of a following set of important questions: When and how did the statistical index become an instrument for measuring macroeconomic equilibrium, and how did this concept change over time? Why is a surface preferred over a simple linear or vector approach? Could it be that a geometric index has a greater capacity to capture temporal or spatial evolutions, or can the scale of the phenomenon be better reflected by the areas of inscribable polygons? A brief literature review provides a succinct answer, emphasizing the need to energize a historical process creatively, never fully completed, and as a living method focused on a relatively young instrument that has exceeded three centuries of existence since the first decade of the 21st century.
Some creative instrumental questions related to the fields of demographic, environment, social, and governance application of the index method give the necessary substance to the methodological section outlining the original approach of the article: (1) Can the constructive evolution of individual indices and especially of index systems testing reduce measurement errors and set sustainable goals? (2) In what way does an original and complex model of statistical index capture in an increasing proportion the dynamics of some states of imbalance or equilibrium? (3) What are the limitations or statistical-mathematical corrections derived from the specificity of the investigated phenomena? (4) Does the construction of the new index involve multidisciplinary methodological aspects simultaneously specific to statistical thinking and general mathematical thinking but also distinct from geometric and even trigonometric approaches?

2. Materials and Methods

A summary journey of the instrumental beginnings of an index number (IN) is certainly an implicitly incomplete one even when it naturally requires distinct steps regarding the dating and location of the investigative beginning, conceptualization and typology, statistical construction, and mathematical formalization. Index numbers and indices’ methods represent the most creative approaches to statistics in modern science, offering distinctive solutions of statistical-mathematical thinking forced to reason as accurately as possible in the face of population heterogeneity and complexity of investigated variables. The original result called the index number (IN) was and remains a statistical tool, born more than three centuries ago from the remarkable curiosity of an English cleric and political arithmetician, William Fleetwood, to measure the real evolution of the purchasing power of the population in England, which is research published in Chronicum preciosum [4,5].

2.1. Literature Review and the Theoretical Frameworks of the Assessment of the Socio-Economic Dynamic

The dating and location of the IN’s investigative debut are relatively scattered over almost half a century, in line with both the classic work of Irving Fisher (1922) [6] and the most recent work of Walter Erwin Diewert (1993 [7] and 2018 [8]) or Ralph, O’Neill, and Winton (2015) [9]. The statement is easy to prove historically by three published constructions, placed in the world of prices or the purchasing power of some national currencies or, more synthetically, in simple attempts to measure inflation: the William Fleetwood index (1707 [10]), Charles Dutot (1738 [11]), and Gian-Rinaldo Carli (1764 [12]).
William Fleetwood takes the lead in homogenizing a heterogeneous variable (price), while Charles Dutot and Gian-Rinaldo Carli have the merit of solving the problem of purchasing power assessment and implicitly dimensioning by transforming IN into a relative quantity of values, reported as absolute in time (space). The process of dating the appearance of IN can be considered complete only with the fluidization of mathematical processing generated by the introduction in the calculation algorithm along with the qualitative variable of a quantitative factor, gradually called the weight or coefficient, by Arthur Young (1812) [13].
Finally, semiotics focuses on origin explorations and evolutions research of language and linguistics and, as basic cognitive science, distinguished between three types of signs: indices, icons, and symbols. Having an etymological origin in Greek deixis, which became, in Latin, index, the statistical-mathematical concept of index number (IN) gradually acquired multiple meanings and synonyms, such as a pointer, indicator, title, list, special number, or even inscription [14]. The conceptualization of IN as a historical process was naturally subject to the logical principles argued by definition and typology: (i) identity; (ii) non-contradiction; (iii) tertium non datur; (iv) sufficient reason; (v) consistency; (vi) completeness; and (vii) independence. Modern logic emphasizes the importance of IN replacing variation with a system of relative constants and simplifying and classifying the results based on the construction and practical formalization of the indices’ method [15].
The evolution of statistical mathematical meanings and of the IN-derived typologies starts with the meaning of the “measure” of the average change in a variable (or group of variables) over time”, with the emphasis on the quality of the average relative value in a pragmatic context, as evidenced by the dialogue published in The Economic Journal (1923) between Arthur Bowley [16] and Irving Fisher [17]. After “gauging the changes in some quantitative phenomena which we cannot observe directly” in Arthur Bowley, the dominant meanings of IN become those of “technique for measuring changes of a variable” and “device for measuring differences in the magnitude of a group of related variables” by Frederick Croxton and Dudley Cowden [18]. At the end of the twentieth century, the meaning of IN became by mathematical generalization that of the function F: D → R, which projects a set “D” of objectives (information and data) of distinct interest in a set “R” of real numbers and thus satisfies a system of relevant conditions in Wolfgang Eichhorn [19,20]. Similarly, IN typology has expanded from the dominant uses of the consumer price index (CPI) to those related to stock market fluctuations, such as the Dow Jones transportation index (DJTI in 1884) or Dow Jones industrial average (DJIA in 1896), etc., later going through all economic and social phenomena to measure even some different sentiments such as corruption, risk appetite, fear, greed, liberty, etc. Associated aggregations have transformed a classic form of IN from the elementary or individual type of index (IN) to synthetical or composite one (CIN) and finally into real systems of IN, structured according to quality (price, wage, performance), quantity, value (apparent or nominal evaluation), or generated by the special purposes (stock markets, portfolios, investments, etc.).
The statistical construction and mathematical formalization of IN, as an adequate estimator, were initiated in the logic of statistical average values by a simple calculation or a pragmatic evaluation of arithmetic mean (Carli, 1764), geometric mean (Jevons, 1865), or harmonic mean (Coggeshall, 1887) [21]. Interest in algebraic indices has become essential, focusing on a wide range of mean values with substitution values at the group or population level to the detriment of other mathematical constructions. This stage, considered purely statistical, generated a specific taxonomy of index systems associated and capitalized instrumentally. The new IN systems created continuously in the first century and a half after their appearance were similarly structured in arithmetic, geometric, or harmonic indices (Laspeyres, 1864; Paasche, 1874; Marshall-Edgeworth, 1885; Palgrave, 1886; Bowley-Edgeworth, 1887; Walsh, 1901; Fisher, 1922; Konüs-Byushgens, 1926; Cobb-Douglas, 1928; Torngvist, 1936; Division, 1925; etc.) [22]. A mean value or an interiority test validates IN when the final value of the index lies between the highest and the lowest levels of the analyzed variable, and thus, the first theoretical test appears as the first signal of index selection not only as statistical construction but also as mathematical formalization.
In the case of IN, the continuous instrumental specialization is easy to exemplify with the help of the consumer price index (CPI) [23] which detailed, reunited, and multiplied the creative solutions, finally aggregating index systems in complex index methods: (i) Jevons-Gini-Eltetö-Köves-Szulc (Jevons-GEKS, 1964), improved by Summers (1973), Cuthbert (1988); (ii) Geary-Khamis (GK) proposed by Geary (1958) and developed step by step by Khamis (1970, 1972, and 1984); (iii) Iklé-Dikhanov-Balk (IDB) (1972), redeveloped by Dikhanov (1994), Dikhanov (1994), Rao (1995), Balk (1996), Hill (1999), Deaton and Heston (2010), etc. [24,25].
In parallel, the generation of IN-associated systems has developed one of the richest statistical-mathematical literature, using a wide range of tests and imposing statistical validations on positivity, identity (stationarity), monotonicity in current values, monotonicity in the base period, linear homogeneity, homogeneity of degree, proportionality, additivity, dimensionality, commensurability, expansibility, time reversal, circularity (transitivity or concatenation), symmetry, antisymmetry, etc. [26,27].
A complete reminder of the article thus includes a section dedicated to practical investigations through indicator systems. In the context of dynamic imbalances, this aspect limits the selective options of the new geometric index statistical model concept by ensuring a significant degree of coverage of simultaneous evolutions. The dominant option for certain inscribable polygons but also regular at the same time, which become stellar as soon as they capture the dynamics of real economic or social life, historically follows a natural geometric course, gathering ascending from three, four, or five sides to a limit with decisional impact or a statistically permissible maximum error threshold (maximum acceptable threshold of 5%). Some of these regular polygons (“n-gons”) can describe multiple states nuanced by alternative equilibrium and imbalance and can reveal the simple evolution from Pythagorean, Euclidean, Keplerian, and Gaussian ways of geometric thinking to modern inter-, trans-, and multidisciplinary scientific thought. Polygons inscribed in a circle with a radius periodically transformed into an index reporting base can offer a better solution focused on maximizing methodological evidence or statistical clarity. Geometric and statistical characteristics remain essential to any researcher from an instrumental and creative point of view. In an applied section of results and discussions, a new statistical model of IN is built essentially not only as a new type of statistical-mathematical approach to complex, associated, or correlated aggregative variations but also from the idea of “practically replacing concrete variants with equivalent or weighted functions as their importance. The new statistical model of geometric index focused on surfaces defined by imbalances (GAIN) was inspired from the beginning by the idea of the geometric landmark Langlands (Frenkel, 2007 [28] and Crowell, 2022 [29]) but remained placed in a dominant statistical direction, with simplifying accents. The original model in this article is proposed from a geometric perspective and less from an algebraic one, being preferred to the opinion of Corrado Gini on applied statistics without making theoretical or mathematical calculation excesses. The geometric index exposed as GAIN is naturally subject to final remarks in the conclusions section, which contributes to the exposition of some instrumental specificities regarding both advantages and constructive disadvantages, but especially to limitations and perspectives, in close connection with some symmetries and the asymmetries characteristic of the investigated phenomena. The widespread use or not of new ideas and statistical models of geometric tools depends on the abilities of geometric representations to outline dynamics of economic, social, etc., surfaces. Betting on accurate and adequate knowledge of the complexity of economic and social phenomena with the support of mathematicians and especially geometry remains essentially a possible abstract process but also under the impact of uncertainties. Thus, the instrumental risk related to the understanding of the concrete areas represented is amplified by the risk of diminished or amplified substitution of geometric surfaces in an increasingly dynamic universe in which this model of geometric area index number (GAIN) arises, to be found in practically in the short or medium term whether “it will survive or not”. Both the innovative intentions in the title and the content of the article suggest that the paper is just “provisionaland “relative premature” (Langlands, 1996) [30] even if some important basic concepts from the geometric area index number to the equilibrium index are available. Many readers can see that an original index needs more mathematical calculus and elaboration, confrontation, and validation. As a natural consequence, future research must start with the geometric volume aspects based on the substitution of regular-space polygons with regular polyhedra.

2.2. An Original Methodology for Geometric Area Index Number (GAIN)

Individual or associated IN in systems has been generated historically by repeated improvements of some algebraic constructions based especially on average values, focused on systematic index principles, and characterized by determination and selection of (1) specific purposes; (2) base periods; (3) variables; (4) quantitative factors; (5) qualitative factors; (6) appropriate weights; (7) appropriate averages; (8) appropriate formulas; (9) adequate tests; (10) appropriate validation techniques; (11) chaining’s methods; (12) confrontation methods; and so on [7,8,19,20,25,31].
To understand more complicated concepts in mathematics, abstractions are used, as in the classic example of understanding a Hilbert space, with the help of rigorously hierarchical concepts of pre-Hilbert spaces [32], and also, generating a statistical-geometric methodology specific to a GAIN index requires multiple rigorous ascending notional hierarchies that are, in terms of their understanding, as accurate and complete as possible. The creative methodology of this paper integrates ascendingly 12 original steps: (I) synthesizing an in-depth approach to complex phenomena; (II) three-dimensional, temporal, spatial, and structural investigation; (III) adequate detailing and diversification through indices derived from the explanatory factors; (IV) the extension of the intention (the meaning of the simplified reality) and the increase of the coverage of the extension (the expansion of the described reality); (V) maximizing the connection of surfaces with the simplified and described reality; (VI) gradual appreciation of the dynamics; (VII) ensuring the necessary conditions for the aggregation of primary temporal indices or the globalization of regional indices; (VIII) diversification of data sources and beneficiaries of results; (IX) continuous limitation of the restrictions of the statistical-mathematical processing of the data and the level of errors; (X) the continuous extension of the coverage of phenomena and processes describing subsystems of reality; (XI) homogenization of increasingly heterogeneous populations; (XII) synthesis and balancing of imbalances, etc. [33].
In its statistical form, IN remains the ratio of two significant numbers traditionally expressed as a percentage. These two numbers are measures designed to underline real changes in one variable or a group of associated variables over time, territory, or even structure (i.e., HHI created by Orris Herfindahl and Albert Hirschman [34,35,36] is frequently included in IN typology [37,38]) based on a specific property or measured phenomena in universal terms of a standard. A standard methodology for the construction of a new IN risks becoming more complicated at the same time, a result of a relatively long historical process already described, turning into a trivial and continuous statistical improvement on multiple testing or validation as well as reducing errors. The statistical methodology proposed below reconsiders and simplifies this path, appealing to “lucid amazement in front of a science that tells the truth”, as expressed plastically but also admiringly in front of geometry by Max Frisch in his inimitable play, Don Juan oder Die Liebe zur Geometrie (Don Juan or the Love of Geometry) [39]. The purity of the demonstration, the lucidity of the abstractions, and the precision of the calculation from the classical geometry make impossible the presence of systematic errors or momentary whims in the process of constructing an original and complex statistical index model able to promptly and consistently capture the evolutions of simultaneous imbalances and different levels of intensity, with natural limitations or statistical-mathematical corrections derived from the specificity of the investigated phenomena.
(I) Why does GAIN start from a simple circle? Synthesizing and in-depth approach to real complex phenomena such as economies, populations, territories, etc., selects the circle as the maximum area exposed to the investigation. Using the circle or its purity as a consecrated geometric place simplifies both the presence of the primordial quantitative landmark of Arthur Young (1812) and that of the calculation of the reporting basis or the level of errors. Of the regular, simple, and closed plane curves having the same length, the circle is the one that completely borders an investigated field, having its maximum area. The work became a certainty after 1827 thanks to Jacob Steiner, who proved that the circle retains its uniqueness or exclusivity through the maximum area held to all other flat, convex, and isoperimetric figures. From here, there is no room for any deception or whim [40] in the option of selecting the circle, as a figure that bears his name with a certain pride of abstraction as a geometric place, but also of maximizing the surface as a foundation or landmark zero within the GAIN methodology. A circle with a radius R = 1 or R = 100% and that automatically has an identical area πr2 identical at the end with π is the fundamental methodological step as well as the maximum methodological abstraction. According to Ferdinand von Lindemann’s demonstration of 1882, π is a transcendent or non-algebraic number that can translate an IN variability appropriate to reality. The famous π cannot be constructed only with the ruler and the compass, as in classical Greek geometry, and especially, it cannot be the root of a polynomial equation with natural number coefficients. This last aspect obliges one methodologically to establish a minimum number of decimals. In the logic of the new GAIN, in this article, calculations were made for π expressed with only 10 decimals, i.e., for a value of 3.1415926535.
(II) Why does GAIN use regular convex polygons inscribed in the same circle of radius 1 or 100%? The three-dimensional, temporal, spatial, and structural investigation brings two other abstract landmarks through simultaneously convex and regular polygons as distinctive and maximized areas, strictly necessary constructively; beyond the πr2 surface, they become a simple π of the circle as a primordial standard, allowing quantification. Simultaneous of ascending or descending imbalances from the investigated reality, this is associated with the decisional role of any IN. The GAIN methodology takes from Euclidean geometry, as selected support, the area of the strictly convex, regular, and inscribable polygon due to the qualities conferred as a flat, closed geometric figure formed by a finite number of segments of straight lines or sides forming interior angles less than 180° (degrees).
Based on Euclidean geometry and, in particular, on the Euclidean plane, born with Euclid’s Elements (c. 300 B.C.) and extended up to Pappus’s Synagogue or Collection (c. 340), this methodology has selected five names and contributions to GAIN originality: Euclid, Zenodorus, Hypsicles, Diophantus, and Pappus [41,42,43]. All of these represent the essential sources or landmarks, which generated originality in selecting the appropriate geometric areas and in validating the essential methodological aspects of GAIN. Euclid gave geometry the axiomatic method and generated the fascination of the circle, constructed when a point for its center and a distance for its radius are given. The circle, as a synthetic expression of the imbalances of the phenomenon investigated with GAIN, can always be placed in the same space and at the same distance from its center, adding a reference area π when it benefits from radius = 1 or 100%. The circle is also the expression of the limit through the ability to generate a maximum value of the area concerning the geometric shapes or the surfaces of the inscribed figures. Zenodorus descended into the depths of the perimeters and areas of special geometric shapes called by the Greeks polygons, regarding the convex and regular ones. Similar to a circle, a simple closed curve that divides the plane into two regions, a polygon is traditionally a plane geometric figure bounded by a finite chain of straight-line segments (edges or sides meeting in a vertex or a corner), closing in a loop and forming a closed chain. Zenodorus wrote a treatise on isoperimetrical figures, but Pappus and Theon preserved only an insignificant part of his work, more precisely 14 propositions, which help the authors of the papers to make some important methodological connections of the GAIN problems discussed: “of isoperimetrical, regular polygons, the one having the largest number of angles has the greatest area; the circle has a greater area than any regular polygon of the same periphery; of all isoperimetrical polygons of ‘n’ sides, the regular is the greatest; of all solids having surfaces equal in area, the sphere has the greatest volume” [41], (pp. 58–59), “of segments of circles, having equal arcs, the semicircle is the greatest.” [42] (p. 71).
In A History of Greek Mathematics [43] (p. 207), Pappus has recognized or simply appears to have followed Zenodorus pretty closely, describing three major aspects of isometric figures: (1) “of all regular polygons [’n-gons] of the equal perimeter, which is the greatest in the area which has the most angles; (2) a circle is greater than any regular polygon of equal contour; (3) of all polygons of the same number of sides and equal perimeter, the equilateral and equiangular is the greatest in the area…” [43] (pp. 213–218). Hypsicles and Diophantus both quote Zenodorus for giving a similar definition as the maximum value for a polygonal area. Hypsicles himself used polygons to define polygonal numbers. Regular convex polygons were most expressively detailed by Hypsicles, starting from the simplicity of the contained triangles [44,45]. In this second methodological stage of instrumental selection, the preference for a convex polygon in which, whatever its side, all the vertices not located on the considered side will be on the same side of the line in which that side is included is completed by the character of a regular polygon, concerning which the convex polygon will hold all congruent sides and all angles.
The methodology thus capitalizes on the theorem also attributed to Zenodorus even if it has not been preserved in the manuscript but was confirmed by Diophantus (Polygonal Numbers and Arithmetic) and later reconfirmed even by Pappus, after which the regular inscribable convex polygon has the largest possible area in the circle, respectively, at a distinct typological level or in relation to the number of sides or angles [41,42,43,44]. The initial constructive premise is balanced, starting from a simple procedure by which a circle is divided into “n” congruent arcs (n ≥ 3) that successively unite the division points, obtaining practically all regular polygons with “n” sides ( l n ), all congruent because they support arcs of the same measure ( 360 ° n ) [45,46]. The notations used are “Pn” for the regular polygon with “n” sides, R for the radius of the circle in which the polygon is inscribed, and “ap” for the apothem or segment taken from the center of the circle circumscribed to the regular convex polygon, perpendicular to its side (Figure 1). Finally, a minimal conclusion of the previous quantification approach is that it is easy to calculate the major elements in regular polygons that can be engraved in a circle (a phenomenon investigated with a certain decisional error).
ΔAEB is an isosceles triangle, and from ΔEFB, which is a right triangle, we deduce:
FB = EB × sin 180 ° n = R × sin 180 ° n     l n = 2 R × sin 180 ° n
FE = EB × cos 180 ° n = R × cos 180 ° n     a n = R × cos 180 ° n   ,   so
A n = n × A Δ AEB   or   P × a n 2 = n × l × a n 2 = n × 2 R × sin 180 ° n × R × cos 180 ° n 2 = n × R 2 × sin 360 ° n 2
As Acircle = π · R2, π ≈ 3.1415926535, to then determine the constructional limit of GAIN with a standard type error (5%, 3%, or 1%), we quantify for regular polygons the ratio of their areas and the area of the circle in which are registered the following:
A n A c i r c l e = n × R 2 × sin 360 ° n 2   R 2 = n × sin 360 ° n 2  
The detailed solution of the equation leads to Table 1, the latter being italic to the triacontagon, in relation to an evolutionary perspective favorable to the construction of GAIN in the future, from a methodological and applicative point of view.
(III) Adequate detailing and diversification through derivative indices of explanatory factors is a third important methodological step. The GAIN stationary level with attached error presented in detail describes a typology specific to this original IN in relation to regular convex polygons or “n-gons”. The methodological process is placed simultaneously under a double restrictive or limiting impact, both of the systemic approaches that limit the number of explanatory factors, and of the standard decisional errors (essential values described in the last column of observations from Table 1). For example, phenomena closely related to human development were initially described by HDI, a classical CIN that measures three key factors (dimensions): life expectancy for long and healthy life, expected and mean years of schooling for access to education, and gross national income per capita for a decent standard of living [47]. The HDI value is quantified on the basis of a geometric mean that reduces the level of substitutability between factors (dimensions). Perhaps, the unacceptable level of error in the case of initial trigon or triangle (58.65%) can explain the new statistical preferences for new HDI with four factors or the historical index of human development (HIHD), including adult literacy as the fourth factor (diminishing the level of error to 36.34%). GAIN, as an original IN, can measure more clearly the evolution of any disequilibrium, homogenizing the importance of factors and also of the changes in HDI or HIHD or even better as a dodecagon. GAIN can offer the maximum acceptable level of statistical error (5%). The augmented human development index (AHDI) is indeed illustrative proof of this real need to increase the number of dimensions or factors [48].

3. Results and Discussions

The criterion of the synthesizing geometric approach applied in the depth of the complex phenomenon, including economic, demographic, educational, social, etc., by appealing to the areas of regular (convex) polygons or by introspecting into the n-gons” universe offers a maximum degree of generality compared to any type of IN or CIN, which once built according to the GAIN methodology with a radius = 1 or 100 % standardizes calculations and error levels. GAIN is defined as a value resulting from quantifying the dynamics of some defining variables for the analyzed phenomena, systems, or subsystems that approximate much more nuanced statistic mathematics with higher precision specific to the accuracy of geometry but also with a defined error level of greater clarity on the rigorous scale of regular convex polygons. For the exemplification of the utility and the methodological concretization of GAIN, the chosen object of the investigation is that of macroeconomic imbalances dynamics (MID). Economic equilibrium remains the object of many studies or research and has many significances based on measuring instruments and real limits: (i) the equalizer of the production with the monetary mass (Irving Fisher equilibrium); (ii) a fraction of the real income that companies want to keep as cash (Arthur Pigou equilibrium); (iii) the general theory of employment, interest, and money (from Walrasian mechanism to Maynard Keynes general theory); (iv) the psychological result of the negotiations (Nash equilibrium); the central concept of the mathematical theory of games (Morgenstern and von Neumann equilibrium); (vi) a set of main conditions for a general balance (Kenneth Arrow and Gerard Debreu); (vi) an economic ideal in which, even if all conditions were met, nothing can guarantee and maintain the general balance but can measure MID (Sonnenschein-Mantel-Debreu), etc. [49]
The structures deepened in the article have been demonstratively restricted on two levels: (i) subsystem (in the case of the trine or concretely inflation triangle, whose high level of error gives it limited values to the relative identification of the price trend) and (ii) system (magic square or tetragon, better known as carré magique; strategical and conjunctural pentagon; perennial hexagon; and dodecagon, with the last being acceptable in terms of decision risk).
Simultaneously pursuing the obtaining of some results but also the confrontation of the synthesis capacity and of the originality of GAIN concerning the classical statistical and economic theory, the regular polygons of the n-gon type that were selected for GAIN quantification are the following five: (i) “3-gon” and (ii) “4-gon”, “5-gon”, “6-gon”, and “12-gon”. The application procedure was unitary and methodologically comparable, being similarly staged in depth:
Step 1. This first step plays a role in the concretization of the specific theoretical solution for each of the five cases (with geometric demonstrative accents revealed with the help of two areas, the first prefigured or stationary and the second post-figured or evolutionary).
Step 2. It continues with the territorialization and specification of the data sources used for any capitalized IN composites (standardized tabular and avoiding redundancy of indicators).
Step 3. The distinctive calculation step consists of estimating the GAIN for a certain level of error already known or quantifying the “n-gon” GAIN, respectively, distinctly at the level of each “regularly selected polygon”.
Step 4. The last formal step consists of a concrete interpretation along with the presentation of some observations and final comments.
For the concrete case of a subsystem, the balance/imbalance of prices in the European Union—27 countries (from 2020)—was chosen as an example. The three CINs that generate the distinct triangle or regular triangle for the base period are the harmonized index of consumer prices (HICP), the house price index (HPI), and the index of producer price in industry (IPPI), which are basic data belonging to the years 2020 and 2021.

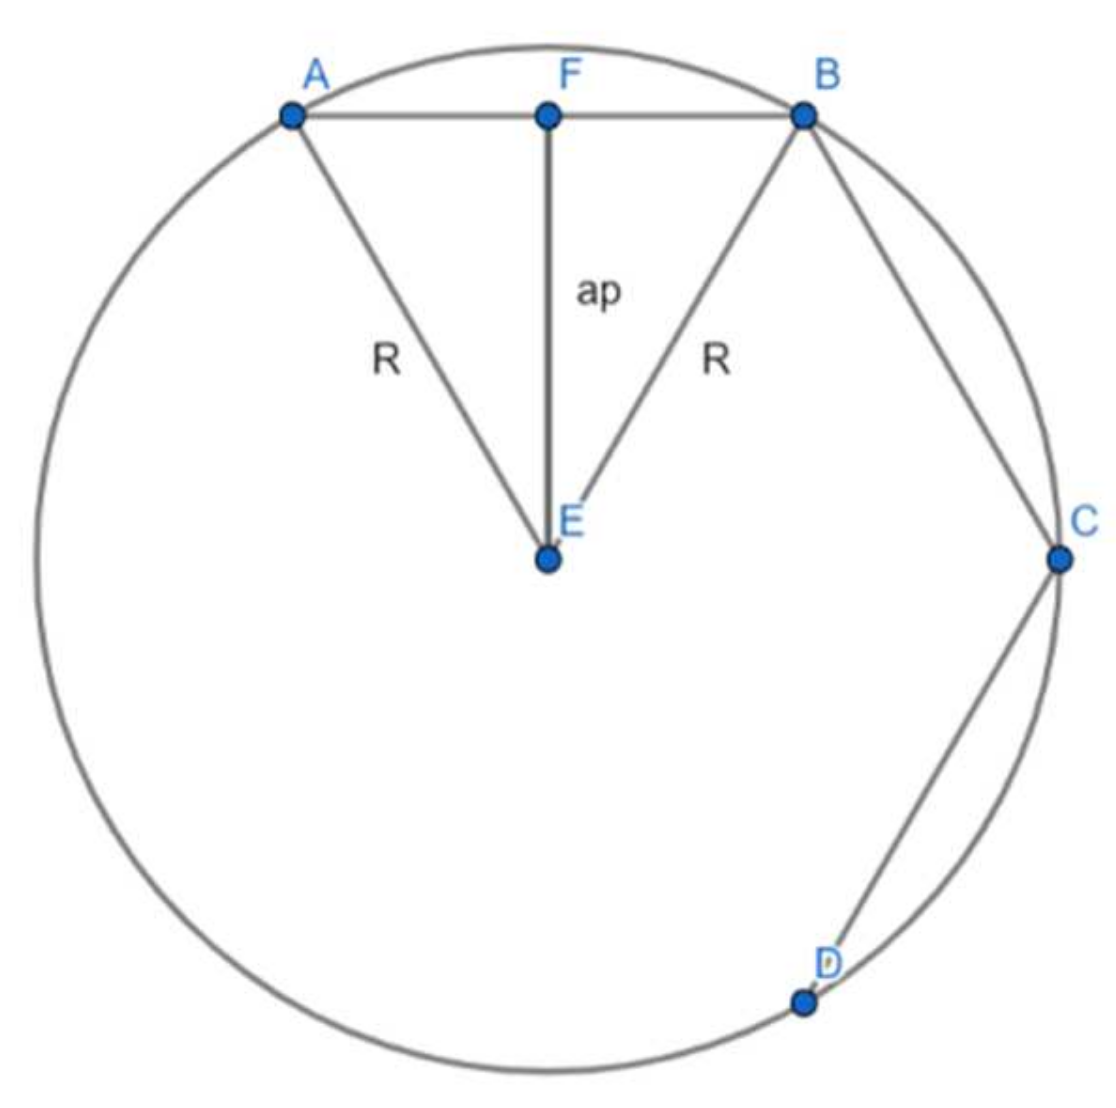
3.1. ”3-gon” GAIN or Inscribed Equilateral Triangle

Step 1: Theoretical generalization in the case of “3-gon” GAIN (inscribed equilateral triangle or polygon with three congruent sides and with a value of each circle angle of 120°).
The drawings in Figure 2, and in further “n-gon” illustrationsare only visual examples; they do not strictly reflect the measures but offer a constructive image. Regardless of the visual appearance, in all consequent figures of both the initial and variant with modified radius, it is considered that R = 1. Starting from the valid relation in an inscribable equilateral triangle (base year):
A A 1 O A 2 = A 1 O × O A 2 × sin A 1 O A 2 2 = R 2 × sin 120 ° 2 = R 2 × 3 2 2 = R 2 × 3 4
One reaches:
A A 1 A 2 A 3 = A 3 = 1 i < j 3 A A i O A j = 3 × A A 1 O A 2 = 3 R 2 3 4  
Furthermore, for radius = 1 or 100%, the standard result becomes:
A 3 = 3 3 4 = 1.299038106
In the variant of the trine with changes of the radii with ki, where i = 1 , 3 ¯ , and Ri = R + ki:
A A 1 O A 2 = A 1 O × O A 2 × sin A 1 O A 2 2 = R 1 × R 2 × sin 120 ° 2 = R 1 × R 2 × 3 2 2 = R 1 R 2 × 3 4
Finally:
A A 1 A 2 A 3 = 1 i < j 3 A A i O A j = 1 i < j 3 R i R j × 3 4 = 3 4 1 i < j 3 R i R j
First, a fixed stationary level of R = 100% or R = 1 is established and then the ki values. For example, the index 105% means plus 5, and 94% means −6%, following the relation of Ri = R + ki. Further, please note that in Table 2, Table 3, Table 4, Table 5 and Table 6, the point Ai corresponds to the i-th economic indicator.
Step 2: Data sources and IN processing to ensure statistical comparability.
Step 3: An estimate of the GAIN value “3-gon” with a known error level.
3 g o n   G A I N = 3 4 1 i < j 3 R i R j :   3 3 4 = 1 i < j 3 R i R j   : 3
3-gonGAIN = 3.2662: 3 = 1.0887 or 108.87%
Step 4: Final interpretations, observations, or comments.
In economic theory, in the price subsystem, inflation defines an imbalance of macroeconomic imbalances (in all consumer markets, real estate investments, industrial markets, etc.) and does not bring with it a real growth of the economy but only an apparent one. In this context, the purchasing power index, which is the inverse value of “3-gon” GAIN, correctly substitutes the real downward and not upward evolution of the economy with a value (1: 108.873), i.e., the price subsystem; in this case, it is more adequately represented by a “3-gon” GAIN = 1: 1.0887 = 0.9185 or 91.85%. “3-gon” GAIN thus solves a problem of real or quantitative macroeconomic comparability.

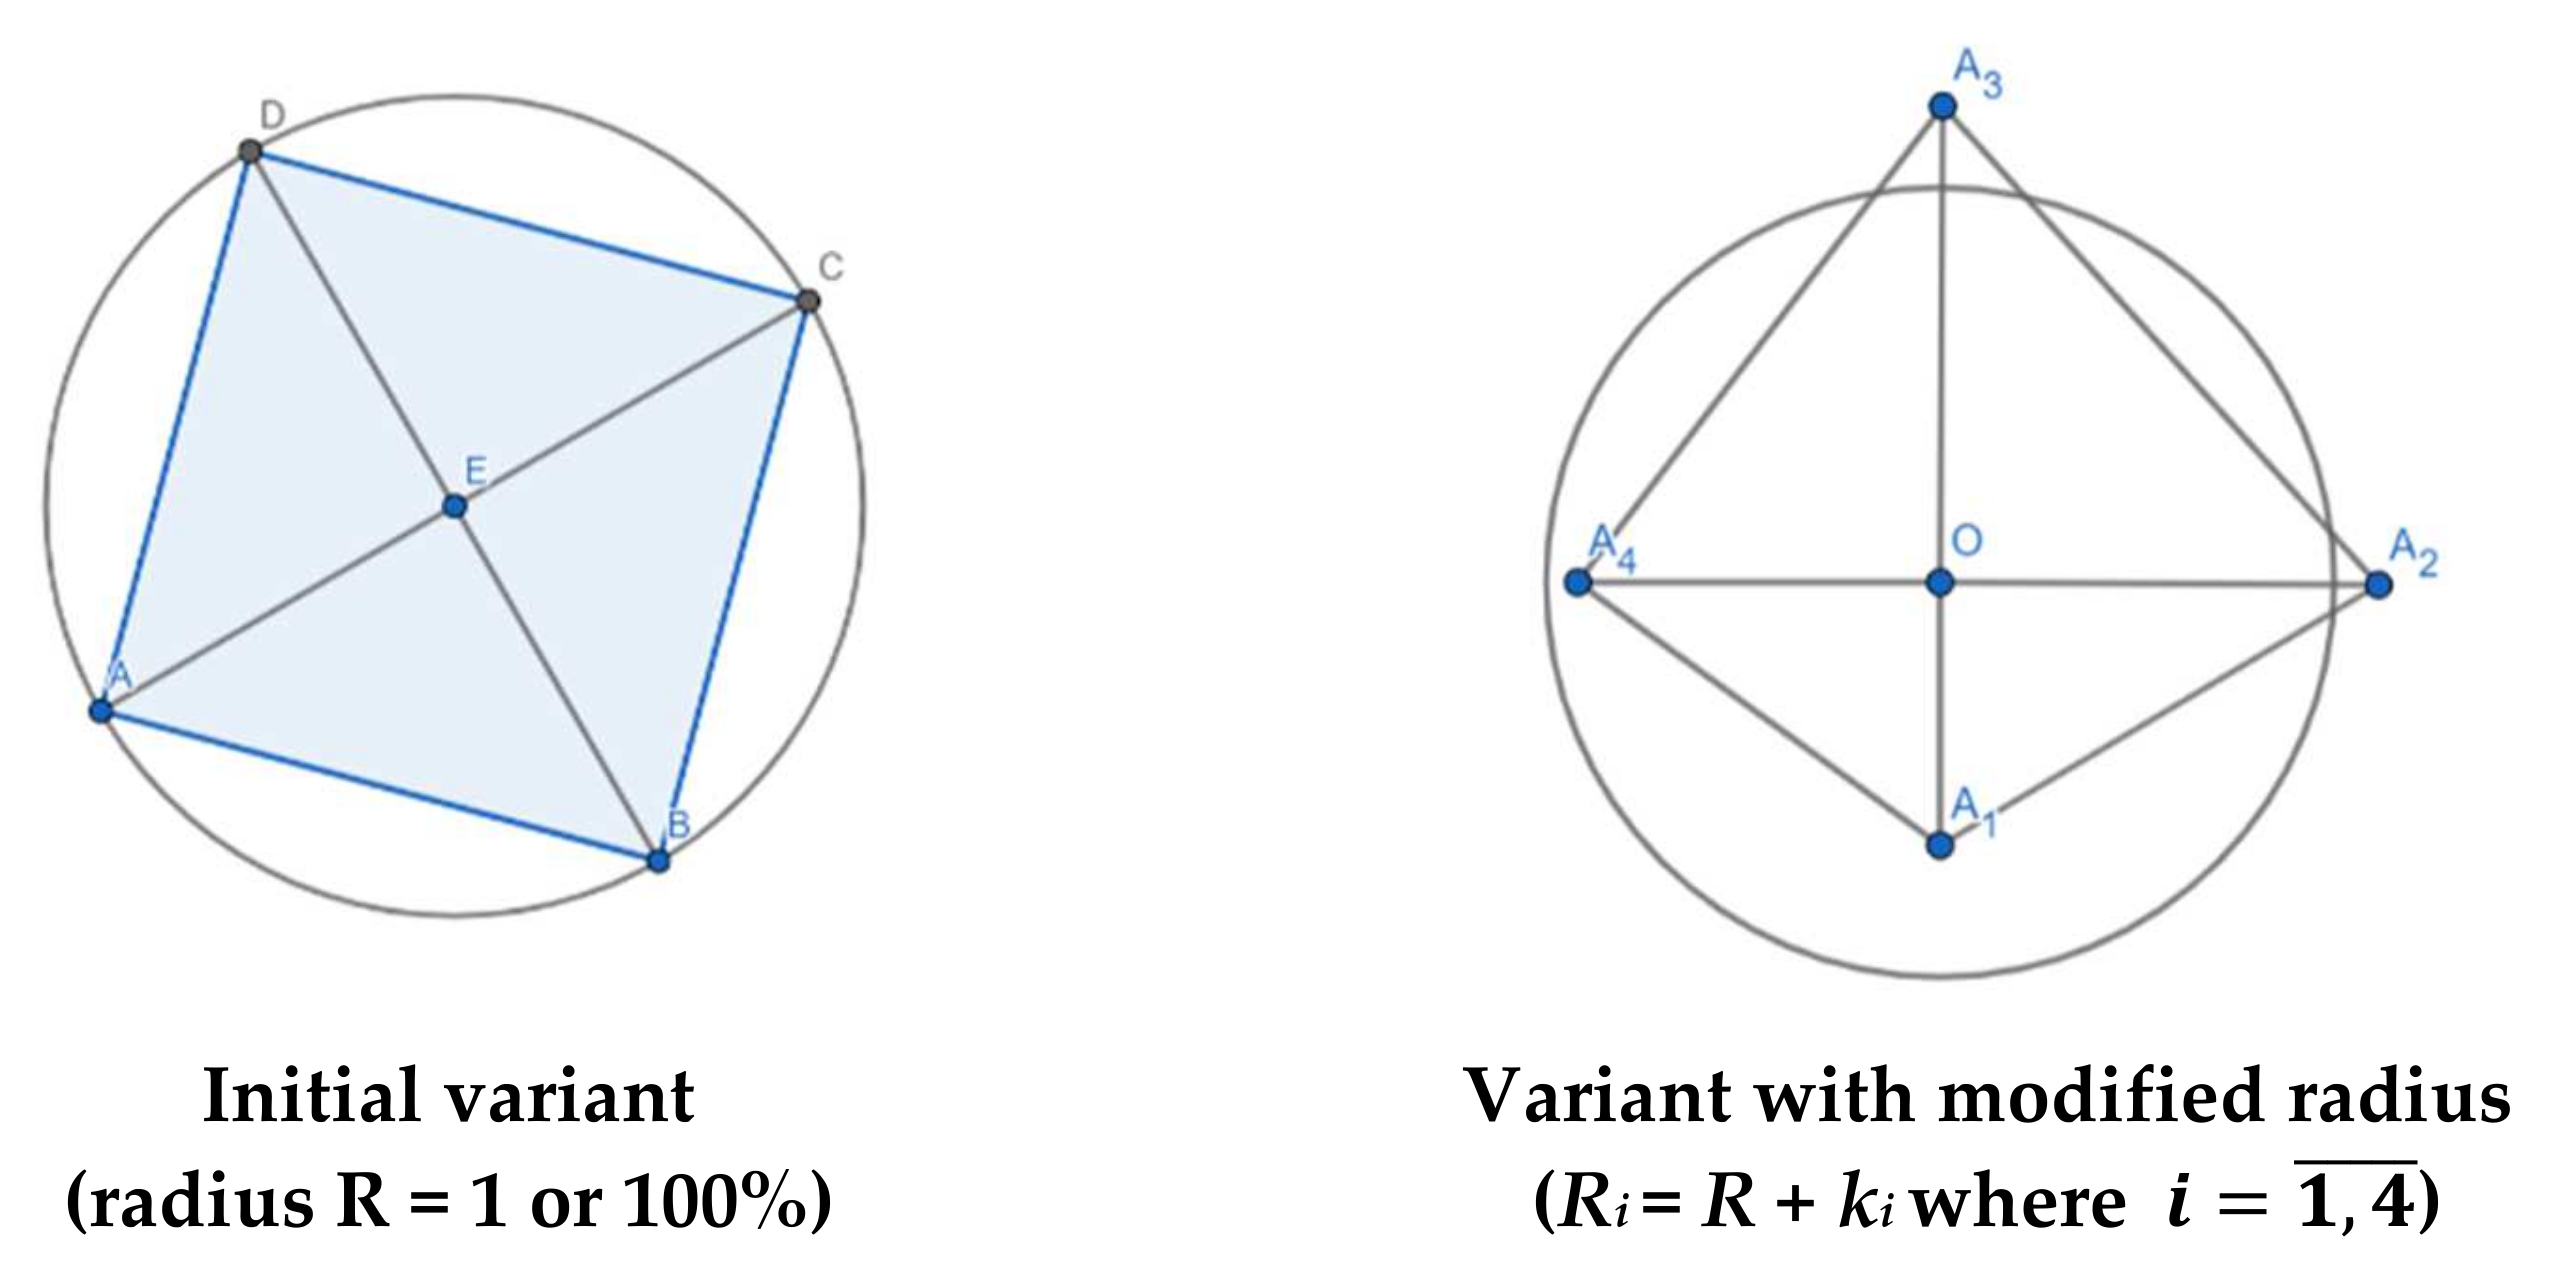
3.2. ”4-gon” GAIN or Carré Magique

Economic phenomena, especially macroeconomic, confer another application field with a great potential for GAIN. These are the target of the investigation of the results and discussions section of the article, being best described by general states of balance/imbalance, with the classical ways of presentation established by rhythms and not by IN and not being methodologically unitary. This can be found in Nicholas Kaldor’s Carré Magique [50,51,52], detailed by the rate of economic growth, inflation rate, unemployment rate, and trade balance and instrumentalized by Lionel Stoleru [53,54]; the conjunctural pentagon or economic strategy, proposed by Mihai Korka, further capitalizing on the social cohesion index as a ratio between the maximum value and the minimum wage [55] (p. 66) [56] (p. 37); as well as the perennial hexagon, which introduces a major indicator on environmental protection (ecology and human ecology) [56] (p. 162), going as far as the extended decagon or dodecagon [56] (p. 161), [57] (p. 123), etc.
(IV) The extension of the meaning of the simplified reality of IN by continuous reselection of important imbalances (COVID-19 pandemic, Russian-Ukrainian war, etc.) and increasing the coverage of the extension by expanding the reality described by factors or areas lead to periodic change of hierarchy of major factors quantified dynamically in GAIN.
(V) Maximizing the connection of surfaces with the simplified reality described by GAIN is another important methodological criterion. This criterion obliges the realization of the third geometric construction of a current polygon or post-temporal, spatial, or structural landmark. The new polygon can be both convex and concave, both regular and irregular, at the end of the evolutionary or involutionary analysis. Finally, by a methodological generalization, a polygon with “n” sides or a convex and regular “n-gon” (Pn) that had the initial area described in Equation (4) can be rewritten as:
A A 1 A 2 A n = A n = A A 1 O A n + i = 1 n 1 A A i O A i + 1 = n × A A 1 O A 2 = n × R 2 × sin 360 ° n 2  
The variant resulting from changes of equilibrium factors (IN) is highlighted by changes in the changes of the R-rays with ki, where i = 1 , n ¯ , and Ri = R + ki becomes:
A A 1 O A 2 = A 1 O × O A 2 × sin A 1 O A 2 2 = R 1 × R 2 × sin 360 ° n 2  
Conversely, in extended form:
A A 1 A 2 A n = A A 1 O A n + i = 1 n 1 A A i O A i + 1 = R 1 R n × sin 360 ° n 2 + i = 1 n 1 R i R i + 1 sin 360 ° n 2 = sin 360 ° n 2 R 1 R n + i = 1 n 1 R i R i + 1
The GAIN value is described methodologically as in the case of any IN by a ratio but also one of two special geometric surfaces, i.e., by the ratio between Equations (12) and (10).
(VI) The gradual or differentiated appreciation of subjective dynamics requires the recognition of intrinsic qualities of the purely geometric nature of GAIN, which are related to positive or negative differentiations in mathematical equations, but in essence or unequal practice are caused by evolutionary subjectivity specific to human subjectivity intervention. Therefore, a value in the mathematical model of a percentage |−1%|, determined by the presence of a negative percentage difference in radius R = 100%, does not generate an area equal to the same value resulting from a positive difference 1% but instead a whole different area by increasing the initial size of the radius (13):
I N = 99 % I N = 100 % p o l y g o n s a r e a I N = 100 % I N = 101 % p o l y g o n s a r e a
Regarding the economic, demographic, educational, social impact, etc, according to the human subjective perception, it remains a differentiated one in GAIN similar to the perception of feeling in economics, including all economies of scale or economies of scope, etc. For example, the real impact is perceived differently and generates a totally different economic sentiment between an annual macroeconomic growth of 1% and a recession of −1% although the values are mathematically identical. As a further illustration, the economic sentiment generates a level of investments, level of population’s savings, etc., so the crisis seems to be easier, and through the lens of the sometimes decisive economic sentiment, any level of economic growth seems to be and is indeed more extensive than in reality. As a somewhat special multidisciplinary approach, GAIN is adequate because of Equation (3) caused by area or geometrical surface. Moreover, GAIN can be qualified as an optimistic index number, as people generally are—if humankind is faced with everyday problems, conflicts, environmental challenges, and economic crisis and on a philosophical level, ultimately, death is not generally optimistic in a majority; it could have disappeared many years ago. A major apparent limit for GAIN is the inequality of each percentage as area or surface However, even this aspect can be used as a good image in economics (economic sentiment, risk, etc.).
Further expanding the direction of the research, a new index in volume variant (GVIN) can be developed on the basis of GAIN idea, including more dimensions (especially demographic) and thus targeting a smaller error. It means to use 26 factors ikosi(kai)hexagon with 1% as error or pentadecagon with 3% as error instead of 12 factors with 5% as error and focus on three dimensions (from economic and social in GAIN to economic, social, and demographic in GVIN).
(VII) Ensuring the methodological conditions necessary for the aggregation of primary temporal indices or globalization of regional indices require the generation of constructive factors of equilibria/imbalances reflected in GAIN and expressed exclusively as IN (avoiding any construction focused on heterogeneity of coefficients, rhythms, rates, and indices, etc.). However, GAIN also allows the construction of CINs such as consumer price index (CPI), house price index (HPI), and index of producer price in industry (IPPI), etc. Weighting systems and calculation algorithms are simplified in GAIN, where the mandatory transformations are based on the following correlation (14):
Weighting Coefficient of Transformation (WCT) = 10000:360°
(VIII) The diversification of data sources and beneficiary results is derived from the permanent selection of equilibrium factors and domains that structure the balances/imbalances reflected in GAIN, but they cannot multiply much. From a prospective point of view, the statistical optimum could be a value of “n” in the interval [4,5,6,7,8,9,10] and decisively and in the short term an “n” included in the interval [12,13,14,15,16,17,18,19,20,21,22,23,24,25,26,27] and the methodological criterion synthesized in Table 7:
(IX) The continuous limitation of processing restrictions in GAIN by statistical-mathematical optimization related simultaneously to the volume and quality of data in parallel with the quality of decisions described concretely by the level of errors is another premise of a correct methodological construction. GAIN ensures the unitary character of the data comparison starting from the initial circle (radius = 1 or 100%) but imposes further processing in which the percentage values are replaced by coefficients in any excessive mathematical product or the multidimensional aggregations of IN. In this way, evaluations with a radius = 1 are practically preferred to those with a radius = 100% after the establishment of historical multiannual databases.
(X) Continuous extension of the coverage of phenomena and processes describe subsystems of reality through aggregate indices from more and more subfactors and not by multiplying the number of factors over the level of limiting statistical error. GAIN can aggregate IN and CIN, which reflect reflected equilibria/imbalances and accentuate not so much their increase as several factors but rather the constructive components as subfactors (as in the example of the evolution from HDI to HIHD).
(XI) Permanent homogenization of more and more heterogeneous real populations is caused by generating new synthetic factorial indicators. In essence, GAIN has three constructive elements of homogenization that must be maximized methodologically: (1) the areas of inscribed polygons or “n-gons” expressed uniformly by π, starting from the initial circle that describes the complex phenomenon, economic, demographic, educational, social, etc.; (2) the coefficients or percentages of homogenized errors with the value “n” or the number of sides or angles of the polygon; and (3) homogenization by relatively equal evaluation using regular (convex) polygons of the impact of equilibria/imbalances.
(XII) Synthesis of GAIN by optimizing analytical factors and balancing imbalances induces a three-dimensional focused on time, space, and structure, which gives rise to three constructive types that can be achieved methodologically separately and can be synthetically confronted (15):
GAINt/(t−1) = GAINt:GAIN(t−1) ∨ GAINA/B = GAINA:GAINB ∨ GAINS/ΣS = GAINS: GAINΣS
In a final methodological image, GAIN aspires to the fascination of simplicity in geometry, a combination of maximum constructive simplicity of the circle as a geometric place, the symbolism of completeness, and complexity of circularity in the balanced deepening of phenomena with multiple factoriality but also three-dimensional confrontation (spatial and structural) of continuously recalculated polygonal surfaces.
The equilibria in detail from that of economic growth to those of prices, labor market, and foreign trade as major factors specific to the economy were the dimensions of its magic square and were quantified in the classical economy by the growth rate, inflation rate, unemployment rate, and trade balance as a percentage of GDP [52,53,57], but the context and constructive treatment of indicators is a nonstatistical one. In the MID context, all these can be analyzed with “4-gon” GAIN together and circularly or in both directions, respectively, both from left to right and vice versa, in boustrophedon. The tetragon of classical economics instrumentally brought together in a non-unitary or heterogeneous way the magic of essential balances, thus taking over in its name the mystery of the only Latin palindrome framed in a square, whose enigmatic meanings were considered to be, if not mystical, at least of religious origin. The multimillennial carré magique, rediscovered intact in Pompeii, contained a string not of four but of five words, with a meaning lost or untranslatable today, like any other Kabbalistic text or dedicated to double reading: SATOR, AREPO, TENET, OPERA, ROTAS [58] (pp. 51–66). Constructed as a magic square, GAIN offers an additional meaning to the four initial indicators, one coming from the surfaces faced in a unitary MID context, by appealing to CIN, with which they were expressed comparably, in a circle with a radius of 1 or 100%. An apparent geometric magic with mystical or religious origins today describes the dynamic reality of major macroeconomic balances/imbalances.
Step 1: Theoretical generalization in the case of “4-gon” GAIN (carré magique or polygon with four congruent sides, with a value of each circle angles of 90 ), given in Figure 3.
Starting from the relationship valid in an initial inscribable square (base year):
A A 1 O A 2 = A 1 O × O A 2 × sin A 1 O A 2 2 = R 2 × sin 90 ° 2 = R 2 2
One reaches:
A A 1 A 2 A 3 A 4 = A 4 = A A 1 O A 4 + i = 1 3 A A i O A i + 1 = 4 × A A 1 O A 2 = 2 R 2
For radius = 1 or 100%, the standard result becomes A4 = 2.
In the tetragon variant with changes in radii with ki, where i = 1 , 4 ¯ and Ri = R + ki:
A A 1 O A 2 = A 1 O × O A 2 × sin A 1 O A 2 2 = R 1 × R 2 × sin 90 ° 2 = R 1 × R 2 2  
Finally:
A A 1 A 2 A 3 A 4 = A A 1 O A 4 + i = 1 3 A A i O A i + 1 = R 1 R 4 2 + i = 1 3 R i R i + 1 2 = 1 2 R 1 R 4 + i = 1 3 R i R i + 1
In the case of the macroeconomic system, the balances/imbalances specific to the United Kingdom (UK)’s economy were chosen classically and expressed by CIN. The four chosen CIN, generating the distinct tetragon or carré magique for the base period, are gross domestic product index (real terms GDPI), 1/GDP deflator index (1/GDPDI), employment index (EI), and coverage dynamics of imports by exports index (CGIEI), key data for 2020 and 2021, values as stated by International Monetary Fund, World Economic Outlook Database, April 2022.
Step 2: Data sources and IN processing to ensure statistical comparability.
Step 3: An estimate of the GAIN value “4-gon” with a known error level.
4 g o n   G A I N = R 1 R 4 2 + i = 1 3 R i R i + 1 2 : 2 = 1 4 R 1 R 4 + i = 1 3 R i R i + 1
4-gonGAIN = (0.988448 + 1.071284 + 0.992115 + 0.9154): 4 = 0.99181 or 99.18%.
Step 4: Final interpretations, observations, or comments.
The preference for the value of the macroeconomic purchasing power index derived from the inverse value of the GDP deflator index (GDDPI) is justified by the same arguments described in “3-gonGAIN, the real recovery being significant and not the apparent one.
According to the logic of the regular tetragon or the “carré magique” construction, the 99.18% value of the “4-gon” GAIN reflects much more correctly through the equivalent multidimensionality the real downward evolution and not only the apparently ascendant of the UK economy. In the analyzed context, both the selected macroequilibria and MID are considered equally important, but if there are arguments and calculations regarding unequal impact, then unequal arcs can be capitalized that reflect by aggregation of the macroeconomic structure starting from the equivalent between 100% and 360°.

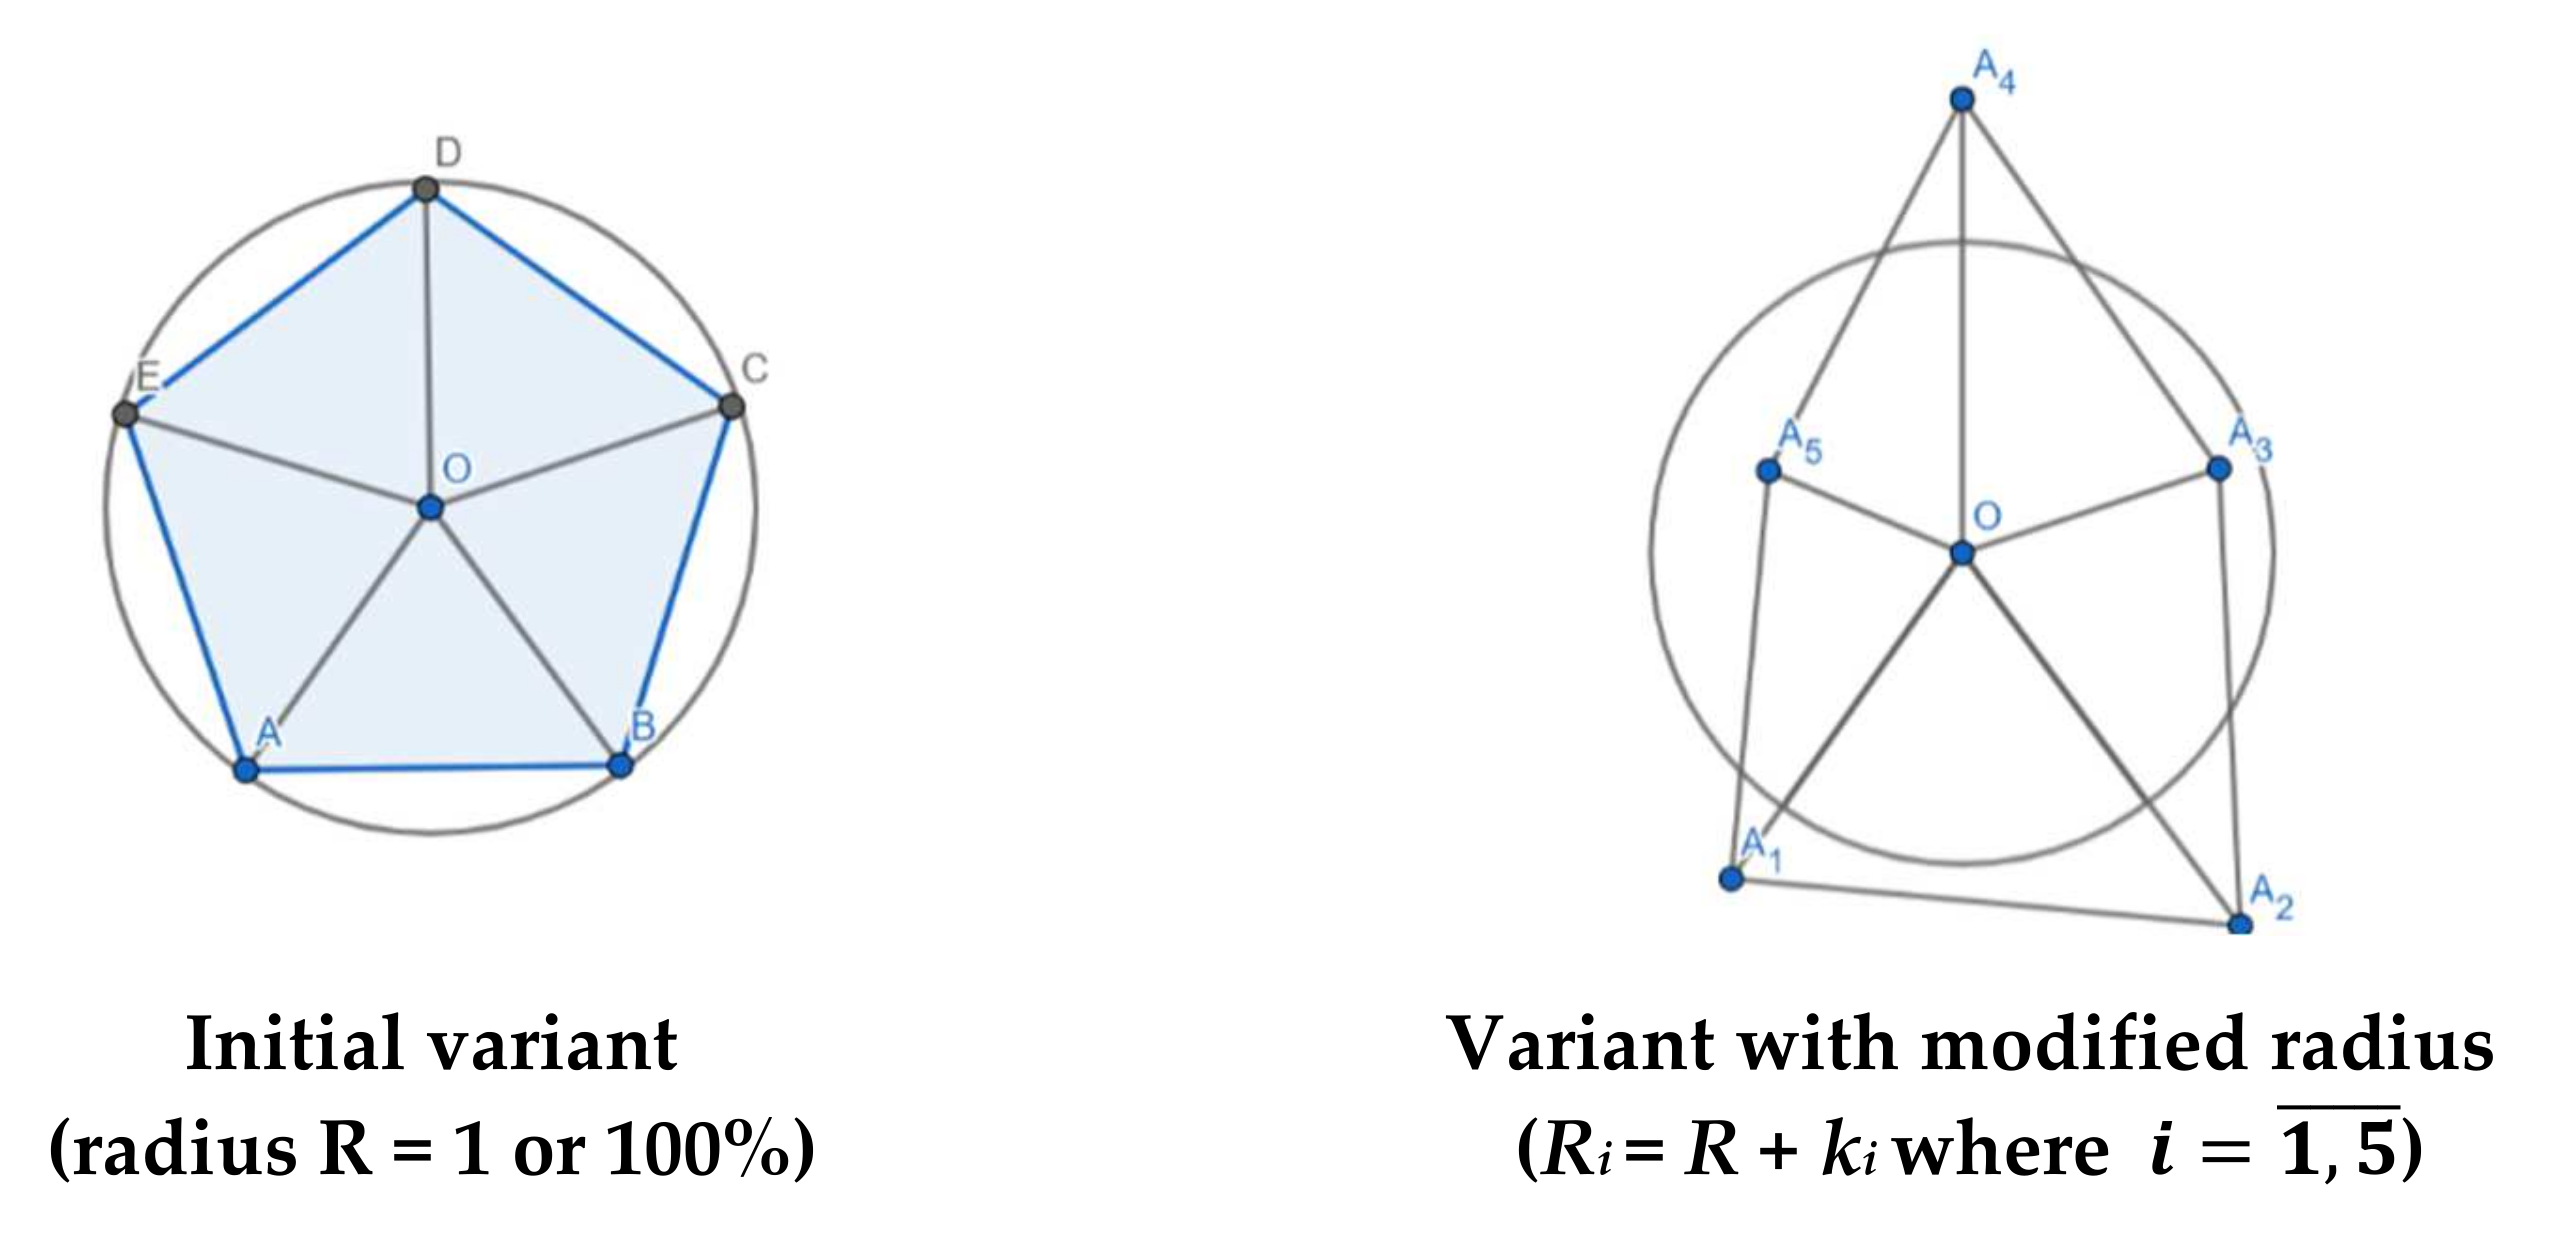
3.3. ”5-gon” GAIN or “Strategical and Conjunctural Pentagon”

Strategical and conjunctural pentagon additionally introduces another important balance expression of social cohesion as a ratio between minimum and maximum income (hourly earnings, etc.) or in the example below minimum hourly earnings (legal limitation) and median, in the absence of maximum values. The upward evolution of IN balances the economies describing a dynamic favorable to social cohesion and the downward one as an unbalanced (unfavorable) one.
Step 1: Theoretical generalization in the case of “5-gon” GAIN (“strategical and conjunctural pentagon”), with “5-gon” GAIN being the polygon with five congruent sides, with each circle angle having a value of 72 ° , as represented in the Figure 4.
Starting from the valid relationship in an initially inscribable pentagon (base year):
A A 1 O A 2 = A 1 O × O A 2 × sin A 1 O A 2 2 = R 2 × sin 72 ° 2 = R 2 × 10 + 5 4 2 = R 2 × 10 + 5 8
One reaches:
A A 1 A 2 A 3 A 4 A 5 = A 5 = A A 1 O A 5 + i = 1 4 A A i O A i + 1 = 5 × A A 1 O A 2 = 5 R 2 × 10 + 5   8
For radius = 1 or 100%, the standard result becomes A5 = 2.186255716.
In the pentagon variant with changes in radii with ki, where i = 1 , 5 ¯ , and Ri = R + ki:
A A 1 O A 2 = A 1 O × O A 2 × sin A 1 O A 2 2 = R 1 R 2 × sin 72 ° 2 = R 1 R 2 × 10 + 5 4 2 = R 1 R 2 × 10 + 5 8
Finally:
A A 1 A 2 A 3 A 4 A 5 = A A 1 O A 5 + i = 1 4 A A i O A i + 1 = 10 + 5 8 R 1 R 5 + i = 1 4 R i R i + 1
Step 2: Data sources and IN processing to ensure statistical comparability.
Step 3: An estimate of the “5-gon” GAIN value with a known error level.
5 g o n   G A I N = 10 + 5 8 R 1 R 5 + i = 1 4 R i R i + 1 : 2.186255716
Conversely,
5 g o n   G A I N = R 1 R 5 + i = 1 4 R i R i + 1 : 5
5-gon” GAIN = [0.437251143 × (1.045176 + 1.071284 + 0.992115 + 0.9154 + 0.894976)]: (2.186255716) = 0.98379 or 98.38%
Step 4: Final interpretations, observations, or comments.
The downward impact of the social cohesion indicator, defined as the minimum vs. median hourly earnings index, negatively influences MID due to the accentuation of hourly wage imbalances. The imbalance described by the “5-gonGAIN value of 98.38% compared to the previous 99.18% value of the “4-gonGAIN describes a smaller area according to the information that describes an inadequate strategy or an unfavorable situation.

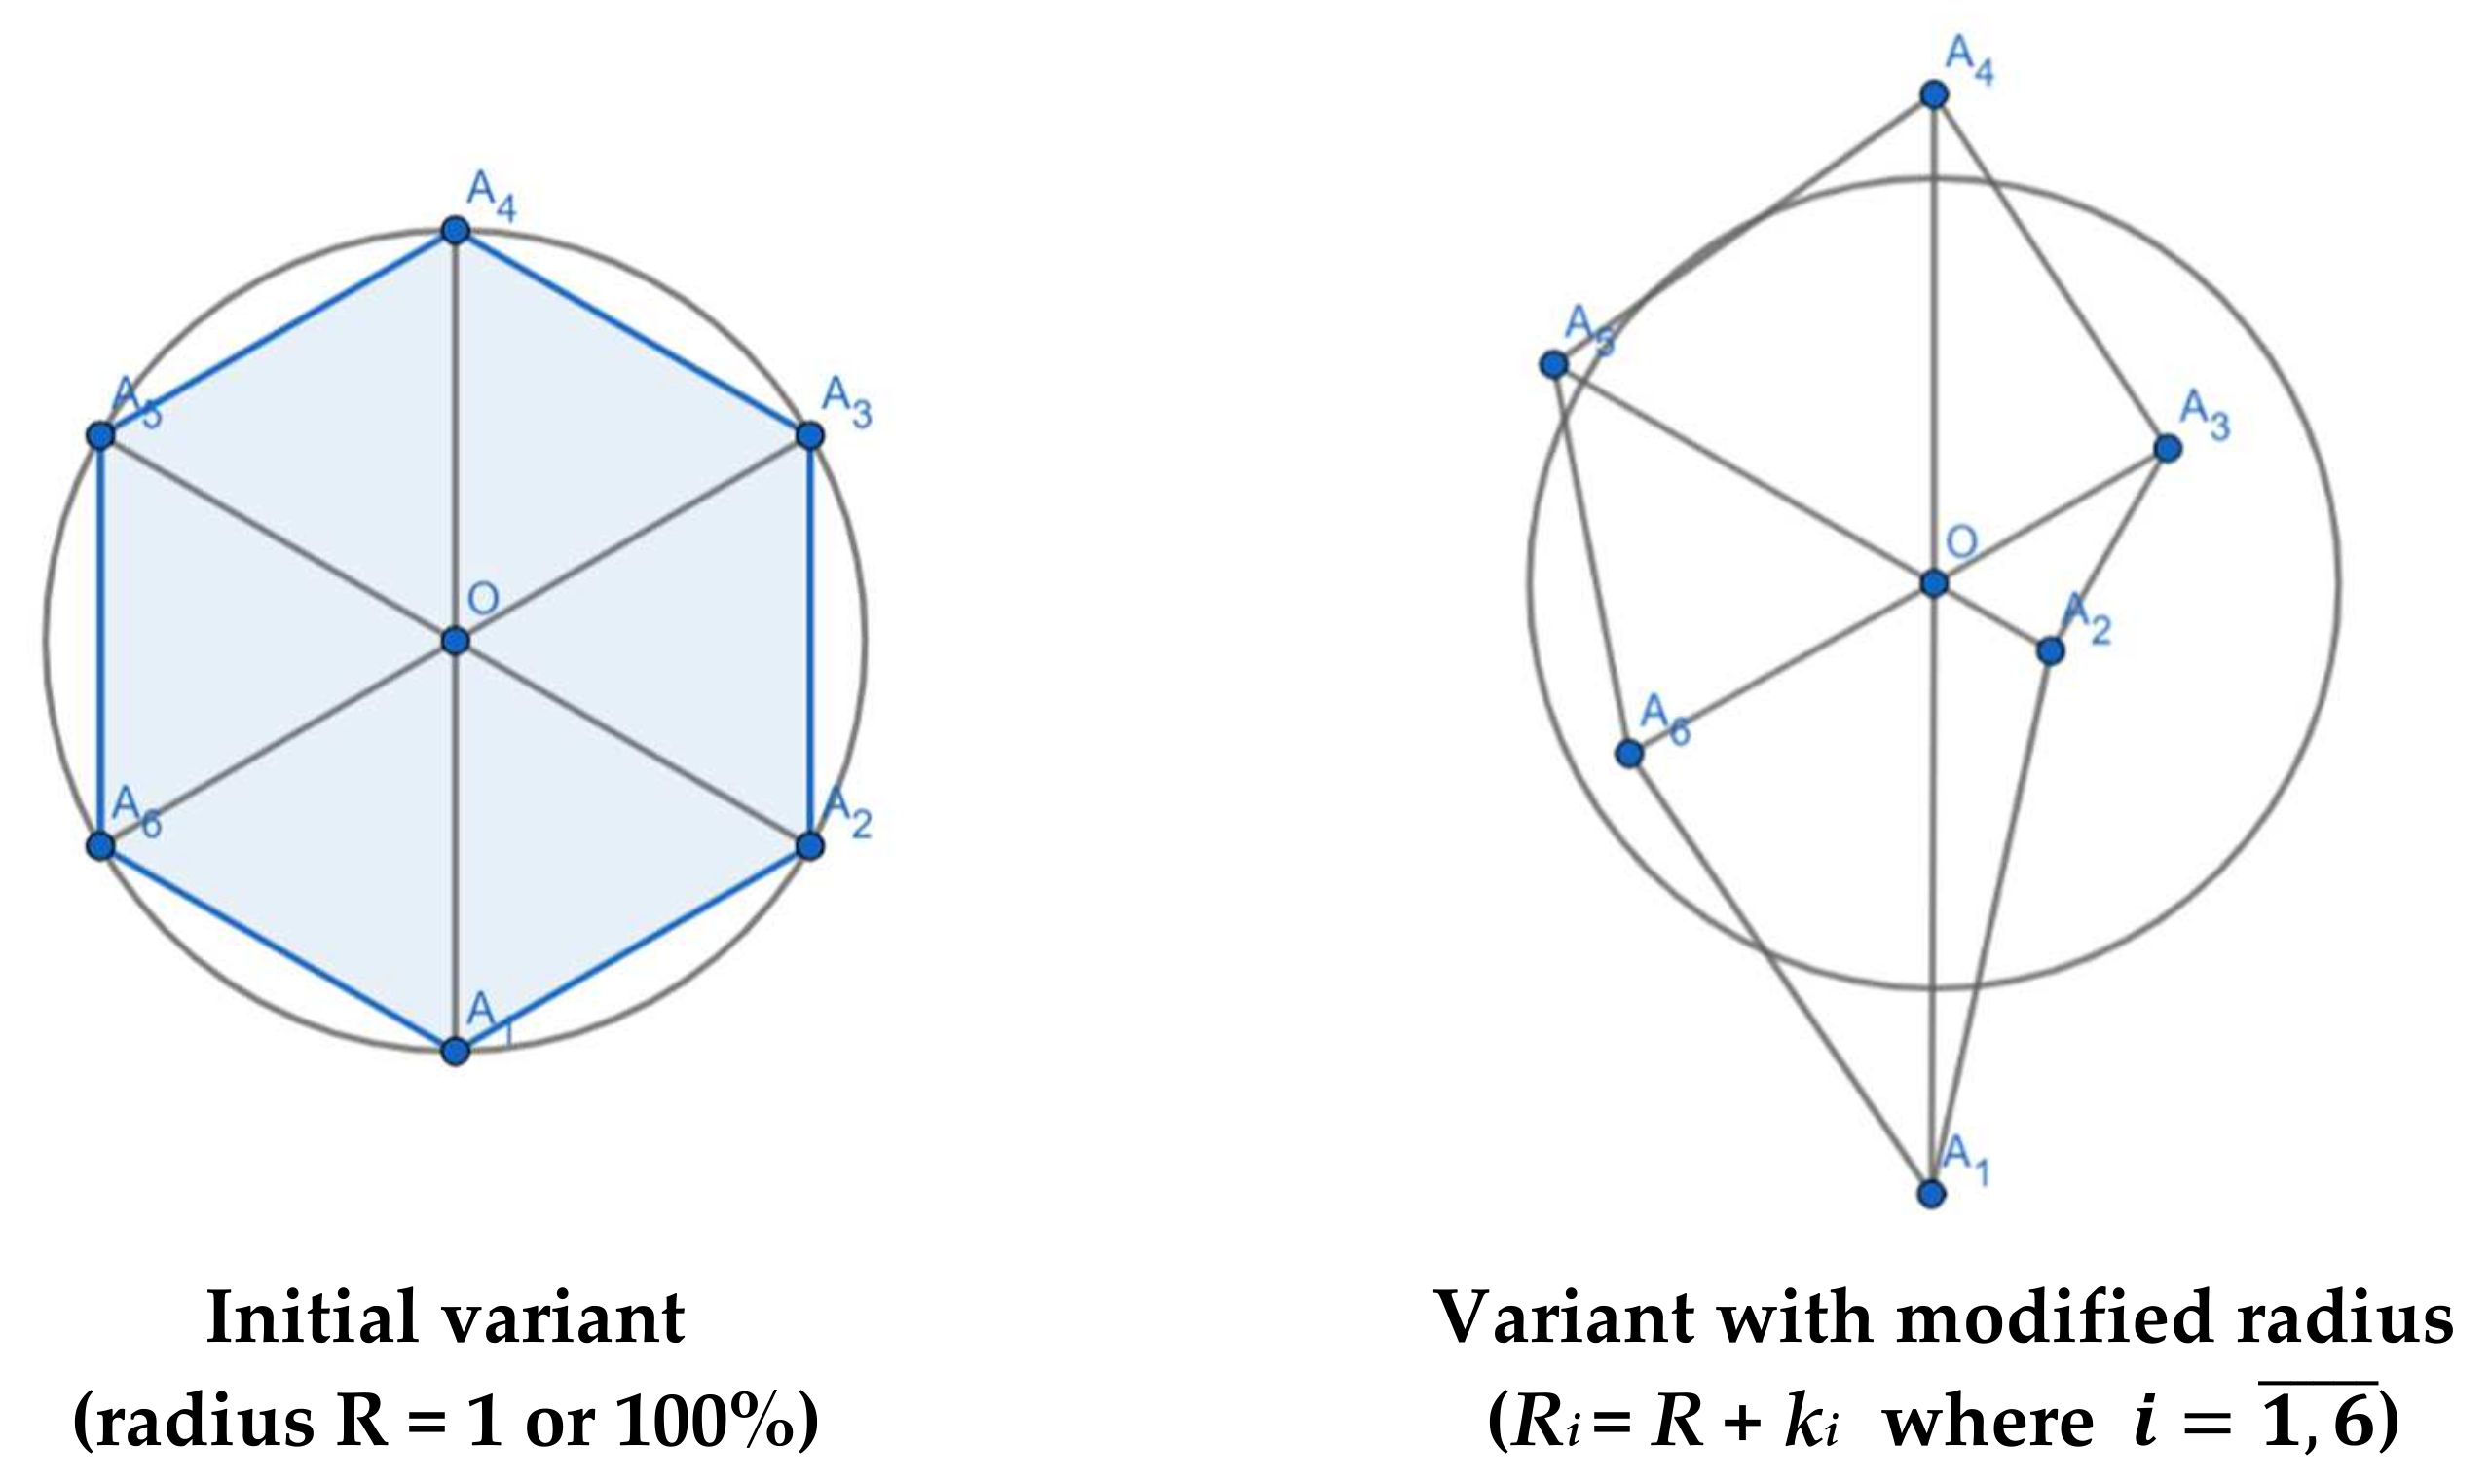
3.4. ”6-gon” GAIN or “Perrenial Hexagon”

Perennial hexagon introduces in the analysis a sixth important imbalance/equilibrium that is the expression of sustainable development in real terms, known as the public expenditure for environment protection index (real terms PEEPI)
Step 1: Theoretical generalization in the case of “6-gon” GAIN (“perennial pentagon”), with “6-gon” GAIN being a polygon with six congruent sides, with its circle angles having a value of 60 ° , as represented in Figure 5.
Starting from the valid relation in an initial writable hexagon (base year):
A A 1 O A 2 = A 1 O × O A 2 × sin A 1 O A 2 2 = R 2 × sin 60 ° 2 = R 2 × 3 2 2 = R 2 × 3 4
One   reaches :   A A 1 A 2 A 3 A 4 A 5 A 6 = A 6 = A A 1 O A 6 + i = 1 5 A A i O A i + 1 = 6 × A A 1 O A 2 = 3 R 2 3 2
For radius = 1 or 100%, the standard result becomes A6 = 2.598076211.
In the hexagon variant with radius changes with ki, where i = 1 , 6 ¯ , and Ri = R + ki
A A 1 O A 2 = A 1 O × O A 2 × sin A 1 O A 2 2 = R 1 R 2 × sin 60 ° 2 = R 1 R 2 × 3 2 2 = R 1 R 2 × 3 4
Finally:
A A 1 A 2 A 3 A 4 A 5 A 6 = A A 1 O A 6 + i = 1 5 A A i O A i + 1 = 3 4 R 1 R 6 + i = 1 5 R i R i + 1
Step 2: Data sources and IN processing to ensure statistical comparability.
Step 3: An estimate of the GAIN value “6-gon” with a known error level.
6 g o n   G A I N = 3 4 R 1 R 6 + i = 1 5 R i R i + 1 : 2.598076211
Conversely,
6 g o n   G A I N = R 1 R 6 + i = 1 5 R i R i + 1 : 6
6-gonGAIN = [0.433013 × (1.117376+1.071284+0.992115+0.9154+0.894976+1.011712)]: (2.598076211) = 1.00048 or 100.05%
Step 4: Final interpretations, observations, or comments.
The upward contribution of the real terms PEEPI indicator, defining the sustainable development of an economy, positively influences MID, simultaneously emphasizing the importance of effective government spending with the protection of the environment. The new value of “6-gonGAIN of 100.05% supports the specific CIN of economic growth and describes a very slightly expanded area compared to the previous year, according to the processed information.

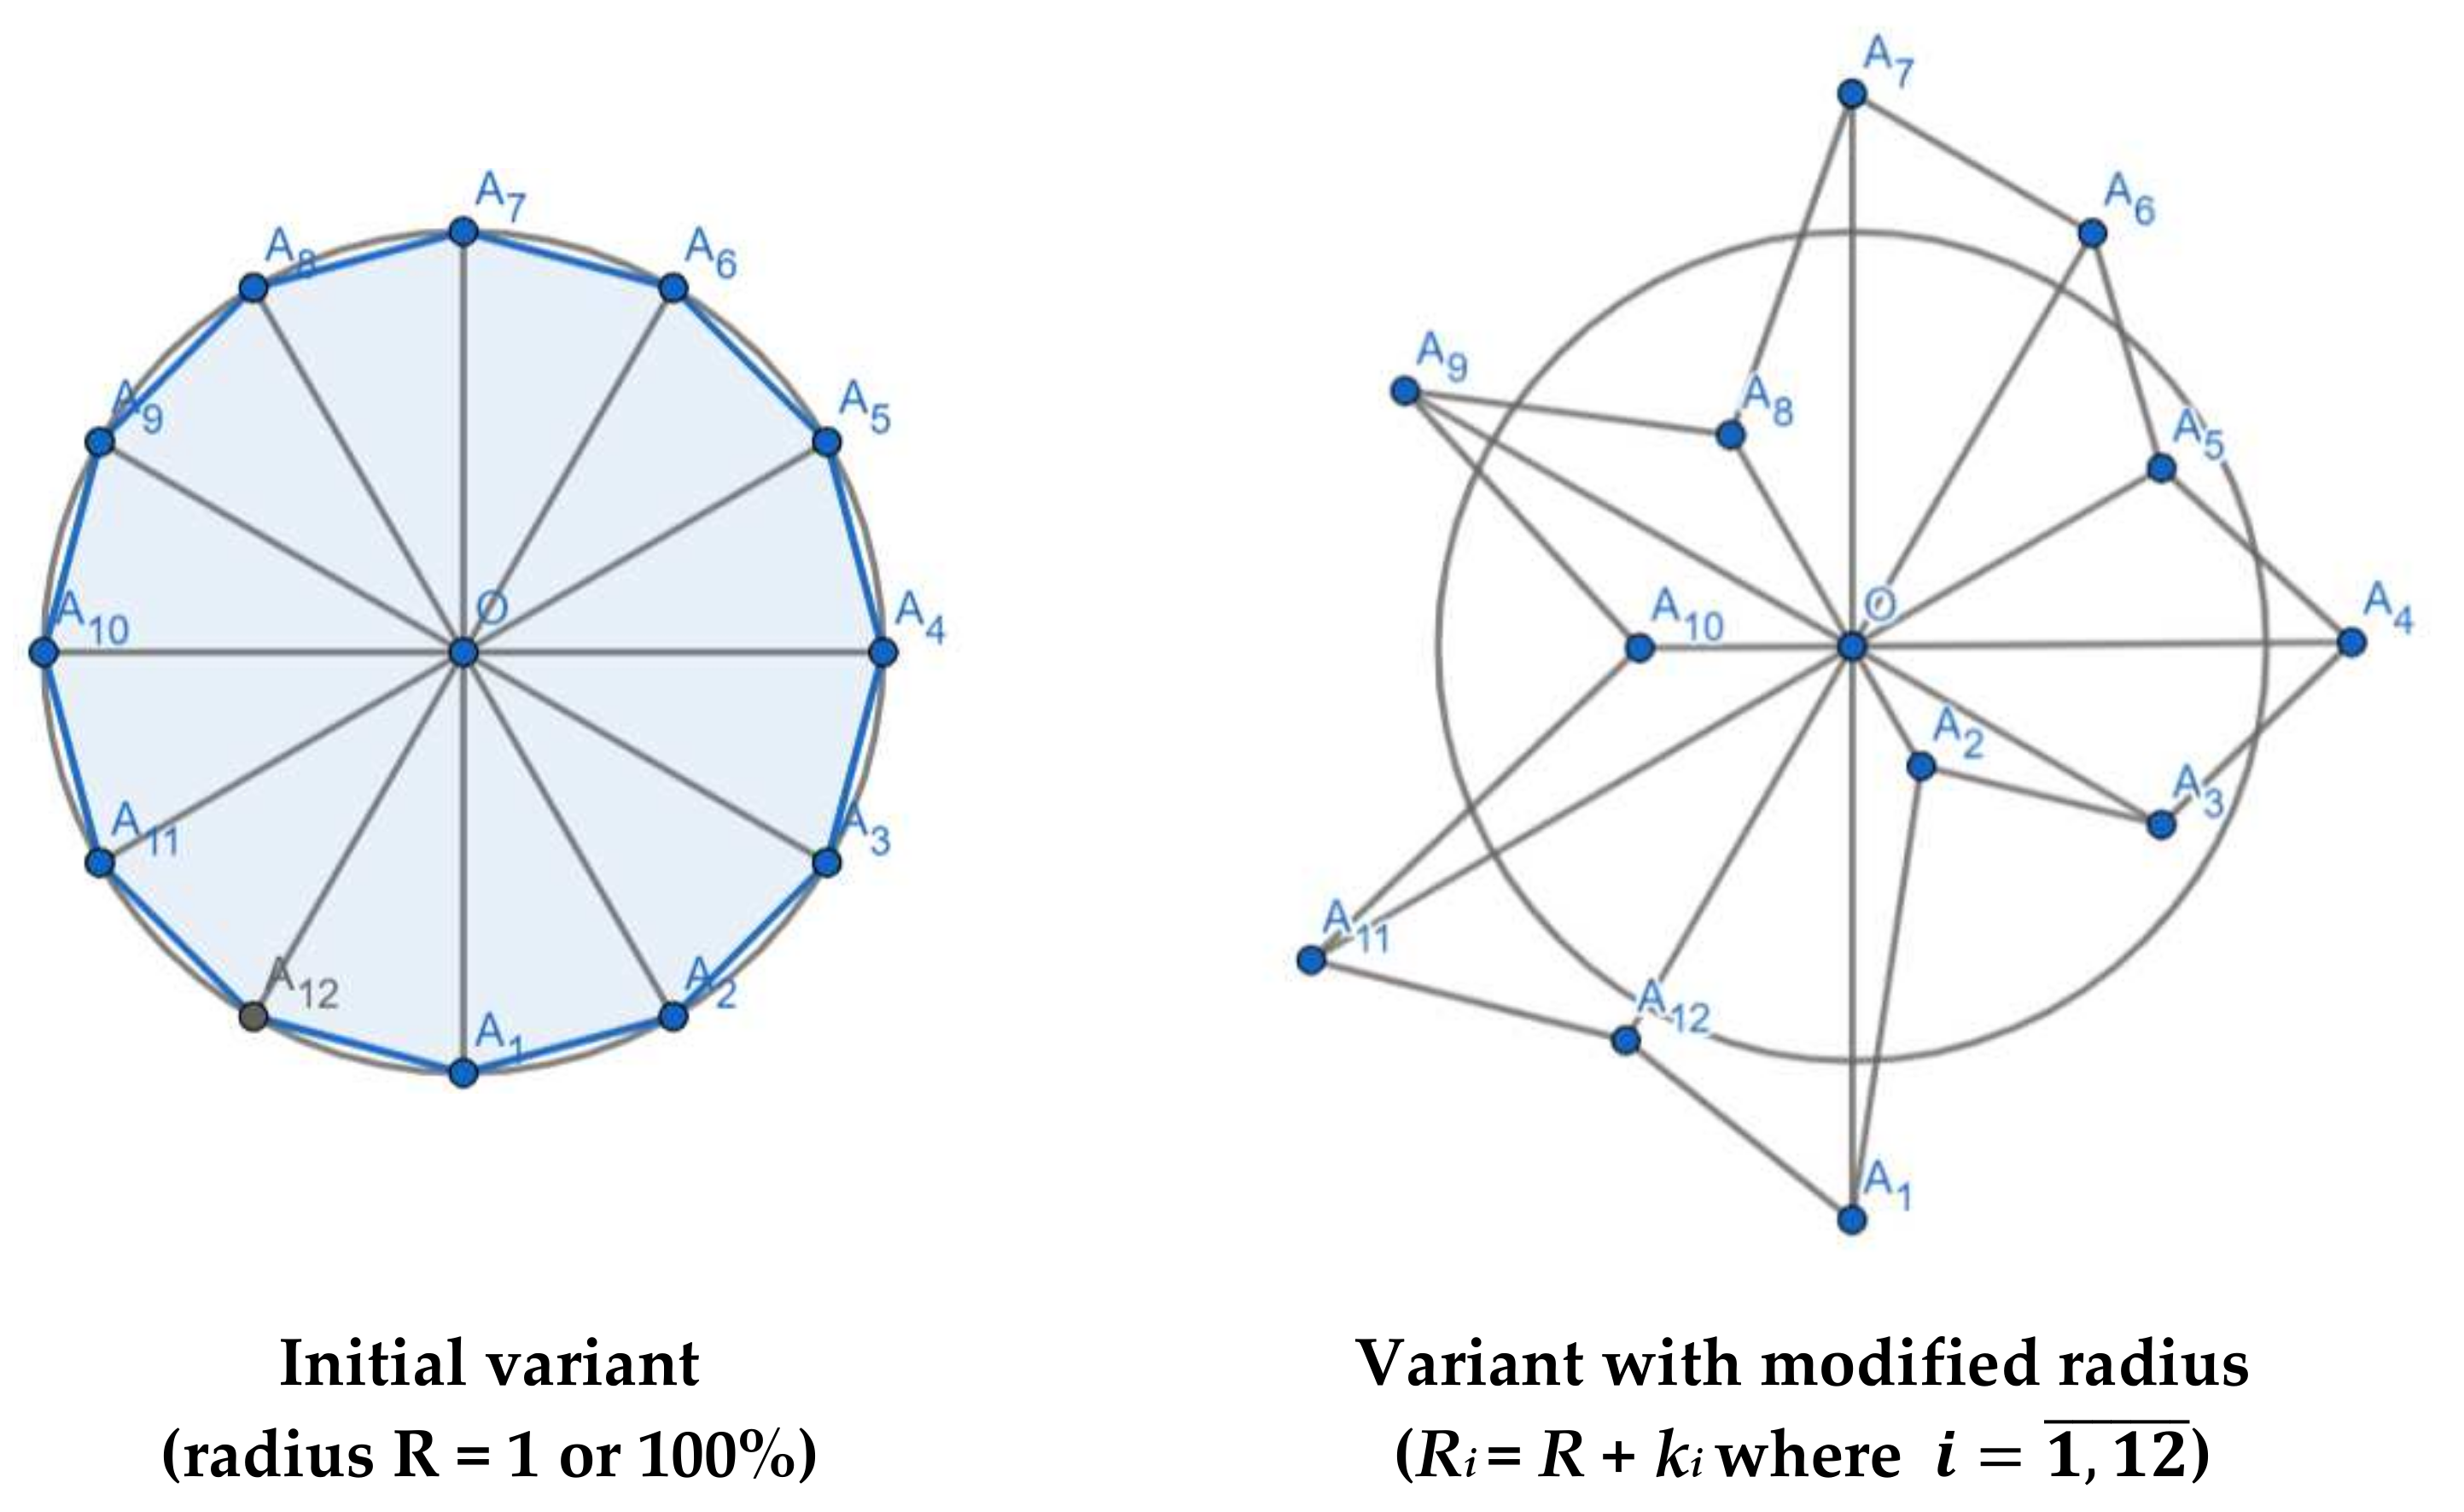
3.5. “12-gon” GAIN or “First Acceptable IN as Dodecagon in Terms of Decision Risk”

Step 1: Theoretical generalization in the case of “12-gon” GAIN (“acceptable dodecagon in terms of decision risk”), with “12-gon” GAIN being the polygon with 12 congruent sides, with its circle angles having a value of 30 ° , as represented in Figure 6.
Starting from the valid relationship in an initial writable dodecagon (base year):
A A 1 O A 2 = A 1 O × O A 2 × sin A 1 O A 2 2 = R 2 × sin 30 2 = R 2 × 1 2 2 = R 2 4  
A A 1 A 2 A 3 A 4 A 5 A 6 A 7 A 8 A 9 A 10 A 11 A 12 = A 12 = A A 1 O A 12 + i = 1 11 A A i O A i + 1 = 12 × A A 1 O A 2 = 3 R 2
For radius = 1 or 100%, the standard result becomes A12 = 3.
In the dodecagon variant with radius changes with ki, where i = 1 , 12 ¯ , and Ri = R + ki.
A A 1 O A 2 = A 1 O × O A 2 × sin A 1 O A 2 2 = R 1 R 2 × sin 30 ° 2 = R 1 R 2 × 1 2 2 = R 1 R 2 4
Finally:
A A 1 A 2 A 3 A 4 A 5 A 6 A 7 A 8 A 9 A 10 A 11 A 12 = A A 1 O A 12 + i = 1 11 A A i O A i + 1 = R 1 R 12 4 + i = 1 11 R i R i + 1 4 = 1 4 R 1 R 12 + i = 1 11 R i R i + 1
Step 2: Data sources and IN processing to ensure statistical comparability.
Step 3: An estimate of the GAIN value “12-gon” with a known error level.
12 g o n   G A I N = 1 4 R 1 R 12 + i = 1 11 R i R i + 1 : 3
Conversely,
12 g o n   G A I N = R 1 R 12 + i = 1 11 R i R i + 1 : 12
12-gonGAIN = [0.25 × (1.072036 + 1.071284 + 0.992115 + 0.9154 + 0.894976 + 1.011712 + 1.064752 + 1.046324 +1.099774 + 1.083525 + 0.933698 + 0.925260)]: (3) = 1.0092 or 100.92%
Step 4: Final interpretations, observations or comments.
The dodecagon provides for the first time in the GAIN “n-gon” family a maximum admissible level of statistical decision error (below 5%), and its final value supports the upward evolution of the extended harmonization and relatively significant balancing (0.92%) of the UK economy in 2021 compared to 2020. The extension of IN values in the dodecagon covers a larger MID area, from investments to savings or debt and from productivity to economic freedom or country risk [59]. The previous calculation procedures reveal the simplicity of the practical determinations of GAIN type IN through evaluated imbalances described by a general synthetic relationship:
n g o n   G A I N = R 1 R n + i = 1 n 1 R i R i + 1 : n
Identifying unequal influences of some imbalances requires the use of differentiated weights in the analysis of the complex phenomenon and leads to the calculation procedure that capitalizes weighting coefficients, defined as different angles of the polygon. The final area is transformed from a simple sum of entirely different areas of the triangles that make up an “n-gon”:
A A 1 O A n + i = 1 n 1 A A i O A i + 1
in an aggregation that implies sin as a weighting coefficient in each case “n” in part.

4. Discussion

Based on the given examples, we notice the constructive simplicity of GAIN, which provides with the help of very simple geometric and statistical calculation solutions a rigorous scientific measurement of complex phenomena such as those described by MID. GAIN approach can be applied in the current research fields such as digital transformation, which includes eight dimensions [60], or digital-twin-based mathematical modeling. which is multidimensional problem [61]. In the analysis of these complex phenomena, GAIN gives precedence to simplicity, preferring the simplest IN, the geometric type focused on surfaces in a creative approach. The logic of the whole research becomes similar to simplicity in Ockham’s razor principle or to the law of parsimony underlying the importance of necessity: “pluralitas non est ponenda sine necessitate” [62].
Detailed methodological conditionings replace any IN composite, as an original GAIN creation, capable of registering inequalities and imbalances through inscribable, initially regular convex polygons that become more or less concave or stellate. At the end of this first GAIN article, the authors abandon the equivalent or impartial treatment of equal angle generators in the convex polygon, which has become implicit and regular, anticipating future research focused on the idea of optimization by a simplified calculation coefficients algorithm for weighting system described in the mathematical relationships in this article. The limitations of this research remain strictly related to the initial stage of creativity naturally lacking pragmatic or methodological constructive approaches focused on unequal weighting coefficients, replaced by entirely different arcs, which clearly extend the applicability of GAIN.
Another investigation meant to clarify other limitations and to amplify the applicability of GAIN is the necessary geometric leap from polygon to polyhedron insofar as the future will consecrate it or not and a specific multidimensional instrumental utility. It all started and will probably continue from the same “lucid amazement at a science [geometry] that tells the truth” [40]. The authors aim to continue this geometric journey in space through research and works regarding the short- and medium-term future. Even if it was apparently initiated only in plan, the authors are confident that GAIN can become a three-dimensional solution while retaining its inter-, trans-, and multidisciplinary character.
Future research can pave the way for this original GAIN created from the combined or simultaneous interest in geometry, statistics, economics, and philosophy.
Like the structuring of a classical Greek trine, this article contains three balanced parts in strict accordance with an angular equilaterality of the sections of this first creative construction of a GAIN type IN. The structure reveals segments and sides that are, if not perfectly equivalent, at least relatively equal: (1) a literature review of the statistical method of indices or a short history of IN; (2) a constructively detailed GAIN creative methodology; and (3) a minimal practical investigation of GAIN through initially restricted and prospective indicator systems, such as trine, tetragon, pentagon, and hexagon, to finally reach through the dodecagon a level of decisively acceptable statistical error (below the threshold of 0.05 or the standard limit of 5%).
GAIN validates the opportunity of classical investigation focused on IN in an original sense and with a creative meaning proposed to geometry in an inter-, trans-, and multidisciplinary manner (through research mainly statistical and mathematical but at the same time logical and philosophical). Visualizations by GAIN provide a guideline for practical scientific disciplines regarding the optimization of research error/used resources ratio. While developing the index, researchers should consider that not all components are equally available to gather information. Adding the index components requiring much time and intellectual or financial resources can diminish error, but by analyzing the “n-gons”, researchers can estimate how important that error reduction is because it will not be in a linear relationship with the different n values of the observed “n-gons”.

5. Conclusions

The scientific novelty of this research is another angle that can be explored—the relationship between geometry, statistics, and economics, especially macroeconomics. There are many truths to be gained by writing a team paper on this multidisciplinary subject. During the course of the investigation of the paper, the main aim of the authors was to reveal the idea of GAIN as a reunion of some simple and original truths.
GAIN originality is not limited to just a few constructive options of this new concept related to the history of IN. GAIN remains focused on a creative statistical model of the geometric index of surfaces but also ensures a temporal, territorial, and structural three-dimensionalization that is, according to the functions methodology, the foundation of an article, and one must pay careful attention to choosing the right methods and instruments. Addressing the research gap in the creative development of statistical indices using the novel mathematical application, defining the research problems, and analyzing why, the authors chose a particular issue to research on means, comparing various methods with their pros and cons, formulating logical premise and choosing the adequate hypothesis, and selecting the precise data source and collection to analyze and discuss the results.
GAIN creatively ensures an ascending and significant degree of coverage of simultaneous evolutions balanced/unbalanced by the number of factors and variables in parallel, with a limiting statistical error descending evolutionary. It can be used as a theoretical approach regarding the assessment of achieving sustainable development goals in all demographic, environmental, social, and governance (DESG) aspects. The constructive option initiated methodologically from a simple circle as a geometric place, with a radius of 1 or 100%, offers a multitude of innovative methodological solutions for certain inscribable, convex, and regular polygons in the first stage. At the same time, all these multimillennial “n-gons” become more or less stellar in time, space, or structure as soon as they capture the dynamics of complex realities, including economic, demographic, educational, social, etc.
The methodological italics and the applicability of GAIN in the article imposed a natural polygonal approach ascending, but also synthetic, from a geometric and statistical point of view. The practical approach ranges from the equilateral triangle to the magic square, followed by the conjunctural pentagon, the perennial hexagon, and the decisional limiting dodecagon, to finally reach the threshold of the maximum admissible error from a statistical point of view (below 0.05 or 5%). GAIN thus followed both practically and historically a coherent, constructive course and a multidimensional confrontation, starting from various databases of international statistics of the UK economy, which was chosen for its exceptional tradition in the field of scientific statistics.
Derived from here, the original construction and methodology of GAIN opted for the regularly inscribed convex polygon not as an archaic form of a Greek multimillennial geometric ideal but as an evolutionary stage of progressive development towards the simplicity of the circle as the limit of all “n-gons” in relation to the number of unbalancing factors. The choice of an inscribable polygon, from all possible regular convex polygons, is a multidisciplinary problem, which practically involves: (1) the careful analysis of the “n-gons” typology excessively detailed in classical or Euclidean geometry; (2) selection of the acceptable statistical error level; and (3) the ensuring of a degree of comparability with the help of radius = 1 or 100%, which sends the quantification of areas directly into the universe of transcendental values.

Author Contributions

Conteptualization, G.S.; Methodology, G.S.; Writing and correcting the paper, G.S., S.M. and M.Č.; Statistics, G.S. and E.G.; mathematics, philosophy and macroeconomic analysis and final paper’s structure, G.S., S.M. and M.Č.; special graphics, geometry and trigonometry, S.M.; data analysis, data curation for macroeconomic indicators, E.G. All authors have read and agreed to the published version of the manuscript.

Funding

This research received no external funding.

Institutional Review Board Statement

Not applicable.

Informed Consent Statement

Not applicable.

Data Availability Statement

Data used in this study is currently available from the first-party sources indicated in the text.

Conflicts of Interest

The authors declare no conflict of interest.

Abbreviations

CINComposite index number
CPIConsumer price index
DESGDemographic, Economic, Social, Governance
ESGEconomic, Social, Governance
GAINGeometric area index number
HPIHouse price index
INIndex number
INMIndex numbers’ method
IPPIIndex of producer price in industry
MIDMacroeconomic imbalances dynamics.
N-GONSRegular polygons

References

  1. Dumitriu, A. History of Logic; Wells, K., Ed.; Abacus Press: London, UK, 1977. [Google Scholar]
  2. Barbilian, D. Receptări şi Repere în Filosofia Ştiinţei. In Opere. II Proză; Barbu, I., Ed.; Univers enciclopedic: Bucharest, Romania, 2000; pp. 315–316. [Google Scholar]
  3. Katz, V.J. A History of Mathematics: An Introduction, 3rd ed.; Addison-Wesley: Boston, MA, USA, 2009; p. 41. Available online: https://edisciplinas.usp.br/pluginfile.php/6075667/mod_resource/content/1/Victor%20J.%20Katz%20-%20A%20History%20of%20Mathematics-Pearson%20%282008%29.pdf (accessed on 14 March 2022).
  4. Clark, G.N.; Fleetwood, W. The Occasion of Fleetwood’s “Chronicon Preciosum”. Engl. Hist. Rev. 1936, 51, 686–690. Available online: http://www.jstor.org/stable/554442 (accessed on 24 March 2022). [CrossRef]
  5. Fleetwood, W. Chronicon Preciosum, or, an Account of English Gold and Silver Money; the Price of Corn and Other Commodities; and of the Stipends, Salaries, Wages, Jointures, Portions, Day Labour, &c. in England, for Six Hundred Years, Shewing from the Decrease of the Value of Money, and from the Increase of the Value of Corn and Other Commodities &c, that a Fellow, Who Has an Estate in Land of Inheritance or a Perpetual Pension of Five Pounds per Annum, may Conscientiously Keep his Fellowship, and Ought not to be Compelled the Leave the Same, though the Statutes of his College (Founded between the Years 1440 and 1460) Did then Vacate His Fellowship on such a Condition; Osborne, T., Ed.; Gray’s-Inn: London, UK, 1745; (originally published in 1707); Available online: https://books.google.ro/books?id=TC45AAAAMAAJ&pg=PP7&redir_esc=y#v=onepage&q&f=false (accessed on 23 March 2022).
  6. Fisher, I. The Making of Index-Numbers: A Study of Their Varieties, Tests, and Reliability; Houghton Mifflin Company: New York, NY, USA, 1922. [Google Scholar]
  7. Diewert, W.E. The early history of price index research. In Essays in Index Number Theory; Diewert, W.E., Nakamura, A.O., Eds.; North-Holland: Amsterdam, The Netherlands, 1993; Volume 1, pp. 33–65. [Google Scholar]
  8. Diewert, W.E. Index Numbers. In The New Palgrave Dictionary of Economics, 3rd ed.; Macmillan Publishers Ltd.: New York, NY, USA, 2018. [Google Scholar]
  9. Ralph, J.; O’Neill, R.; Winton, J. A Practical Introduction to Index Numbers; John Wiley & Sons Ltd.: Chichester, UK, 2015. [Google Scholar]
  10. O’Neill, R.; Ralph, J.A.; Smith, P. The Origins of Inflation Measurement: 1700–1879. In Inflation; Palgrave Macmillan: Cham, Switzerland, 2017; Available online: https://doi.org/10.1007/978-3-319-64125-6_3 (accessed on 26 March 2022). [CrossRef]
  11. Dutot, C. Réflections Politiques sur les Finances et le Commerce; Les Frères , V., Prevost, N., Eds.; La Haye: London, UK, 1738; Volume 1. [Google Scholar]
  12. Custodi, P. Del Valore e Della Proporzione dei Metalli Monetati. In Scrittori Classici Italiani di Economia Politica; Destefanis, G.G.: Milan, Italy, 1804; Volume 13, pp. 297–366, (originally published in 1764). [Google Scholar]
  13. Young, A. An Inquiry into the Progressive Value of Money in England as Marked by the Price of Agricultural Products; Hatchards–Piccadilly: London, UK, 1812. [Google Scholar]
  14. Săvoiu, G. Universul Preţurilor şi Indicii Interpret; Editura Independenţa Economicǎ: Piteşti, Romania, 2001. [Google Scholar]
  15. Săvoiu, G.; Matei, S. Transdisciplinarity of Logic’s History. ESMSJ 2022, 10, 12–20. [Google Scholar]
  16. Bowley, A.L. Irving Fisher, The Making of Index-Numbers: A Study of their Varieties, Tests, and Reliability. Econ. J. 1923, 33, 90–93. [Google Scholar] [CrossRef]
  17. Fisher, I.; Bowley, A.L. Professor Bowley on Index-Numbers. Econ. J. 1923, 33, 246–252. [Google Scholar] [CrossRef]
  18. Croxton, F.E.; Cowden, D.J. Applied General Statistics; Prentice-Hall, Inc.: New York, NY, USA, 1939. [Google Scholar]
  19. Eichhorn, W.; Voeller, J. Theory of the Price Index; Springer: Berlin, Germany, 1976. [Google Scholar]
  20. Eichhorn, W. What is an Economic Index? An Attempt of an Answer. In Theory and Applications of Economic Indices; Eichhorn, W., Henn, R., Opitz, O., Shephard, R.W., Eds.; Physica Verlag: Wurzburg, Germany, 1978; pp. 3–42. [Google Scholar]
  21. Levell, P. Is the Carli index flawed? Assessing the case for the new retail price index RPIJ. J. R. Stat. Soc. Ser. A 2015, 178, 303–336. [Google Scholar] [CrossRef] [PubMed] [Green Version]
  22. Yule, G.U. Discussion of Mr. Flux’s Paper. J. R. Stat. Soc. 1921, 84, 199–202. [Google Scholar]
  23. White, G. IndexNumR: A Package for Index Number Calculation. 2020. Available online: https://cran.r-project.org/web/packages/IndexNumR/vignettes/indexnumr.html (accessed on 21 March 2022).
  24. Savoiu, G.; Iorga-Siman, I. The Concept of Time in the Physical Way of Thinking, and Its Impact on Knowledge and the Evaluation of Inflation as an Economic Phenomenon. ESMSJ 2011, 1, 25–35. Available online: https://esmsj.upit.ro/No2_2011.html (accessed on 21 March 2022).
  25. Graf, B. Consumer Price Index Manual, Concepts and Methods; International Monetary Fund: Washington, DC, USA, 2020; Available online: https://www.elibrary.imf.org/view/books/069/25164-9781484354841-en/back-1.xml (accessed on 28 March 2022).
  26. Smarandache, F.; Săvoiu, G. Neutrosophic Index Numbers: Neutrosophic Logic Applied in the Statistical Indicators Theory; Critical Review A Publication of Society for Mathematics of Uncertainty; Center for Mathematics of Uncertainty Creighton University: Omaha, NE, USA, 2015; Volume 10, pp. 67–101. [Google Scholar]
  27. Banerjee, K.S. A Unified Statistical Approach to the Index Number Problem. Econometrica 1961, 29, 591–601. [Google Scholar] [CrossRef]
  28. Crowell, R. The Evolving Quest for a Grand Unified Theory of Mathematics. 2022. Available online: https://www.scientificamerican.com/article/the-evolving-quest-for-a-grand-unified-theory-of-mathematics/ (accessed on 15 March 2022).
  29. Frenkel, E. Lectures on the Langlands program and conformal field theory. In Frontiers in Number Theory, Physics, and Geometry II; Springer: Berlin/Heidelberg, Germany, 2007; pp. 387–533. [Google Scholar]
  30. Langlands, R.P. An essay on the dynamics and statistics of critical field theories. Société Mathématique Can. 1996, 3, 1945–1995. Available online: http://www.sunsite.ubc.ca/DigitalMathArchive/Langlands/pdf/cms-ps.pdf (accessed on 11 March 2022).
  31. Diewert, W.E. The Consumer Price Index and Index Number Purpose. J. Econ. Soc. Meas. 2001, 27, 167–248. [Google Scholar] [CrossRef] [Green Version]
  32. Gowers, T. Mathematics: A Very Short Introduction; Oxford University Press: Oxford, UK, 2002. [Google Scholar]
  33. Săvoiu, G. Statistica: Un Mod Ştiinţific de Gândire; Editura Universitară: Bucharest, Romania, 2007. [Google Scholar]
  34. Hirschmann, A. National Power and the Structure of Foreign Trade; University of California Press: Berkeley, CA, USA, 1945. [Google Scholar]
  35. Herfindahl, O. Concentration in the Steel Industry; Columbia University: New York, NY, USA, 1950. [Google Scholar]
  36. Hirschmann, A. The Paternity of an Index. Am. Econ. Rev. 1964, 54, 761. [Google Scholar]
  37. Săvoiu, G.; Iorga Simăn, I.; Crăciuneanu, V. The Phenomenon of Concentration—Diversification in Contemporary Globalization. Rom. Stat. Rev. 2012, 60, 16–27. [Google Scholar]
  38. Bondarenko, P. Herfindahl-Hirschman index. Encyclopedia Britannica. 10 October 2019. Available online: https://www.britannica.com/topic/Herfindahl-Hirschman-index (accessed on 29 March 2022).
  39. Frisch, M. Don Juan oder Die Liebe zur Geometrie [Don Juan or the Love of Geometry]. In A comedy in Five Acts, 1st ed.; Suhrkamp: Frankfurt, Germany, 1953. [Google Scholar]
  40. Blåsjö, V. Jakob Steiner’s Systematische Entwickelung: The Culmination of Classical Geometry. Math. Intel. 2009, 31, 21–29. [Google Scholar] [CrossRef]
  41. Ball, W.W.R. A Short Account of the History of Mathematics; The Project Gutenberg EBook of A Short Account of the History of Mathematics, EBook #31246; Dover Publications, Inc.: New York, NY, USA, 1908; (revised May 2010); Available online: https://www.gutenberg.org/files/31246/31246-pdf (accessed on 3 May 2022).
  42. Cajori, F. A History of Mathematics; The Project Gutenberg EBook of A History of Mathematics, EBook #31061; Macmillan & Co. Ltd.: London, UK, 1909; (revised January 2010); Available online: http://mis.kp.ac.rw/admin/admin_panel/kp_lms/files/digital/SelectiveBooks/Mathematics/A%20History%20of%20Mathematics.pdf (accessed on 21 May 2022).
  43. Heath, T.A. History of Greek Mathematics. II from Aristarchus to Diophantus; Clarenton Press: Oxford, UK, 1921. [Google Scholar]
  44. Ivor, T. Selections Illustrating the History of Greek Mathematics from Aristarchus to Pappus; William Heineman Ltd.: London, UK, 1941; Volume 2. [Google Scholar]
  45. Wells, D. The Penguin Dictionary of Curious and Interesting Geometry; Penguin Books: London, UK, 1991. [Google Scholar]
  46. Knorr, W.R. Archimedes and the Elements: Proposal for a Revised Chronological Ordering of the Archimedean Corpus. Granul. Matter 1978, 19, 211–290. Available online: http://www.jstor.org/stable/41133526 (accessed on 28 May 2022). [CrossRef]
  47. Roser, M. Human Development Index (HDI). 2014. Available online: https://ourworldindata.org/human-development-index (accessed on 25 May 2022).
  48. Prados de la Escosura, L. Augmented Human Development in the Age of Globalisation. Econ. Hist. Rev. 2021, 74, 946–975. Available online: https://onlinelibrary.wiley.com/doi/full/10.1111/ehr.13064 (accessed on 30 May 2022). [CrossRef]
  49. Săvoiu, G.; Gogu, E.; Taicu, M. Hierarchies of Asociative Dynamics, Starting From Romania’s Macro-Economic Imbalances in the EU-28. What Does Romania’s Economic Evolution in the EU-28 Look Like? Rom. Stat. Rev. 2017, 3, 35–46. [Google Scholar]
  50. Kaldor, N. Speculation and economic stability. In The Economics of Futures Trading; Palgrave Macmillan: London, UK, 1939; pp. 111–123. [Google Scholar]
  51. Kaldor, N. A Model of Economic Growth. Econ. J. 1957, 67, 591–624. [Google Scholar] [CrossRef]
  52. Kaldor, N. Strategic Factors in Economic Development; Ithaca: New York, NY, USA, 1967. [Google Scholar]
  53. Stoleru, L.G. L’Équilibre et la Croissance Économique, Principes de Macroéconomie; Dunod: Paris, France, 1967. [Google Scholar]
  54. Stoleru, L.G. Economie, Comprendre L’avenir; Dunod: Paris, France, 1999. [Google Scholar]
  55. Korka, M.; Tușa, E. International Business Statistics, 2nd ed.; ASE Publishers: Bucharest, Romania, 2004. [Google Scholar]
  56. Săvoiu, G. Situaţii Statistice Financiar-Contabile şi Sisteme de Indicatori Statistici Derivaţi [Financial and Accountancy Statistical Situations and Systems of Derived Statistical Indicators]; Universitara Publishers: Bucharest, Romania, 2013. [Google Scholar]
  57. Săvoiu, G. Systems of Industrial Indicators—In a Context Dominated by the National Forecasting Commission’s Anticipations. Rom. Stat. Rev. Suppl. 2017, 65, 121–129. [Google Scholar]
  58. Orcibal, J. Dei agricultura: Le carré magique SATOR AREPO, sa valeur et son origine. Rev. Hist. Relig. 1954, 146, 51–66. [Google Scholar] [CrossRef]
  59. Săvoiu, G.; Ţaicu, M. Foreign Direct Investment Models, based on Country Risk for Some Post-socialist Central and Eastern European Economies. Procedia Econ. Financ. 2014, 10, 249–260. [Google Scholar] [CrossRef] [Green Version]
  60. Khalid, B.; Naumova, E. Digital transformation SCM in view of Covid-19 from Thailand SMEs perspective. In Global Challenges of Digital Transformation of Markets; de la Poza, E., Barykin, S.E., Eds.; Nova Science Publishers: Hauppauge, NY, USA, 2021; pp. 49–66. [Google Scholar]
  61. Barykin, S.Y.; Kapustina, I.V.; Sergeev, S.M.; Kalinina, O.V.; Vilken, V.V.; de la Poza, E.; Putikhin, Y.Y.; Volkova, L.V. Developing the physical distribution digital twin model within the trade network. Acad. Strateg. Manag. J. 2021, 20, 1–24. [Google Scholar]
  62. Duignan, B. Occam’s Razor. Encyclopedia Britannica. 28 May 2021. Available online: https://www.britannica.com/topic/Occams-razor (accessed on 20 May 2022).
Figure 1. The triangle of Zenodorus and Hypsicles, also reconfirmed by Pappus, is capitalizable as a constructive axis of the regular convex polygon inscribed in the GAIN methodology.
Mathematics 10 02853 g001
Figure 2. MID-specific dual graphics in “3-gon” GAIN.
Mathematics 10 02853 g002
Figure 3. MID-specific dual graphics in “4-gon” GAIN.
Mathematics 10 02853 g003
Figure 4. MID-specific dual graphics in “5-gon” GAIN.
Mathematics 10 02853 g004
Figure 5. MID-specific dual graphics in “6-gon” GAIN.
Mathematics 10 02853 g005
Figure 6. MID-specific graphics in “12-gon” GAIN as a stellate polygon.
Mathematics 10 02853 g006
Table 1. A list of “n-gons” areas and error’s levels by Greek numerical prefixes.
n Lines.
(Sides,
Angles)
Ancient Greek Denomination for Regular Polygons (“n-gons”)Inscribed
Polygon Area
(Radius R = 1)
% from Inscribed Circle’s Area (π)*Error’s Level
(%)
Obs.
3Trigon (Triangle)1.2990381041.349667158.6503329>50%
4Tetragon (Square)2.000000000063.661977236.3380228>33%
5Pentagon 2.377641290775.682672824.3173272>20%
6Hexagon2.598076211482.699334317.3006657>10%
7Heptagon 2.736410188687.102641512.8973585>10%
8Octagon2.828427124590.03163169.9683683>5%
9Enneagon (Nonagon)2.892544243692.07254287.9274572>5%
10Decagon2.938926261593.54892836.4510717>5%
11Hendecagon 2.973524496094.65022445.3497756>5%
12Dodecagon2.999999999995.48202444.5179756<5%
13Triskaidecagon 3.020700618396.15188703.8481130<5%
14Tetradecagon 3.037186173896.67663853.3233615<5%
15Pentadecagon 3.050524823197.10122092.8987791<3%
16Hexadecagon 3.061467458997.44953582.5504642<3%
17Heptadecagon 3.070554162697.73877462.2612254<3%
18Octadecagon 3.078181289997.98155352.0184465<3%
19Enneadecagon
(Nonadecagon)
3.084644957498.18729851.8127015<2%
20Icosagon3.090169943798.36316431.6368357<2%
21Icosi(kai)henagon3.094929331398.51466031.4853397<2%
22Icosi(kai)digon 3.099058124298.64608381.3539162<2%
23Icosi(kai)trigon 3.102662868398.76082641.2391736<2%
24Icosi(kai)tetragon 3.105828541298.86159291.1384071<2%
25Icosi(kai)pentagon 3.1086235896 98.95056211.0494379<2%
26Icosi(kai)hexagon 3.111103635799.02950440.9704956<1%
27Icosi(kai)heptagon3.113314255099.09987060.9001294<1%
28Icosi(kai)octagon 3.115293075499.16285840.8371416<1%
29Icosi(kai)enneagon
Icosi(kai)nonagon
3.117071383199.21946370.7805363<1%
30Triacontagon3.118675362399.27051990.7294801<1%
40Tetracontagon3.128689300899.58927350.4107265<1%
50Pentacontagon3.133330839199.73701820.2629818<1%
100Hectogon3.139525976599.93421560.0657844<0.1%
1000Chiliagon 3.141571982899.9993420.000658<0.001%
10000Myriagon3.141592446999.99999340.0000066<0.00001%
N** n-gon” inscribed in a circle with radius R = 1 1 2 n × sin 360 ° n ( n × sin 360 ° n ): 2π 100 [ ( n sin 360 ° n ): 2π]
* Note: The area of a circle with radius R = 1 or 100% is constant π, expressed here with a 10 decimal place of 3.1415926536. ** Note: Extension of the polygon to apeirogon (“n-gon” with “n” → ∞) is not a statistically acceptable variant, with the IN values being useful as finite values in practice.
Table 2. A list of values of essential indicators of MID in the universe of prices adequate for a prospective “trigon” based on Eurostat data detailed as IN for “3-gon” GAIN.
Selected Economic Equilibria
(Indicators)
Values * for the Regular Trigon
(2020)
Values * for the Second Irregular Trigon
(2021)
Real Terms IN
(2021)
Error’s Level
(%)
Harmonized Index of Consumer Prices (HICP)105.97
1 or 100%
111.59
111.59:105.97 =
1.0530 or 105.30%
1.0530
or
105.30%
58.65
House price index
(HPI)
127.80
1 or 100%
142.51
142.51:127.80 =
1.115 or 111.51%
1.1151
or
111.51%
58.65
Index of Producer Price in Industry
(IPPI)
101.9
1 or 100%
111.9
111.9:101.9 =
1.0981 or 109.81%
1.0981
or
109.81%
58.65
Source of data: Eurostat is available online at: https://ec.europa.eu/eurostat/databrowser/view/, accessed on 9 August 2022 * Note: Data for the European Union—27 countries (from 2020) and 2015 = 100%.
Table 3. A list of values of essential MID indicators adequate in a prospective “carré magique”, based on UK data, detailed as IN for “4-gon” GAIN.
Selected Economic Equilibria
(Indicators)
Values * for the Regular Carré Magique
(2020)
Values * for the Second Irregular Carré Magique
(2021)
Real Terms IN
(2021)
Error’s Level
(%)
Gross Domestic Product Index
(Real Terms GDPI)
2046.21
(billions of constant prices)
1 or 100%
2198.47 (billions of constant prices)
2198.47:2046.21 =
1.0744 or 107.44%
1.0744
or
107.44%
36.34
1/GDP Deflator
Index (1/GDDPI)
(2019 = 100%)
1/1.05091 =
0.95156
1 or 100%
1/1.05394 = 0.94882
0.94882:0.95156 = 0.9971
0.9971 or 99.71%
0.9971
or
99.71%
36.34
Employment Index
(ILO definition)
(EI)
32.529
(billions of persons)
1 or 100%
32.366
32.366:32.529 =
0.995 or 99.50%
0.995
or
99.50%
36.34
Coverage Dynamics of Imports by Exports Index (CDIEI) (2006 = 100%)Imports IN= 84.231
Exports IN = 87.039
CIEI = 1.0333 or 103.33%
1 or 100%
Imports IN = 103.841
Exports IN = 98.714
CIEI = 0.9506 or 95.06%
95.06:103.33 = 0.92
0.920
or
92.0%
36.34
Source of data: International Monetary Fund, World Economic Outlook Database, April 2022, available online at: https://data.imf.org/regular.aspx?key=61545852, accessed on 9 August 2022. * Note: Data for the UK are in 2020 and 2021.
Table 4. The value of the fifth essential MID indicator adequate in a “strategical” and conjunctural pentagon, based on UK data, detailed as IN for “5-gon” GAIN.
Selected Economic Equilibria (Indicators)The Fifth IN Value of the Regular Strategical Pentagon in GBP
(2020)
The Fifth IN Value of the Second Irregular Strategical Pentagon in GBP (2021)Real Terms IN
(2021/
2020)
Error’s Level
(%)
Minimum vs. Median Hourly Earnings Index
(MMHEI)
Minimum value = 8.72
Median value = 14.90
(GBP/H)
MMHEI = 0.585234899
Minimum value = 8.91
Median value = 15.65
(GBP/H)
MMHEI = 0.569329073
0.9728
or
97.28%
24.32
Sources: Data are available online at: https://standout-cv.com/pages/average-uk-salary, accessed on 27 May 2022 and at: https://www.statista.com/statistics/280687/full-time-hourly-wage-uk/, accessed on 27 May 2022.
Table 5. The value of the sixth essential MID indicator adequate in a “perennial hexagon”, based on UK data, detailed as IN for “6-gon” GAIN.
Selected Economic
Equilibria
(Indicators)
Values * in the Regular Perennial Hexagon
(2019–2020)
Values * in the Second Irregular Perennial Hexagon
(2020–2021)
Real Terms IN
(2020–2021)
Error’s Level
(%)
Public Expenditure for Environment Protection Index (Real Terms PEEPI) 12.5
(GBP billions)
1 or 100%
13.0
(GBP billions)
13.0:12.5 = 1.04
1.04
or
104.0%
17.30
Source: GOV.UK data. Available online at: https://www.gov.uk/government/statistics/public-spending-statistics-release-may-2022/public-spending-statistics-may-2022, accessed on 27 May 2022. * Note: Public spending outturn data in the UK are for budget years 1990–2020 and 2020–2021.
Table 6. The value of the next six essential indicators of MID, adequate in a “first” acceptable IN as dodecagon in terms of decision risk, based on UK data, for “12-go”’ GAIN.
Selected Economic Equilibria
(Indicators)
Values * for the Regular Dodecagon
(2020)
Values * for the Second Irregular Dodecagon
(2021)
Real IN Value
(2021)
Error’s Level
(%)
Total Investment
from GDP (%) Index
(TINV/GDPI)
16.693
1 or 100%
17.091
17.091: 16.693 =
1.0238 or 102.38%
1.0238
or
102.38%
4.52
Gross National Savings from GDP (%) Index [(GNS/GDP)I]14.192
1 or 100%
14.504
14.504:14.192 =
1.0220 or102.20%
1.0220
or
102.20%
4.52
1/General Government Gross Debt Index—% of GDP (1/GGGDI) 102.608
1 or 100%
95.348
1: (95.348:102.608) =
1.0761 or 107.61%
1.0761
or
107.61%
4.52
Productivity Index
(2019 = 100%)
Output per hour
Worked = 101.9%
1 or 100%
Output per hour
Worked = 102.6%
102.6:101.9 = 1.0069
1.0069
or
100.69
4.52
Index of Economic
Freedom
(IEF)
Score IEF = 78.4
1 or 100%
Score IEF = 72.7
72.7:78.4 =
0.9273 or 92.73%
0.9273
or
92.73%
4.52
Euromoney’s Country Risk Index
(ECRI)
Score ECR = 64.37
1 or 100%
Score ECR = 64.23
64.23:64.37 =
0.9978 or 99.78%
0.9978
or
99.78%
4.52
Sources: Data are available at: https://www.oecd.org/economy/united-kingdom-economic-snapshot/, accessed on 27 May 2022, https://www.heritage.org/index/ranking, accessed on 27 May 2022 and https://www.euromoneycountryrisk.com/countries, accessed on 27 May 2022.
Table 7. A synthetic list of optimal intervals for “n-gons” GAIN based on error levels.
nInterval for Regular Polygons
(“n-gons” Numerical Limits)
Major Scope or AimError’s Level
(%)
* Obs.
3–11From Hendecagon to Tetragon (Square)Prospective
(Foresight)
(5.35–36.34%)LT
MT
12–26From Icosi(kai)hexagon to DodecagonDecision
(Statistics)
(0.97–4.52)MT
ST
27–100From Hectogon to Icosi(kai)heptagonMore precise
calculus
(0.07–0.90)ST
VST
* Note: Short (ST), medium (MT), long (LT), and very short (VST) terms.
Publisher’s Note: MDPI stays neutral with regard to jurisdictional claims in published maps and institutional affiliations.

