1. Introduction
The heat exchanger is one of a few important types of equipment that have found themselves in the application [
1] of pharmaceutical, refrigeration, medical waste recycling, heat recovery systems [
2], energy systems, automobile, and aeronautical industries [
3]. Engineers in industries are very keen on energy savings and the performance of equipment. Optimization techniques (OT) can serve as one of the break-throughs for their needs in long-term conditions. The heat transfer rate and pressure drop [
4] or, in other words, the Nusselt number
[
5] and the friction coefficient, are used to assess the efficacy of OT [
6]. Passive and active strategies are used to characterize OT. Recent findings on the OT [
7] from numerous researchers on double pipe heat exchangers (DHX) [
8,
9] are shown in
Table 1 to describe their achievements.
Table 1 shows a different set of inserts and their optimization levels with the flow for the past decade. The study of Y-branch inserts by Huang [
15], and Vortex generators by Zhang [
24] has achieved the highest augmentation of heat transfer in the flow regime. The investigation of the wavy strip and coiled wires by Pourahmad [
19] and Zohir [
22] has proved to have an effectiveness of 70% to 100%. The fluid flow assessment in a square and circular heat exchanger was investigated by Abdelrazek [
25]. They used four different types of nanofluids mixed in distilled water. Both experimental and numerical analyses were carried out by them. They found the different percentages of enhancement in heat transfer rates when the same fluid is passed into the circular and square heat exchangers. Afzal [
26] used graphene nanofluid in water (base fluid) to investigate the heat transfer performance of a novel implanted helical tube type triple heat exchanger. The nanofluid concentration, flow rate of hot water, and cold water were all varied during the experiments. They found considerable variations in the Nusselt numbers in this heat exchanger as compared to a normal concentric pipe exchanger. A significant enhancement in heat transfer coefficients was also found by using the nanofluids as compared to pure water.
Noorbakhsh [
27] investigated the influence of employing distorted tapes of different shapes on both the tubes of a concentric tube heat exchanger. The investigation was conducted using commercially available CFD software ANSYS Fluent V18. The effect of various parameters on the thermal performance of the exchanger was analyzed by determining the exit temperature, Nusselt number, and pressure drop. They found an increment in the Nusselt number due to the increment in the number of twisted tapes from 1 to 4. There was also a reduction in pressure drop for this configuration. Hosseinnejad et al. [
28] numerically investigated the heat transfer features of tubular-type heat exchangers that had dual distorted tapes. The flow was maintained as turbulent, with constant inlet velocity. They used commercially available CFD code Fluent to solve the governing equations. The results showed that aligned positioning improves heat transfer performance more than non-aligned positioning. The investigation concerning the air–air heat exchanger on any OT is very limited. So, the current investigation was carried out between Reynolds number 30,000 and 6000 with the application of Para-Winglet Tape (PWT) for the tube section. The PWT was investigated with CFD results and correlations were developed for flow and thermal parameters. The present study involved the development of a new type of turbulator/swirl generator for optimizing the performance of heat exchangers in terms of Nusselt number, friction factor, performance optimization index, and effectiveness. An air-to-air double pipe heat exchanger test setup was developed to investigate the PWT Inserts with 10°, 15°, and 20° degrees of para-inclination for dimensionless Reynolds numbers fluctuating between 6000 and 30,000.
2. Investigation Details
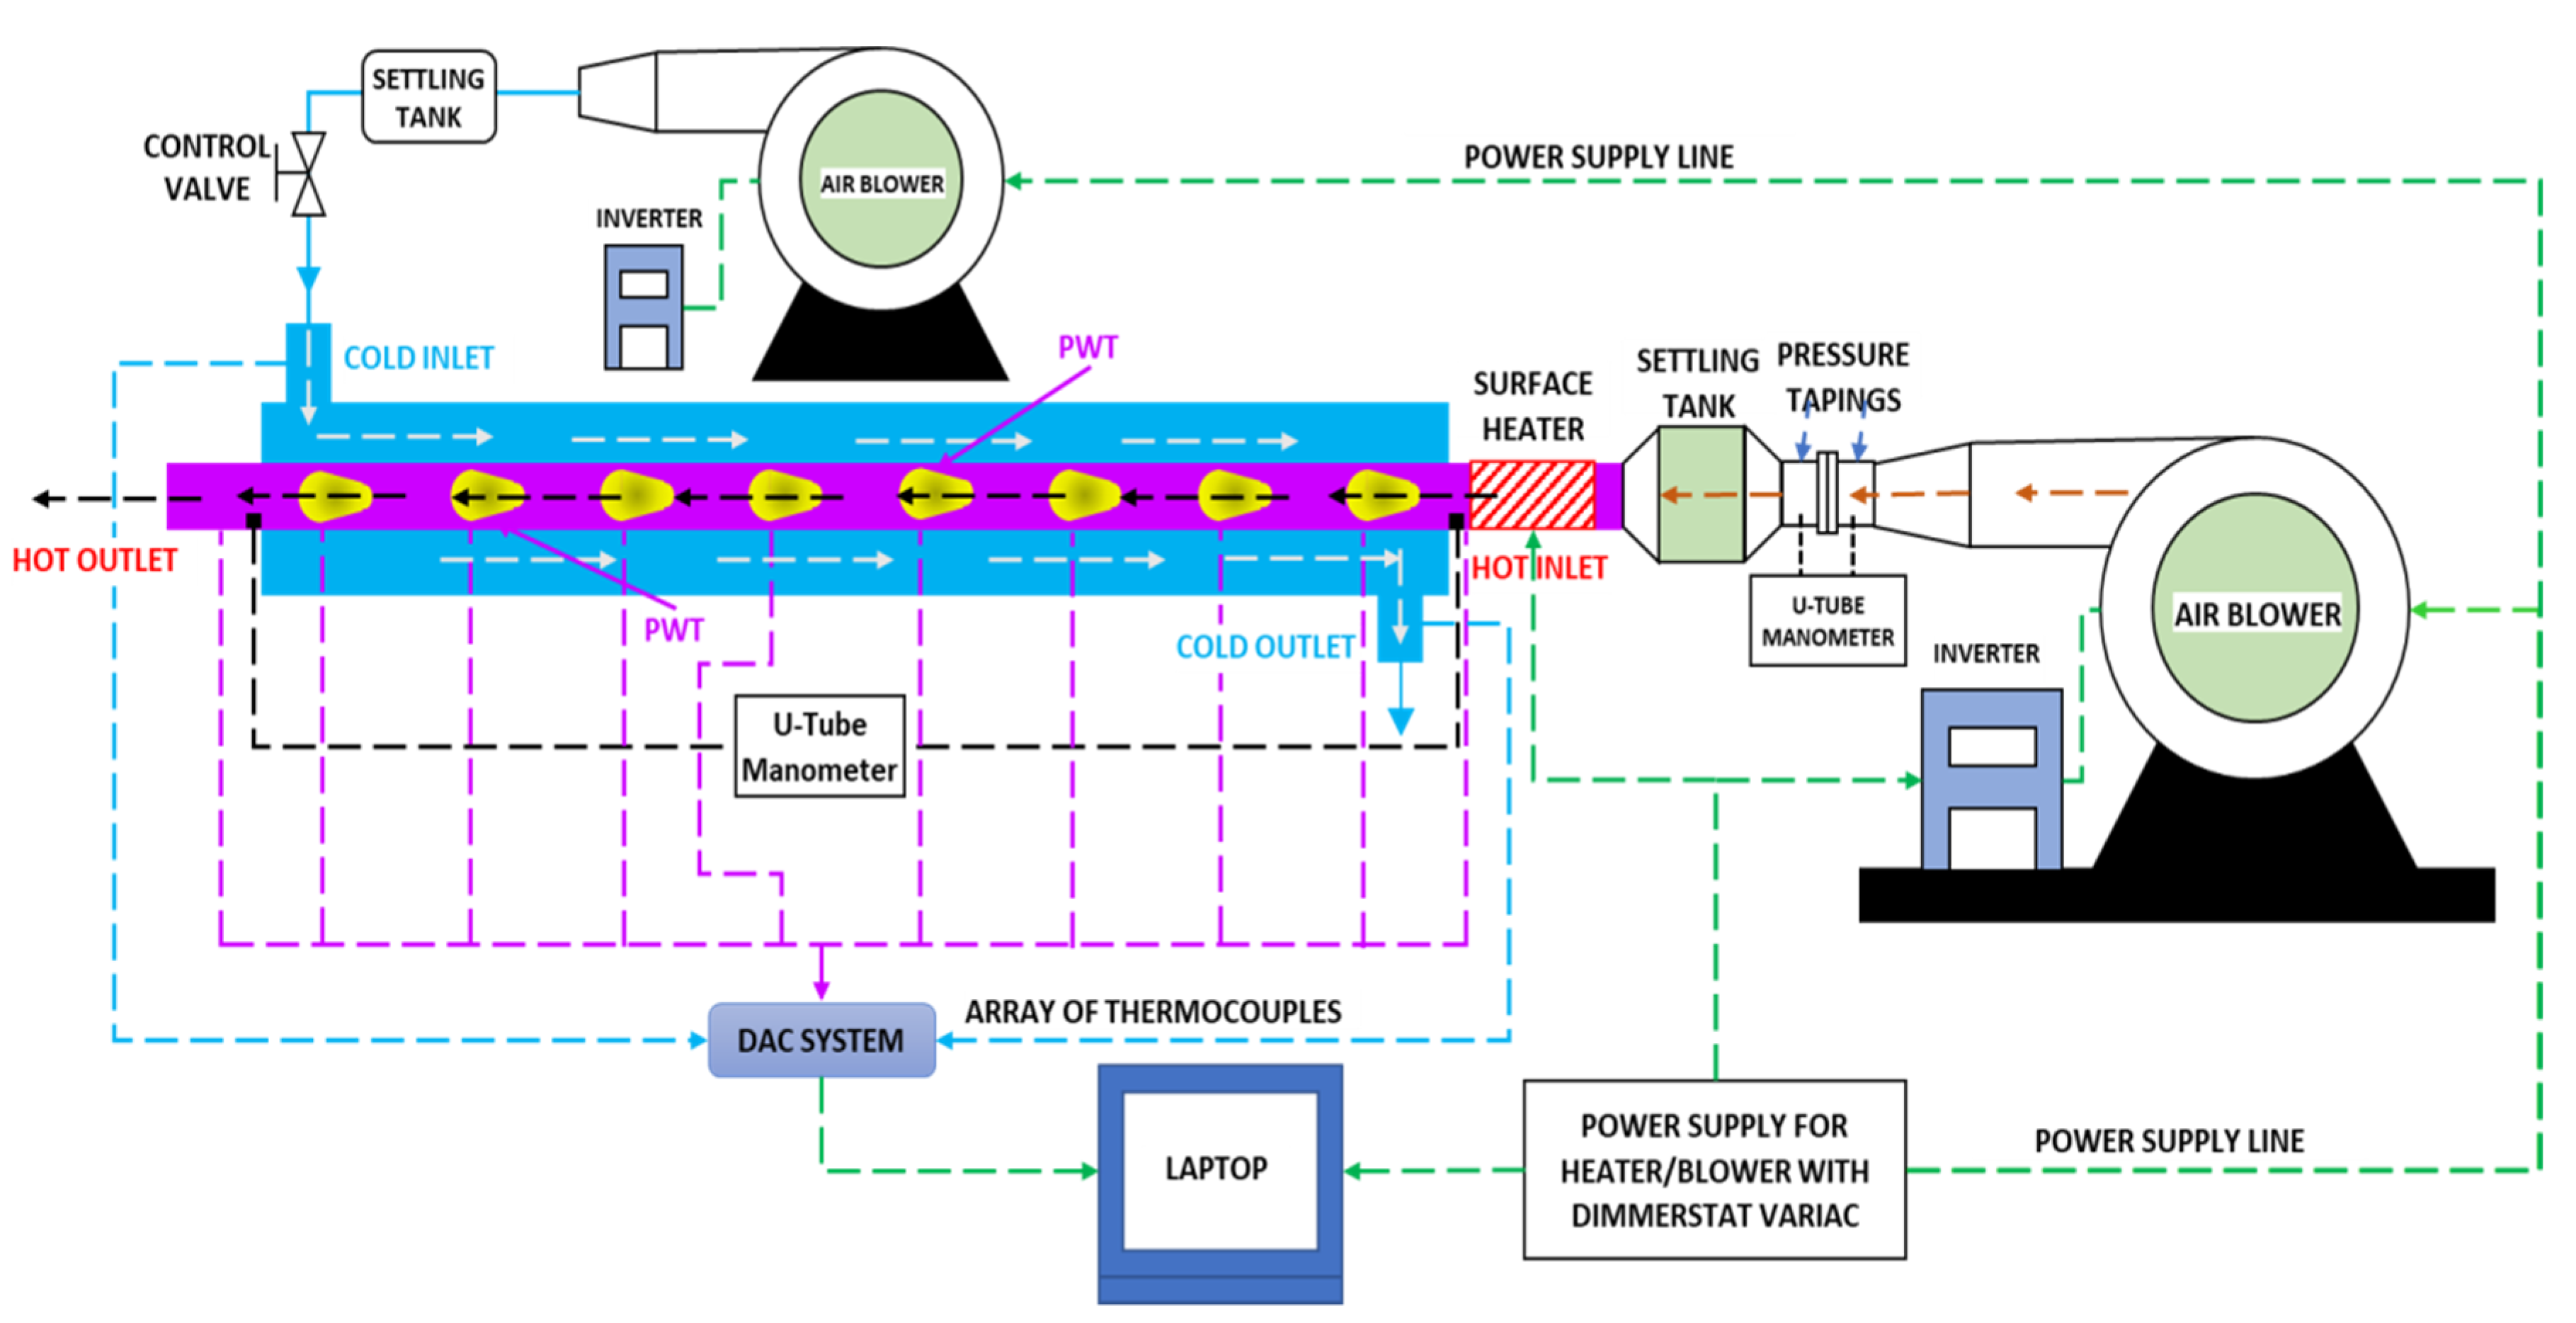
Figure 1 provides the details of the investigating setup developed for the experimentation of PWT. The flow was developed using the blowers and u-tube manometers were used to validate the pressure, settling tank for the stabilization of flow, surface heat for the addition of heat, DAC system to monitor the temperature readings, and inverter to reduce the fluctuations of power. The shell section was completely insulated with glass wool and asbestos rope. The tube section was made of copper for better heat engagements.
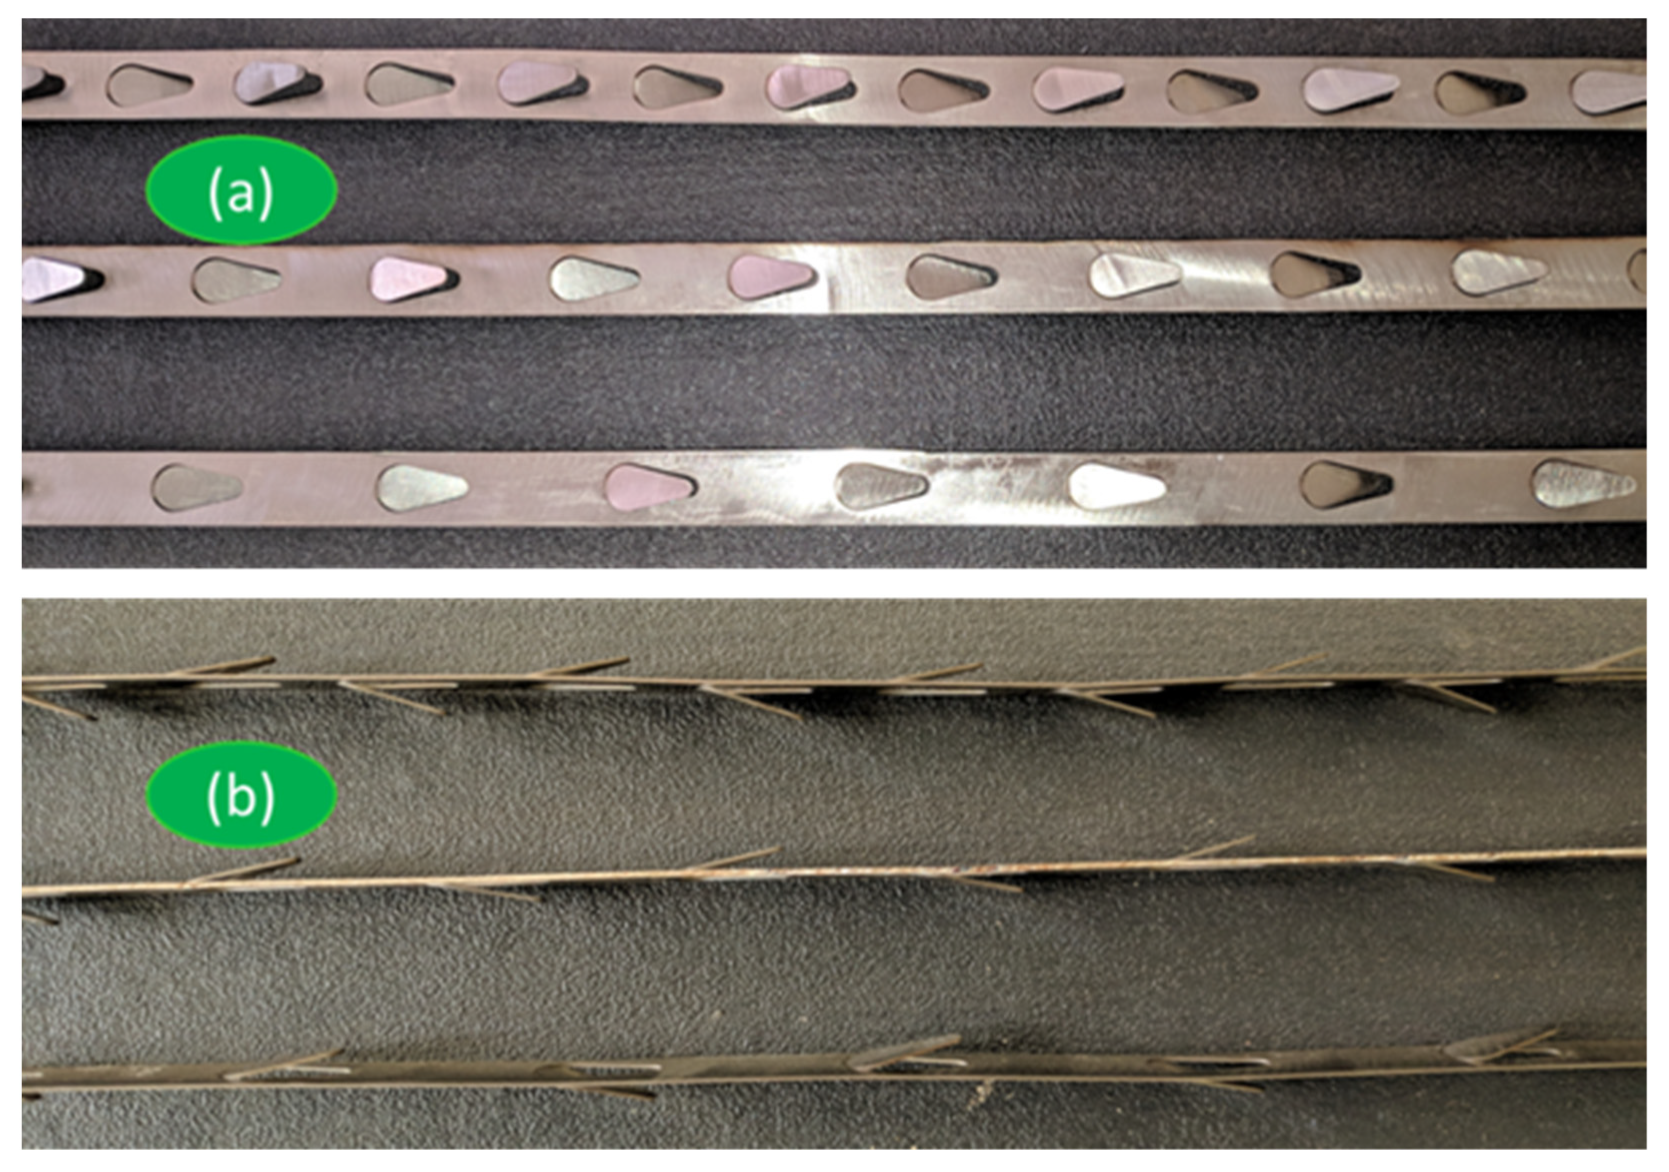
The design of the PWT inserts is shown in
Figure 2. The designs were developed to achieve better heat transfer over the smooth tube at a turbulent flow regime. They were placed in tube sections securely and monitored the surface temperature through ten evenly placed K-type thermocouples. The design of PWT is similar to that of a parachute design. The survey shows that inserts are manufactured with a material that is tough, flexible, and easy to manufacture. Stainless steel is one such type of material that has the above properties.
The development of the PWT was carried out with utmost care so as minimize any errors from the external environment.
Figure 2 shows that the PWT inserts displayed at different pitches and inclinations.
Figure 3a displays the orientation of the PWT by showcasing the pitch of three variants, namely 30 mm, 40 mm, and 50 mm.
Figure 3b displays the orientation of the PWT by showcasing the para inclinations of three variants, namely 10°, 15°, and 20° degrees. The thermophysical characteristics of the tube material (copper), the hot stream in the tube, and the cold fluid across the annular portion are described in
Table 2.
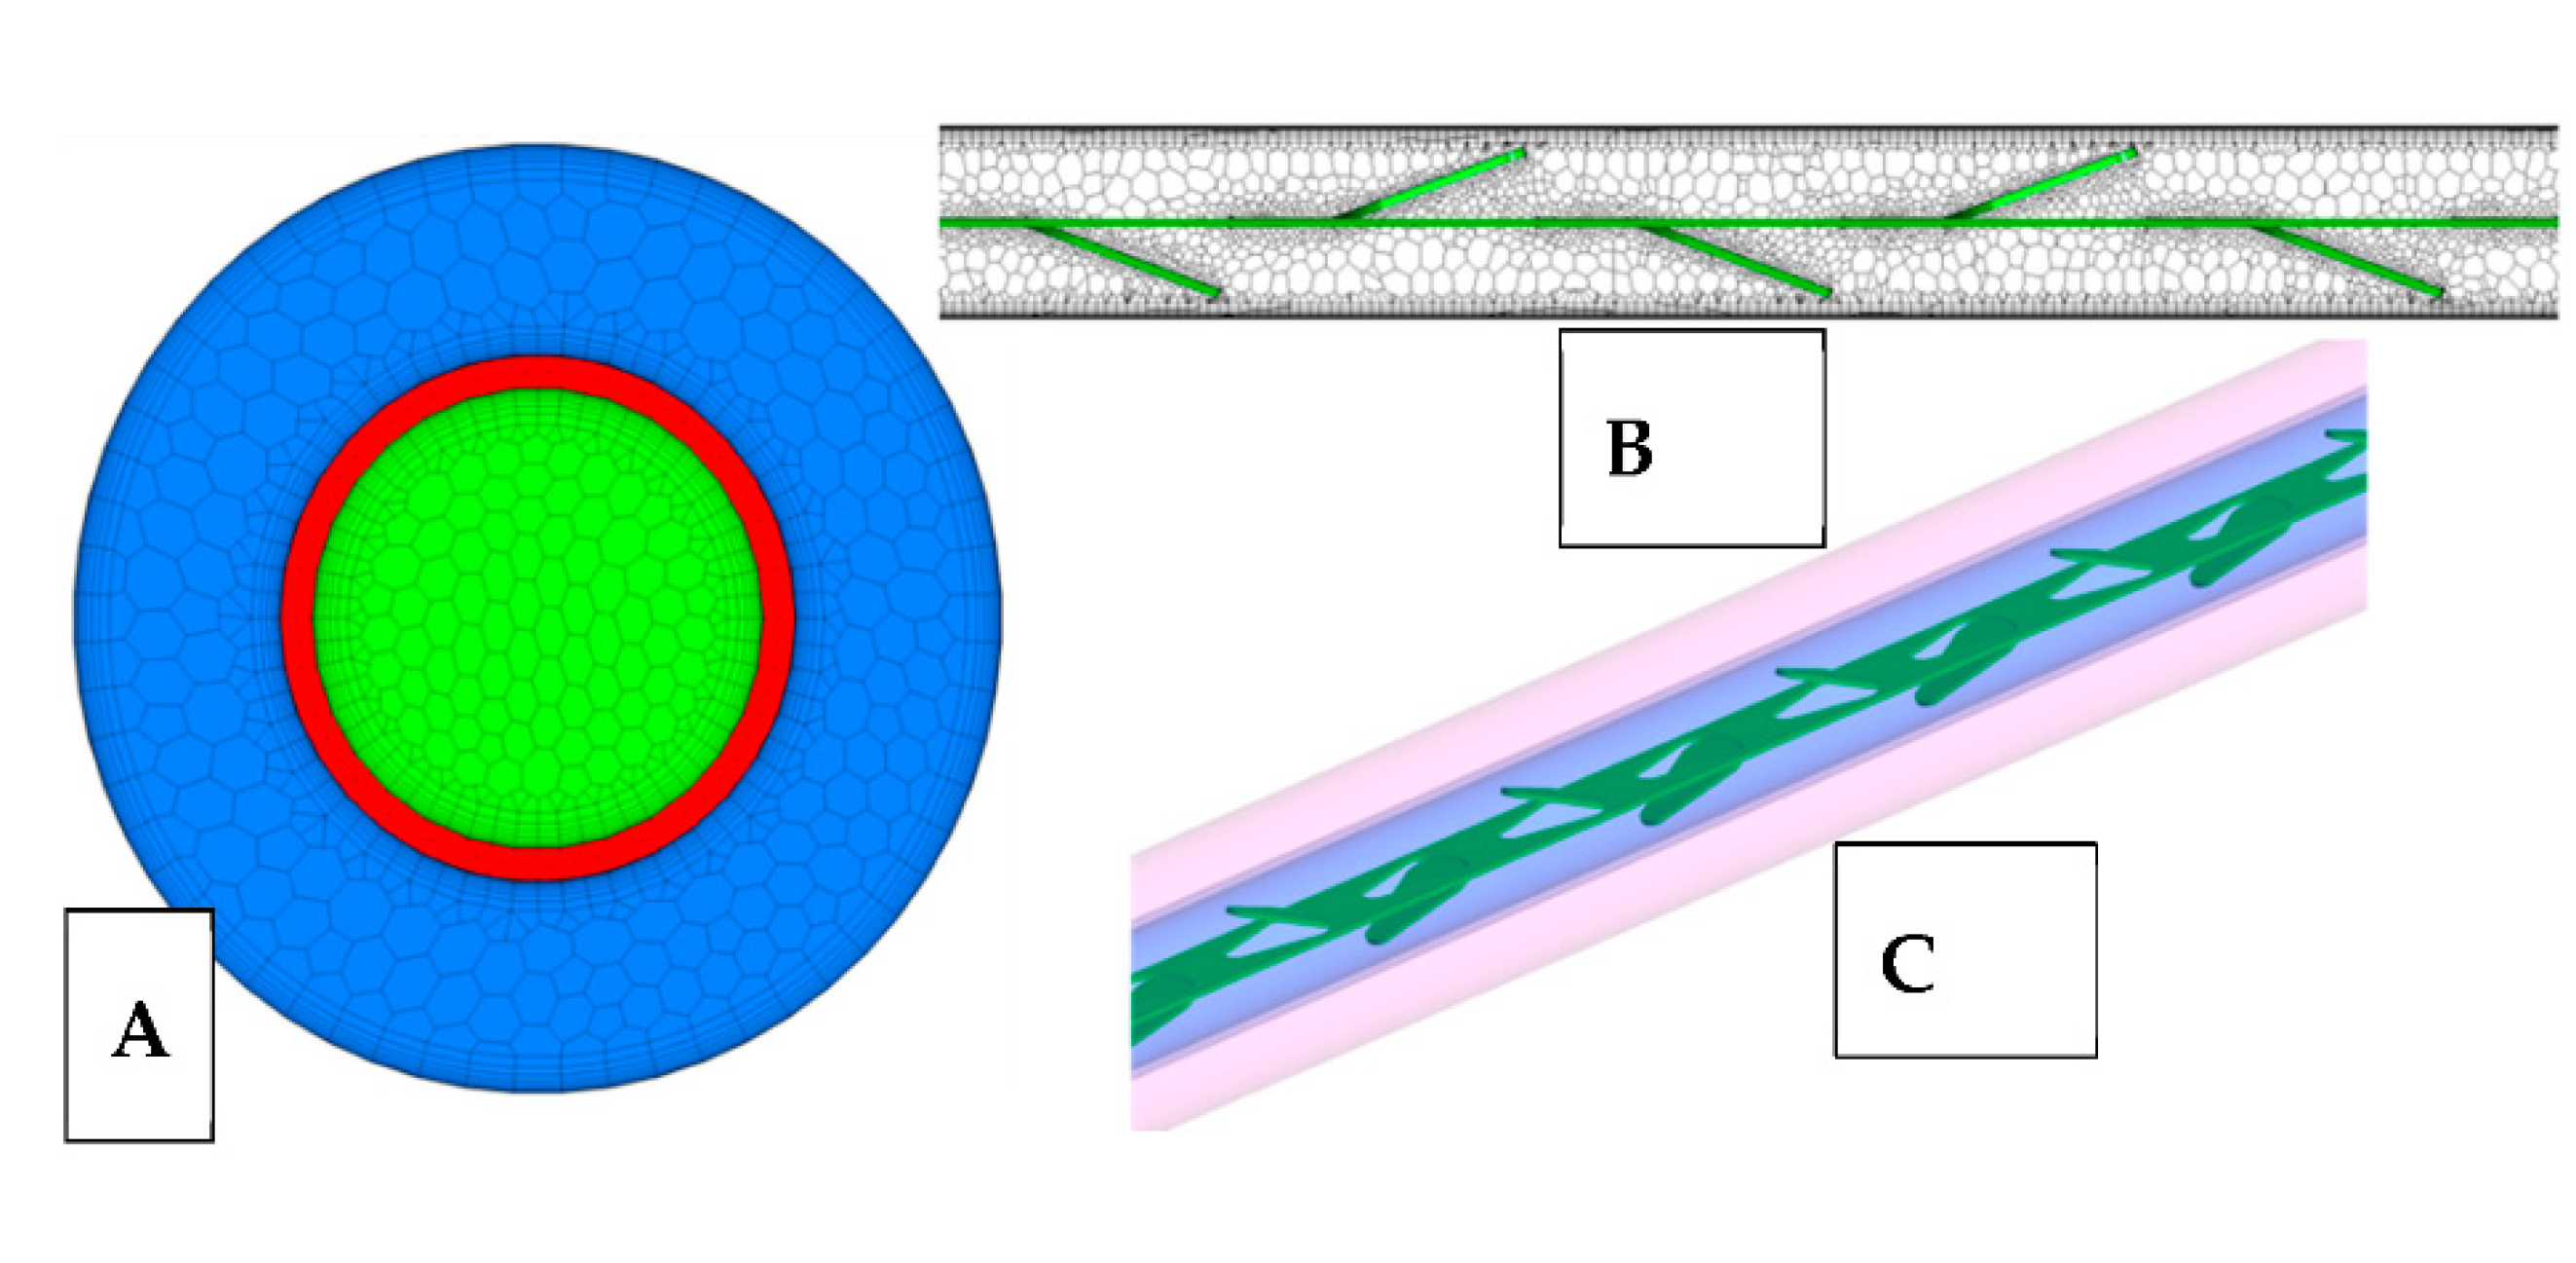
From
Figure 4A it is observed that the numerical model was developed with a boundary layer mesh technique. A 15-layer boundary was developed over the tube surface with a y-plus equal to one to capture the near boundary phenomenon and the exact flow regime is shown in
Figure 4B.
Figure 4C shows the placement of inserts in the double pipe heat exchanger.
The pre-processing, solving, and post-processing steps were carried out using the StarCCM+ software which includes geometry development, mesh development in polyhedral, boundary conditions, inlet conditions, environmental conditions, and post-processing. Polyhedral mesh is considered due to its advantage over the tetrahedral as it takes less CPU time to solve, is more robust for turbulence models, and has fewer internal memory requirements for each case study. Grid independence analysis is usually carried out to understand the number of elements required to reach approximated results of a particular physics.
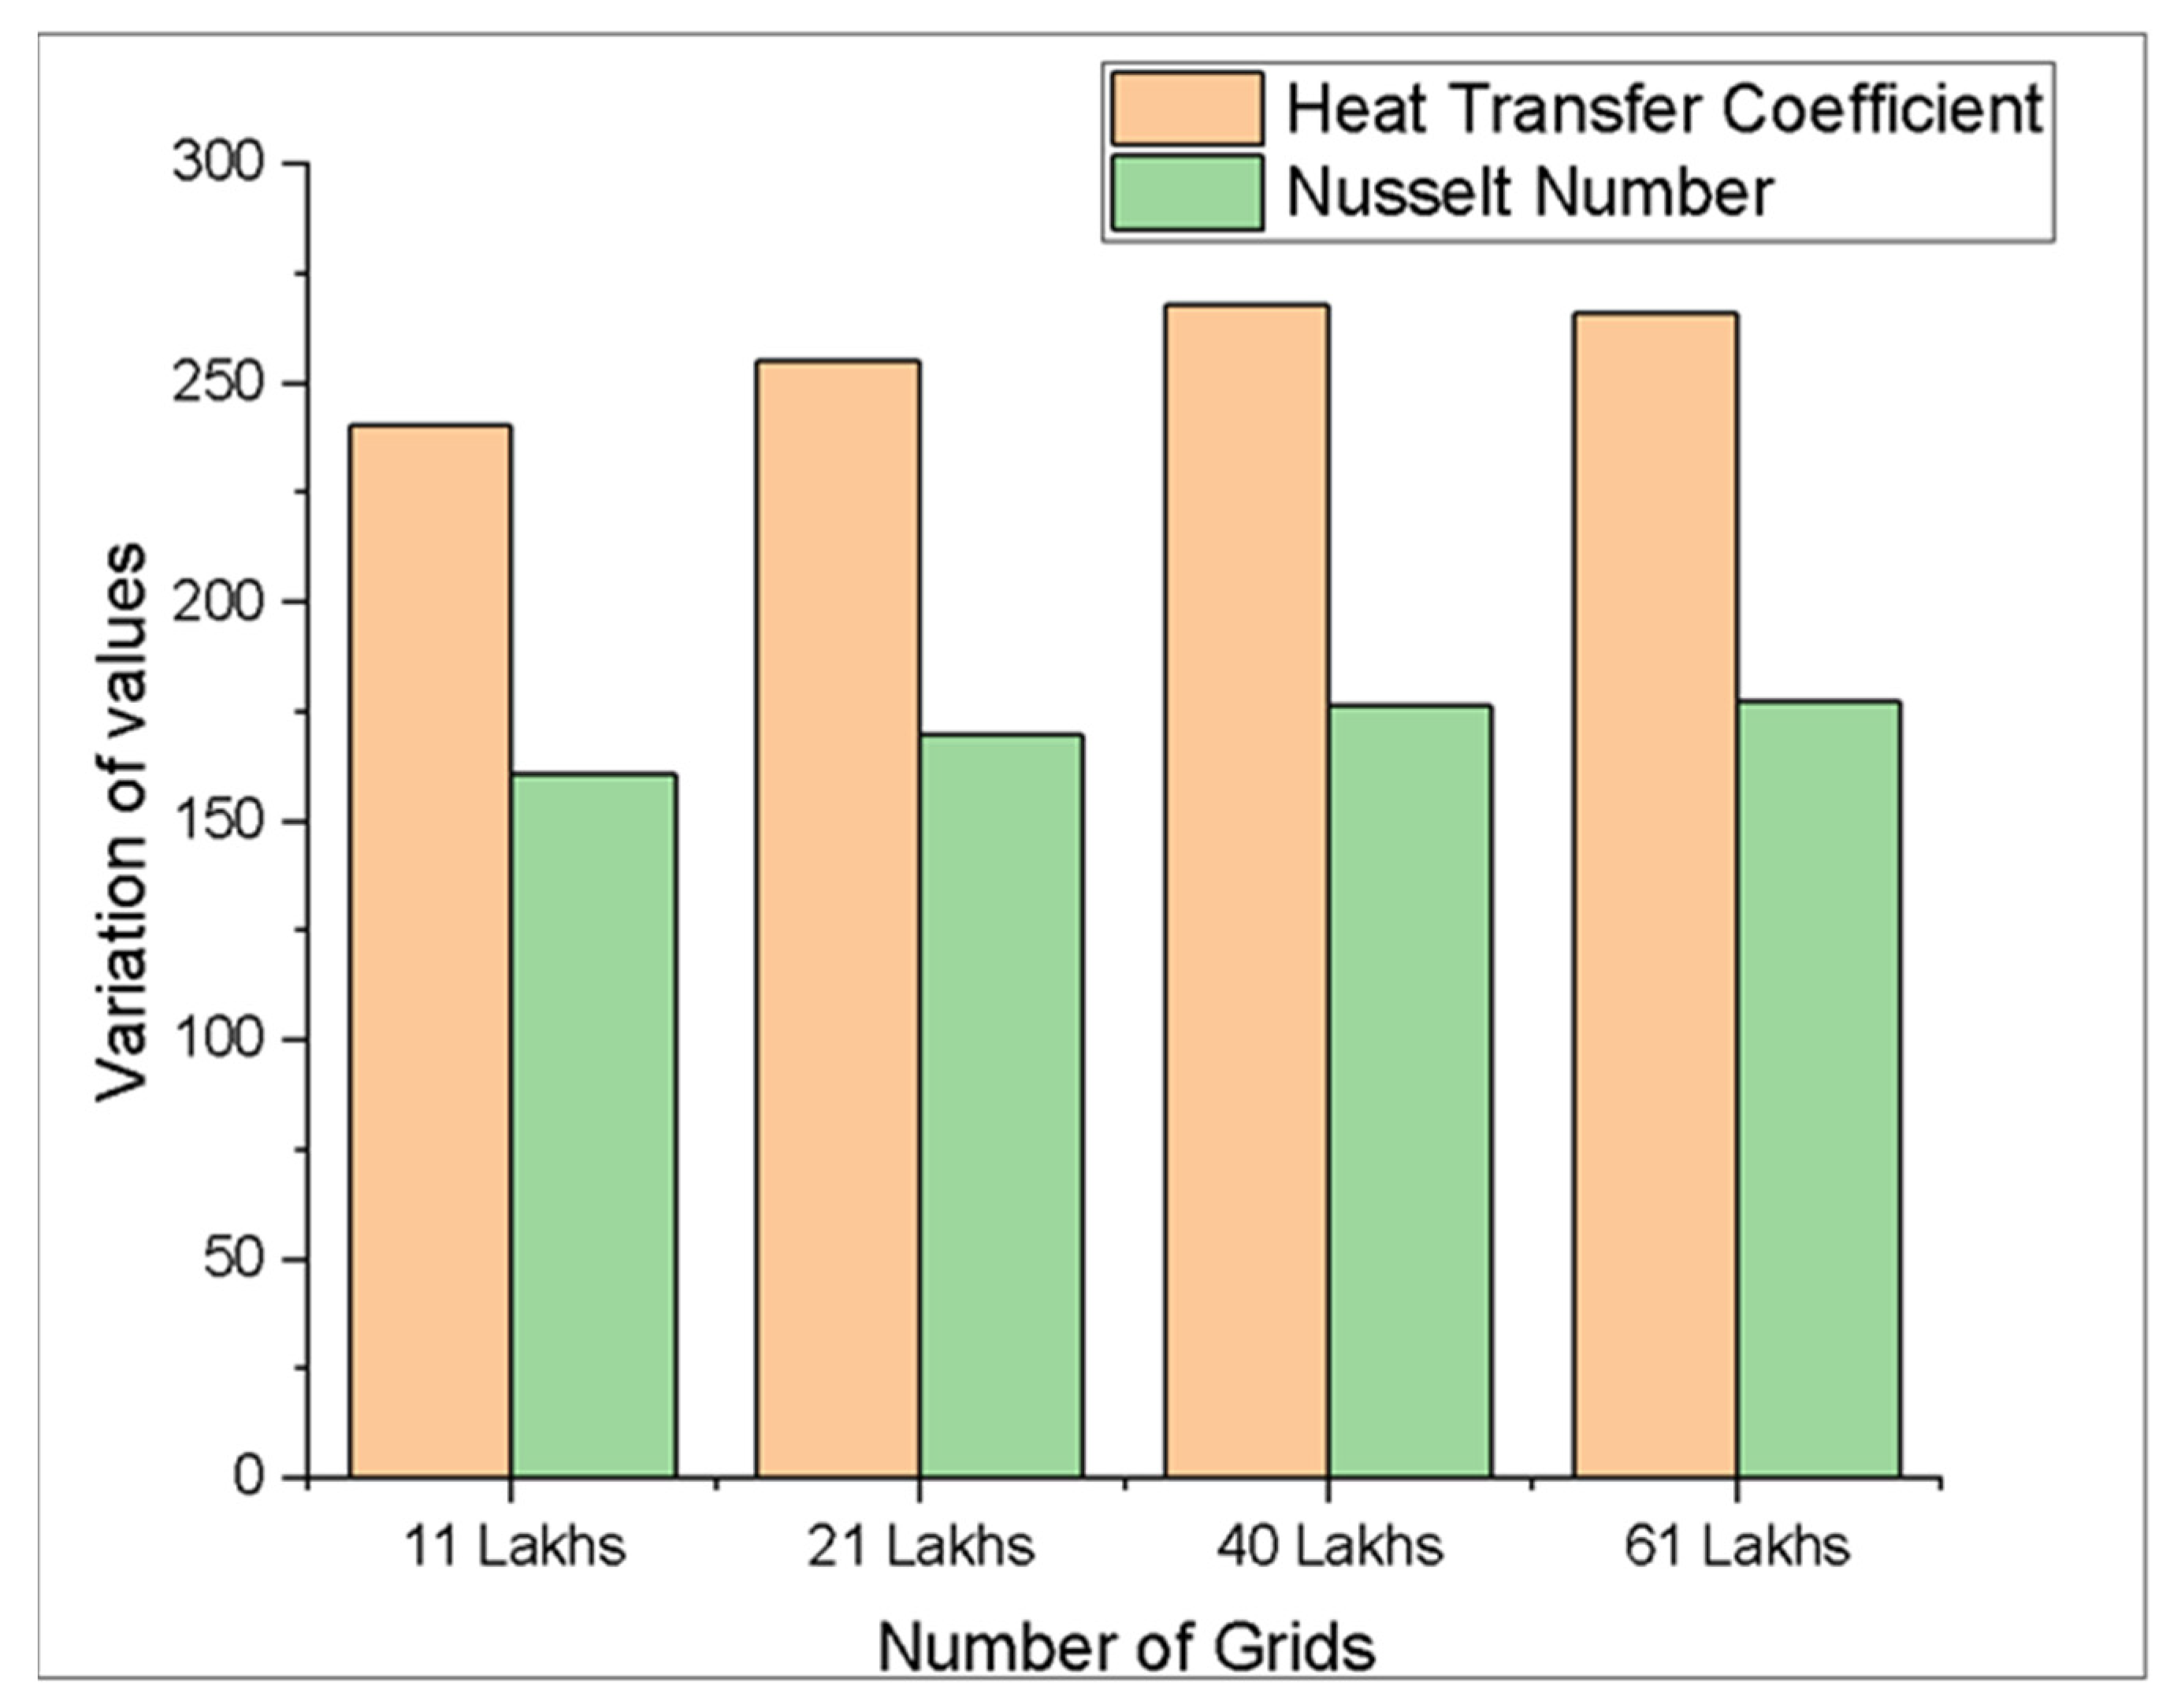
Figure 5 shows the independence check from 11 lakhs to 61 lakhs grid sizes where the heat transfer coefficient and the Nusselt number of the inside tube were measured at each level. The variation in the variable values was seen to be below 2% from 40 lakhs to 61 lakhs. So, a 61 lakhs grid size was selected to study all the cases for numerical simulation.
Figure 6 shows the details of the percentage of heat loss across the insulation from the external surfaces; the variations are high as the Re increases so the maximum possible heat loss, which can be restricted by the insulation provided over the external surfaces, is within 4.7%.
4. Governing Equations
The current fluid region is simulated using the CFD approach. The approach is based on three governing equations: continuity, momentum, and energy. The continuity equation denotes mass conservation, the momentum equation denotes force conservation, and the energy equation denotes energy conservation (temperature). For capturing the turbulence performance in the DHX, i.e.,
k → kinetic energy and
ε → dissipation correlations are computed concerning the Navier–Stokes equation for stable results on the steady flow heat transfer model. The physics of the numerical model are simulated using the governing equations as shown in
Table 4.
Grid sensitivity checks are usually performed for three main reasons: (a) repeatability of results; (b) computational cost; and (c) computational time. The grid sensitivity check was carried out under the steady-state-turbulence-heat transfer condition where each equation of flow, energy, momentum, and turbulence are validated up to the residual level of 1 × 10
−6. All the equations were solved under the segregated flow conditions of starccm+ CFD software [
39,
40]. The grid sensitivity analysis was carried out for 20° inclination and 50 mm pitch over Reynolds numbers of 18,000 for grid sizes 1,134,031, 2,155,673, 4,045,608, and 6,107,308 are presented in
Table 5. The interior tube was analyzed for any variations and repeatability in Nusselt number and heat transfer coefficient. The variation between 4,045,608 and 6,107,308 results was less than 2%. So, 4,045,608 grid-level methodologies were implemented for all the other numerical models with changes in the flow conditions.
5. Discussion of Results
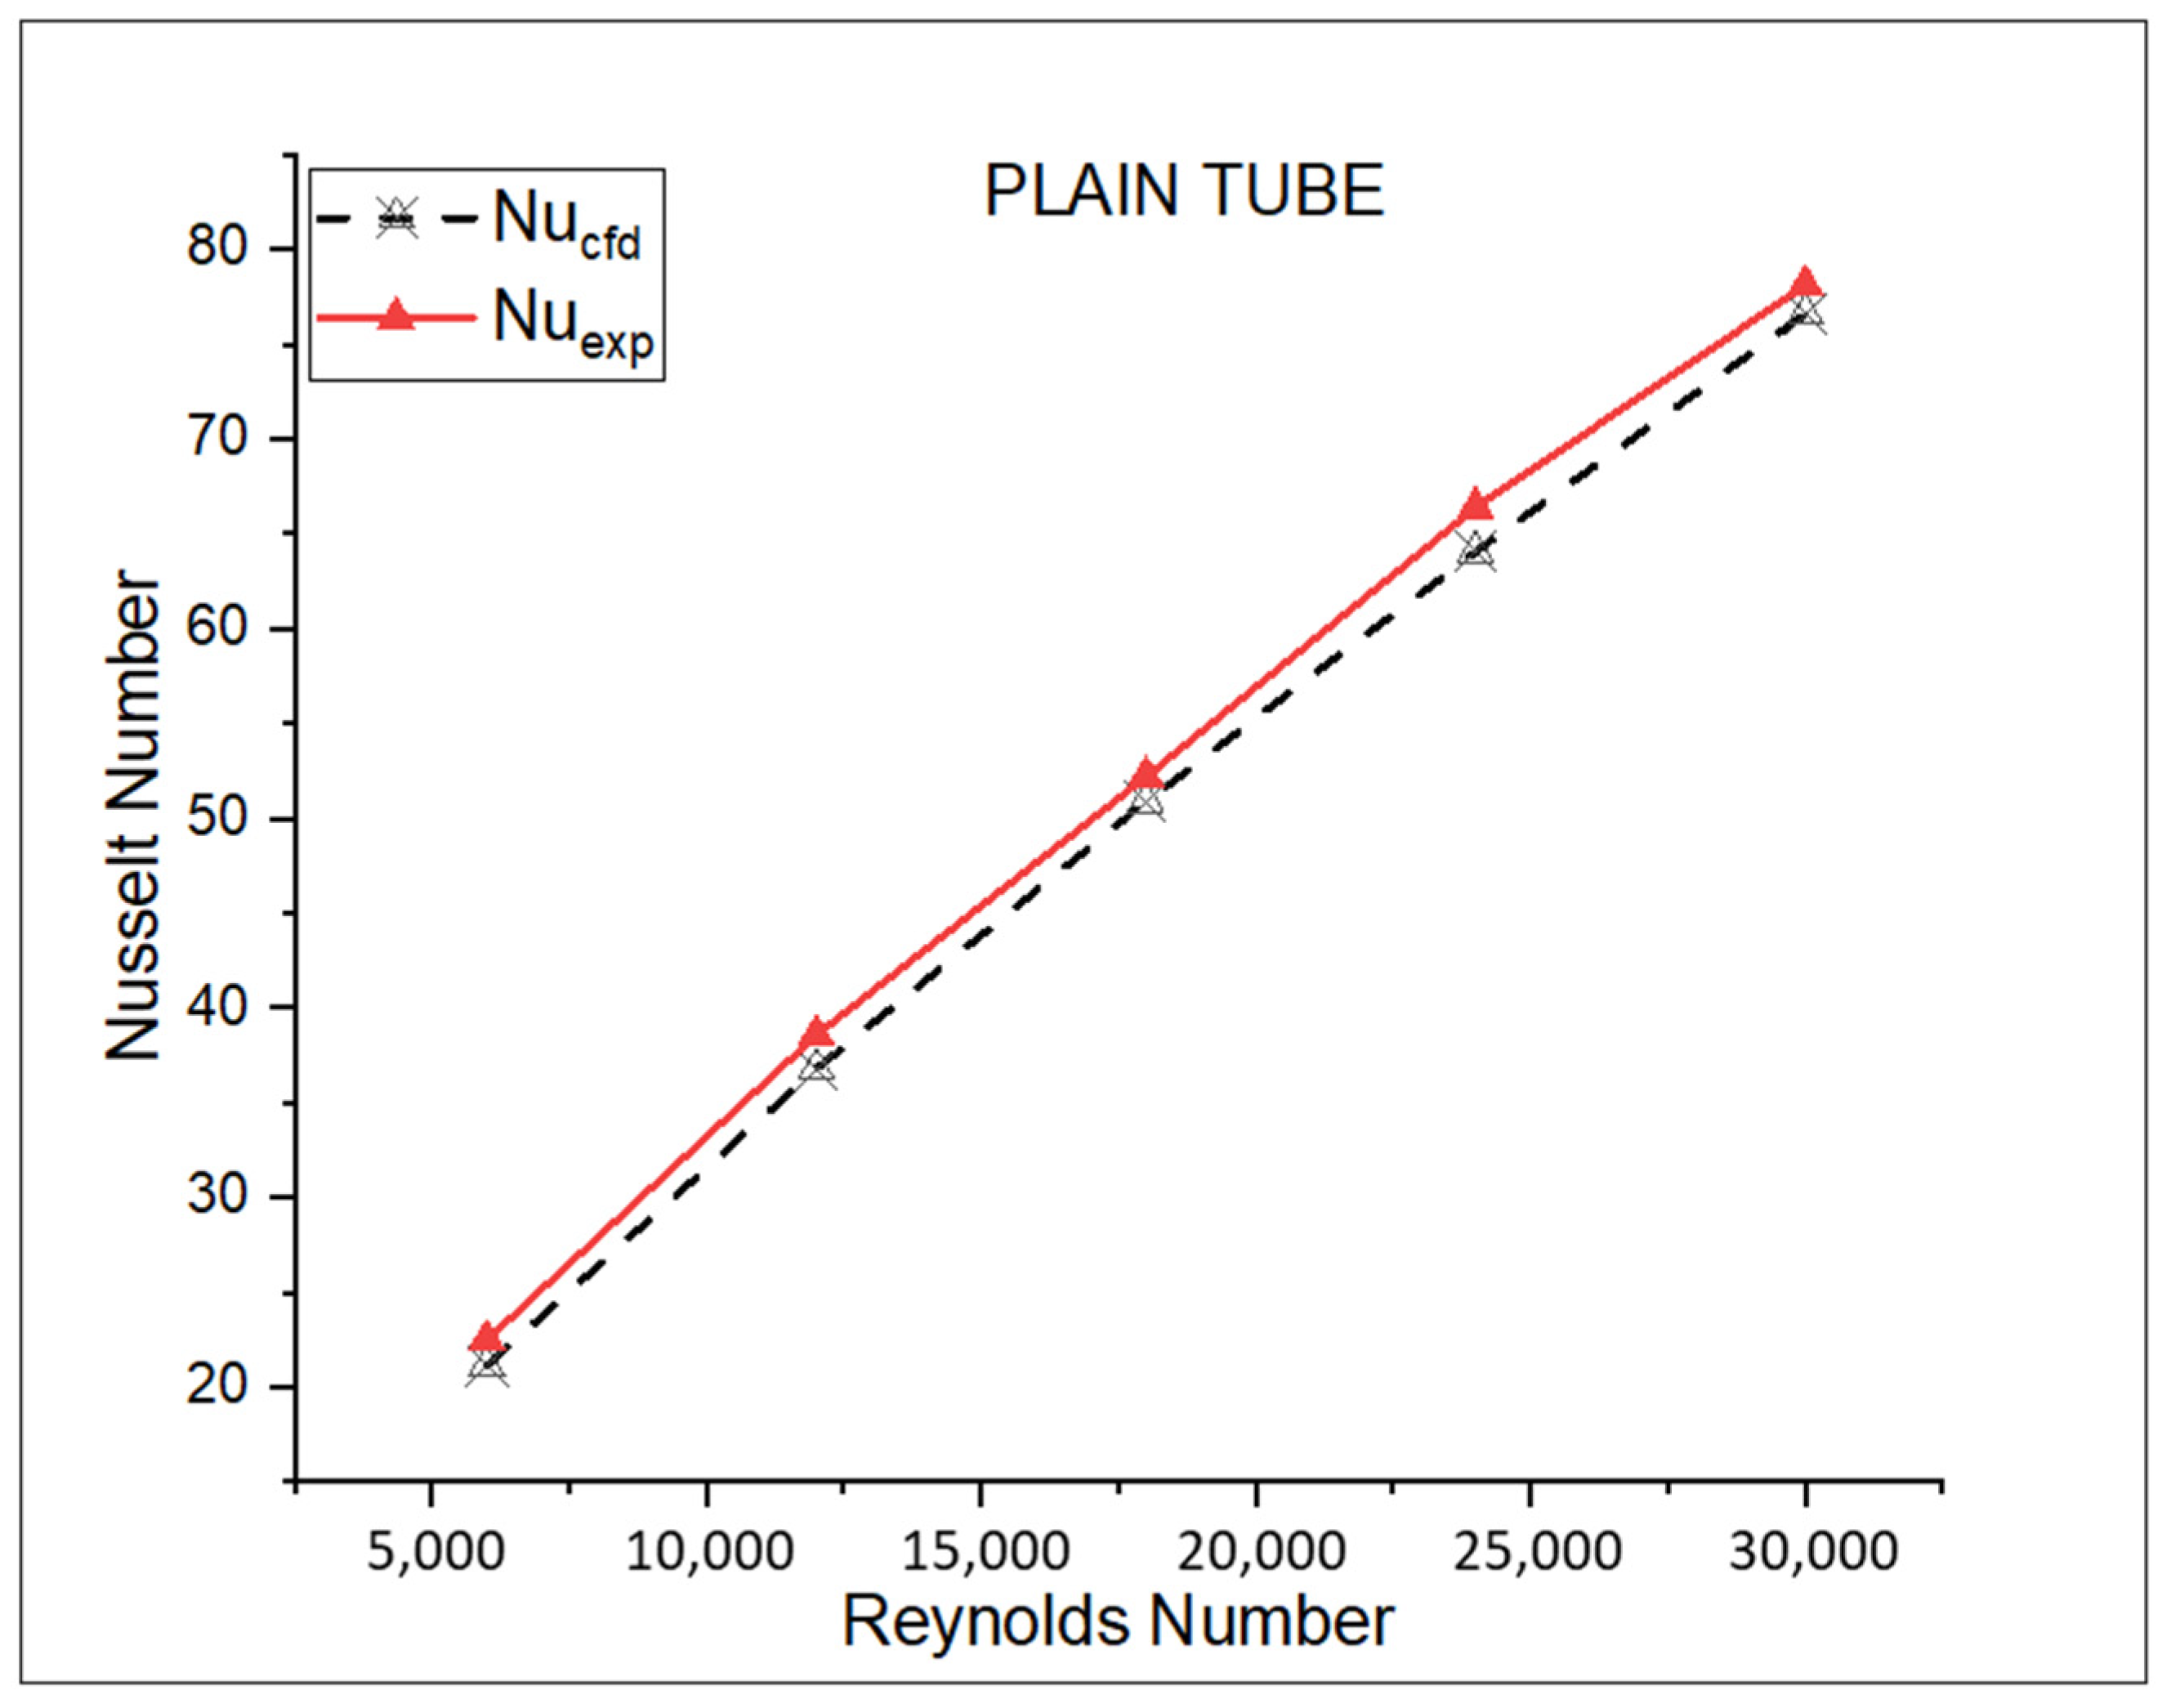
The plain tube was tested with two correlations, mainly Dittus for Nusselt number
and Blasius for friction factor. The correlations are as follows;
The variation of the test data and numerical data of Nusselt number for a plain tube model was examined and is displayed in
Figure 7. The study reveals that the Nusselt number between experimental and numerical values had a maximum variation percentage of ±4.21%. In a similar practice, the friction factor was also determined for experimental and numerical study and observed a maximum variation percentage of ±2.16% in
Figure 8. The plain tube analysis provides a clear vision of the approaches between numerical and experimental studies.
The thermal and flow observations were performed for the PWT on different cases as mentioned in
Table 6. The case studies are divided based on the three different pitches and para inclinations. Each case is investigated numerically and experimentally for all the flow conditions varying from Reynolds numbers 6000 to 30,000.
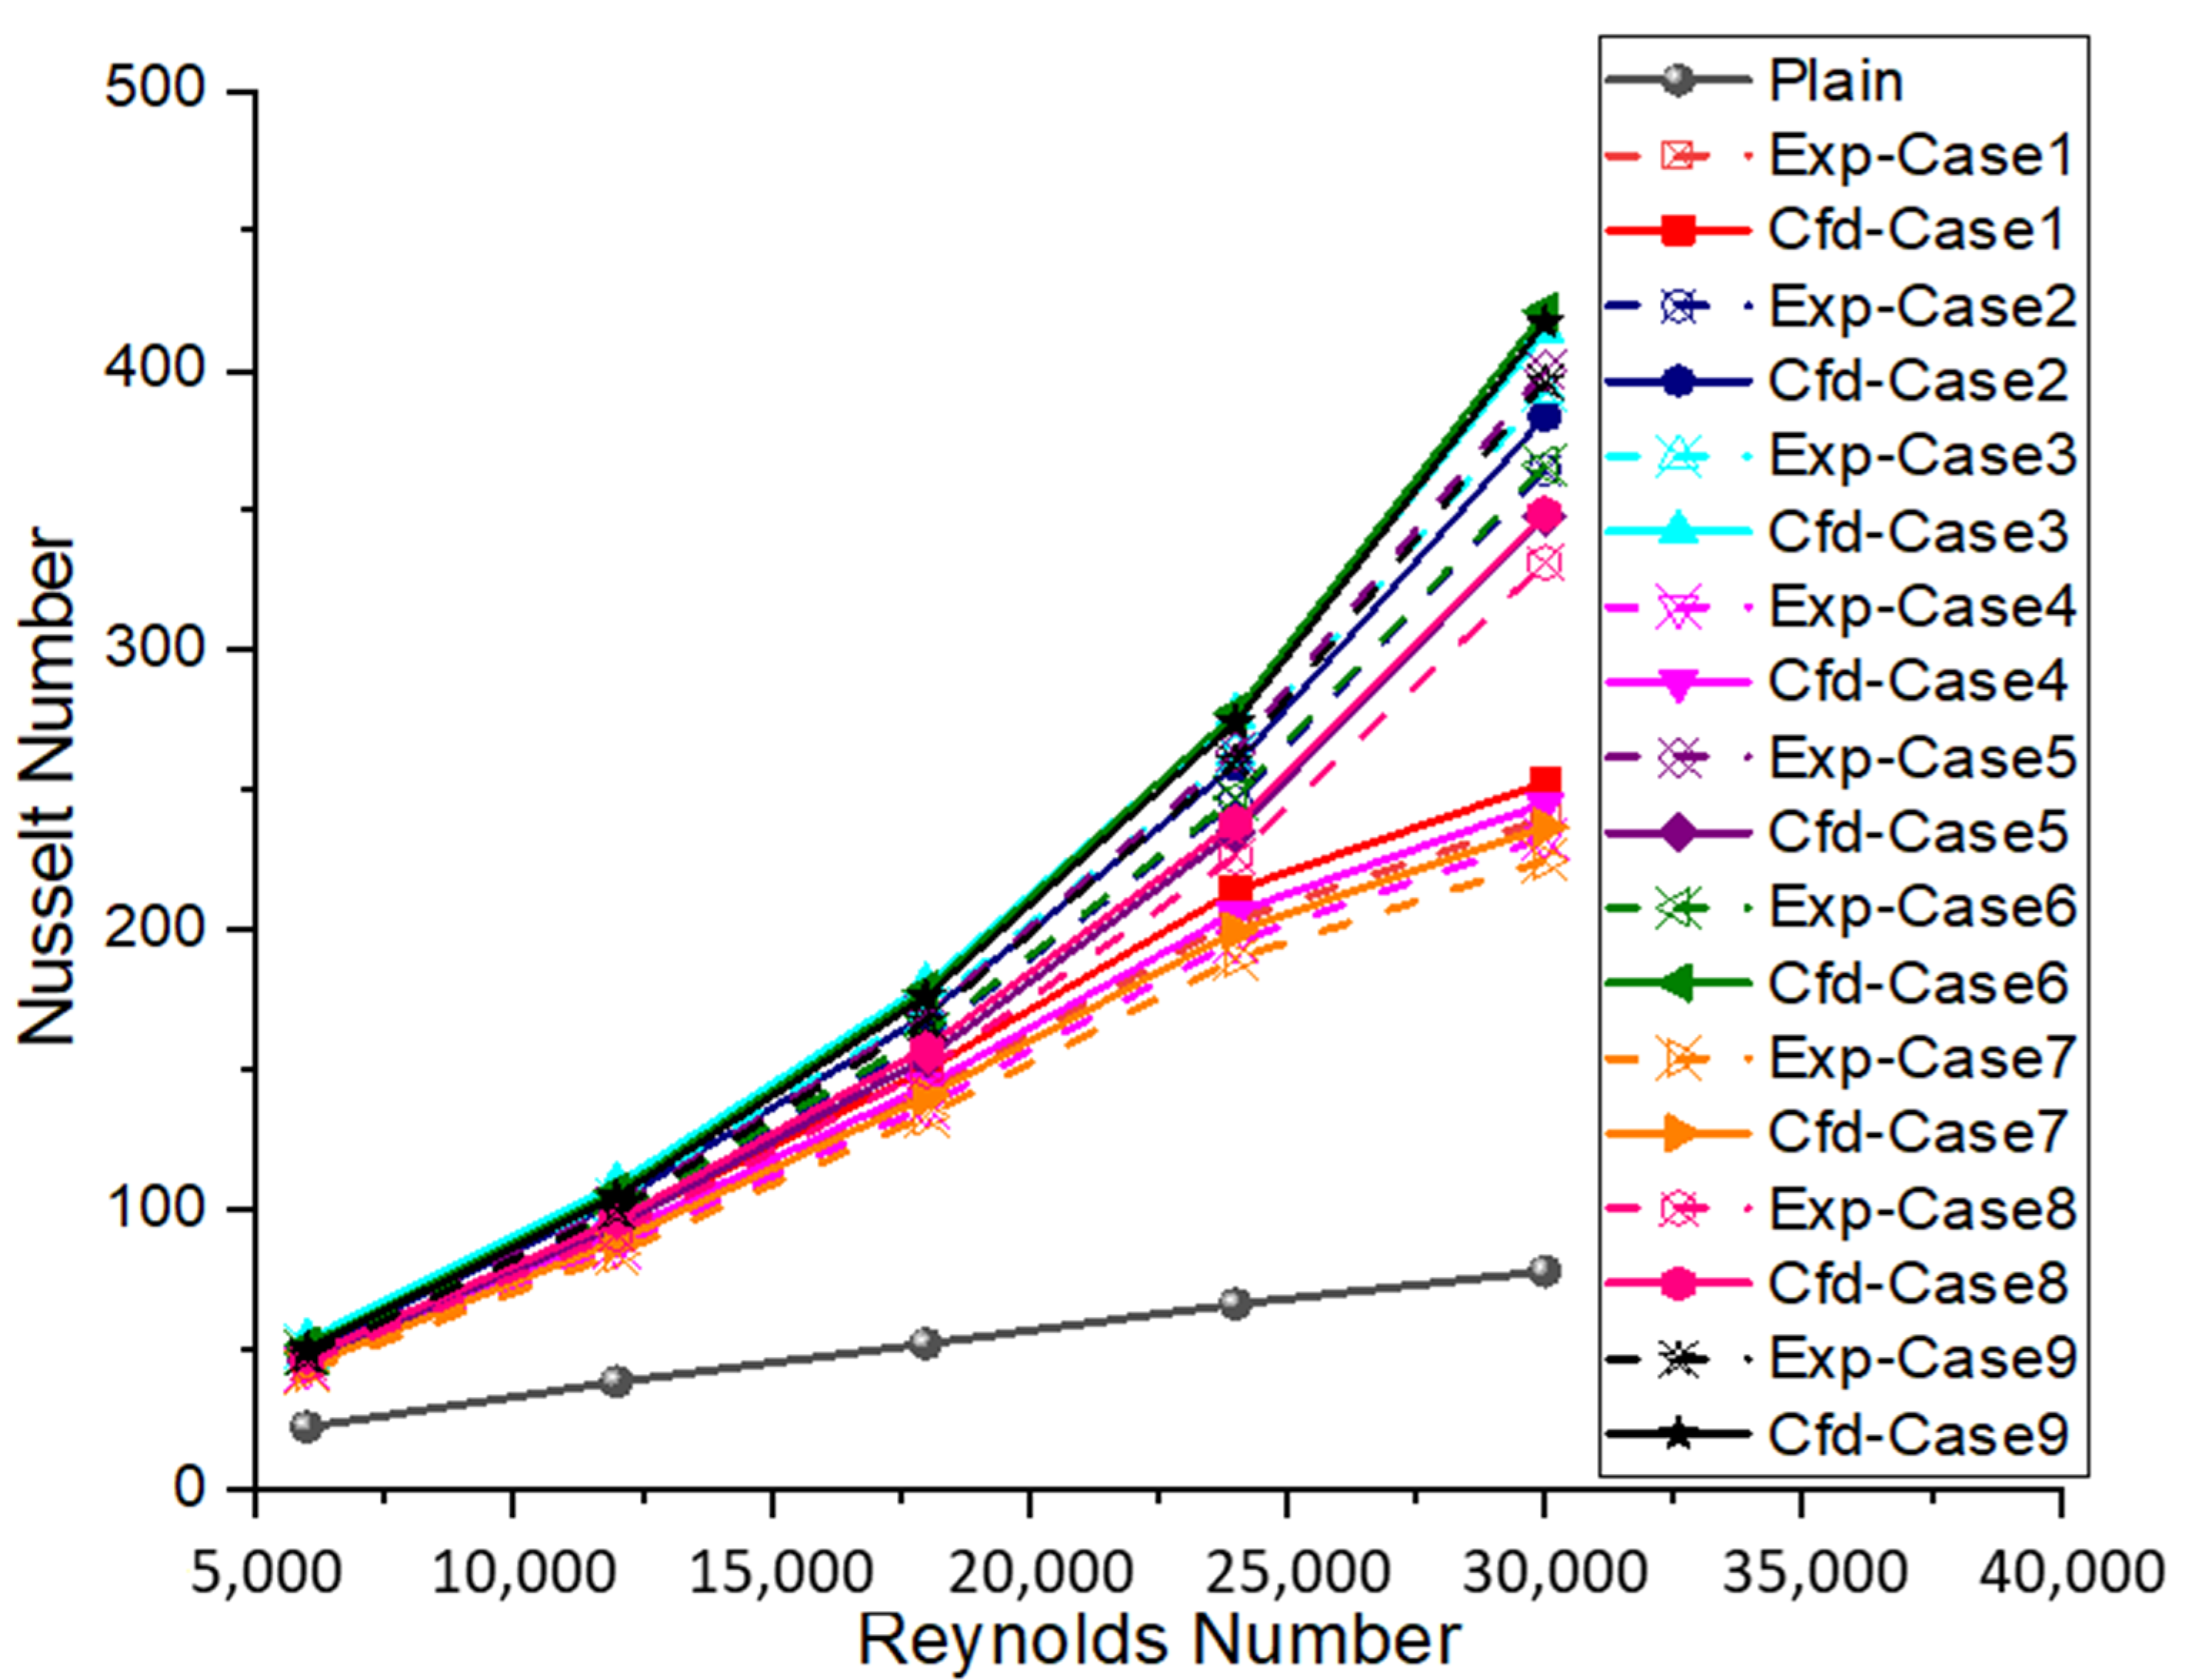
The Nusselt number variation for different cases is shown in
Figure 9. The numerical values were seen to be much higher for all the cases for the same condition when compared to the experimental values [
41,
42,
43]. Each case study was investigated for heat transmission rate in terms of Nusselt number and was compared to the plain tube; the highest Nusselt number was achieved by case studies 2 and 3 with pitch 30 mm and para inclination 15- and 20 degrees. The minimum value of the Nusselt number was observed in case study 7 with a pitch of 50 mm and a para inclination of 10 degrees.
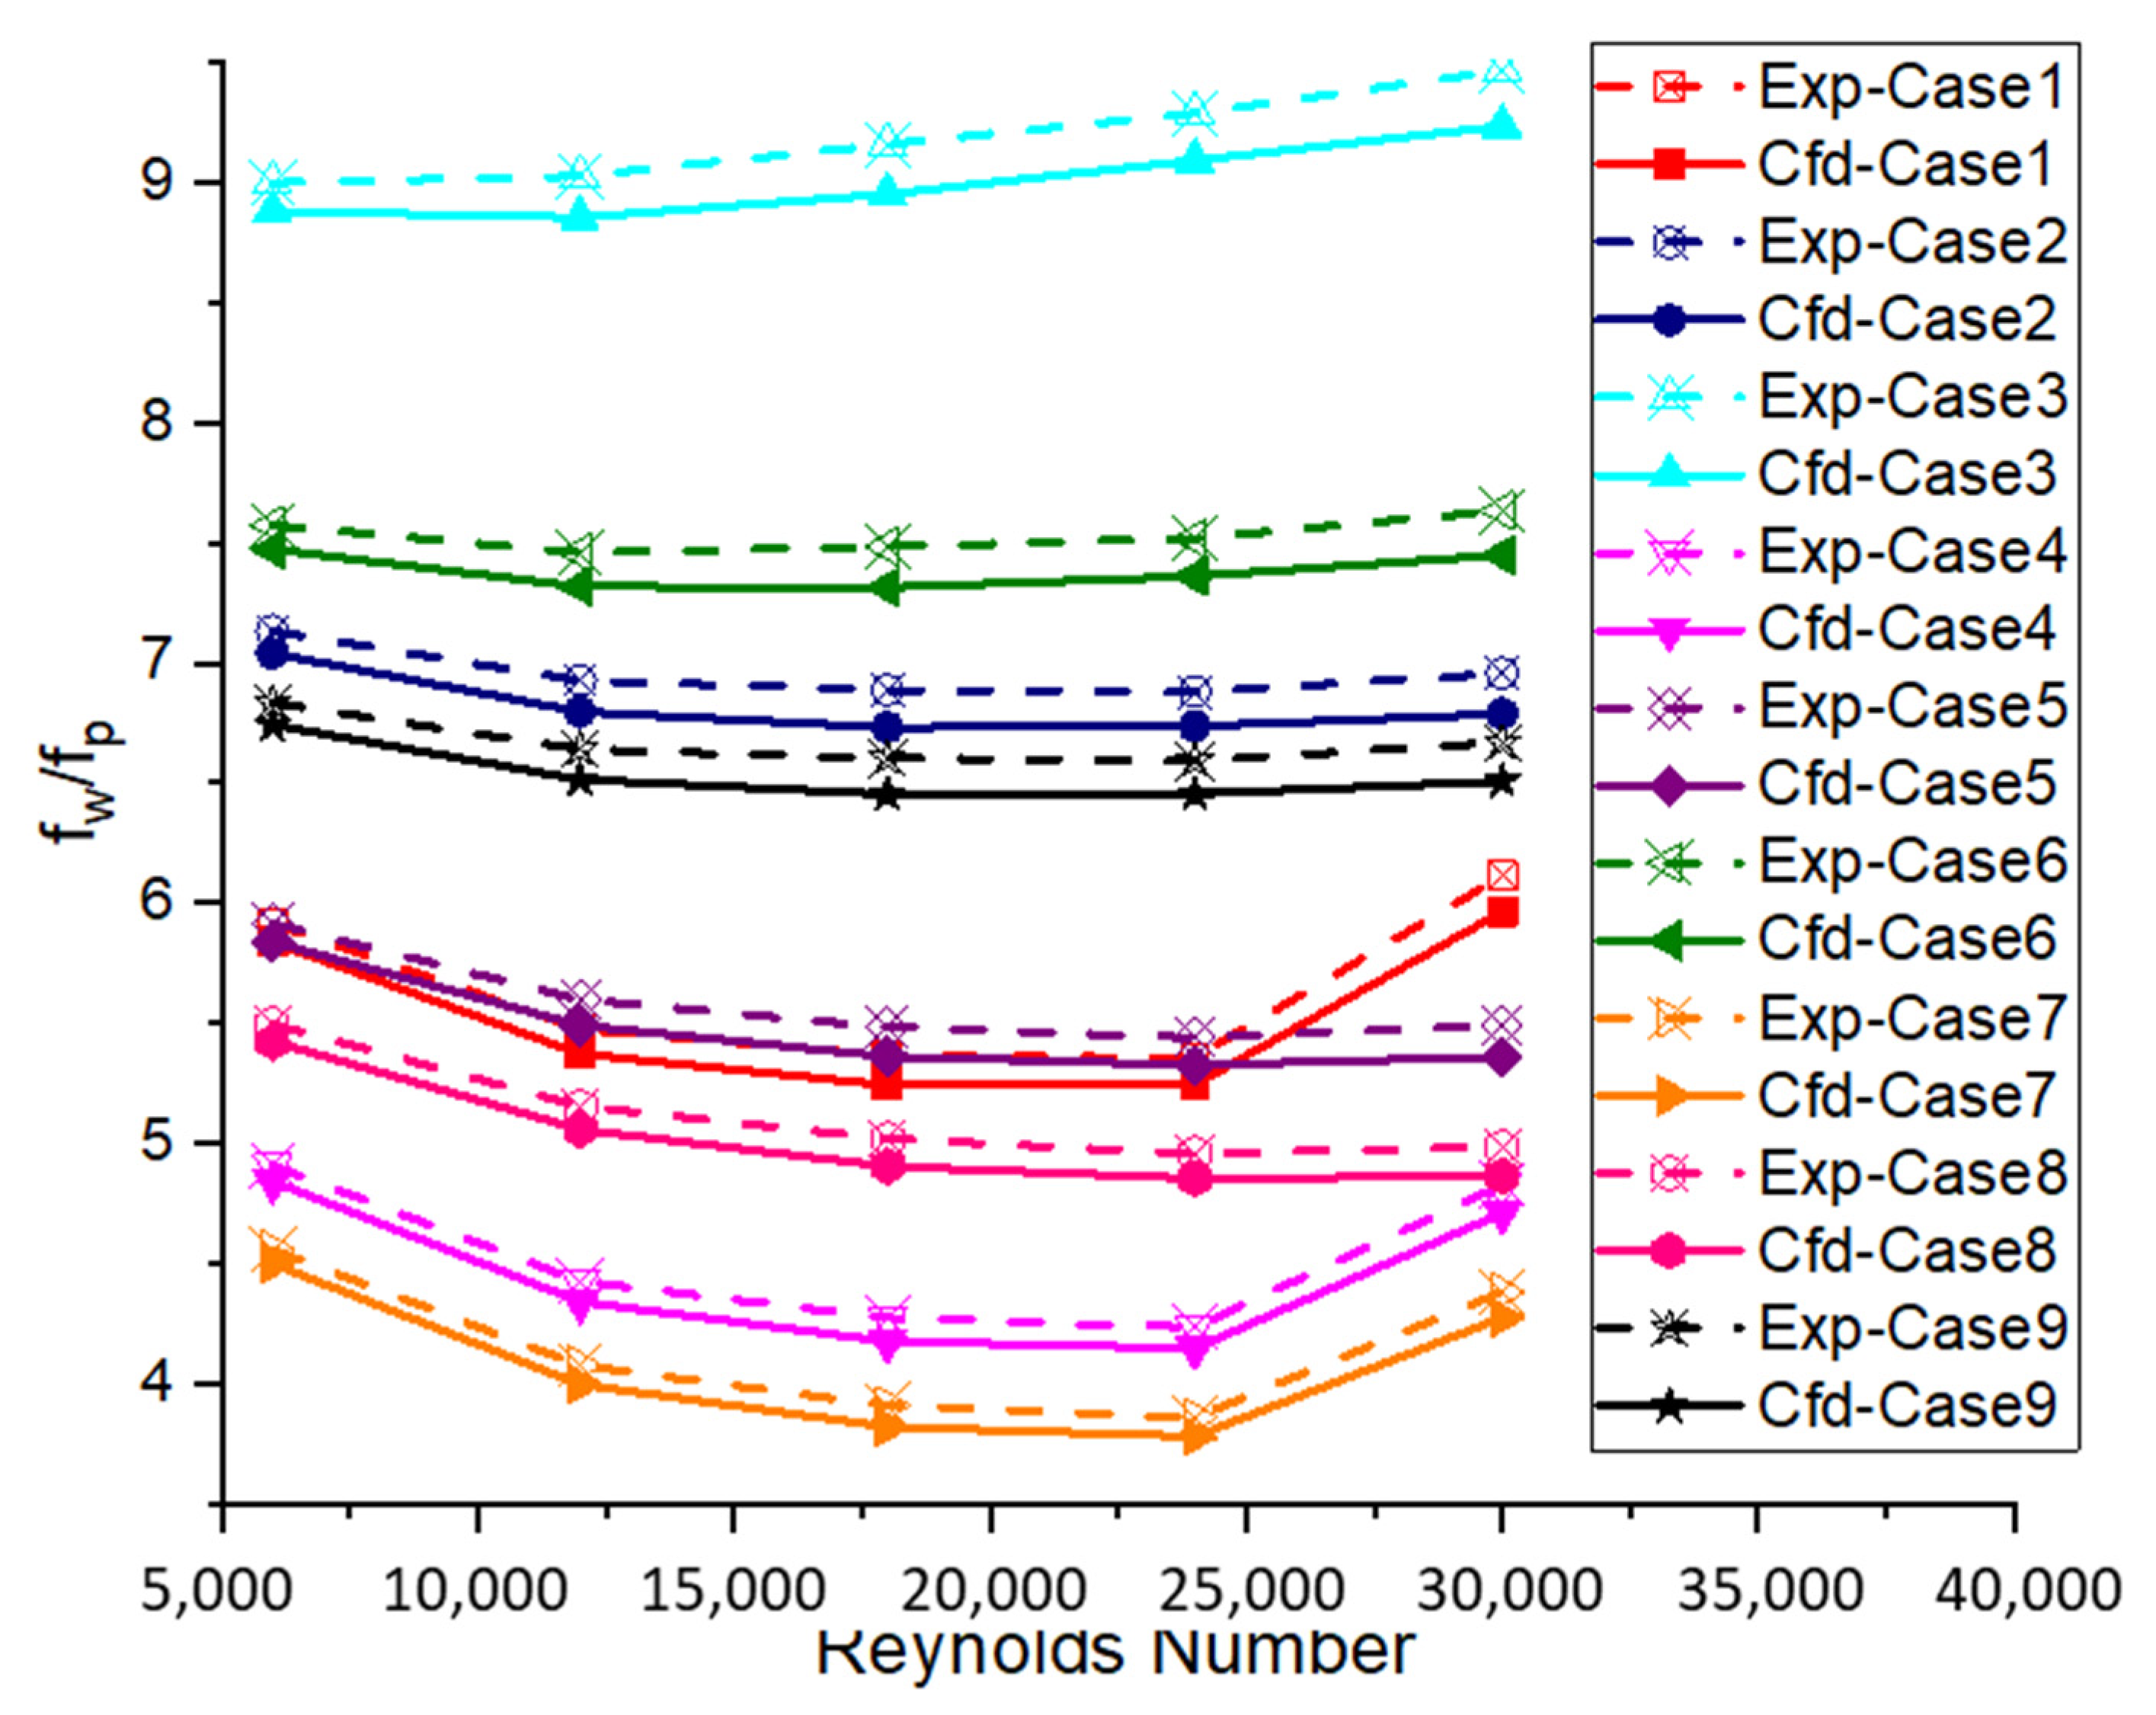
The value of Nu increases with the increase of Re, the turbulators with 15° and 20° inclinations have better augmentation over higher Re because of the development of local turbulence and recirculation to wider openings of inserts. The variation in 10° inclinations has reduced with Re 24,000 to 30,000. The variation of friction factors in different cases is shown in
Figure 10. The numerical values were seen to be much higher for all the cases for the same condition when contrasted with the experimental values [
44,
45,
46]. Every case study has an appreciation in the friction factor when compared to the plain tube but the highest was achieved by the case study with a pitch of 30 mm and a para inclination of 20 degrees (case 3). The minimum value of the friction factor was experienced by the case studies with a pitch of 50 mm and para inclination of 10 degrees (case 7). The friction factor is higher at low Re and further reduces as the Re increase, the friction factor reduces predominantly from Re 18,000 to 30,000 for a case study with 15° and 20° inclinations, which in turn optimizes Nu.
Figure 11 and
Figure 12 depict the ratio of Nusselt number and Friction factor variations with Reynolds number. Each case study’s percentage change in the Nusselt number and friction factor is compared to the plain tube. Reynolds number 30,000 with a para tilt of 20 degrees, the pitch of 40 mm and 50 mm, achieves the maximum Nusselt number ratio (cases 6 and 9). For Reynolds number 30,000, pitch 30 mm and para inclination 20 degrees (case 3), the highest friction factor ratio was achieved. The ratio of Nu increases with the Re, the highest value is attained for pitch 30 mm due to the placement of the maximum number of turbulators within the inner tube, and 20° inclinations due to a wider area of flow restriction which promotes better mixing and recirculation to have better heat transfer. The Nusselt number ratio reduces in those cases with para inclinations of 10° from 18,000 to 30,000 which signifies that, at a greater Reynolds number, para inclinations with 15° with 20° are much better due to local turbulence, and recirculation near the wall boundary.
The lowest value of the Nusselt number ratio is attained for Reynolds number 6000 for pitch 50 mm with para inclination 10 degrees (case 7). The lowest value of friction factor ratio is attained for Reynolds number 24,000 for pitch 50 mm with para inclination 10-degrees (case 7). The ratio of friction factor increases for 20° inclinations irrespective of pitch 30 mm, 40 mm, and 50 mm for Re. The larger pitch and smaller inclination provide the minimum friction factor ratio over Re. The friction factor ratio increases in the cases with para inclinations 10° from 18,000 to 30,000 which signifies that at a greater Reynolds number, para inclinations with 15° with 20° are much better due to better flow distribution over the flow area and streamline flow.
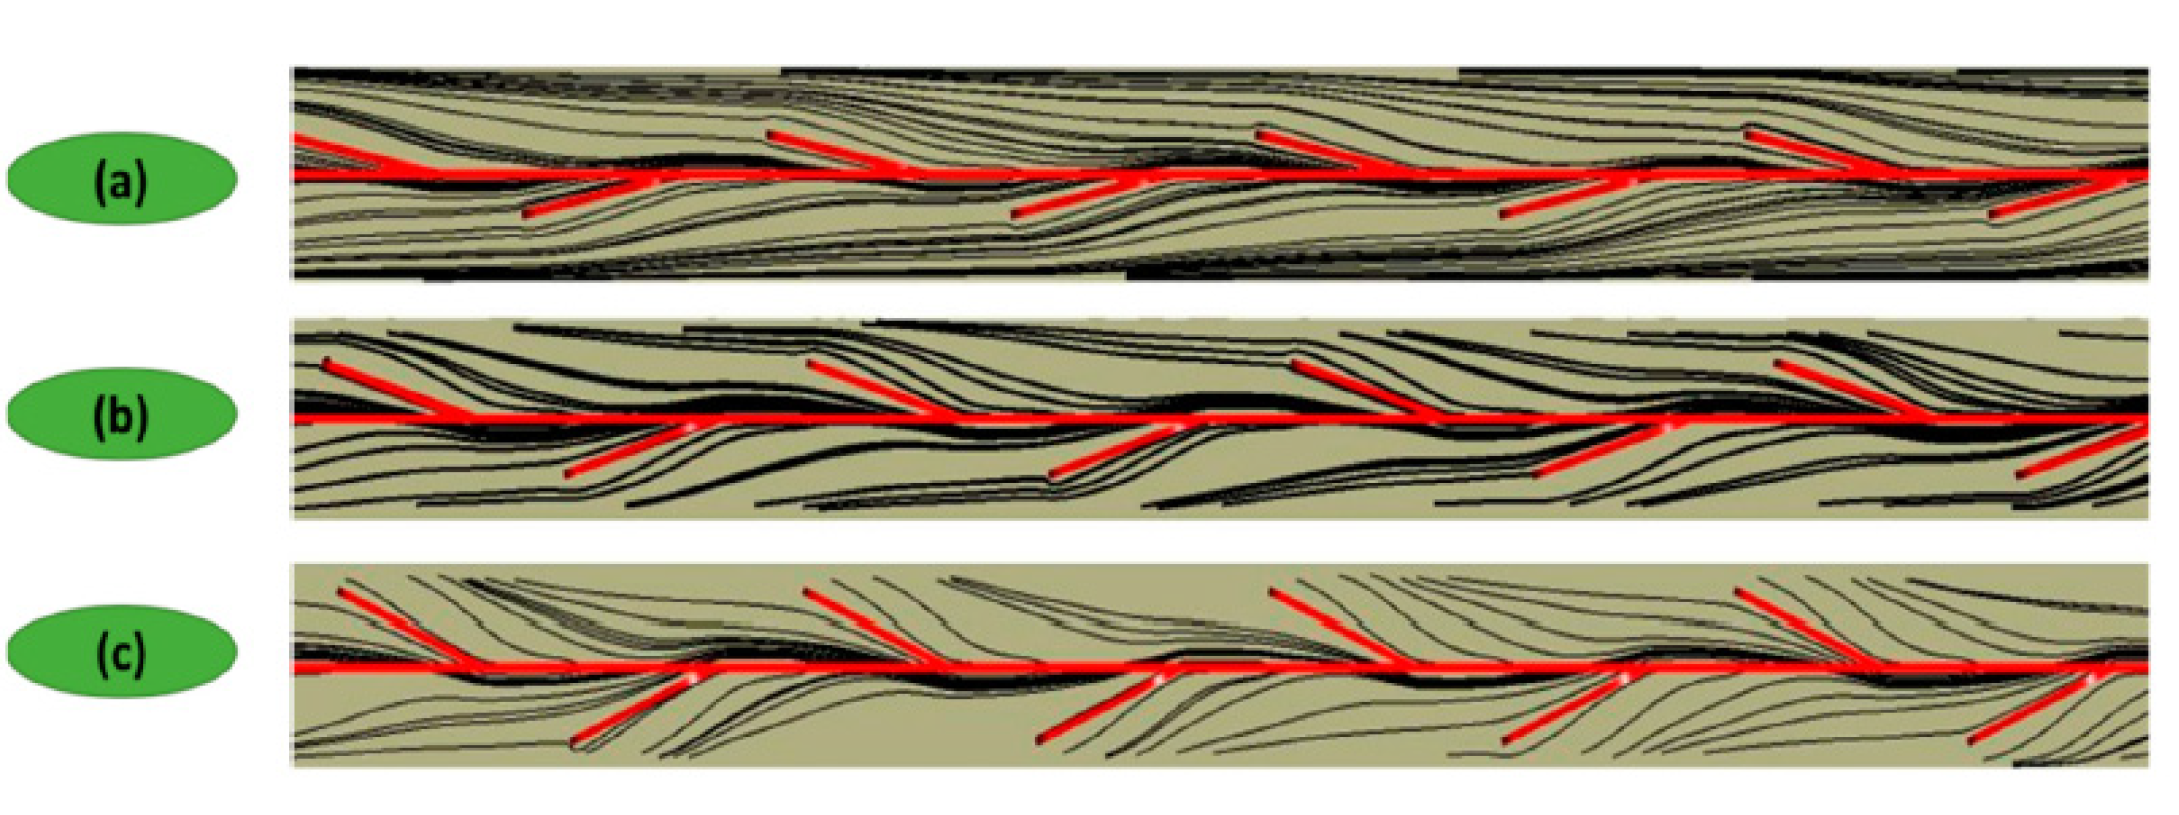
The streamlines of turbulent flow along the PWT for 10°, 15°, and 20° inclinations are shown in
Figure 13. The flow lines along PWT inserts represent that the higher the angle of inclination of PWT, the greater the distribution of flow near the wall. The flow at the center follows a zig-zag pattern, near the PWT the flow is distributed, and again at the wall they flow in a straight line.
The turbulent kinetic energy (TKE) variation in
Figure 14 at different inclinations of the PWT shows that due to the application of PWT the TKE intensity near the wall is enhanced and is higher for 20° inclinations. The PWT has created the perfect blend of flow regime with recirculation happening in the form of four quadrants as they pass through the ups and downs of PWT inserts [
47,
48,
49,
50]. The maximum TKE of 49.61 J/Kg was developed near the edges of the inserts and a minimum of 2.79 was below the insert opening region which creates the recirculation region.
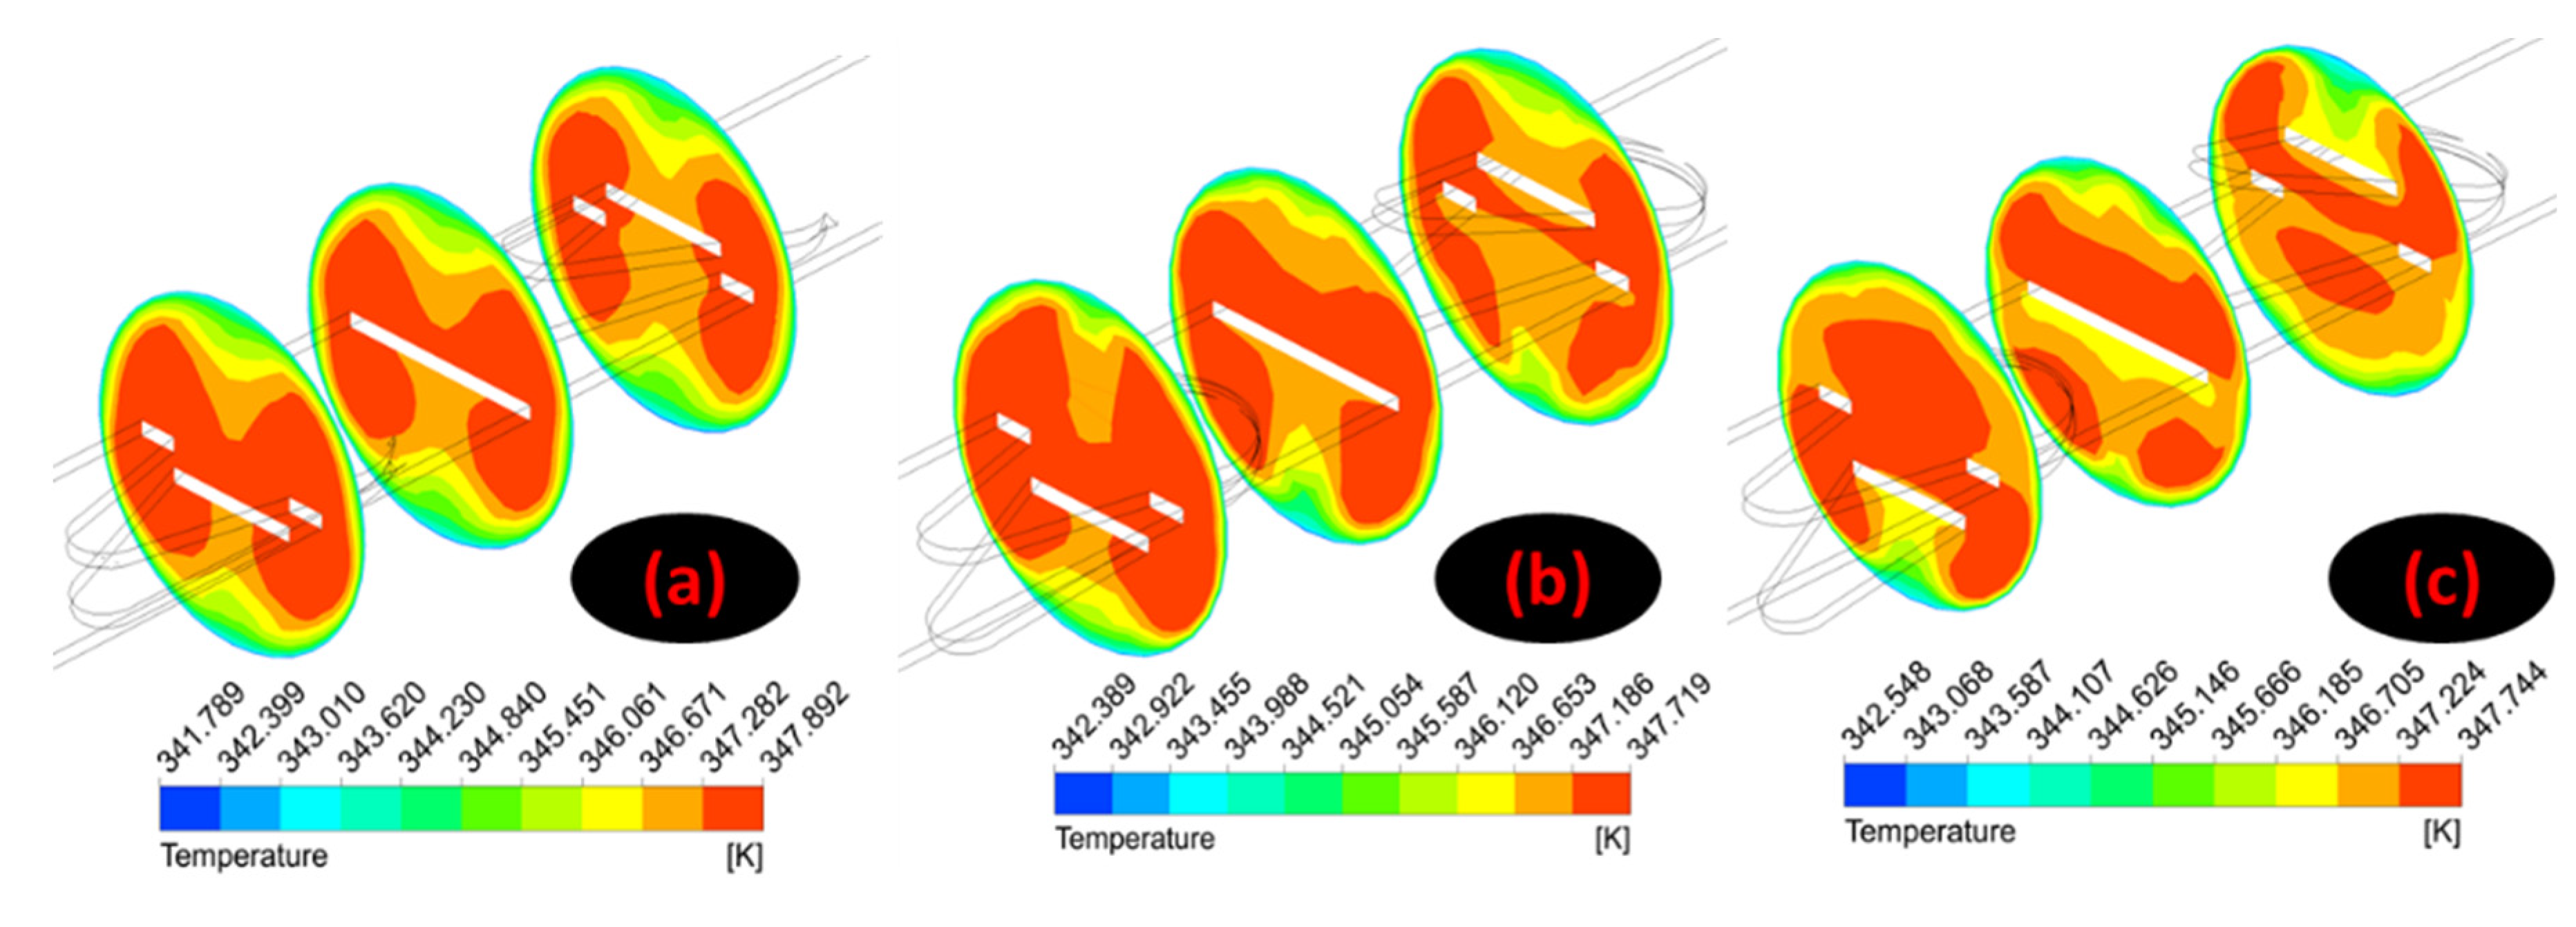
Figure 15 displays the temperature distribution along the plane x
1, x
2, and x
3 for various inclinations along 10°, 15°, and 20° for the PWT inserts. The temperature dissemination along the 20-degree PWT inserts was seen to be much more promising than others.
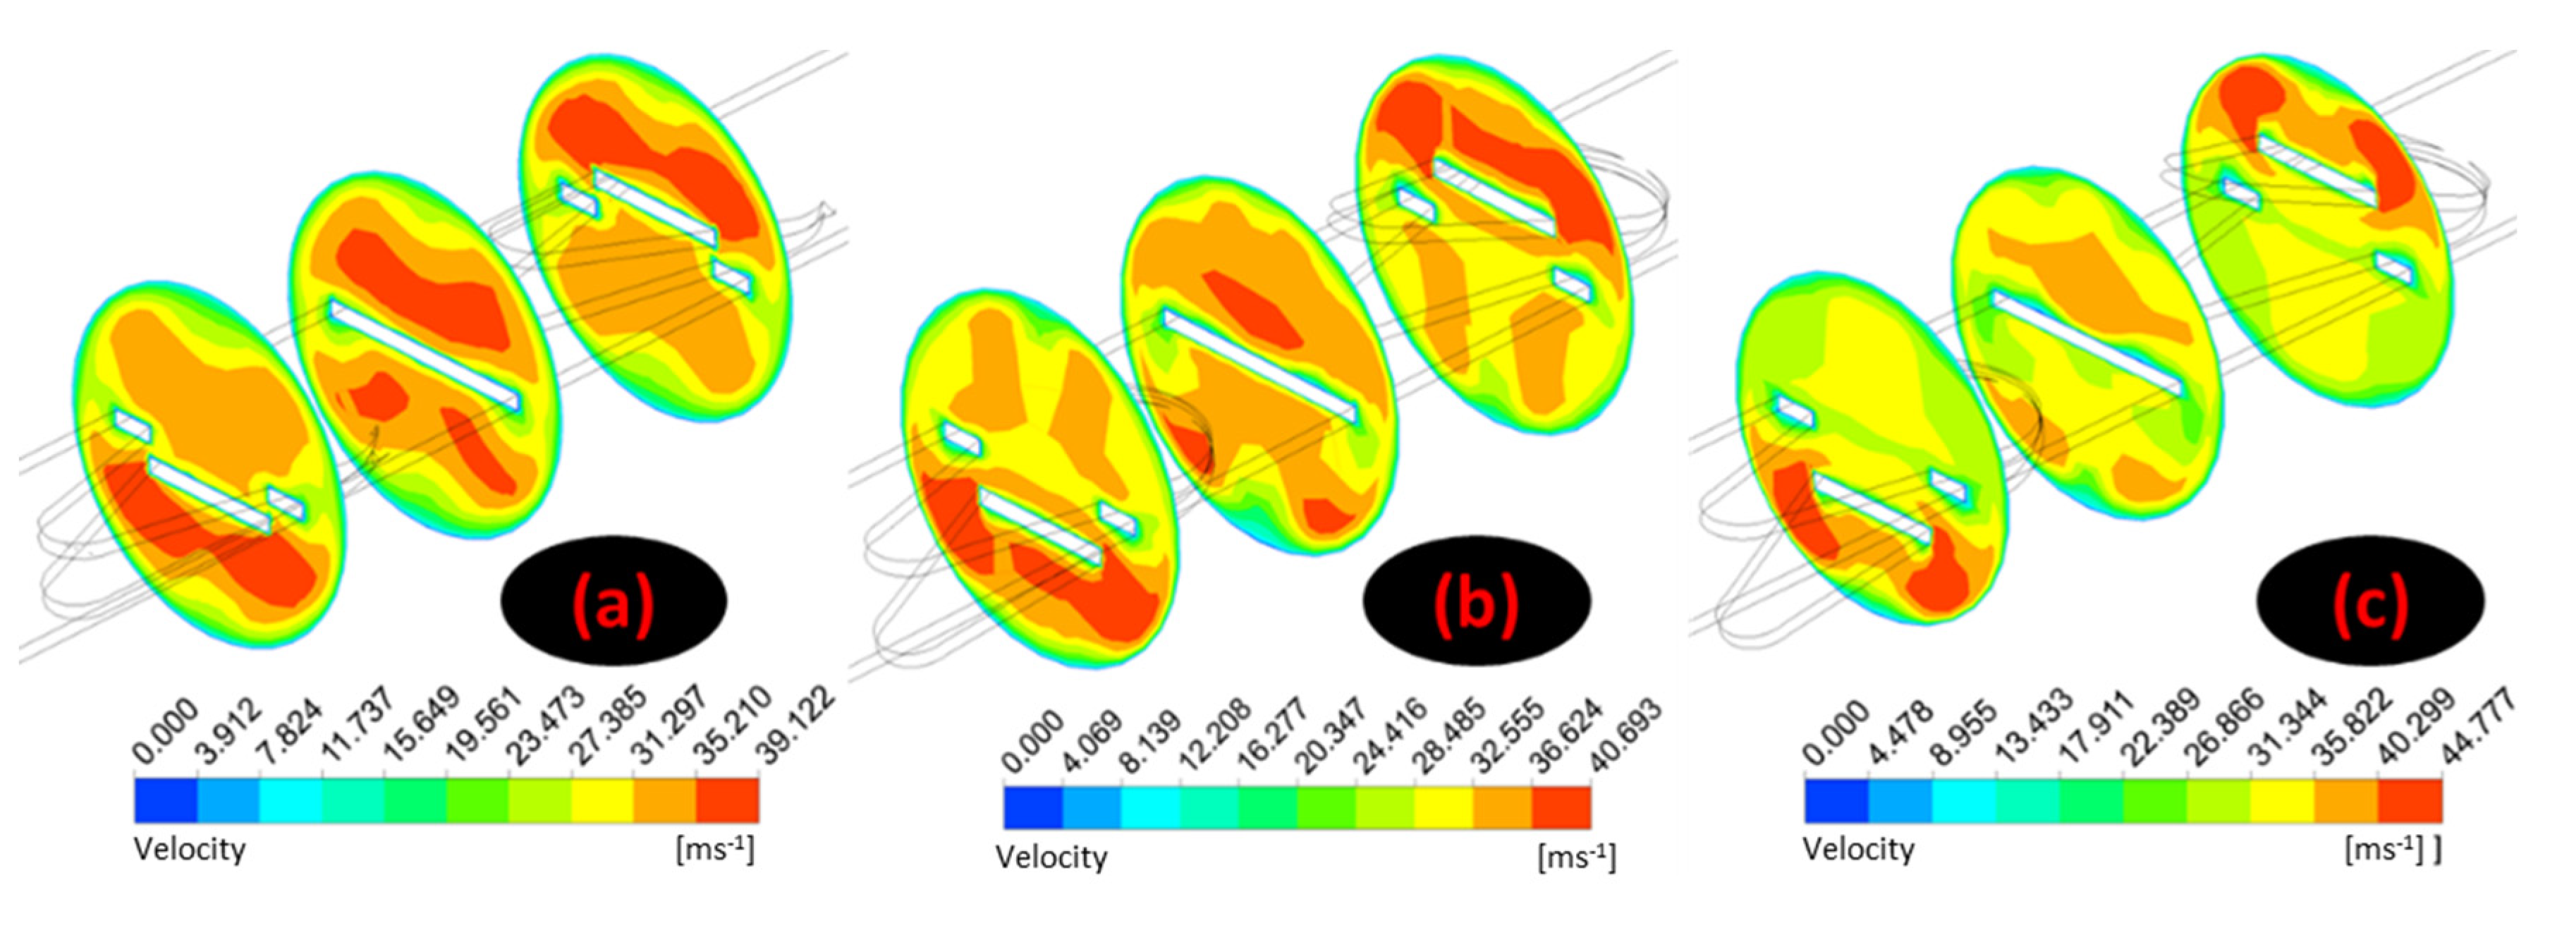
Figure 16 displays the velocity distribution along the x
1, x
2, and x
3 planes. For the same Reynolds number, the velocity in the case of 20° inclinations of the PWT inserts is shown to be very high when it comes to other cases [
51,
52,
53]. The highest velocity is obtained near the corners of the PWT inserts where the recirculation of the flow exits, which is better for mixing and recirculation. From the overall results of Nu, friction factor, TKE, and temperature contours it can be observed that for 20° inclination turbulators, the turbulence regions are widespread due to wider opening area against the flow, for wider openings, the TKE and temperature distribution reached towards the wall boundary layer thereby disturbing and creating better heat transmission along with the heat exchanger.
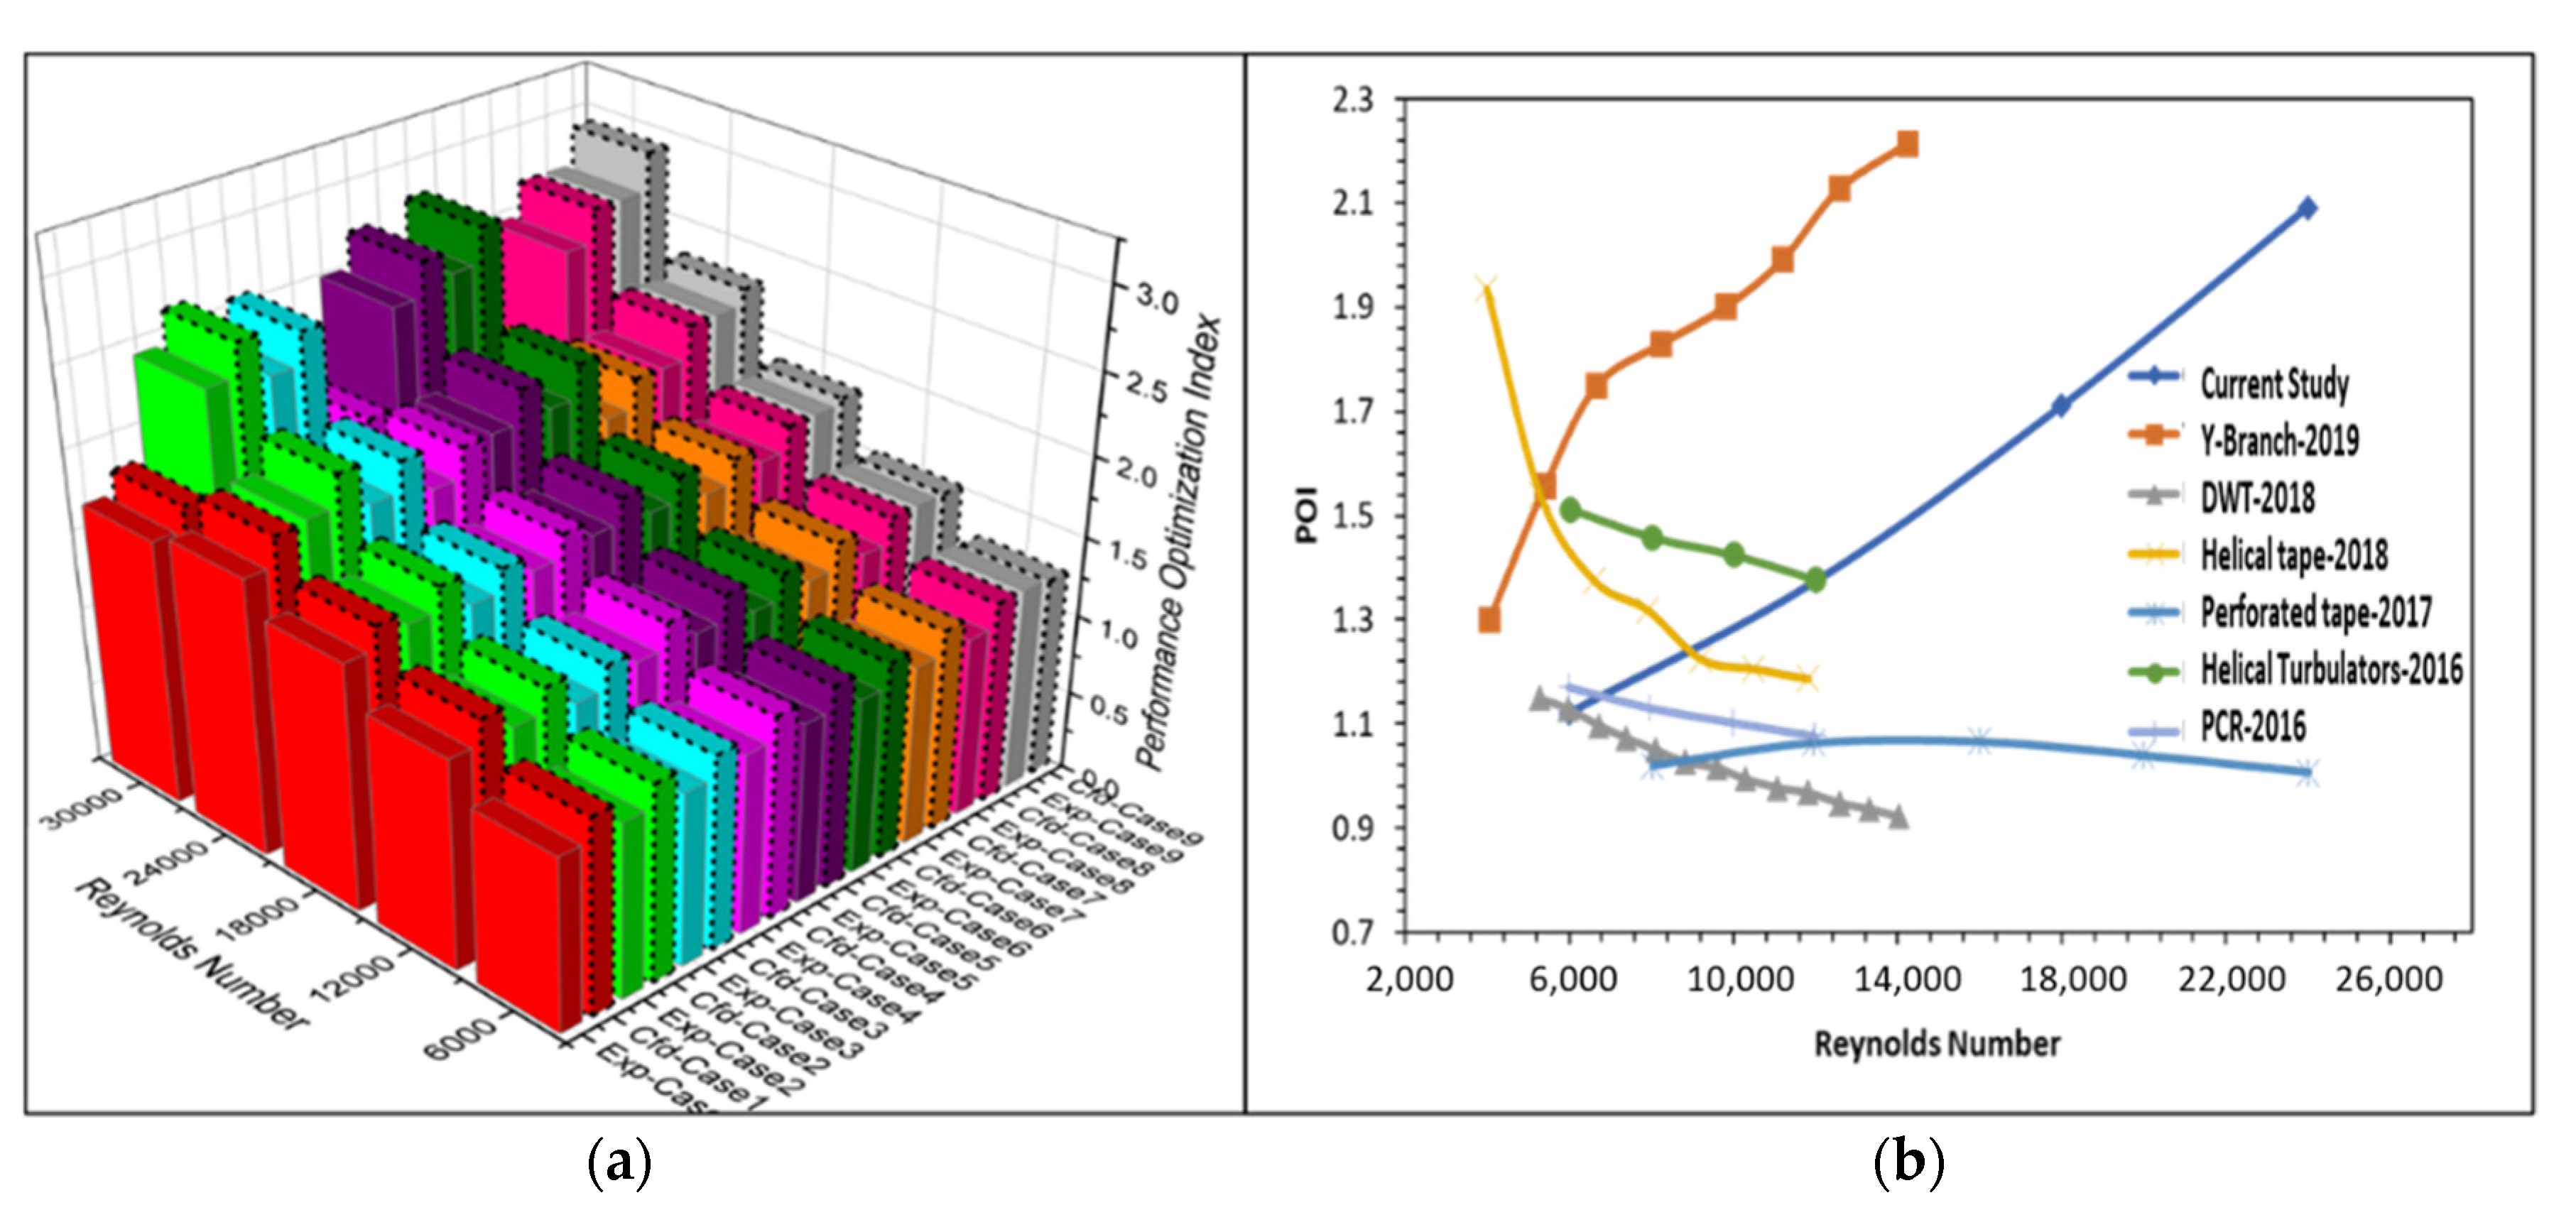
The performance optimization index (POI) is determined by the ratio of Nusselt number and friction factor.
Figure 17a shows the comparison values of POI concerning different case studies of the numerical and experimental studies. The obtained CFD results are within the range of 5% to 8% difference from the experimental values. The maximum POI value of 2.68 to 2.37 was determined experimentally for 20° inclinations from pitch 50 mm to 30 mm. Similarly, 2.91 to 2.57 was determined numerically [
53,
54,
55]. The minimum POI value of 1.76 to 1.68 was determined experimentally for 10° inclinations from pitch 50 mm to 30 mm. Similarly, 1.9 to 1.81 was determined numerically.
Finally, the POI shows the overall outcome of the different cases relating to the Reynolds number as displayed in
Figure 17a. The comparative study between various other inserts [
15,
16,
17,
18,
20,
21] to that of PWT is described in
Figure 17b for a better understanding of performance. PWT has good performance at a higher Reynolds number as compared to other inserts except for y-branch inserts.
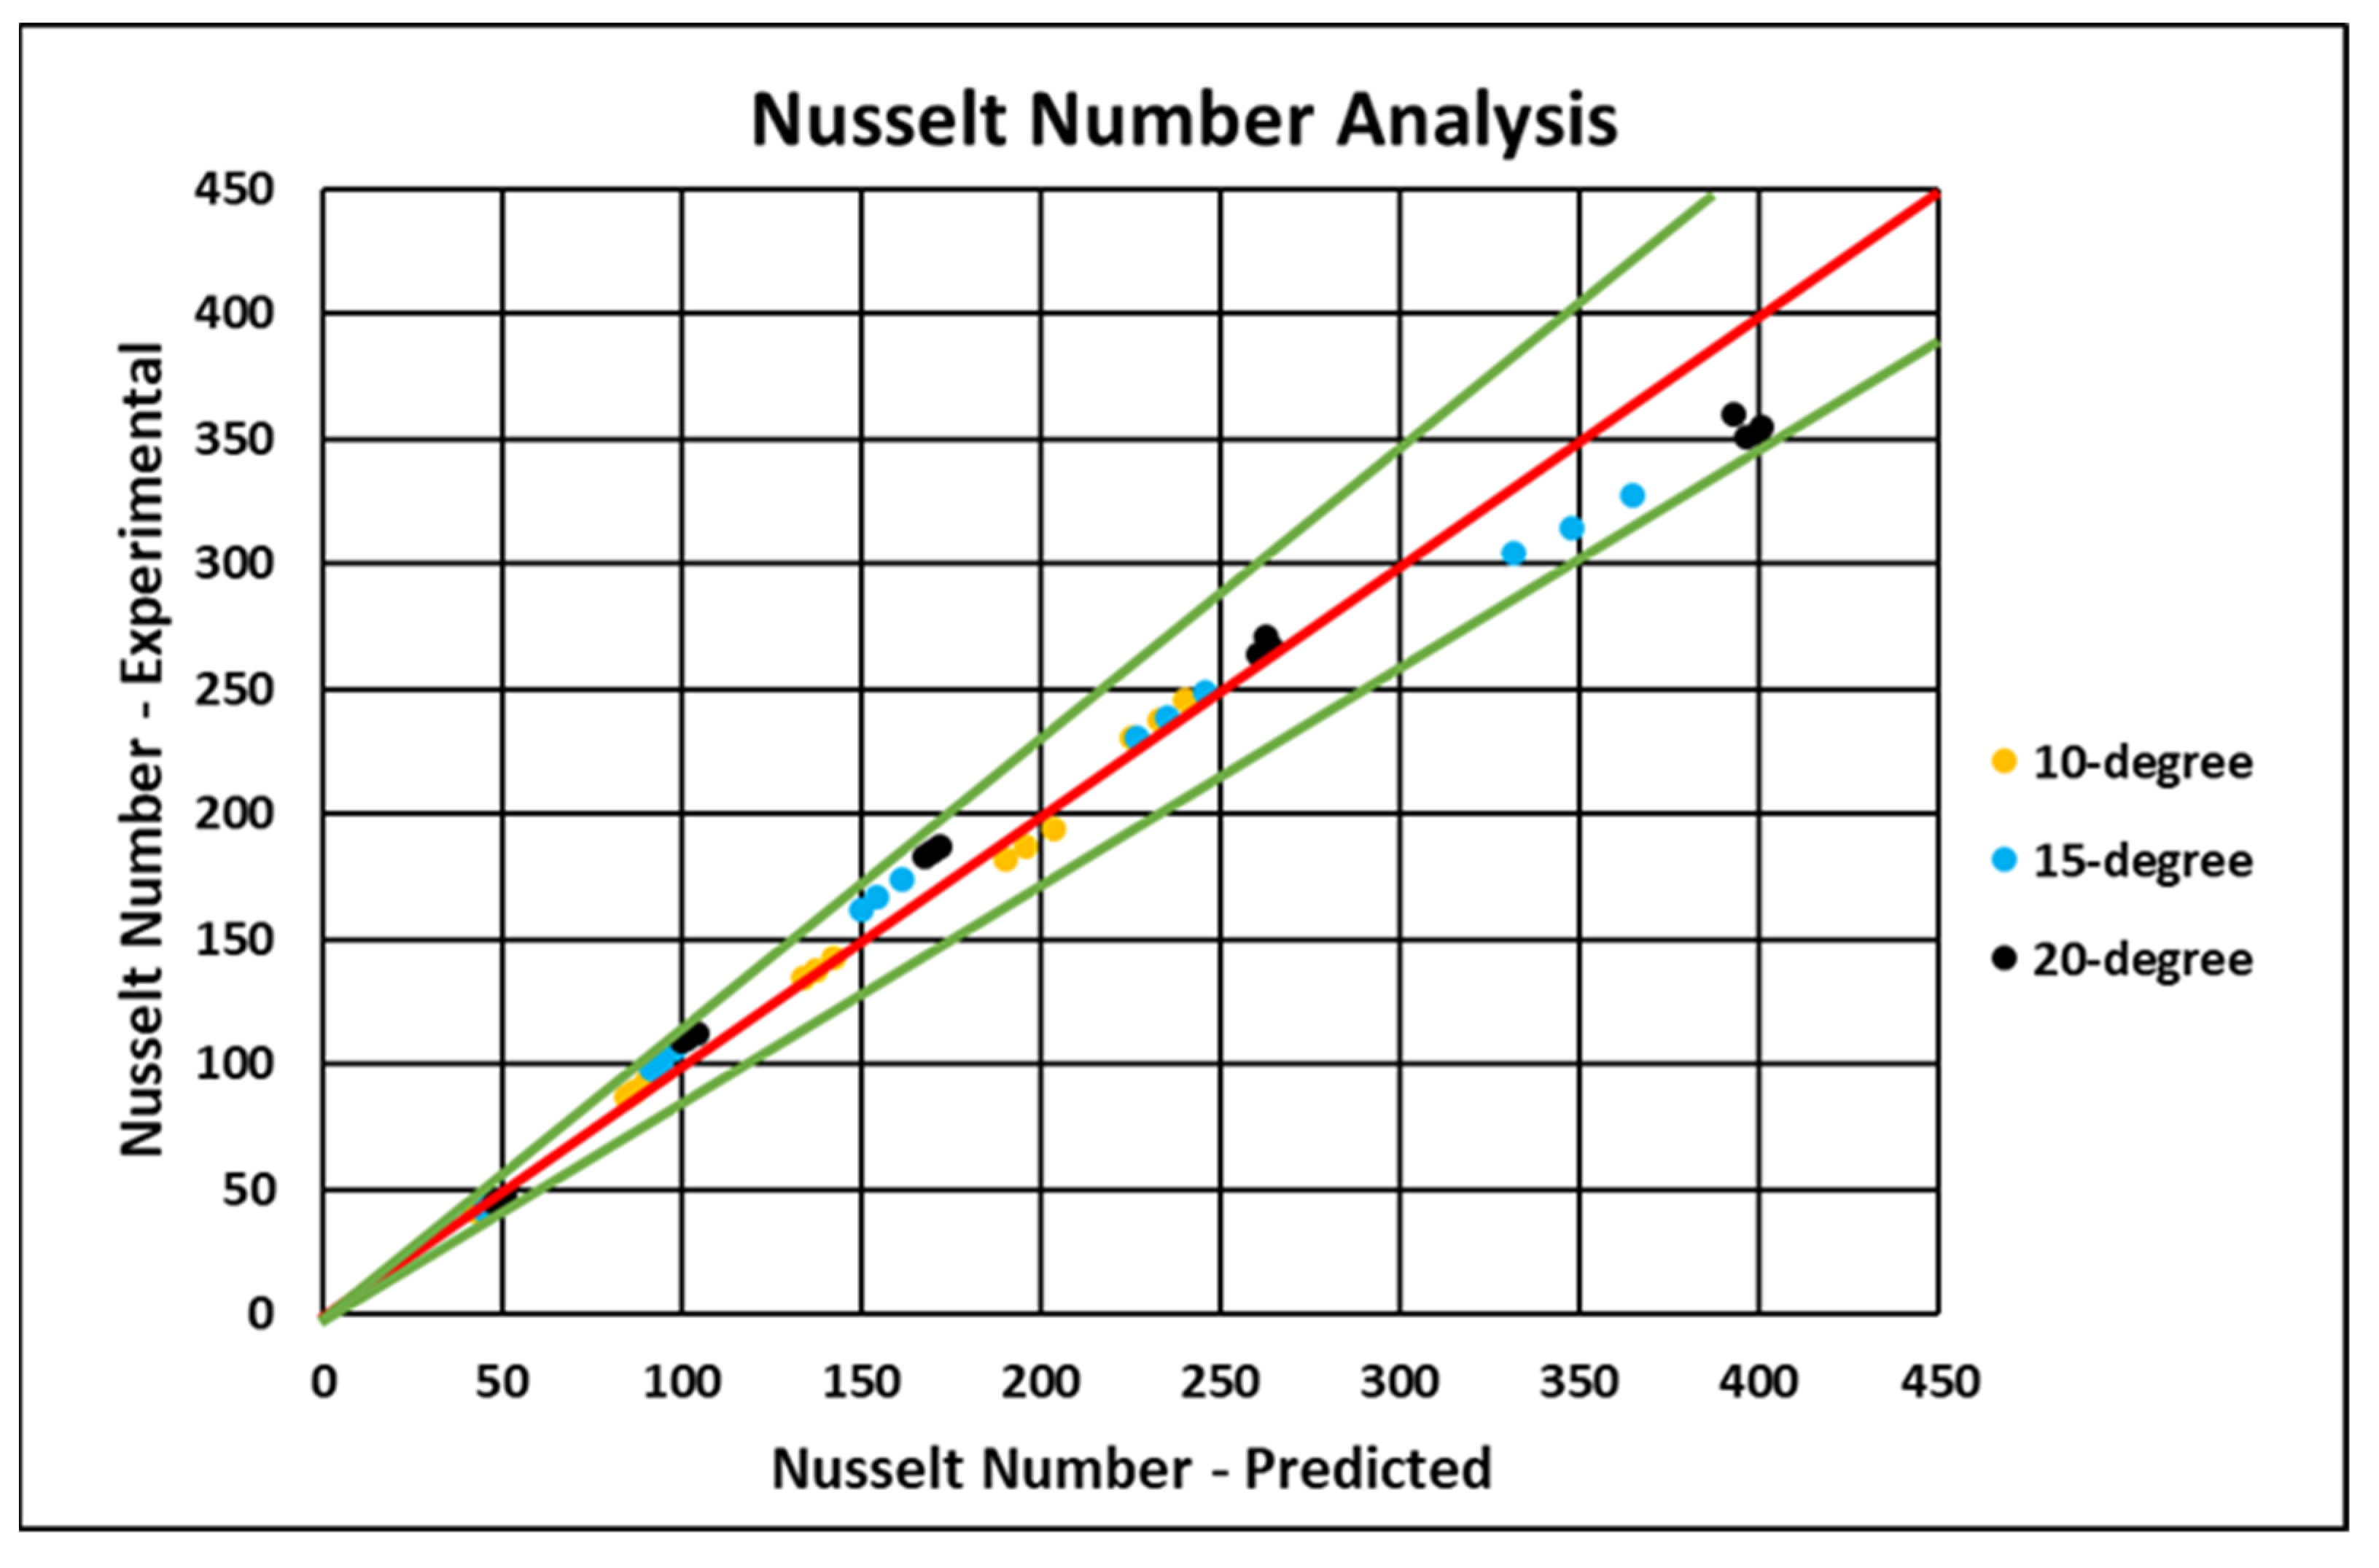
The model equation for Nusselt number and friction factor are derived from the Reynolds number and the ratio of tube inlet diameter to pitch of the insert (di/p) obtained from the test data [
29]. Three different di/p ratios were examined in this study: 1.62, 2.16, and 2.7. The relation between the observed and projected values of friction factor and Nusselt number is depicted in
Figure 18 and
Figure 19. The correlation of
f and
Nu was possible to forecast test values in the range of 6% and 10%, respectively, the constants are also determined and showcased in Equation (3). The performance of the correlations in terms R
2 = coefficient of multiple determination = 0.9944, Standard Error of the Estimate = 5.33, and Proportion of Variance = 99.52%. The constant values of the different case studies of the PWT are presented in
Table 7. Uncertainty analyses were carried out in the current investigation to understand the percentage of errors associated with the measuring instruments on various parameters. The analysis follows the procedure described by Kline et al. [
39] and Moffat et al. [
40]. The error range percentage for data reduction parameters is shown in
Table 8. The maximum variation was limited to 5.54% and the minimum was limited to 1.08%.


 ,
, 


