Article

A Comprehensive Analysis of Chinese, Japanese, Korean, US-PIMA Indian, and Trinidadian Screening Scores for Diabetes Risk Assessment and Prediction

by
Norma Latif Fitriyani
1,
Muhammad Syafrudin
2,*,
Siti Maghfirotul Ulyah
3,4,
Ganjar Alfian
5,
Syifa Latif Qolbiyani
6 and
Muhammad Anshari
7
1
Department of Data Science, Sejong University, Seoul 05006, Korea
2
Department of Artificial Intelligence, Sejong University, Seoul 05006, Korea
3
Department of Mathematics, Khalifa University, Abu Dhabi 127788, United Arab Emirates
4
Department of Mathematics, Airlangga University, Surabaya 60115, Indonesia
5
Department of Electrical Engineering and Informatics, Vocational College, Universitas Gadjah Mada, Yogyakarta 55281, Indonesia
6
Department of Community Development, Universitas Sebelas Maret, Surakarta 57126, Indonesia
7
School of Business & Economics, Universiti Brunei Darussalam, Bandar Seri Begawan BE1410, Brunei
*
Author to whom correspondence should be addressed.
Mathematics 2022, 10(21), 4027; https://doi.org/10.3390/math10214027
Submission received: 5 October 2022 / Revised: 23 October 2022 / Accepted: 28 October 2022 / Published: 30 October 2022

Abstract

:
Risk assessment and developing predictive models for diabetes prevention is considered an important task. Therefore, we proposed to analyze and provide a comprehensive analysis of the performance of diabetes screening scores for risk assessment and prediction in five populations: the Chinese, Japanese, Korean, US-PIMA Indian, and Trinidadian populations, utilizing statistical and machine learning (ML) methods. Additionally, due to the present COVID-19 epidemic, it is necessary to investigate how diabetes and COVID-19 are related to one another. Thus, by using a sample of the Korean population, the interrelationship between diabetes and COVID-19 was further investigated. The results revealed that by using a statistical method, the optimal cut points among Chinese, Japanese, Korean, US-PIMA Indian, and Trinidadian populations were 6.205 mmol/L (FPG), 5.523 mmol/L (FPG), and 5.375% (HbA1c), 150.50–106.50 mg/dL (FBS), 123.50 mg/dL (2hPG), and 107.50 mg/dL (FBG), respectively, with AUC scores of 0.97, 0.80, 0.78, 0.85, 0.79, and 0.905. The results also confirmed that diabetes has a significant relationship with COVID-19 in the Korean population (p-value 0.001), with an adjusted OR of 1.21. Finally, the overall best ML models were performed by Naïve Bayes with AUC scores of 0.736, 0.75, and 0.83 in the Japanese, Korean, and Trinidadian populations, respectively.
MSC:
62-07; 62G10; 62G15; 62H30; 62P10

1. Introduction

Disease risk assessment has become a major clinical focus in recent decades [1,2,3]. It is an essential method for the prevention of diseases such as diabetes, cardiovascular disease, and chronic kidney disease [4,5,6]. Aside from risk assessment, disease prediction model development is also a major area of attention in clinical research since it can help with disease prevention, early detection, and worst-case scenario prevention for people with disorders. In the last decade, most of the previous studies have used risk assessment and predictive models for diabetes prevention, considering that diabetes is one of the leading causes of worldwide mortality and morbidity [7,8,9], where the number of deaths is around 71% of all global deaths [10,11,12,13].
As the cost of medical diagnosis, tests, and treatment has been rising [14], several methods and strategies have been developed to help individuals more easily and cost effectively check their health status. According to the guidelines on the prevention of diabetes, risk assessment and prediction models are solutions that are recommended to be used for those diagnosed as having a high risk of developing diabetes, thus it could help them in preventing the risk of diabetes [15,16]. In recent years, statistical methods and machine learning methods have been successfully and widely used as solutions for diabetes screening programs to assess and predict the risk of diabetes, providing high predictive accuracy [7,8,14,15,16,17,18]. Therefore, in this study, we propose a comprehensive analysis of diabetes screening scores for risk assessment and prediction in numerous national populations by utilizing statistical methods including logistic regression for predictors in the models, and also machine learning (ML) models such as Gaussian Naive Bayes (GNB), logistic regression (LR), decision tree (DT), multi-layer perceptron (MLP), support vector machine (SVM), random forest (RF), extreme gradient boost (XGB), and ensemble learning with 10-folds cross-validation. A statistical method based on logistic regression was used to estimate the odds ratio (OR), 95% confidence interval (CI), and p-value for each predictor and outcome, along with the area under the receiver operating characteristic (ROC) curve (AUC). For diagnostic performance, we computed the percent (%) of participants who scored high for sensitivity, specificity, positive predictive value (PPV), negative predictive value (NPV), likelihood ratio positive/negative (LR+/−), Youden index, accuracy, and AUC, along with the ROC curve. For prediction models utilizing ML, several performance metrics including accuracy, precision, recall, f1, AUC, and ROC curves are used to assess the model’s performance. We utilized five diabetes publicly available datasets from several nations, including China, Japan, South Korea, the United States, and Trinidad. In addition, due to the present COVID-19 epidemic, it is imperative to look at how diabetes and COVID-19 are related to one another. Thus, in this study, using a sample of the Korean population, the interrelationship between diabetes and COVID-19 is investigated.
The organization of this paper is as follows. In Section 2, we present the related works in diabetes screening programs and diabetes prediction models. Section 3 presents the diabetes data collection and flowchart of the study. Section 4 presents the results of the study and discussion. Finally, in Section 5, the conclusion, limitations, and future challenges are provided.

2. Literature Review

Diabetes is a lifelong disorder that is categorized as a chronic disease caused by insufficient insulin production by the pancreas (type 1 diabetes) and inefficient insulin utilization by the body (type 2 diabetes). Several methods could be used to conduct diabetes screening. They are fasting plasma glucose (FPG) [19,20,21,22,23,24], hemoglobin A1C (HbA1C) [25,26,27,28], capillary fasting blood glucose (CBG) [16,29,30,31], venous plasma glucose (VPG) [32,33,34], and oral glucose tolerance test (OGTT) [22,23,35] which checks the 2-h plasma glucose (2hPG). Among these available diabetes screening or diagnostic tests, FPG, HbA1c, and OGTT are the most recommended and useful for population-based screening [36]. According to ADA and WHO recommendations, diabetes diagnosis based on FPG is carried out by checking blood glucose level after not having eaten or drunk anything other than water for at least 8 h before the test, and diabetes could be diagnosed when the blood glucose is larger than 126 mg/dL or larger than 7 mmol [36,37]. The blood glucose level of hemoglobin (HbA1c) is indicated as diabetes when the HbA1c is 6.5% or higher [36]. While using OGTT (blood glucose level after drinking the glucose syrup for 2 h before the test), diabetes is classified when the 2hPG is ≥200 mg/dL [36].
It is important to evaluate the diabetes screening scores as they could be used to assess the risk of diabetes and its prediction [25]. Blood glucose screening based on FPG, HbA1C, and 2hPG has been conducted by previous studies for predicting type 2 diabetes, impaired diabetes, and gestational diabetes using statistical methods. The assessment of the diabetes model could be carried out by measuring the sensitivity, specificity, positive predictive value (PPV), negative predictive value (NPV), likelihood ratio positive (LR+), likelihood ratio negative (LR−), Youden index, and AUC-ROC [16,38,39]. To find the optimal cut point for predicting diabetes, the Youden index is one of the most suitable and commonly used methods to find optimal cut points for each diabetes diagnostic variable. Statistical methods are the best method used to describe population characteristics [16]. Kianpour et al. [14], Meng et al. [16], Nomura et al. [25], and Katulanda et al. [22] analyzed the characteristics of American, Korean, Iranian, Sri Lankan, and Sweden populations for diabetes screening. Using logistic regression, Kianpour et al. [14], Meng et al. [16], Nomura et al. [25], and Katulanda et al. [22] revealed the significance of associations (assessed by OR, CI, and p-value) to see the association between risk factors and diabetes and kidney disease. To classify diabetes, FPG, HbA1c, and OGTT were utilized by Meng et al. [16], Nomura et al. [25], and Katulanda et al. [22] as diagnostic measures, while Kianpour et al. [14] utilized CBG and HbA1c as diagnostic measures for diabetes classification. The results showed that FPG, HbA1C, and OGTT are precise diagnostic measures used to predict diabetes. In revealing the optimal cut point which could improve the performance of diabetes prediction models, Meng et al. [16], Zafari et al. [40], Baek et al. [41], Xu et al. [42], and Schisterman et al. [43] applied the Youden index. Wu et al. [44] analyzed the diabetes scores in the Chinese population and found that by using the optimal cut point of FPG, the sensitivity increased by around 0.25%, and the specificity decreased by around 6% with an AUC of 0.93. Cai et al. [45] predicted diabetes based on the optimal cut point of nomogram in the Japanese (NAFLD) population. The results showed that the sensitivity was 77.49% and specificity was 72.36%, with an AUC of 0.811.
To strengthen the analysis of the diabetes prediction model, aside from statistical methods, analyzing the diabetes prediction model utilizing machine learning methods may become another considered solution. This method has been widely used for the classification and prediction of diabetes [40]. Numerous previous studies have developed and analyzed diabetes prediction models utilizing machine learning methods such as multi-layer perceptron (MLP) [46,47,48], logistic regression (LR) [16,49,50,51,52], K-neural networks (K-NN) [52,53,54], decision tree (DT) [55,56,57,58], Naïve Bayes (NB) [59,60,61,62,63], random forest (RF) [64,65,66,67,68,69], and extreme gradient boosting (XGB) [69,70,71,72]. Mohapatra et al. [47], Butt et al. [48], and Bani-Salameh et al. [52] utilized a machine learning-based approach for the classification, early-stage identification, and prediction of diabetes. The result of the analysis revealed that MLP outperforms other classifiers in predicting diabetes with an accuracy of 77% to 86%. Rajendra and Latifi [50] developed a diabetes prediction model utilizing LR combined with the ensemble technique—Max-voting and stacking. On the US-PIMA Indian diabetes dataset, the accuracy obtained was around 78% and on Vanderbilt diabetes dataset the accuracy obtained was 93%. In line with Rajendra and Latifi [50], Joshi et al. [51] revealed that the LR-based diabetes prediction model could predict type 2 diabetes for US-PIMA Indian diabetes dataset by up to 78.26%. Diabetes prediction using K-NN also showed good performance applied in US-PIMA Indian diabetes dataset which is conducted by Premamayudu et al. [54] and Sarker et al. [55]. The accuracy achieved 79% and the ROC achieved around 73%. Diabetes prediction based on decision tree and Naïve Bayes looked promising. To the results conducted by Posonia et al. [56] and Dwivedi et al. [58], the accuracy of the diabetes prediction model based on the decision tree model reached 95.8% and 91,2%, respectively. While the diabetes prediction model utilizing Naïve Bayes achieved 92% [57] and 89.9% [61]. Wang et al. [67] utilized random forest combined with SVM-SMOTE and two feature dimensionality reduction methods (logistic stepwise regression and LAASO) to classify the diabetes survey sample data with unbalanced categories and complex related factors. The results showed that the AUC improved by up to 94.80%. Finally, Li et al. [71] and Wang et al. [73] evaluated the prediction of type 2 diabetes risk and its effect on the XGBoost model. The results showed that the accuracy for [71] and [73] reached 81.20% and 89.09%, respectively. All the previous studies have proved that statistical and machine learning methods could be used for analyzing and predicting diabetes and its risk; therefore, in this study, we utilized both methods in analyzing and predicting the risk of diabetes.

3. Materials and Methods

3.1. Study Populations and Data Sources

In this study, all the study population and data sources were obtained from public diabetes and COVID-19 datasets. We evaluated and compared diabetes screening scores in China, Japan, Korea, the United States, and India, and then analyzed the interrelationship between diabetes and COVID-19 in Korean populations. The detailed study populations and data sources in this study are as follows.
The first study population and data source are from the Rich Healthcare Group in China, which included all medical records for participants who received a health check from 2010 to 2016 [73]. The total number of participants recruited for the study was 211,833, which consisted of 116,123 males and 95,710 females from Shanghai, Beijing, Nanjing, Suzhou, Shenzhen, Changzhou, Chengdu, Guangzhou, Hefei, Wuhan, and Nantong, aged from 20 to 99 years old.
The second study population and data source are from NAFLD in the Gifu Area, Longitudinal Analysis (NAGALA) data, which was based on a population-based longitudinal analysis of a medical examination program at Murakami Memorial Hospital (Gifu, Japan) [74]. The total number of participants was 15,464, ranging from 22 to 70 years old in Gifu, Japan.
The third study population and data source are from the National Health Insurance Sharing Services (NHISS) of Korea, which included all medical records of participants who received a health examination from 2013 to 2014 [6,75]. The participants recruited for the study were aged 20 years old or older, and came from 16 cities and provinces in Korea. The dataset consisted of 43,0335 males and 40,6839 females, which is 83,7174 participants in total.
The fourth study population and data source are from the National Institute of Diabetes and Digestive and Kidney Diseases, United States of America (USA) [76]. All the participants were Pima-Indian women, at least 21 years old and living near Phoenix, Arizona, in the USA. The total number of participants was 768, of which 500 tested negative and 267 tested positive for diabetes.
The fifth study population and data source are from random hospital records in Trinidad, located in the Caribbean [77,78]. The study consists of 121 participants (84 males and 75 females), which consist of 62% of East Indian ethnicity, 28% of African ethnicity, and 10% of mixed ethnicity. There are two groups in this study; the first group is the non-diabetes group (n = 50), and the second group is the diabetes group (n = 71).
The last study population and data source used in this study are from the Korean Center for Disease Control and Prevention (KCDC) COVID-19 dataset [79] which was collected from February to June 2020. The participants recruited for the study ranged from 10 to 70 years of age and came from 16 cities and provinces in Korea. The total number of participants was 5165. Due to missing values, the total number of participants became 3496, which consists of 1604 males and 1892 females. Using this data from the KCDC, COVID-19 cases in Korea could be identified. We followed the procedures from previous studies [80,81] in collecting the sample, conducting the experiment, and identifying it. We used the 3496 patients with COVID-19 diagnoses as the case group. A control group of COVID-19 patients was chosen using stratified random sampling. Based on gender and age (0–9, 10–19, 20–29, 30–39, 40–49, 50–59, 60–69, 70–79, and 80 or more), we used 1:5 matching to choose the control group, which is from the NHISS Korea diabetes dataset. A total of 17,480 subjects were chosen to make up the control group, and the final subject count was 20,976.

3.2. Proposed Study Design

This section explains the proposed study. The proposed study includes five primary goals, which are displayed in Figure 1. To accomplish those goals, we first collected the diabetes data, which are openly accessible and originate from many nations and ethnic groups, to be used as research samples. Once diabetes data were collected, the population characteristics were analyzed to summarize nationally representative samples. The summary of population characteristics was conducted by using descriptive statistics by measuring the mean and standard error. Furthermore, for the second goal, the diabetes risk factors of all national diabetes data were assessed. We used logistic regression to assess the diabetes risk factors and significant associations by measuring the OR, CI, and p-values. We assessed the risk factors of diabetes based on the World Health Organization (WHO) [82,83] and the Centers for Disease Control and Prevention (CDC) of the United States [84] guidelines, where the risk factors consisted of age, gender, BMI, hypertension, cholesterol, triglycerides, smoking, alcohol, physical activity or exercise, and family history of diabetes. To evaluate the association between risk factors and diabetes, the chi-squared test was employed; thus, the diabetes risk factors could be revealed [14,16,85]. Aside from looking into diabetes risk factors, this study looked into the relationship between risk factors and COVID-19, as well as the interrelationship between diabetes and COVID-19 [80,81], utilizing the Korean COVID-19 dataset. For the prediction of diabetes, the proposed study involves two methods. The first prediction method used is the logistic regression-based statistical method. The performance of diabetes and non-diabetes scores using the LR-based statistical method was then measured through the sensitivity, specificity, PPV, and NPV based on diagnostic characteristic cut points for the high-risk group, as well as measured through the AUC and ROC curve for the prediction measure. The Youden index-based cut points were utilized to reveal the optimal cut points used to classify high-risk groups, which were then compared with the results based on ADA and WHO diagnostic characteristic cut point recommendations. Finally, we used machine learning-based prediction methods, such as MLP, LR, KNN, DT, NB, RF, and XGB, combined with a 10-fold cross-validation technique to predict diabetes. All classifiers were subject to the 10-fold cross-validation, with the dataset divided into 10 equal parts. Nine of the portions were utilized for training, and the final portion was utilized for testing. We repeated that process 10 times while rotating the test set. Then, depending on the outcomes across iterations, we chose the performance metrics (precision, recall, f1, and accuracy) in the final phase. The performance of the prediction models across all those employed in this study was then evaluated.

3.3. Chi-Squared Test of Association

Using the Statistical Package for the Social Sciences (SPSS) version 25.0, a chi-squared test was utilized in this study to compare the categorical characteristics between the risk factors and diabetes for all population samples. The chi-squared test is a significant statistic and hypothesis testing method to examine independence across two categorical variables or to assess how well a sample fits the distribution of a known population (goodness of fit) [86,87]. The formula for calculating a chi-squared is as follows:
x 2 = i = 1 n ( O i E i ) 2 E i
where x 2 is chi-squared value, n represents the number of cells, O i is the observed value, and E i is expected value. A low value for chi-square represents a high correlation between two categorical variables (sets of data), while a large chi-squared value indicates there is no statistically significant difference between two categorical variables.

3.4. Model Evaluation

We used a confusion matrix to determine the performance of the statistical method-based and machine learning-based prediction models for diabetes. In this study, “diabetes” was defined as a positive event and “non-diabetes” was defined as a negative event. The confusion matrix for two classes was used to extract true positives (TP), true negatives (TN), false positives (FP), and false negatives (FN).
To measure the performance of the statistical method-based prediction model, we used sensitivity, specificity, PPV, NPV, and AUC, while for machine learning-based prediction models, we used accuracy, precision, recall, f1, and AUC. The performance of the classifier can be structured, arranged, and selected using a receiver operating characteristic (ROC) graph. The area under the ROC curve (AUC) measures how likely it is that the classifier would assign a randomly selected positive instance a higher score than a randomly selected negative case. The performance measurements were conducted using SPSS version 25.0 for statistical method-based prediction models, while the machine learning-based prediction models were all implemented in Python version 3.9.7 and Scikit-learn version 1.1.2.
The formulas for calculating sensitivity or recall, specificity, PPV or precision, NPV, f1, accuracy, and AUC [7,88] are as follows.
S e n s i t i v i t y   o r   R e c a l l = T P T P + F N ,
S p e c i f i c i t y = T N F P + T N ,
P P V   o r   P r e c i s i o n = T P T P + F P ,
N P V = T N F N + T N ,
F 1 = 2   ×   p r e c i s i o n   ×   r e c a l l p r e c i s i o n + r e c a l l ,
A c c u r a c y = T P + T N T P + F N + F P + T N .

4. Results and Discussions

4.1. Descriptive Statistics Analysis

As the objective of this research was to analyze as well as evaluate the performance of diabetes screening scores for various diabetes datasets from several countries, we gathered five diabetes datasets from populations of China, Japan, Korea, the US-Indian, and Trinidad. To analyze the sample of China, Japan, Korea, the US-PIMA Indian, and Trinidad populations, descriptive statistics based on intricate survey designs, such as mean with standard error and percentage, were used. In this study, we examined the demographic and health statistics of the nation, including mean age, gender, health conditions, lifestyle habits, and test results from medical examinations. Design feature weights and clusters were taken into consideration to accurately depict the population’s overall health statistics. We conducted the statistical analyses by following the analyses guidelines of the National Health and Nutrition Examination Survey (NHANES), as well as following previous studies [14,15,16,89,90,91].
The characteristics of the adult populations in China, Japan, Korea, the US-PIMA Indian, and Trinidad are displayed in Table 1. The number of populations is 211,833, 15,464, 837,174, 768, and 121, respectively. There are only three datasets with age and gender variables included among the five diabetes datasets included in this investigation. These datasets come from China, Japan, and US-PIMA Indian for age, and China, Japan, and Korea for gender. As shown in Table 1, the mean ages of the Chinese and Japanese populations are not significantly different, with the mean ages being 42.1 and 43.7. However, the US-PIMA Indian adult population is seen to have a much lower mean age compared to the Chinese and Japanese populations, with a mean age of 33.25 years. Something interesting was revealed by the BMI information. While the US-PIMA Indian has the lowest mean age, it has the highest mean BMI, followed by Trinidad with the obesity (30 ≤ BMI < 40) percentage of 48.70 and 30.58, respectively. Another interesting finding comes from the Trinidadian population. The mean SBP is seen as the highest among other countries’ populations, with a mean SBP of 145.12. This indicates that the Trinidadian population is categorized as having high blood pressure or hypertension according to WHO hypertension control guidelines [92]. On the other hand, the mean DBP is regarded as normal (DBP < 90 mmHg). In terms of related outcomes, the Trinidadian population scored the highest FPG (126.24), which indicates the presence of diabetes due to the level of FPG being greater than 125 mg/dL [36]. The HbA1c and OGTT test results are normal (HbA1c < 6.6% and 2hPG < 155 mg/dL) [36] in the Japanese and US-PIMA Indian populations. Not only in the FPG test result but the mean triglyceride was also recorded as high for the Trinidadian population compared to other national populations with a mean triglyceride score greater than 150 mg/dL. This high score is also followed by an LDL level where the mean is greater than 100 mg/dL. In contrast, the mean HDL is seen to be in the normal range. For ALT and AST tests conducted on Chinese and Japanese populations, the results reveal that there was no abnormality detected. Based on laboratory tests to determine whether diabetes is present, the prevalence of diabetes in the Chinese, Japanese, Korean, US-PIMA Indian, and Trinidadian populations were 1.97%, 2.41%, 11.53%, 34.90%, and 58.68%, respectively. The Trinidad diabetes result was recorded as the highest among other nations.

4.2. Diabetes Risk Factors and Significant Analysis

A second analysis was conducted in this study to assess the diabetes risk factors and significant associations based on OR, CI, and p-value. According to the diabetes guidelines of WHO [82,83] and the Centers for Disease Control and Prevention (CDC) of the United States [84], the risk factors of diabetes consist of age, gender, BMI, hypertension, cholesterol, triglycerides, smoking, alcohol, physical activity or exercise, and family history of diabetes. We defined diabetes risk factors using WHO and CDC guidelines and assessed their statistical significance of associations by calculating the odds ratio (OR), 95% confidence interval (CI), and p-value as described in [14,16,93,94]. Table 2 shows the OR, CI, and p-value of diabetes risk factors in a Chinese population sample. High OR scores are shown for ages over 45 years and BMI equal to or greater than 27.5 kg/m2. The scores showed that individuals older than 45 years have an 11.18-fold greater risk of having diabetes and individuals with a BMI equal to or greater than 27.5 kg/m2 have a 9.56-fold greater risk of having diabetes compared to normal individuals. A 2.91-fold and 3.83-fold greater risk of having diabetes are shown when the individual is 35–44 years of age and has a BMI of 23–27.4 kg/m2. Other risk factors, such as gender, cholesterol, and family history, were found to have a two times greater association with diabetes, whereas triglycerides, smoking, and alcohol had no strong association with OR scores less than 1. However, even though OR scores vary, all p-values of the risk factor are significant (p-values < 0.001). These scores indicate that age, gender, BMI, hypertension, cholesterol, triglycerides, smoking, alcohol, and family history of diabetes are strongly correlated with diabetes.
Similar to the Chinese population’s diabetes scores, the diabetes risk factors in the Japanese population are also shown to have a strong correlation with diabetes. As displayed in Table 3, high scores of OR are shown for ages over 45 years and BMI equal to or greater than 27.5 kg/m2 with a score of 4.53 and 8.78, respectively. Those scores indicate that individuals older than 45 years of age have a 4.53-fold greater risk of having diabetes and individuals with a BMI equal to or greater than 27.5 kg/m2 have an 8.78-fold greater risk of having diabetes compared to normal individuals. The striking difference is shown by triglyceride. While triglycerides are shown to not have a strong correlation with diabetes in a Chinese population sample, in a Japanese population sample, it shows a strong correlation with an OR score of 5.10. There were different findings in the relationship between age (between 35 and 44 years) and diabetes and also alcohol intake with diabetes. In a Japanese population sample, diabetes was not affected by age between 35 and 44 years, nor by alcohol, where p-values showed 0.230 and 0.534, respectively. The detailed scores of OR, CI, and p-value of diabetes risk factors in the Japanese population sample are displayed in Table 3.
Unlike the Chinese and Japanese diabetes datasets, the Korean diabetes dataset (NHIS), US-PIMA Indian, and Trinidadian diabetes datasets only consist of less than five risk factors or predictor attributes (see Table 4, Table 5 and Table 6). In the Korean population, four risk factors (e.g., gender, age, BMI, and hypertension) were used to evaluate the diabetes scores. As presented in Table 4, the gender results revealed that males and females are equally likely to have a risk of diabetes (OR = 1.11, p-value < 0.001). It is very surprising when age is used as the risk factor for diabetes in the Korean population. Individuals aged 45 years old or older have a 24 times higher risk of diabetes, which is more than 2 times higher than China and 6 times higher than Japan. According to OR scores for BMI, individuals with a BMI of between 23 to 27.4 kg/m2 and a BMI of 27.5 or higher have a two-fold and three-fold higher risk of diabetes than people with a normal BMI, with OR scores are 2.01 (p-value < 0.001) and 3.04 (p-value < 0.001), respectively. While the Chinese and Japanese populations with hypertension are around three times more likely to develop diabetes, the Korean adult population has a lower score at risk of diabetes with an OR score of 1.98 (p-value < 0.001). Interesting findings are shown on OR score age.
While the Chinese, Japanese, and Korean adults aged 45 years or older showed a higher possibility of being at risk of diabetes compared to individuals with an age between 35 and 44 years old, the US-PIMA Indian population showed a lower possibility of being at risk of diabetes, with an OR score for individuals aged 45 or older of 2.83 (p-value < 0.001) and 3.08 (p-value < 0.001) for individuals aged between 35 and 44. Surprisingly, the OR score for BMI equal to 30 or higher, leading all nations, showed that individuals with a BMI of equal to 30 or higher have a 10-fold greater risk of having diabetes than normal BMI individuals. However, the possibility of having diabetes for individuals with a BMI of between 25 and 30 kg/m2 is almost similar among Chinese, Japanese, and Korean adults (OR score = 3.45). For hypertension, the OR score is 1.68, which indicates a low risk of diabetes for individuals with hypertension compared to individuals with normal blood pressure. Even though US-PIMA Indian adults have the highest OR score for BMI among other nations and the overall sample, it showed the lowest OR score for hypertension. The p-values also showed that diabetes is not affected by hypertension or a BMI of between 25 to 30 kg/m2, which are 0.678 and 0.350, respectively. The detailed scores of OR, 95% CI, and p-value of diabetes risk factors in the US-PIMA Indian population sample are displayed in Table 5. Finally, the diabetes score of the Trinidadian population showed an OR score of 1.80 for a BMI of between 25 and 30 kg/m2 and 3.69 for a BMI of 30 kg/m2 or higher. The results also showed that hypertension, cholesterol, and triglyceride did not affect the diabetes risk where the OR scores were 1.99, 1.04, and 1.78, respectively. Based on the results of the p-values shown in Table 6, none of the risk factors (e.g., BMI, hypertension, cholesterol, triglyceride) of the Trinidadian population have a significant association with diabetes (p-values > 0.05), which means that diabetes could not be affected by those risk factors.
Table 7 shows the COVID-19 scores in the Korean population based on the occurrence of diabetes. According to the results when age is used as a predictor of being at risk of COVID-19, subjects with diabetes aged younger than 20 years old has the highest risk of being infected, which is 8.69 times higher (OR, 8.69; 95% CI, 2.53–29.91) than subjects without diabetes in the same age. Subjects aged 60 to 69 years old with diabetes also have a high risk of COVID-19 compared to normal subjects of the same age (OR, 5.18; 95% CI, 4.10–6.55). While sex is used as a predictor for COVID-19 among subjects with diabetes, males and females with diabetes have a slightly higher risk of COVID-19 compared to normal 1.16 times risk of COVID-19 diabetes (OR, 1.16; 95% CI, 1.20–1.33 for male and OR, 1.28; 95% CI, 1.12–1.47 for female). Furthermore, while all the subjects with diabetes compared to the subjects without diabetes, the adjusted OR showed a slightly higher possibility of being at risk of COVID-19, with the adjusted OR score being 1.21 (95% CI, 1.10–1.34). These findings were in accordance with previous studies [80,81], with the adjusted OR scores not much different from one to another. In this study, we found that all the diabetes-COVID19 scores showed statistically significant (p-value < 0.001), whereas the same finding within [81] even though using a different dataset. Thus, it indicates that age, gender, and diabetes are associated with and related to COVID-19 in the Korean population.
As presented in Table 8, screening for diabetes was conducted based on FPG/FBG/FBS, HbA1C, and 2-h plasma glucose (2hPG) as diagnostic measures. The optimal Youden index values were used as cut points for diagnosis of diabetes, measuring sensitivity, specificity, positive predictive value (PPV), negative predictive value (NPV), likelihood ratio positive (LR+), likelihood ratio negative (LR−), area under the curve (AUC), and receiver operating characteristic (ROC) curve [14,16,93,94]. In the five models, the results showed sensitivity from 46.26% to 85.31%, specificity from 74.20% to 100%, PPV from 7.97% to 100%, and NPV from 67.12% to 99.37%. For prediction measured by AUC, the results showed that the models on Chinese, Japanese, Korean, US-PIMA Indian, and Trinidadian adult population samples performed robust measures with an AUC of 0.97, 0.80 (based on FPG), and 0.78 (based on HbA1c), 0.85, 0.79, and 0.905, respectively.
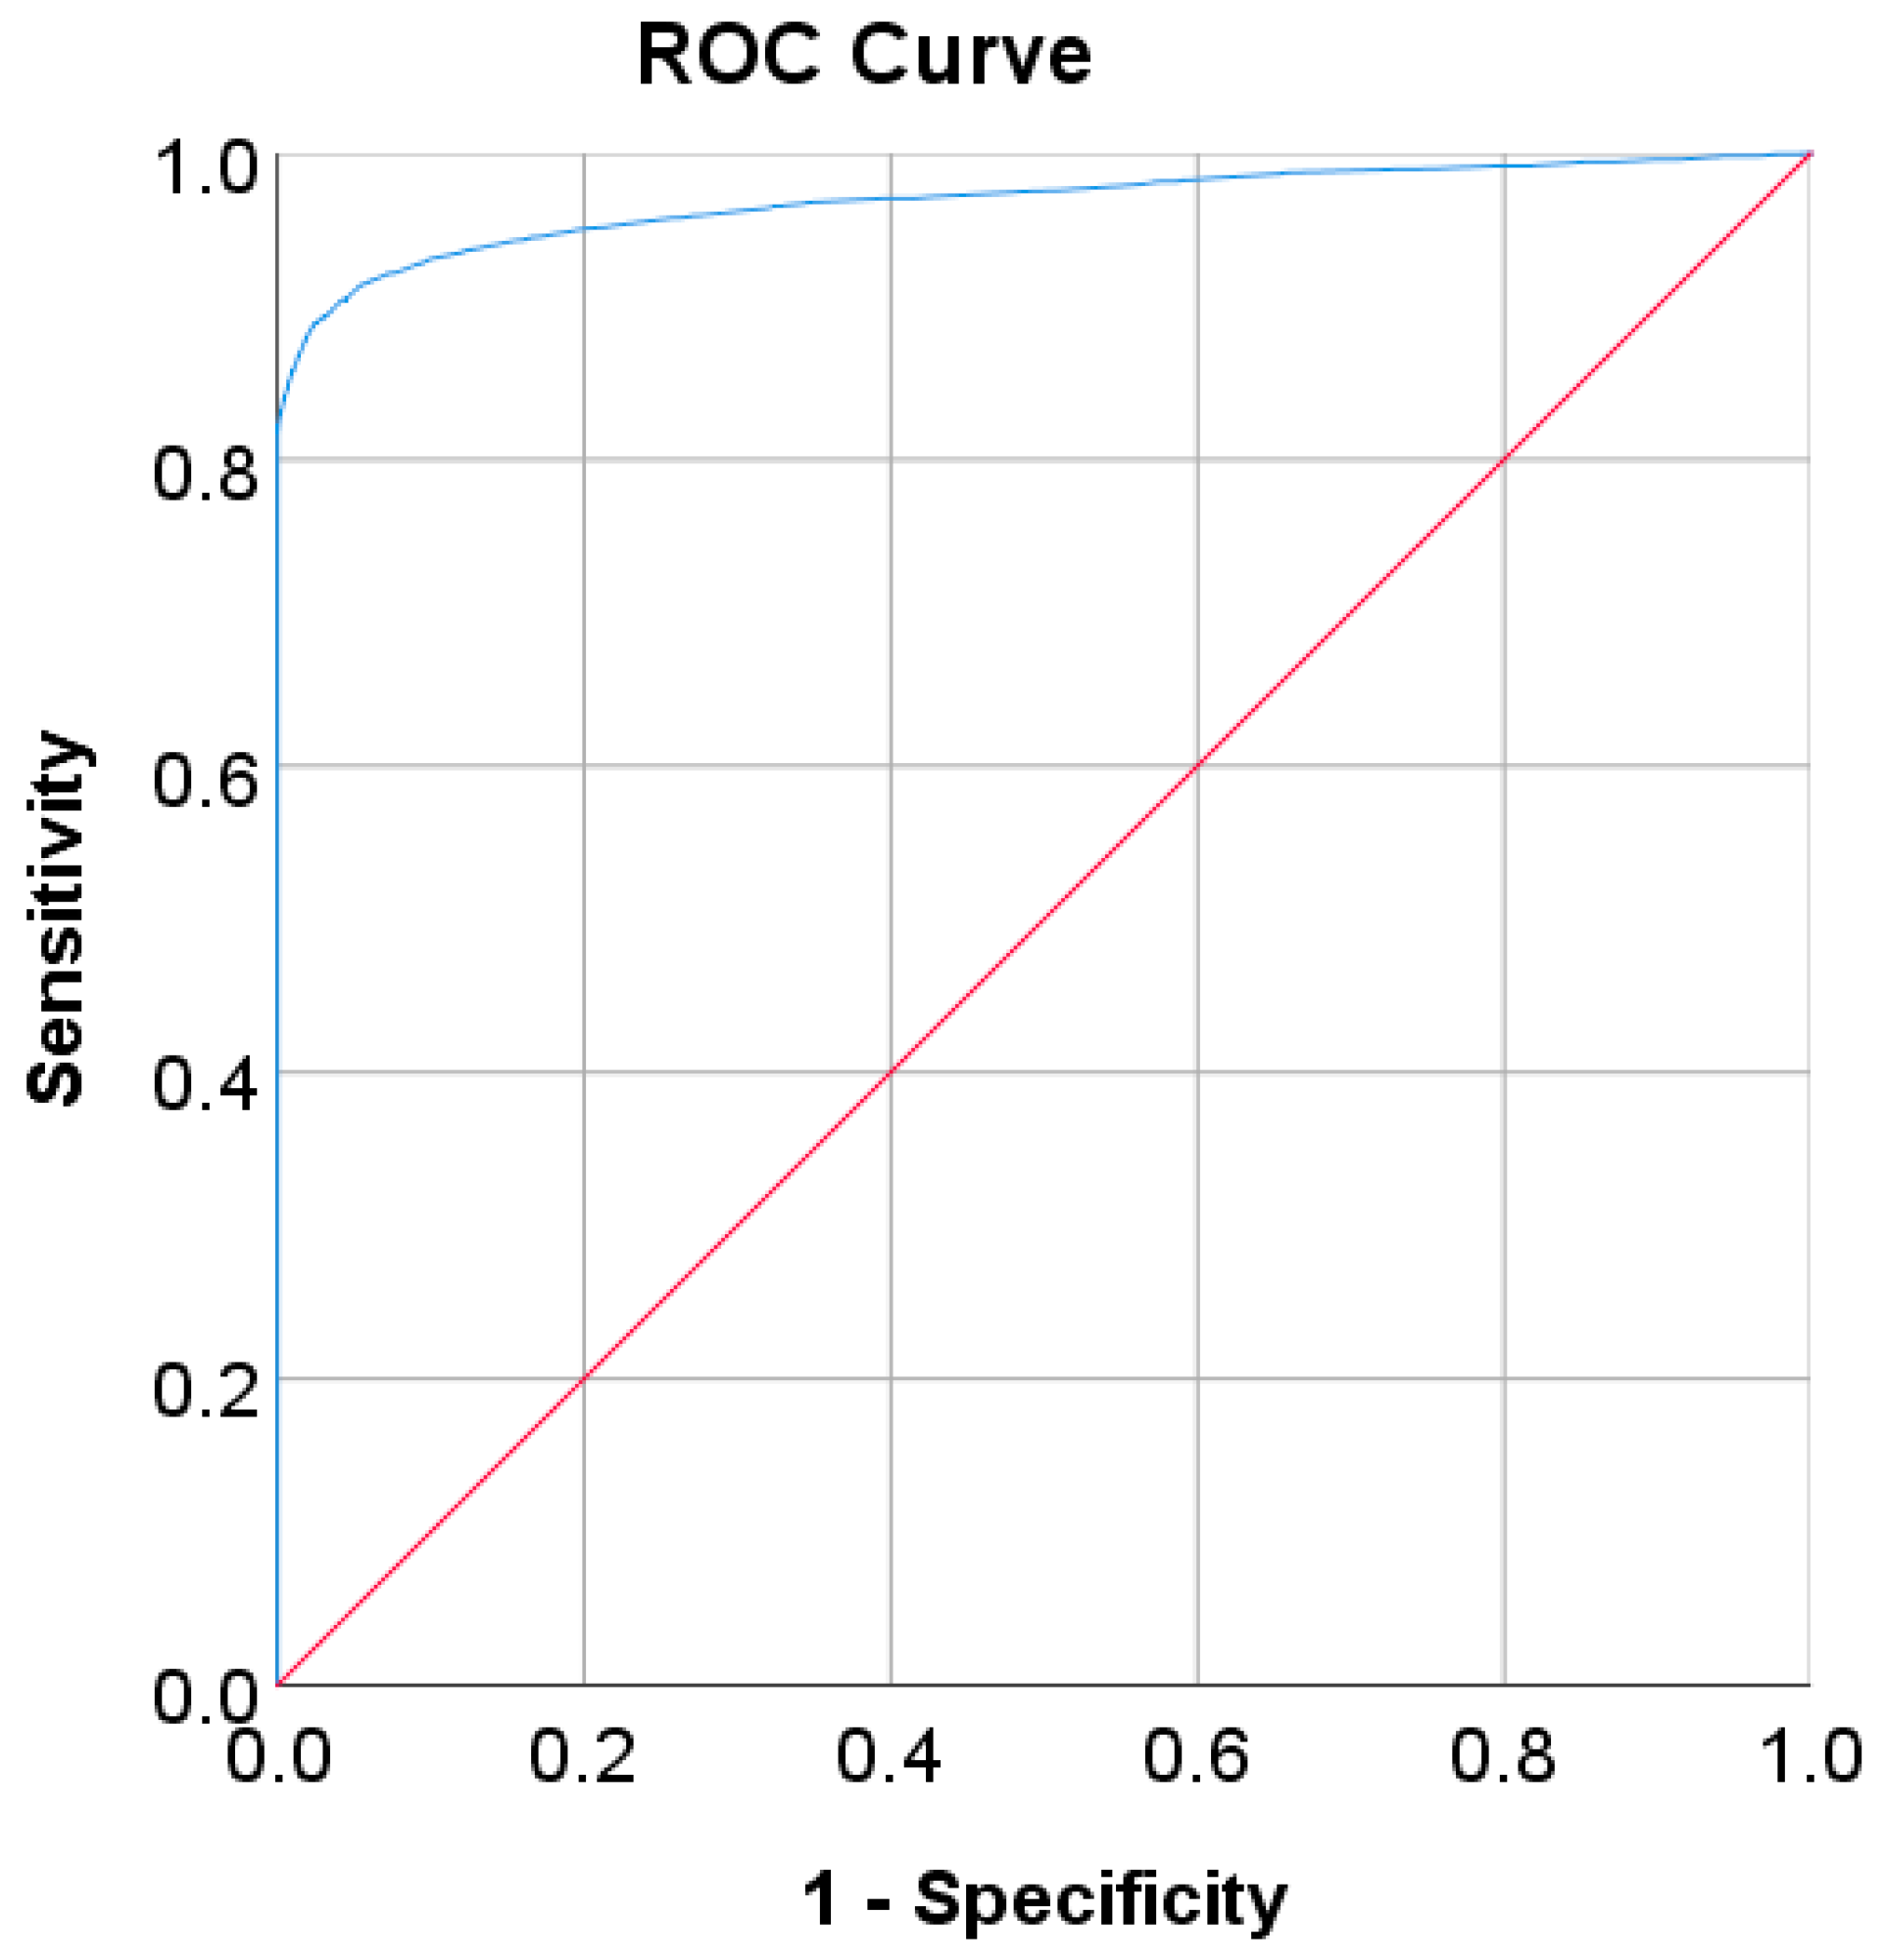
In the Chinese adult population, the optimal cut point of FPG was found to be 6.205 mmol/L with a Youden index of 86.39% (see Table 8). As shown in Figure 2, by using the optimal cut point, the sensitivity increases, and the specificity decreases from 81.93% to 88.95% and 100% to 97.44%, respectively. The increment of sensitivity represents 7.02% of new population samples with a high risk of developing diabetes, and the 2.56% decrement of specificity represents the healthy subjects who undertook unnecessary clinical tests (false positive) [14]. The ROC curve in Figure 3 shows that the diagnostic measure can accurately determine the optimal cut point and the model can accurately classify the Chinese adult population samples between subjects with diabetes and those without diabetes, with an AUC score of 0.97.
In this study, diabetes diagnosis (FPG 7 mmol/L, HbA1c 6.5%, and 2hPG 200 mg/dL) was not found in the Japanese and Korean adult populations. Thus, we used the cut point of pre-diabetes for diabetes diagnosis, where the cut points are 5.6 mmol/L for FPG, 5.7% for HbA1c, and 140 mg/dL for 2hPG as recommended by ADA and WHO [36,37]. According to the results of the ROC analysis, new cut points were found for diabetes screening tests based on FPG/FBG/FBS, HbA1C, and 2hPG. As displayed in Table 8, the new cut point for the Japanese adult population, which is the optimal cut point based on the Youden index [38,39,95], is 5.523 mmol/L (FPG) and 5.375% (HbA1c), with an optimal Youden index of 48.08% and 43.17%, respectively. The sensitivity and specificity of FPG and HbA1c increase and decrease by using the optimal cut point, respectively, from 61.66% to 67.29% for FPG and 36.19% to 74.26% for HbA1c, and from 84.16% to 80.79% for FPG and 94.35% to 68.91% for HbA1c (see Figure 4). The sensitivity increased by 5.63% for FPG and 38,07% for HbA1c, indicating that 5.63% and 38,08% of population samples previously classified as healthy changed into pre-diabetes and may have a high risk of developing diabetes in the future. In contrast, a significant decrement was shown in specificity, with degradation values of FPG and HbA1c being 3.37% and 25.44%, respectively. This means that the subjects in the population sample who have negative pre-diabetes test results where they are healthy (false positive) decreased by 3.37% and 25.44%. By using an optimal cut point, as shown in Figure 5, the ROC curve showed the model can accurately classify the population samples between subjects with diabetes and those without diabetes on optimal AUC scores of 0.80 and 0.78.
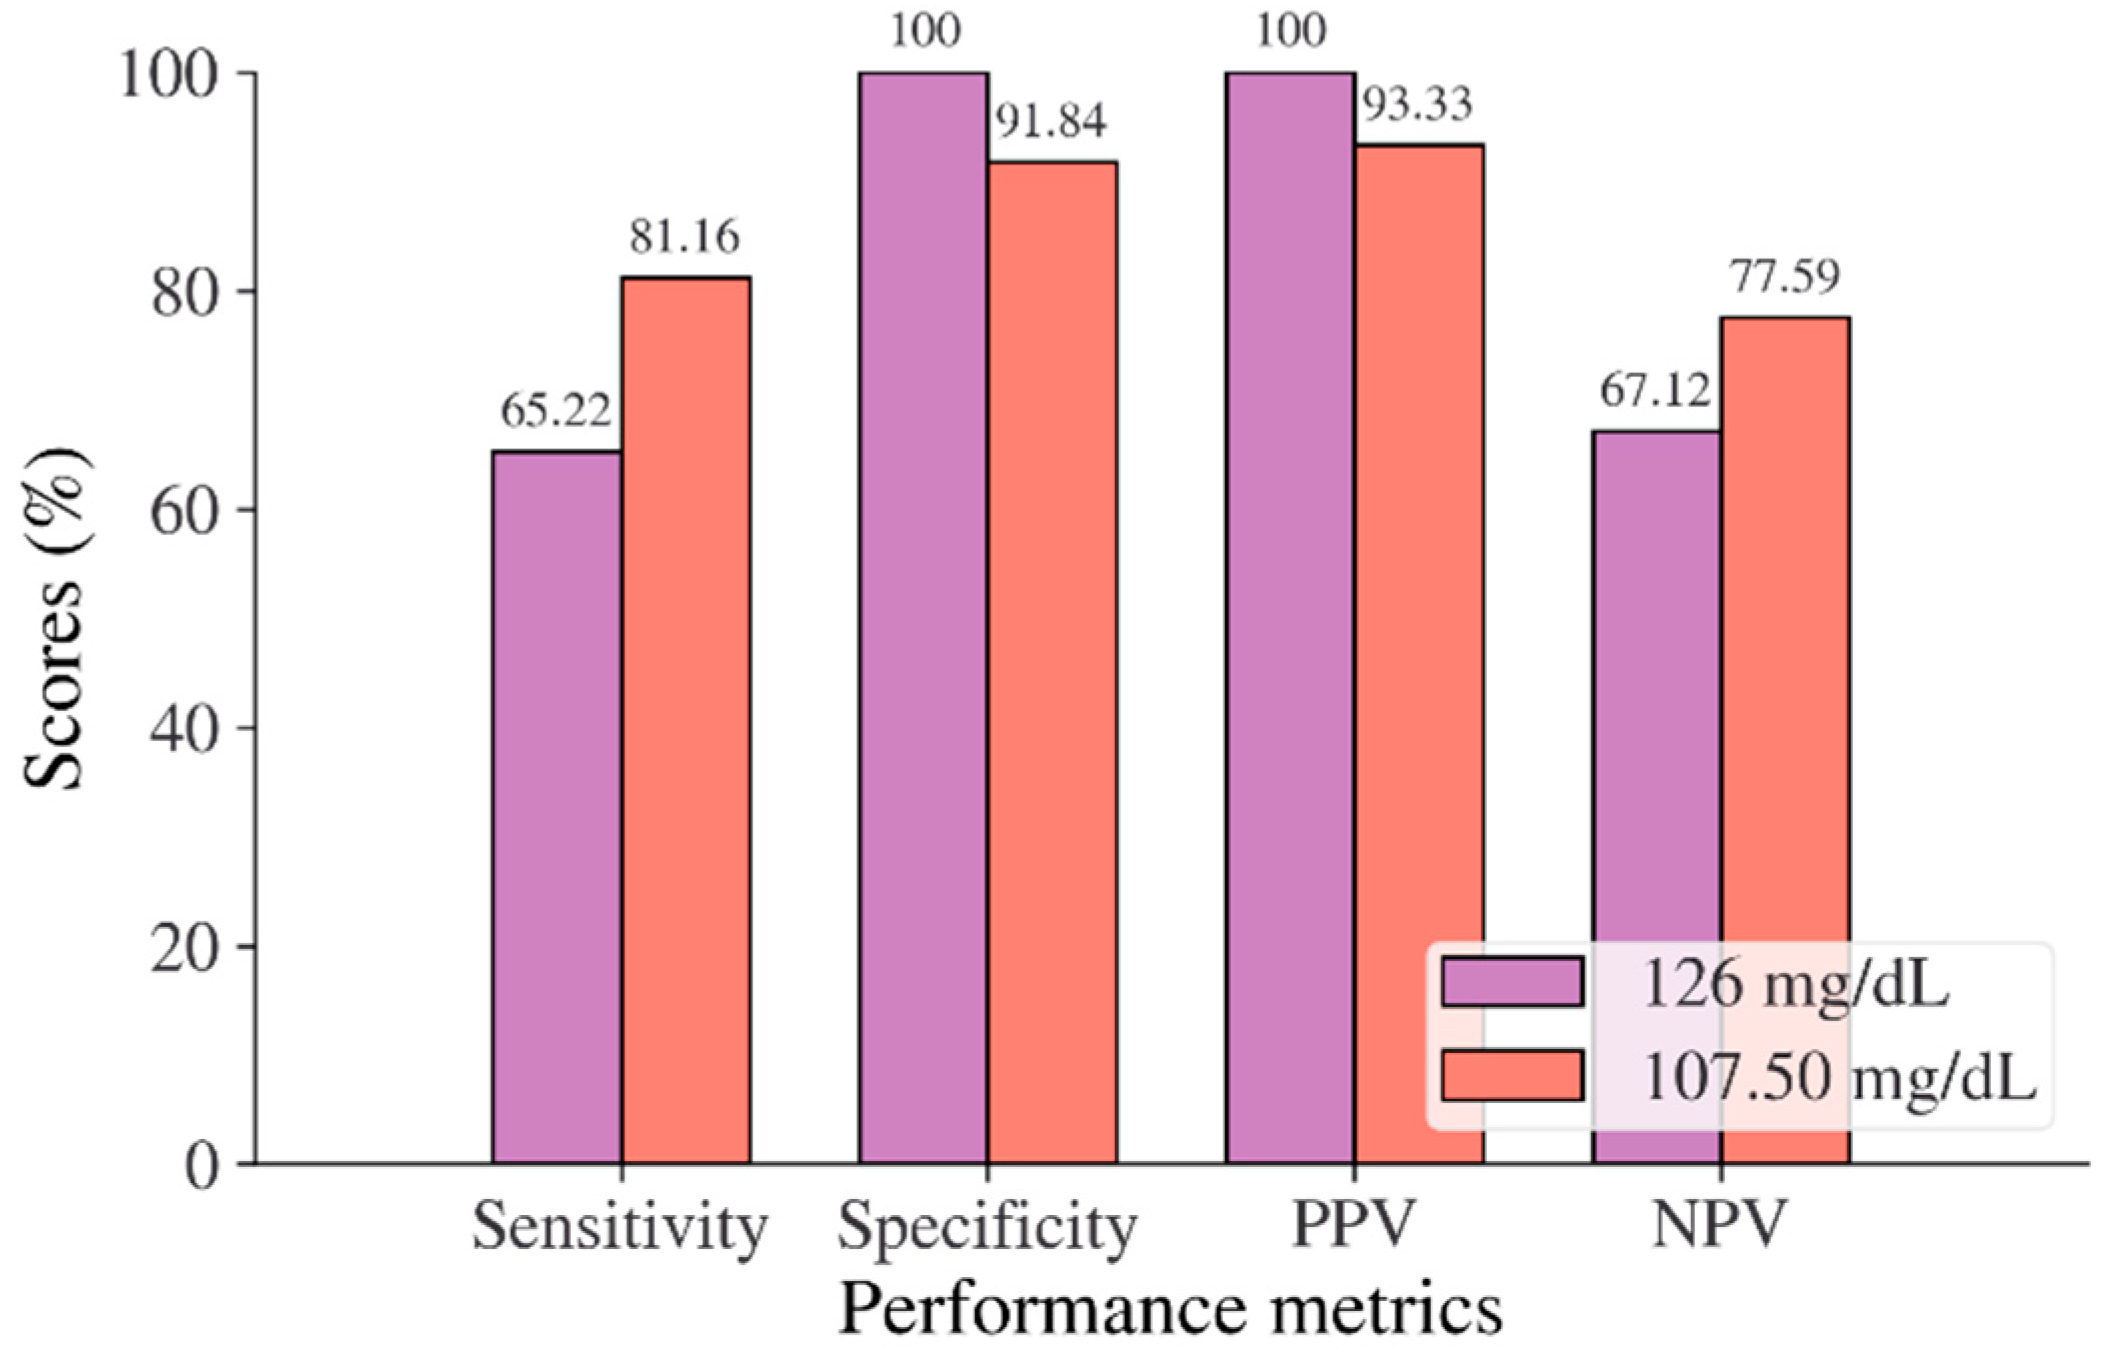
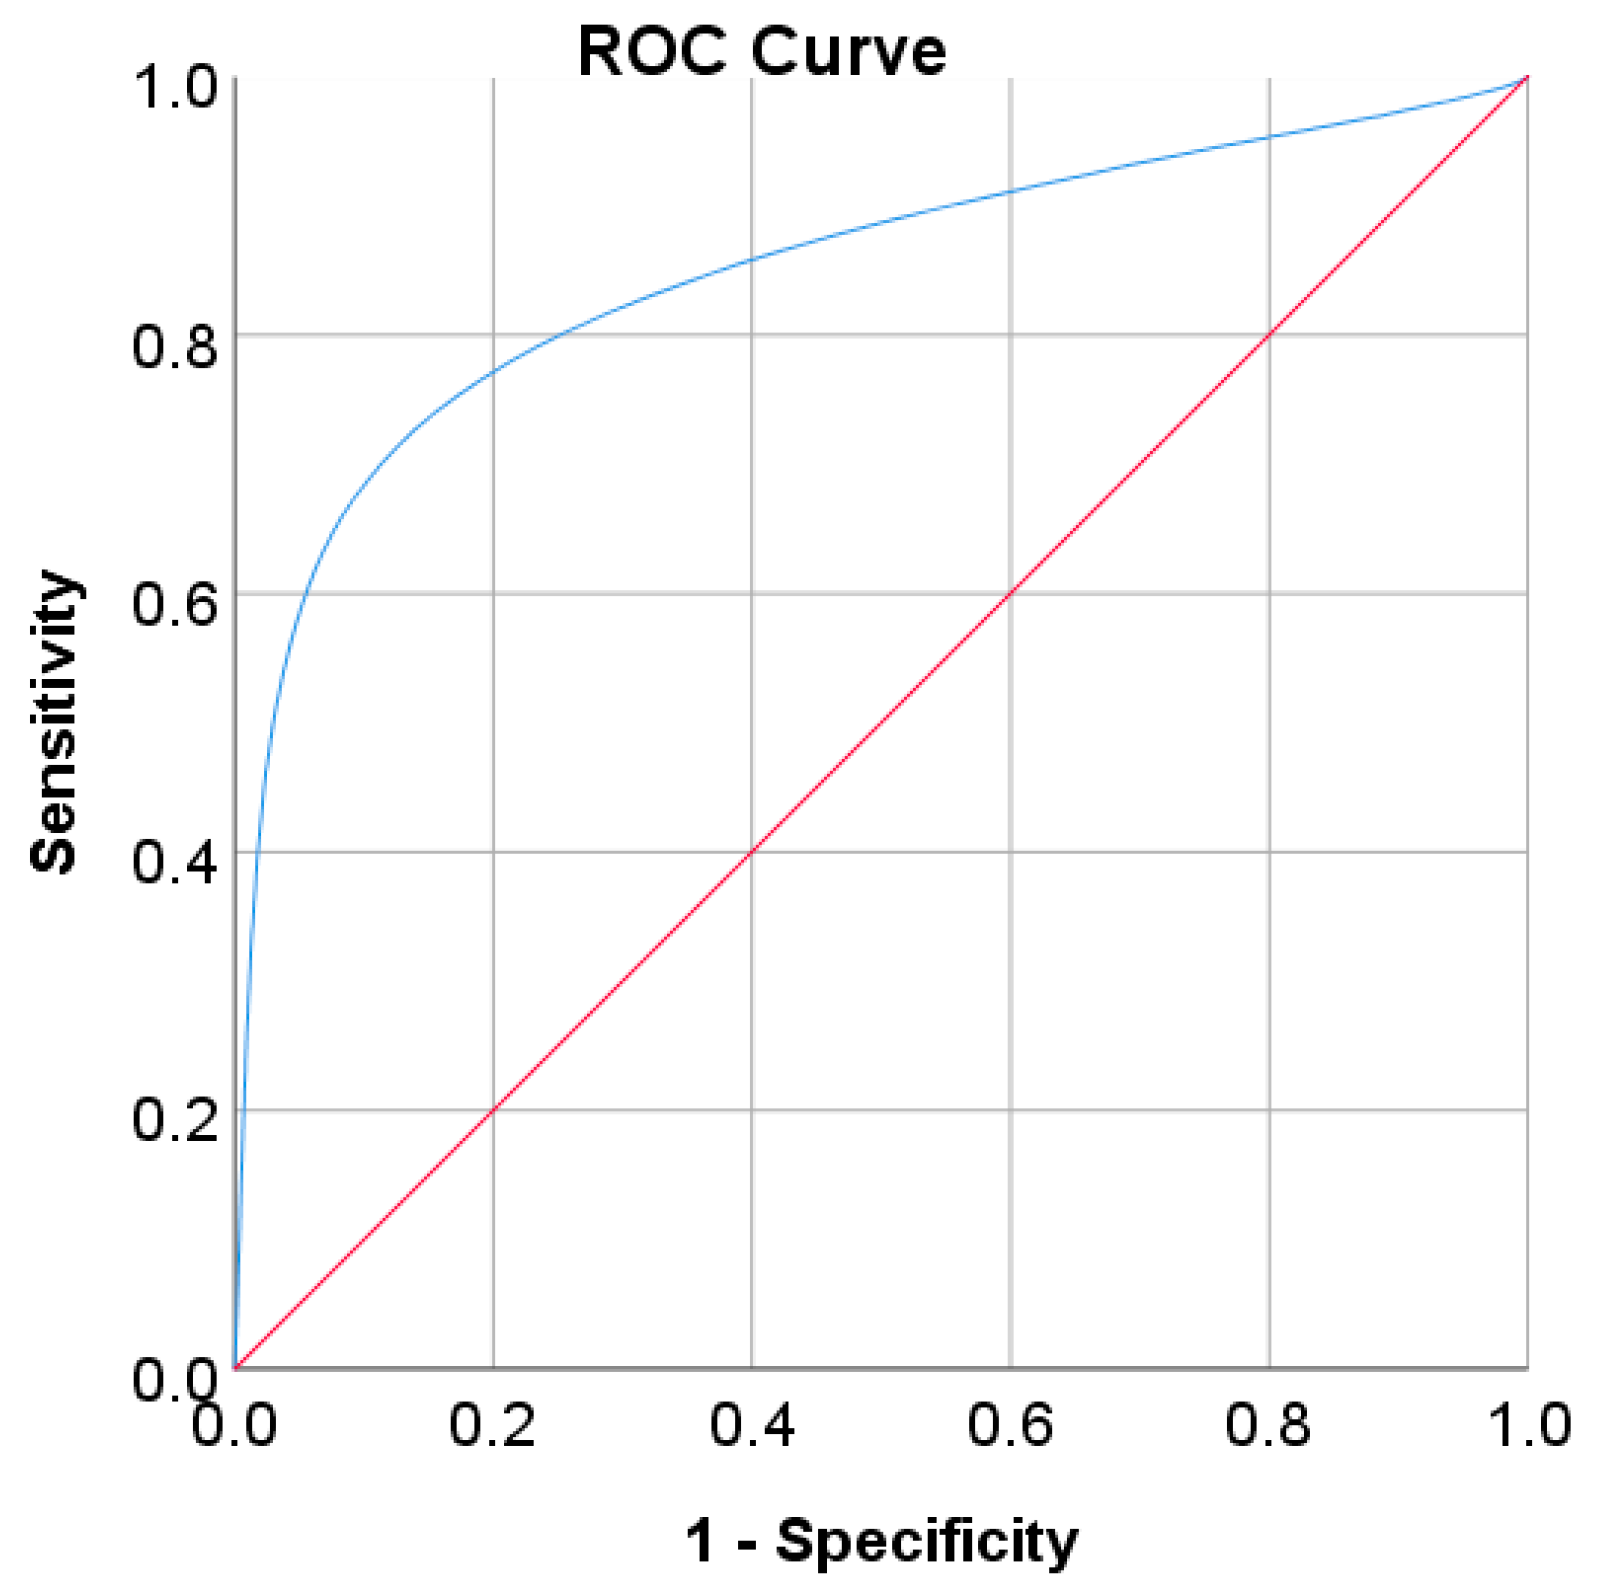
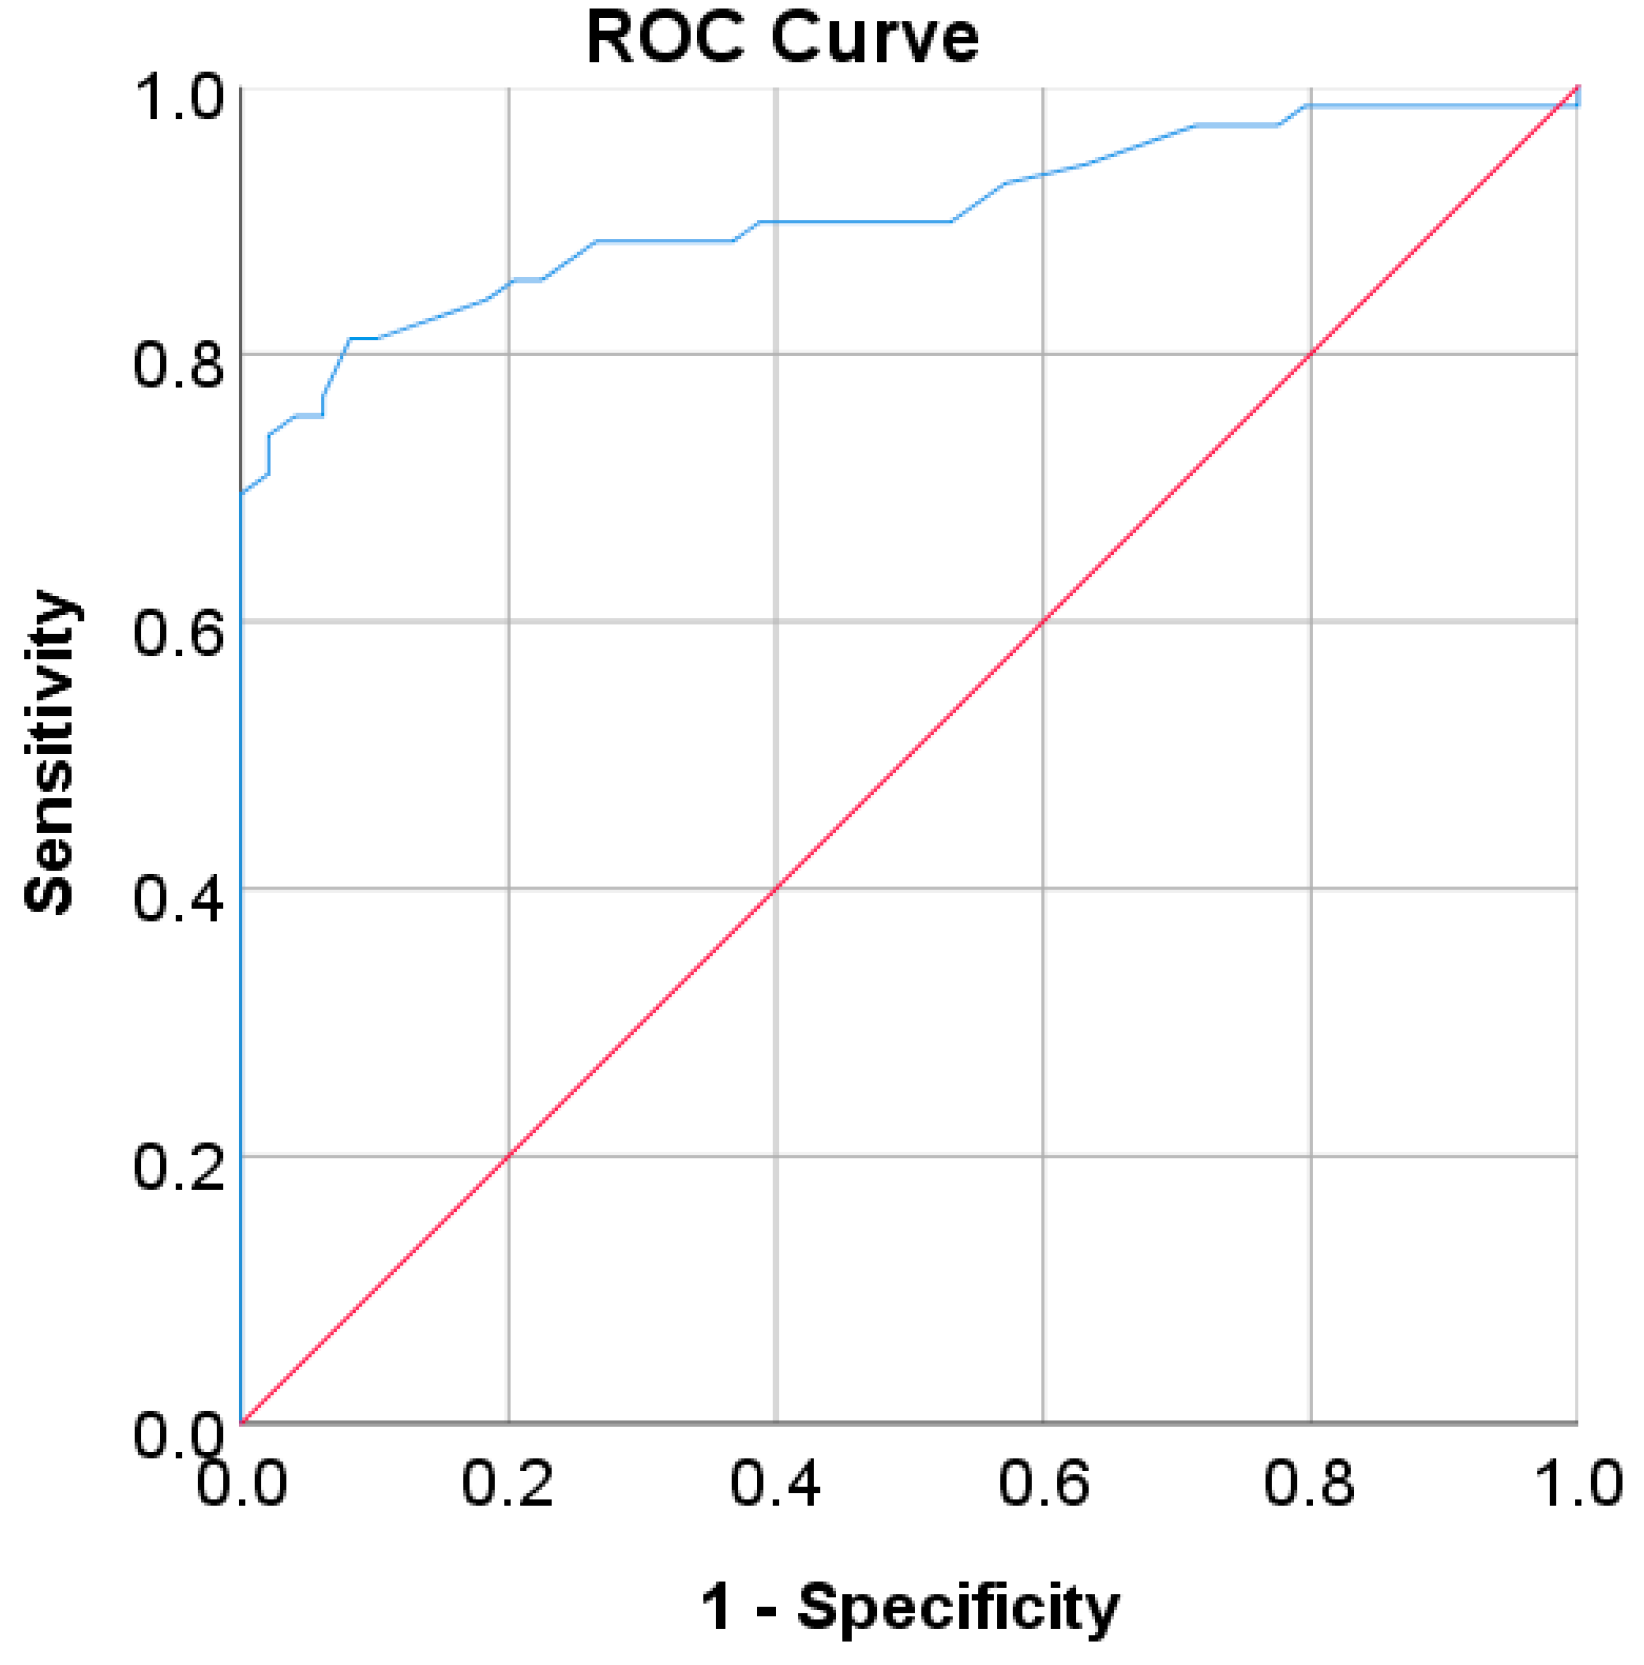
In the Korean adult population, the new cut point of FBS was found to be optimal in the range of 105.50 to 106.50 mg/dL (see Table 8), with a Youden index of 58.76%. We used 105.50 mg/dL as the FBS’s new (optimal) cut point for diabetes screening in the Korean adult population. As shown in Figure 6, the result revealed that by using 105.50 mg/dL, the sensitivity of FBS improved from 46.26% to 72.69% and the specificity decreased from 97.59% to 86.07%. In the US-PIMA Indian adult population, diabetes screening was carried out using 2hPG. The new cut point was found to be optimal at 123.50 mg/dL with a Youden index of 43.35% (see Table 8), which produced an improvement in sensitivity and a decrement in specificity compared to the cut point as recommended by ADA and WHO (140 mg/dL). As presented in Figure 7, the result showed that, when the 2hPG new cut point of 123.50 mg/dL was applied to the US-PIMA Indian population, the sensitivity improved from 50.37% to 70.15% and the specificity fell from 87.50% to 73.20%. The improvement in sensitivity and the decrement in specificity were also found in the Trinidadian adult population, where a new cut point of FBG (107.50 mg/dL) was applied. As shown in Figure 8, sensitivity significantly improved from 65.22% to 81.16% and specificity fell from 100% to 92.84%. When using optimal cut points based on the maximum Youden index, the sensitivity and specificity of Korean, US-PIMA Indian, and Trinidadian adult populations increased and decreased, which represented an increment as high-risk population samples had diabetes and a decrement of healthy subjects in the populations. The ROC curves shown in Figure 9, Figure 10 and Figure 11 show that the diagnostic measures (FBS, 2hPG, and FBG) can accurately determine optimal cut points and the model can accurately classify the population samples between subjects with diabetes and those without diabetes, with AUC scores of 0.85, 0.79, and 0.905 for the Korean, US-PIMA Indian, and Trinidadian dataset, respectively.
According to the results above, the sensitivity and specificity values among all population samples (Chinese, Japanese, Korean, US-PIMA Indian, and Trinidadian) increased and decreased because sensitivity and specificity are inversely related to one another [96]. Thus, as sensitivity rises, specificity falls, and vice versa. All the diagnostics measures and the models also showed good accuracy in determining optimal cut points and classifying the population samples, as proved by high AUC scores.

4.3. Diabetes Prediction Based on Machine Learning Methods

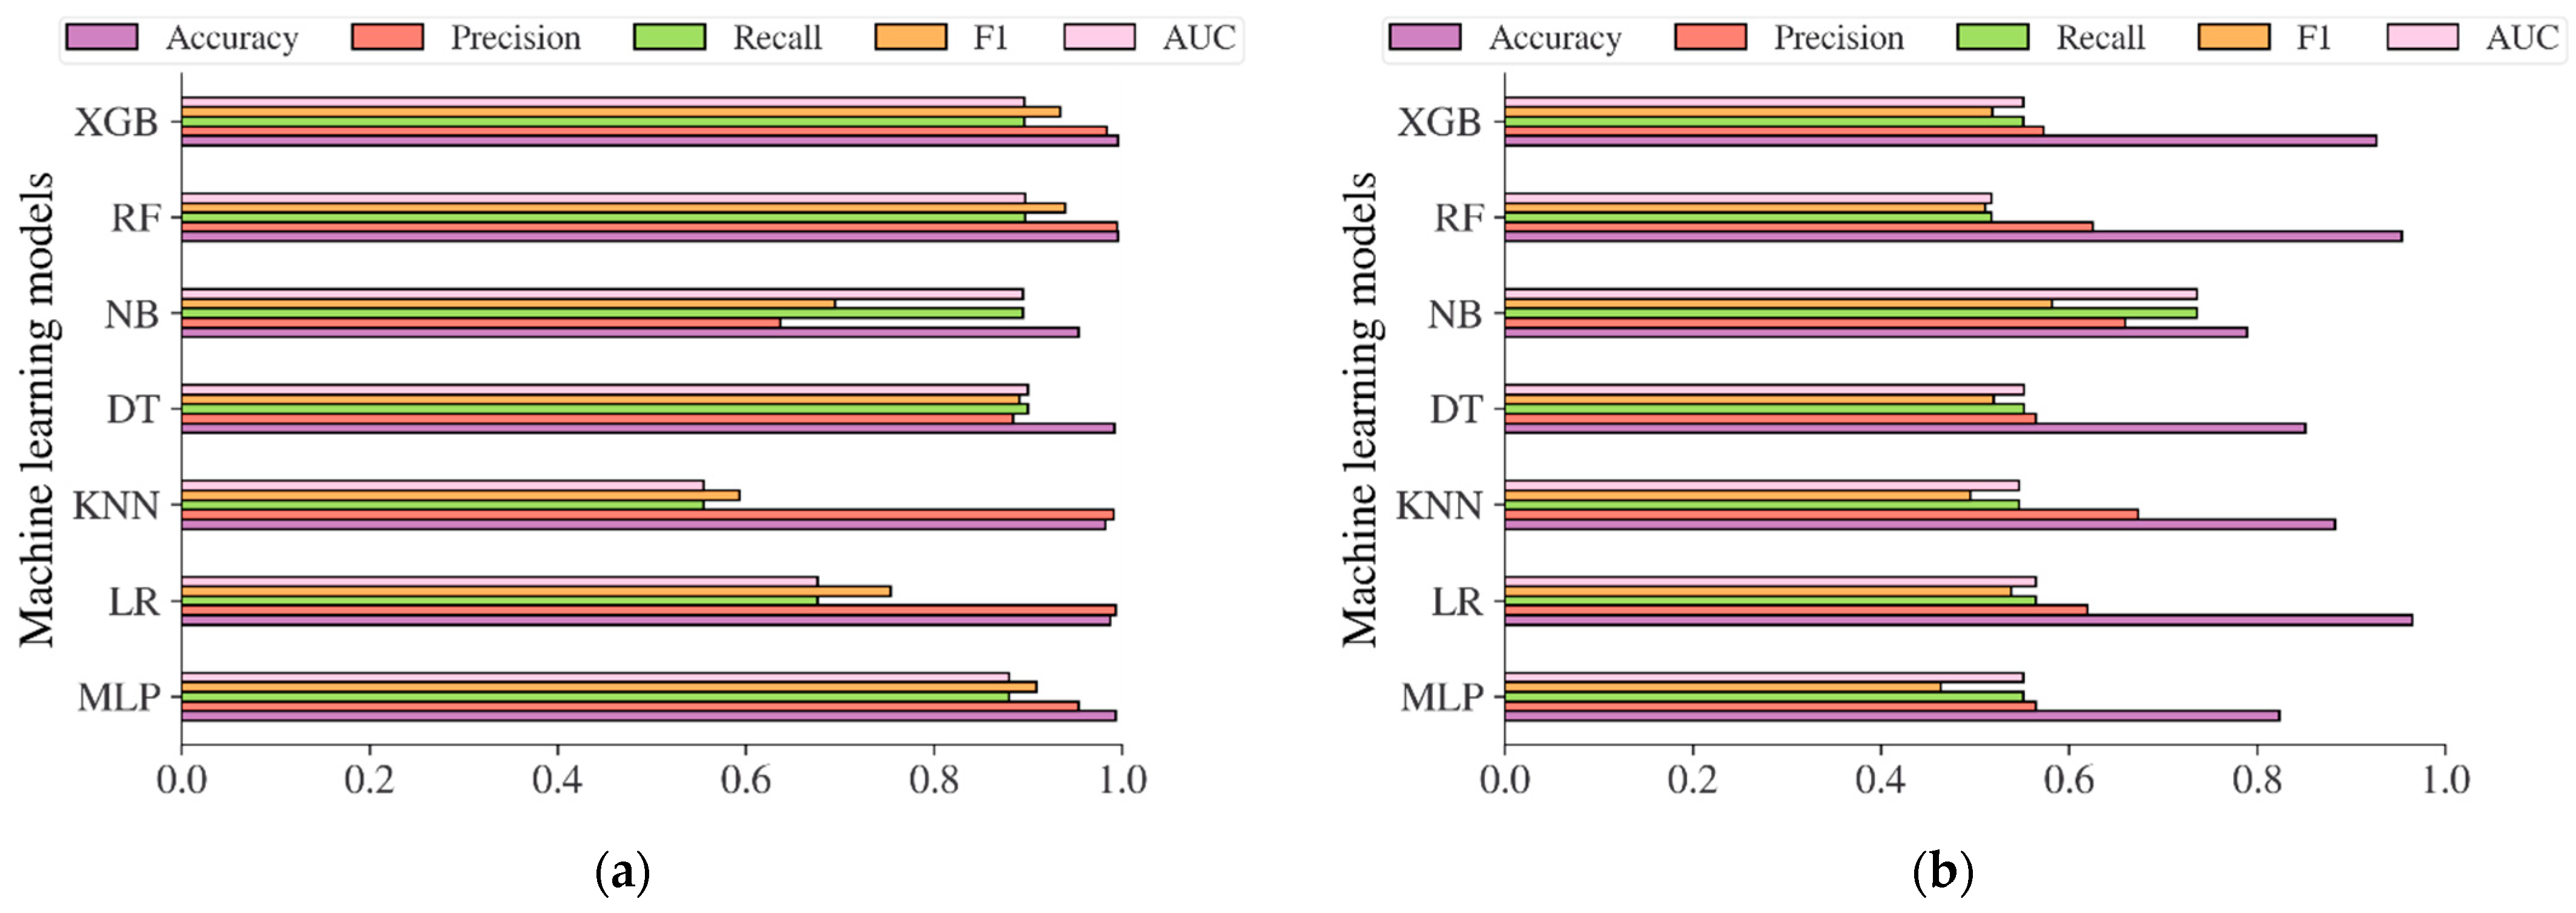
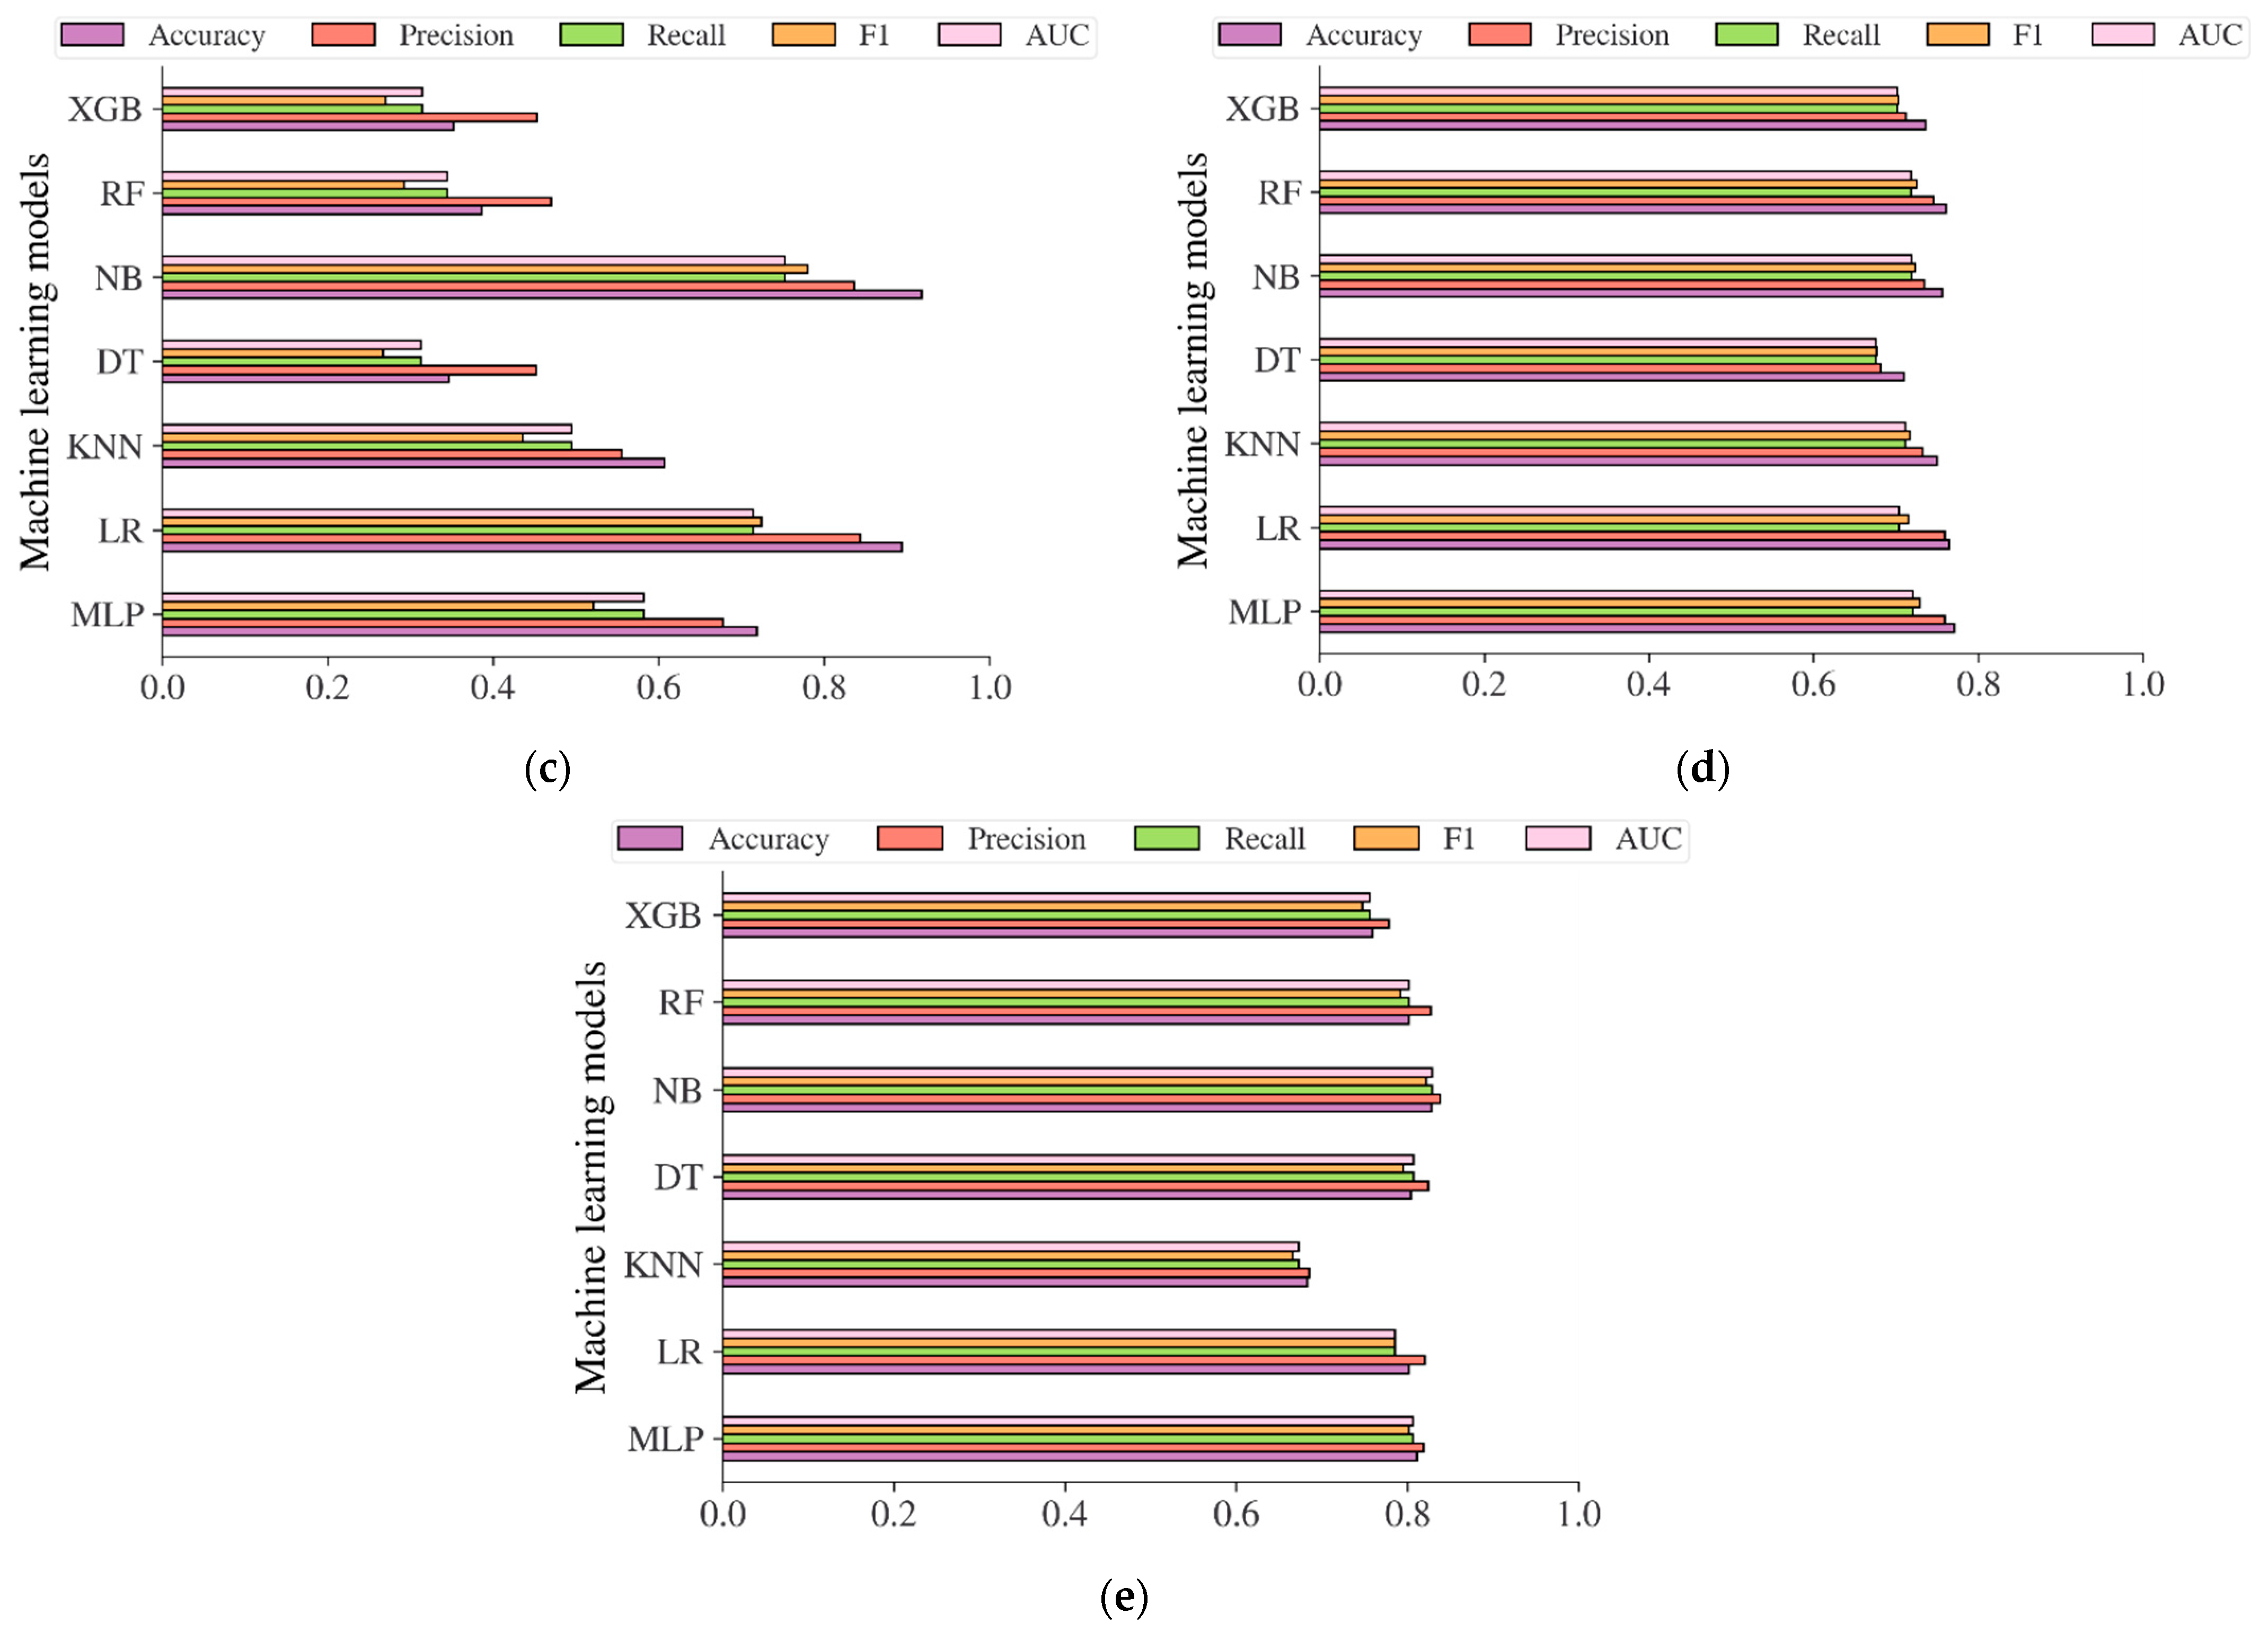
Additional analysis was also carried out in this study to evaluate the performance of the diabetes models based on machine learning methods in predicting the risk of diabetes. The performance evaluation metrics including accuracy, precision, recall, f1, and AUC were used to evaluate the models. The result in Figure 12a showed that the diabetes models on the Chinese adult population sample performed very robustly in terms of accuracy, with an accuracy of 99.37%, 98.73%, 99.15%, 95.37%, 99.59%, and 99.55% for MLP, LR, KNN, DT, NB, RF, and XGB, respectively. The best accuracy was achieved by RF, with an accuracy of 99.59%. In terms of AUC, DT reached the highest value of 0.9002. Following the diabetes models on the Chinese diabetes dataset, the diabetes models on the Japanese adult population sample also performed well in terms of accuracy (see Figure 12b), with an accuracy of 82.36%, 96.50%, 88.23%, 85.11%, 78.91%, 95.39%, and 92.65% for MLP, LR, KNN, DT, NB, RF, and XGB, respectively. The LR performed best among other methods in terms of accuracy, and NB performed best in terms of AUC, with an AUC score of 0.7361. For the diabetes models on the Korean adult population sample (see Figure 12c), the accuracy varied from 34.65% to 91.77%. While DT, RF, and XGB showed an accuracy of less than 50%, LR and NB showed high accuracy, with accuracy rates of 89.42% and 91.77%, respectively. All the machine learning method performance was shown to be low in terms of AUC, with 0.7525 recorded as the highest achieved by NB. The accuracy and AUC scores of all diabetes models showed not much difference from one another on the US-PIMA Indian adult population sample (see Figure 12d), achieving a model’s accuracy of 70.96% to 77.08% and AUC of 0.6755 to 0.7201 performed by MLP as the highest. Along with that, in the Trinidadian adult population sample (see Figure 12e), the models performed with the highest accuracy of 82.80% and AUC of 0.8289, where NB was the best performer. According to the performance evaluation results utilizing machine learning methods, the diabetes prediction model based on NB dominated as the best prediction model in the majority of performance evaluation metrics.

4.4. Comparison with Earlier Works

We further investigated the results of our study with earlier works that utilized the same dataset. Table 9 shows the performance of the proposed study which utilized a statistical-based LR model compared to previous studies across all datasets. Due to the limited number of previous studies that utilized the same datasets, we compared our proposed study to one previous study for the Chinese, Japanese (NAFLD), Korean (NHISS), and Trinidadian datasets. Using the Chinese diabetes dataset for predicting diabetes, our proposed study, which utilized the LR model, outperformed the previous study [44] (XGBoost) with an AUC score of 0.97. While using the Japanese (NAFLD) dataset, our proposed study has the same performance as the previous study [45] that utilized the Cox regression model with an AUC score of 0.80. By using the Korean (NHISS) and US-PIMA Indian datasets, our proposed study performed better than the previous studies [6,49,52,55] with an AUC of 0.85 and 0.79, respectively. Finally, using the Trinidadian dataset, our proposed study provided significant performance compared to the previous study [85] with an AUC score of 0.905.

5. Conclusions

In this study, we conducted a comprehensive analysis of diabetes screening scores to investigate the nationally representative sample summaries, risk factors, optimal cut points, and prediction models. The risk factors for diabetes revealed in this study involved age equal to or older than 45 years old, being male, obesity (BMI > 27.5 kg/m2), smoking, no exercise, and a family history of diabetes. If those risk factors are present, diabetes is very likely to occur in the subject. Using the optimal Youden index, the cut points across all the population samples were found to be optimal at 6.205 mmol/L for FPG in the Chinese adult population, 5.523 mmol/L for FPG, and 5.375% for HbA1C in the Japanese adult population, 105.50 to 106.50 mg/dL for FBS in the Korean adult population, 123.50 mg/dL for 2hPG in the US-PIMA Indian adult population, and 107.50 mg/dL for FBG in the Trinidadian adult population. By using those optimal cut points, the sensitivity and specificity of the models increased and decreased in all prediction models that utilized statistical methods, e.g., LR. We also found that diagnostic measures, such as FPG/FBS/FBG, HbA1C, and 2hPG could accurately determine the optimal cut points and the model could accurately classify the population samples between subjects with diabetes and those without diabetes, with an AUC score of 0.97 for FPG, 0.80 for FPG, 0.78 for HbA1C, 0.85 for FBS, 0.79 for 2hPG, and 0.905 for FBG, respectively, in Chinese, Japanese, Korean, US-PIMA Indian, and Trinidadian adult populations. While the LR-based statistic method was used to identify the relationship between diabetes and COVID-19 in the Korean population, a statistically significant score (p-value < 0.001) was found, and it showed that subjects with diabetes have a slightly higher risk of COVID-19 compared to the non-diabetic subjects, with the adjusted OR of 1.21 (95% CI, 1.10–1.34). Furthermore, in predicting diabetes using ML methods with employed 10-fold cross-validation, the prediction models could also accurately detect diabetes, with the highest accuracy rate of up to 99.59% performed by RF, 96.50% performed by LR, 91.77% performed by NB, 77.08% performed by MLP, and 82.80% performed by NB in Chinese, Japanese, Korean, US-PIMA Indian, and Trinidadian adult populations. Among all machine learning methods applied in this study, NB performed better in the majority of performance evaluation metrics, such as accuracy, precision, recall, f1, and AUC. By conducting this ML-based prediction methods analysis, the information of the best model for predicting diabetes was revealed, as well as the information regarding the most suitable model for real-world healthcare data and requirements.
Even though the diabetes screening scores showed robust results in revealing risk factors, determining cut points, and assessing the risk of diabetes or predicting diabetes, this study has limitations that should be noted. The first limitation of this study is that we generalized some multiple-categorical variables in the dataset into binary categorical variables, so it may result in different findings. For example, we categorized the smoking variable into two categories: smoking and not smoking, where there are four levels of smoking. Thus, it may result in different findings, and analysis of using multiple categories could be investigated in future work. The second limitation is that this study only used one dataset to investigate the interrelationship between diabetes and COVID-19. To reveal a strong and robust interrelationship between diabetes and COVID-19, the utilization of numerous datasets is recommended, especially datasets across various nations. Therefore, in future work, the utilization of numerous datasets in order to investigate and reveal a strong interrelationship between diabetes and COVID-19 will be challenging.

Author Contributions

Conceptualization, N.L.F. and M.S.; methodology, N.L.F. and S.L.Q.; software, M.S. and G.A.; validation, G.A., M.A. and S.M.U.; formal analysis, M.S., S.L.Q. and N.L.F.; investigation, S.L.Q. and S.M.U.; resources, S.L.Q. and S.M.U.; data curation, M.A. and S.L.Q.; writing—original draft preparation, N.L.F.; writing—review and editing, N.L.F. and M.S; visualization, M.S. and N.L.F.; supervision, G.A. and M.A.; project administration, G.A. and M.A.; funding acquisition, N.L.F. and M.S. All authors have read and agreed to the published version of the manuscript.

Funding

This work was funded by the Sejong University Industry-Academic Cooperation Foundation (Grant No. 20220208).

Institutional Review Board Statement

Not applicable.

Informed Consent Statement

Not applicable.

Data Availability Statement

Not applicable.

Conflicts of Interest

The authors declare no conflict of interest.

References

  1. Pate, A.; Emsley, R.; Ashcroft, D.M.; Brown, B.; van Staa, T. The Uncertainty with Using Risk Prediction Models for Individual Decision Making: An Exemplar Cohort Study Examining the Prediction of Cardiovascular Disease in English Primary Care. BMC Med. 2019, 17, 134. [Google Scholar] [CrossRef] [Green Version]
  2. Chen, L. Overview of Clinical Prediction Models. Ann. Transl. Med. 2020, 8, 71. [Google Scholar] [CrossRef] [PubMed]
  3. Murphy, J.M. Performance of Screening and Diagnostic Tests: Application of Receiver Operating Characteristic Analysis. Arch. Gen. Psychiatry 1987, 44, 550. [Google Scholar] [CrossRef] [PubMed]
  4. Rossello, X.; Dorresteijn, J.A.; Janssen, A.; Lambrinou, E.; Scherrenberg, M.; Bonnefoy-Cudraz, E.; Cobain, M.; Piepoli, M.F.; Visseren, F.L.; Dendale, P. Risk Prediction Tools in Cardiovascular Disease Prevention: A Report from the ESC Prevention of CVD Programme Led by the European Association of Preventive Cardiology (EAPC) in Collaboration with the Acute Cardiovascular Care Association (ACCA) and the Association of Cardiovascular Nursing and Allied Professions (ACNAP). Eur. J. Psychiatry Nurs. 2019, 18, 534–544. [Google Scholar] [CrossRef] [Green Version]
  5. Fitriyani, N.L.; Syafrudin, M.; Alfian, G.; Rhee, J. HDPM: An Effective Heart Disease Prediction Model for a Clinical Decision Support System. IEEE Access 2020, 8, 133034–133050. [Google Scholar] [CrossRef]
  6. Alfian, G.; Syafrudin, M.; Fitriyani, N.L.; Anshari, M.; Stasa, P.; Svub, J.; Rhee, J. Deep Neural Network for Predicting Diabetic Retinopathy from Risk Factors. Mathematics 2020, 8, 1620. [Google Scholar] [CrossRef]
  7. Fitriyani, N.L.; Syafrudin, M.; Alfian, G.; Rhee, J. Development of Disease Prediction Model Based on Ensemble Learning Approach for Diabetes and Hypertension. IEEE Access 2019, 7, 144777–144789. [Google Scholar] [CrossRef]
  8. Alfian, G.; Syafrudin, M.; Ijaz, M.; Syaekhoni, M.; Fitriyani, N.; Rhee, J. A Personalized Healthcare Monitoring System for Diabetic Patients by Utilizing BLE-Based Sensors and Real-Time Data Processing. Sensors 2018, 18, 2183. [Google Scholar] [CrossRef] [Green Version]
  9. American Diabetes Association. Standards of Medical Care in Diabetes–2006. Diabetes Care 2006, 29, s4–s42. [Google Scholar] [CrossRef]
  10. World Health Organization. Global Status Report on Non-communicable Diseases 2014. Available online: https://www.who.int/nmh/publications/ncd-status-report-2014/en (accessed on 9 August 2022).
  11. Complication of Diabetes. Available online: https://www.diabetes.org.uk/guide-to-diabetes/complications (accessed on 9 August 2022).
  12. Global Report of Diabetes. Available online: https://apps.who.int/iris/bitstream/handle/10665/204871/9789241565257_eng.pdf?sequence=1 (accessed on 9 August 2022).
  13. Diabetes. Available online: https://www.who.int/health-topics/diabetes (accessed on 9 August 2022).
  14. Kianpour, F.; Fararouei, M.; Hassanzadeh, J.; Mohammadi, M.; Dianatinasab, M. Performance of Diabetes Screening Tests: An Evaluation Study of Iranian Diabetes Screening Program. Diabetol. Metab. Syndr. 2021, 13, 13. [Google Scholar] [CrossRef]
  15. Buijsse, B.; Simmons, R.K.; Griffin, S.J.; Schulze, M.B. Risk Assessment Tools for Identifying Individuals at Risk of Developing Type 2 Diabetes. Epidemiol. Rev. 2011, 33, 46–62. [Google Scholar] [CrossRef] [PubMed] [Green Version]
  16. Meng, L.; Kwon, K.-S.; Kim, D.J.; Lee, Y.; Kim, J.; Kshirsagar, A.V.; Bang, H. Performance of Diabetes and Kidney Disease Screening Scores in Contemporary United States and Korean Populations. Diabetes Metab. J. 2022, 46, 273–285. [Google Scholar] [CrossRef] [PubMed]
  17. Wu, H.; Yang, S.; Huang, Z.; He, J.; Wang, X. Type 2 Diabetes Mellitus Prediction Model Based on Data Mining. Inform. Med. Unlocked 2018, 10, 100–107. [Google Scholar] [CrossRef]
  18. Meng, X.-H.; Huang, Y.-X.; Rao, D.-P.; Zhang, Q.; Liu, Q. Comparison of Three Data Mining Models for Predicting Diabetes or Prediabetes by Risk Factors. Kaohsiung J. Med. Sci. 2013, 29, 93–99. [Google Scholar] [CrossRef] [PubMed] [Green Version]
  19. Muktabhant, B.; Sanchaisuriya, P.; Sarakarn, P.; Tawityanon, W.; Trakulwong, M.; Worawat, S.; Schelp, F.P. Use of Glucometer and Fasting Blood Glucose as Screening Tools for Diabetes Mellitus Type 2 and Glycated Haemoglobin as Clinical Reference in Rural Community Primary Care Settings of a Middle Income Country. BMC Public Health 2012, 12, 349. [Google Scholar] [CrossRef] [PubMed] [Green Version]
  20. Agarwal, M.M. Gestational Diabetes Mellitus: Screening with Fasting Plasma Glucose. WJD 2016, 7, 279. [Google Scholar] [CrossRef]
  21. Mannucci, E.; Ognibene, A.; Sposato, I.; Brogi, M.; Gallori, G.; Bardini, G.; Cremasco, F.; Messeri, G.; Rotella, C.M. Fasting Plasma Glucose and Glycated Haemoglobin in the Screening of Diabetes and Impaired Glucose Tolerance. Acta Diabetol. 2003, 40, 181–186. [Google Scholar] [CrossRef]
  22. Katulanda, G.W.; Katulanda, P.; Dematapitiya, C.; Dissanayake, H.A.; Wijeratne, S.; Sheriff, M.H.R.; Matthews, D.R. Plasma Glucose in Screening for Diabetes and Pre-Diabetes: How Much Is Too Much? Analysis of Fasting Plasma Glucose and Oral Glucose Tolerance Test in Sri Lankans. BMC Endocr. Disord. 2019, 19, 11. [Google Scholar] [CrossRef] [Green Version]
  23. Rosén, A.; Otten, J.; Stomby, A.; Vallin, S.; Wennberg, P.; Brunström, M. Oral Glucose Tolerance Testing as a Complement to Fasting Plasma Glucose in Screening for Type 2 Diabetes: Population-Based Cross-Sectional Analyses of 146 000 Health Examinations in Västerbotten, Sweden. BMJ Open 2022, 12, e062172. [Google Scholar] [CrossRef]
  24. Goyal, A.; Gupta, Y.; Kubihal, S.; Kalaivani, M.; Bhatla, N.; Tandon, N. Utility of Screening Fasting Plasma Glucose and Glycated Hemoglobin to Circumvent the Need for Oral Glucose Tolerance Test in Women with Prior Gestational Diabetes. Adv. Ther. 2021, 38, 1342–1351. [Google Scholar] [CrossRef]
  25. Nomura, K.; Inoue, K.; Akimoto, K. A Two-Step Screening, Measurement of HbA1c in Association with FPG, May Be Useful in Predicting Diabetes. PLoS ONE 2012, 7, e36309. [Google Scholar] [CrossRef] [PubMed] [Green Version]
  26. Lim, W.-Y.; Ma, S.; Heng, D.; Tai, E.S.; Khoo, C.M.; Loh, T.P. Screening for Diabetes with HbA1c: Test Performance of HbA1c Compared to Fasting Plasma Glucose among Chinese, Malay and Indian Community Residents in Singapore. Sci. Rep. 2018, 8, 12419. [Google Scholar] [CrossRef] [PubMed] [Green Version]
  27. Nomura, S.; Sakamoto, H.; Rauniyar, S.K.; Shimada, K.; Yamamoto, H.; Kohsaka, S.; Ichihara, N.; Kumamaru, H.; Miyata, H. Analysis of the Relationship between the HbA1c Screening Results and the Development and Worsening of Diabetes among Adults Aged over 40 Years: A 4-Year Follow-up Study of 140,000 People in Japan—The Shizuoka Study. BMC Public Health 2021, 21, 1880. [Google Scholar] [CrossRef] [PubMed]
  28. Bender, W.; McCarthy, C.; Elovitz, M.; Parry, S.; Durnwald, C. Universal HbA1c Screening and Gestational Diabetes: A Comparison with Clinical Risk Factors. J. Mater.-Fetal Neonatal Med. 2021, 1–7. [Google Scholar] [CrossRef] [PubMed]
  29. Zhou, X.; Pang, Z.; Gao, W.; Wang, S.; Zhang, L.; Ning, F.; Qiao, Q. Performance of an A1C and Fasting Capillary Blood Glucose Test for Screening Newly Diagnosed Diabetes and Pre-Diabetes Defined by an Oral Glucose Tolerance Test in Qingdao, China. Diabetes Care 2010, 33, 545–550. [Google Scholar] [CrossRef] [PubMed] [Green Version]
  30. Fadl, H.; Östlund, I.; Nilsson, K.; Hanson, U. Fasting Capillary Glucose as a Screening Test for Gestational Diabetes Mellitus. BJOG: Int. J. Obstet. Gynaecol. 2006, 113, 1067–1071. [Google Scholar] [CrossRef]
  31. Anderson, V.; Ye, C.; Sermer, M.; Connelly, P.W.; Hanley, A.J.G.; Zinman, B.; Retnakaran, R. Fasting Capillary Glucose as a Screening Test for Ruling Out Gestational Diabetes Mellitus. J. Obstet. Gynaecol. Can. 2013, 35, 515–522. [Google Scholar] [CrossRef]
  32. Priya, M.; Mohan Anjana, R.; Pradeepa, R.; Jayashri, R.; Deepa, M.; Bhansali, A.; Mohan, V. Comparison of Capillary Whole Blood Versus Venous Plasma Glucose Estimations in Screening for Diabetes Mellitus in Epidemiological Studies in Developing Countries. Diabetes Technol. Ther. 2011, 13, 586–591. [Google Scholar] [CrossRef]
  33. Landberg, E.; Nevander, S.; Hadi, M.; Blomberg, M.; Norling, A.; Ekman, B.; Lilliecreutz, C. Evaluation of Venous Plasma Glucose Measured by Point-of-Care Testing (Accu-Chek Inform II) and a Hospital Laboratory Hexokinase Method (Cobas C701) in Oral Glucose Tolerance Testing during Pregnancy—A Challenge in Diagnostic Accuracy. Scand. J. Clin. Lab. Investig. 2021, 81, 607–614. [Google Scholar] [CrossRef]
  34. Foss-Freitas, M.C.; de Andrade, R.C.; Figueiredo, R.C.; Pace, A.E.; Martinez, E.Z.; Dal Fabro, A.L.; Franco, L.J.; Foss, M.C. Comparison of Venous Plasma Glycemia and Capillary Glycemia for the Screening of Type 2 Diabetes Mellitus in the Japanese-Brazilian Community of Mombuca (Guatapará-SP). Diabetol. Metab. Syndr. 2010, 2, 6. [Google Scholar] [CrossRef]
  35. American Diabetes Association. Using Capillary Blood Glucose for Eligibility Screening in Community-Based Diabetes Prevention Study. Available online: https://professional.diabetes.org/abstract/using-capillary-blood-glucose-eligibility-screening-community-based-diabetes-prevention (accessed on 25 August 2022).
  36. American Diabetes Association. Understanding A1C Diagnosis. Available online: https://diabetes.org/diabetes/a1c/diagnosis (accessed on 25 August 2022).
  37. The Global Health Observatory. Available online: https://www.who.int/data/gho/indicator-metadata-registry/imr-details/2380 (accessed on 25 August 2022).
  38. Fluss, R.; Faraggi, D.; Reiser, B. Estimation of the Youden Index and Its Associated Cutoff Point. Biom. J. 2005, 47, 458–472. [Google Scholar] [CrossRef] [PubMed] [Green Version]
  39. Perkins, N.J.; Schisterman, E.F. The Youden Index and the Optimal Cut-Point Corrected for Measurement Error. Biom. J. 2005, 47, 428–441. [Google Scholar] [CrossRef] [PubMed]
  40. Zafari, N.; Lotfaliany, M.; Mansournia, M.A.; Khalili, D.; Azizi, F.; Hadaegh, F. Optimal Cut-Points of Different Anthropometric Indices and Their Joint Effect in Prediction of Type 2 Diabetes: Results of a Cohort Study. BMC Public Health 2018, 18, 691. [Google Scholar] [CrossRef] [PubMed] [Green Version]
  41. Baek, J.H.; Kim, H.; Kim, K.Y.; Jung, J. Insulin Resistance and the Risk of Diabetes and Dysglycemia in Korean General Adult Population. Diabetes Metab. J. 2018, 42, 296. [Google Scholar] [CrossRef]
  42. Xu, T.; Wang, J.; Fang, Y. A Model-Free Estimation for the Covariate-Adjusted Youden Index and Its Associated Cut-Point: A Model-Free Estimation for the Covariate-Adjusted Youden Index and Its Associated Cut-Point. Statist. Med. 2014, 33, 4963–4974. [Google Scholar] [CrossRef] [PubMed] [Green Version]
  43. Schisterman, E.F.; Perkins, N.J.; Liu, A.; Bondell, H. Optimal Cut-Point and Its Corresponding Youden Index to Discriminate Individuals Using Pooled Blood Samples. Epidemiology 2005, 16, 73–81. [Google Scholar] [CrossRef]
  44. Wu, Y.; Hu, H.; Cai, J.; Chen, R.; Zuo, X.; Cheng, H.; Yan, D. Machine Learning for Predicting the 3-Year Risk of Incident Diabetes in Chinese Adults. Front. Public Health 2021, 9, 626331. [Google Scholar] [CrossRef]
  45. Cai, X.; Zhu, Y.; Liu, S.; Wu, T.; Hong, J.; Ahmat, A.; Aierken, X.; Li, N. A Prediction Model Based on Noninvasive Indicators to Predict the 8-Year Incidence of Type 2 Diabetes in Patients with Nonalcoholic Fatty Liver Disease: A Population-Based Retrospective Cohort Study. BioMed Res. Int. 2021, 2021, 5527460. [Google Scholar] [CrossRef]
  46. Liu, Y.; Xiao, X.; Sun, C.; Tian, S.; Sun, Z.; Gao, Y.; Li, Y.; Cheng, J.; Lv, Y.; Li, M.; et al. Ideal Glycated Hemoglobin Cut-off Points for Screening Diabetes and Prediabetes in a Chinese Population. J. Diabetes Investig. 2016, 7, 695–702. [Google Scholar] [CrossRef] [Green Version]
  47. Mohapatra, S.K.; Swain, J.K.; Mohanty, M.N. Detection of Diabetes Using Multilayer Perceptron. In International Conference on Intelligent Computing and Applications; Bhaskar, M.A., Dash, S.S., Das, S., Panigrahi, B.K., Eds.; Advances in Intelligent Systems and Computing; Springer: Singapore, 2019; Volume 846, pp. 109–116. ISBN 9789811321818. [Google Scholar]
  48. Butt, U.M.; Letchmunan, S.; Ali, M.; Hassan, F.H.; Baqir, A.; Sherazi, H.H.R. Machine Learning Based Diabetes Classification and Prediction for Healthcare Applications. J. Healthc. Eng. 2021, 2021, 9930985. [Google Scholar] [CrossRef]
  49. Aishwarya, J.; Vakula, R.J. Performance Evaluation of Machine Learning Models for Diabetes Prediction. Int. J. Innov. Technol. Explor. Eng. (IJITEE) 2019, 8, 11. [Google Scholar] [CrossRef]
  50. Rajendra, P.; Latifi, S. Prediction of Diabetes Using Logistic Regression and Ensemble Techniques. Comput. Methods Programs Biomed. Update 2021, 1, 100032. [Google Scholar] [CrossRef]
  51. Joshi, R.D.; Dhakal, C.K. Predicting Type 2 Diabetes Using Logistic Regression and Machine Learning Approaches. Int. J. Environ. Res. Public Health 2021, 18, 7346. [Google Scholar] [CrossRef] [PubMed]
  52. Bani-Salameh, H.; Alkhatib, S.M.; Abdalla, M.; Al-Hami, M.; Banat, R.; Zyod, H.; Alkhatib, A.J. Prediction of Diabetes and Hypertension Using Multi-Layer Perceptron Neural Networks. Int. J. Model. Simul. Sci. Comput. 2021, 12, 2150012. [Google Scholar] [CrossRef]
  53. Oza, A.; Bokhare, A. Diabetes Prediction Using Logistic Regression and K-Nearest Neighbor. In Congress on Intelligent Systems; Springer: Singapore, 2022; pp. 407–418. [Google Scholar] [CrossRef]
  54. Diabetes Prediction Using Machine Learning KNN-Algorithm Technique. Available online: https://ijisrt.com/assets/upload/files/IJISRT22MAY682.pdf (accessed on 29 August 2022).
  55. Sarker, I.; Faruque, M.D.; Alqahtani, H.; Kalim, A. K-Nearest Neighbor Learning Based Diabetes Mellitus Prediction and Analysis for EHealth Services. ICST Trans. Scalable Inf. Sys. 2020, 7, 162737. [Google Scholar] [CrossRef]
  56. Posonia, A.M.; Vigneshwari, S.; Rani, D.J. Machine Learning Based Diabetes Prediction Using Decision Tree J48. In Proceedings of the 2020 3rd International Conference on Intelligent Sustainable Systems (ICISS), Thoothukudi, India, 3–5 December 2020; pp. 498–502. [Google Scholar]
  57. Ramezankhani, A.; Hadavandi, E.; Pournik, O.; Shahrabi, J.; Azizi, F.; Hadaegh, F. Decision Tree-Based Modelling for Identification of Potential Interactions between Type 2 Diabetes Risk Factors: A Decade Follow-up in a Middle East Prospective Cohort Study. BMJ Open 2016, 6, e013336. [Google Scholar] [CrossRef]
  58. Dwivedi, K.; Sharan, H.O.; Vishwakarma, V. Analysis of Decision Tree for Diabetes Prediction. Int. J. Eng. Tech. Res. (IJETR) 2019, 9, 3–6. [Google Scholar] [CrossRef]
  59. Permana, B.A.C.; Ahmad, R.; Bahtiar, H.; Sudianto, A.; Gunawan, I. Classification of Diabetes Disease Using Decision Tree Algorithm (C4.5). J. Phys. Conf. Ser. 2021, 1869, 012082. [Google Scholar] [CrossRef]
  60. Priya, K.L.; Charan Reddy Kypa, M.S.; Sudhan Reddy, M.M.; Mohan Reddy, G.R. A Novel Approach to Predict Diabetes by Using Naive Bayes Classifier. In Proceedings of the 2020 4th International Conference on Trends in Electronics and Informatics (ICOEI)(48184), Tirunelveli, India, 15–17 June 2020; pp. 603–607. [Google Scholar]
  61. Marathe, N.; Gawade, S.; Kanekar, A. Prediction of Heart Disease and Diabetes Using Naive Bayes Algorithm. Int. J. Sci. Res. Comput. Sci. Eng. Inf. Technol. 2021, 7, 447–453. [Google Scholar] [CrossRef]
  62. Prakash, A.; Anand, R.; Abinayaa, S.S.; Kalyan Chakravarthy, N.S. Normalized Naïve Bayes Model to Predict Type–2 Diabetes Mellitus. In Proceedings of the 2021 Emerging Trends in Industry 4.0 (ETI 4.0), Raigarh, India, 19–21 May 2021; pp. 1–5. [Google Scholar]
  63. Sharmila Agnal, E.S.A. Analyzing Diabetic Data Using Naive-Bayes Classifier. Eur. J. Mol. Amp Clin. Med. 2020, 7, 2687–2699. Available online: https://ejmcm.com/article_2022.html (accessed on 10 September 2022).
  64. Real Time Diabetes Prediction Using Naïve Bayes Classifier on Big Data of Healthcare. Available online: https://www.irjet.net/archives/V7/i5/IRJET-V7I521.pdf (accessed on 10 September 2022).
  65. VijiyaKumar, K.; Lavanya, B.; Nirmala, I.; Caroline, S.S. Random Forest Algorithm for the Prediction of Diabetes. In Proceedings of the 2019 IEEE International Conference on System, Computation, Automation and Networking (ICSCAN), Pondicherry, India, 29–30 March 2019; pp. 1–5. [Google Scholar] [CrossRef]
  66. Ooka, T.; Johno, H.; Nakamoto, K.; Yoda, Y.; Yokomichi, H.; Yamagata, Z. Random Forest Approach for Determining Risk Prediction and Predictive Factors of Type 2 Diabetes: Large-Scale Health Check-up Data in Japan. BMJNPH 2021, 4, 140–148. [Google Scholar] [CrossRef] [PubMed]
  67. Wang, X.; Zhai, M.; Ren, Z.; Ren, H.; Li, M.; Quan, D.; Chen, L.; Qiu, L. Exploratory Study on Classification of Diabetes Mellitus through a Combined Random Forest Classifier. BMC Med. Inform. Decis. Mak. 2021, 21, 105. [Google Scholar] [CrossRef] [PubMed]
  68. Diabetes Analysis and Prediction Using Random Forest, KNN, Naïve Bayes, and J48: An Ensemble Approach. Available online: http://www.ijstr.org/final-print/sep2019/Diabetes-Analysis-And-Prediction-Using-Random-Forest-Knn-Nave-Bayes-And-J48-An-Ensemble-Approach.pdf (accessed on 12 September 2022).
  69. Liu, Q.; Zhang, M.; He, Y.; Zhang, L.; Zou, J.; Yan, Y.; Guo, Y. Predicting the Risk of Incident Type 2 Diabetes Mellitus in Chinese Elderly Using Machine Learning Techniques. J. Pers. Med. 2022, 12, 905. [Google Scholar] [CrossRef] [PubMed]
  70. Xu, Z.; Wang, Z. A Risk Prediction Model for Type 2 Diabetes Based on Weighted Feature Selection of Random Forest and XGBoost Ensemble Classifier. In Proceedings of the 2019 Eleventh International Conference on Advanced Computational Intelligence (ICACI), Guilin, China, 7–9 June 2019; pp. 278–283. [Google Scholar] [CrossRef]
  71. Li, M.; Fu, X.; Li, D. Diabetes Prediction Based on XGBoost Algorithm. IOP Conf. Ser. Mater. Sci. Eng. 2020, 768, 072093. [Google Scholar] [CrossRef]
  72. Behera, D.K.; Dash, S.; Behera, A.K.; Dash, C.H.S.K. Extreme Gradient Boosting and Soft Voting Ensemble Classifier for Diabetes Prediction. In Proceedings of the 2021 19th OITS International Conference on Information Technology (OCIT), Bhubaneswar, India, 16–18 December 2021; pp. 191–195. [Google Scholar] [CrossRef]
  73. Wang, L.; Wang, X.; Chen, A.; Jin, X.; Che, H. Prediction of Type 2 Diabetes Risk and Its Effect Evaluation Based on the XGBoost Model. Healthcare 2020, 8, 247. [Google Scholar] [CrossRef]
  74. Chen, Y.; Zhang, X.-P.; Yuan, J.; Cai, B.; Wang, X.-L.; Wu, X.-L.; Zhang, Y.-H.; Zhang, X.-Y.; Yin, T.; Zhu, X.-H.; et al. Association of Body Mass Index and Age with Incident Diabetes in Chinese Adults: A Population-Based Cohort Study. BMJ Open 2018, 8, e021768. [Google Scholar] [CrossRef] [Green Version]
  75. Okamura, T.; Hashimoto, Y.; Hamaguchi, M.; Obora, A.; Kojima, T.; Fukui, M. Low Urine PH Is a Risk for Non-Alcoholic Fatty Liver Disease: A Population-Based Longitudinal Study. Clin. Res. Hepatol. Gastroenterol. 2018, 42, 570–576. [Google Scholar] [CrossRef]
  76. National Health Insurance Sharing Service (NHISS) Korea. Available online: https://nhiss.nhis.or.kr/bd/ab/bdabf003cv.do (accessed on 30 June 2022).
  77. PIMA Indian Diabetes Dataset. Available online: https://www.kaggle.com/datasets/uciml/pima-indians-diabetes-database (accessed on 30 June 2022).
  78. The Sex Independent Angle of Type 2 Diabetes. Available online: https://data.mendeley.com/datasets/dtxy4j6pcn/1 (accessed on 30 June 2022).
  79. [NeurIPS 2020] Data Science for COVID19 (DS4C). Available online: https://www.kaggle.com/datasets/kimjihoo/coronavirusdataset (accessed on 17 October 2022).
  80. Chun, S.-Y.; Kim, D.W.; Lee, S.A.; Lee, S.J.; Chang, J.H.; Choi, Y.J.; Kim, S.W.; Song, S.O. Does Diabetes Increase the Risk of Contracting COVID-19? A Population-Based Study in Korea. Diabetes Metab. J. 2020, 44, 897–907. [Google Scholar] [CrossRef]
  81. You, J.H.; Lee, S.A.; Chun, S.-Y.; Song, S.O.; Lee, B.-W.; Kim, D.J.; Boyko, E.J. Clinical Outcomes of COVID-19 Patients with Type 2 Diabetes: A Population-Based Study in Korea. Endocrinol. Metab. 2020, 35, 901–908. [Google Scholar] [CrossRef]
  82. Guidelines for the Prevention, Management, and Care of Diabetes Mellitus. Available online: https://applications.emro.who.int/dsaf/dsa664.pdf (accessed on 26 August 2022).
  83. Diagnosis and Management of Type 2 Diabetes. Available online: https://apps.who.int/iris/rest/bitstreams/1274478/retrieve (accessed on 26 August 2022).
  84. Diabetes Risk Factors. Available online: https://www.cdc.gov/diabetes/basics/risk-factors.html (accessed on 26 August 2022).
  85. Ramnanansingh, T.G.; Nayak, S.B. Application of a Novel Sex Independent Anthropometric Index, Termed Angle Index, in Relation to Type 2 Diabetes: A Trinidadian Case–Control Study. BMJ Open 2019, 9, e024029. [Google Scholar] [CrossRef] [Green Version]
  86. Singhal, R.; Rana, R. Chi-Square Test and Its Application in Hypothesis Testing. J. Pract. Cardiovasc. Sci. 2015, 1, 69. [Google Scholar] [CrossRef]
  87. Franke, T.M.; Ho, T.; Christie, C.A. The Chi-Square Test: Often Used and More Often Misinterpreted. Am. J. Eval. 2012, 33, 448–458. [Google Scholar] [CrossRef]
  88. Trevethan, R. Sensitivity, Specificity, and Predictive Values: Foundations, Pliabilities, and Pitfalls in Research and Practice. Front. Public Health 2017, 5, 307. [Google Scholar] [CrossRef]
  89. Lee, Y.; Bang, H.; Kim, H.C.; Kim, H.M.; Park, S.W.; Kim, D.J. A Simple Screening Score for Diabetes for the Korean Population. Diabetes Care 2012, 35, 1723–1730. [Google Scholar] [CrossRef] [PubMed] [Green Version]
  90. Bang, H. Development and Validation of a Patient Self-Assessment Score for Diabetes Risk. Ann. Intern. Med. 2009, 151, 775. [Google Scholar] [CrossRef]
  91. Kwon, K.-S.; Bang, H.; Bomback, A.S.; Koh, D.-H.; Yum, J.-H.; Lee, J.-H.; Lee, S.; Park, S.K.; Yoo, K.-Y.; Park, S.K.; et al. A Simple Prediction Score for Kidney Disease in the Korean Population: Prediction of Kidney Disease. Nephrology 2012, 17, 278–284. [Google Scholar] [CrossRef]
  92. Hypertension Control. Available online: http://apps.who.int/iris/bitstream/handle/10665/38276/WHO_TRS_862.pdf?sequence=1 (accessed on 24 August 2022).
  93. Li, S.; Guo, S.; He, F.; Zhang, M.; He, J.; Yan, Y.; Ding, Y.; Zhang, J.; Liu, J.; Guo, H.; et al. Prevalence of Diabetes Mellitus and Impaired Fasting Glucose, Associated with Risk Factors in Rural Kazakh Adults in Xinjiang, China. Int. J. Environ. Res. Public Health 2015, 12, 554–565. [Google Scholar] [CrossRef]
  94. Wu, M.; Wen, J.; Qin, Y.; Zhao, H.; Pan, X.; Su, J.; Du, W.; Pan, E.; Zhang, Q.; Zhang, N.; et al. Familial History of Diabetes Is Associated with Poor Glycaemic Control in Type 2 Diabetics: A Cross-Sectional Study. Sci. Rep. 2017, 7, 1432. [Google Scholar] [CrossRef] [Green Version]
  95. Unal, I. Defining an Optimal Cut-Point Value in ROC Analysis: An Alternative Approach. Comput. Math. Methods Med. 2017, 2017, 3762651. [Google Scholar] [CrossRef]
  96. Parikh, R.; Mathai, A.; Parikh, S.; Chandra Sekhar, G.; Thomas, R. Understanding and Using Sensitivity, Specificity and Predictive Values. Indian J. Ophthalmol. 2008, 56, 45. [Google Scholar] [CrossRef]
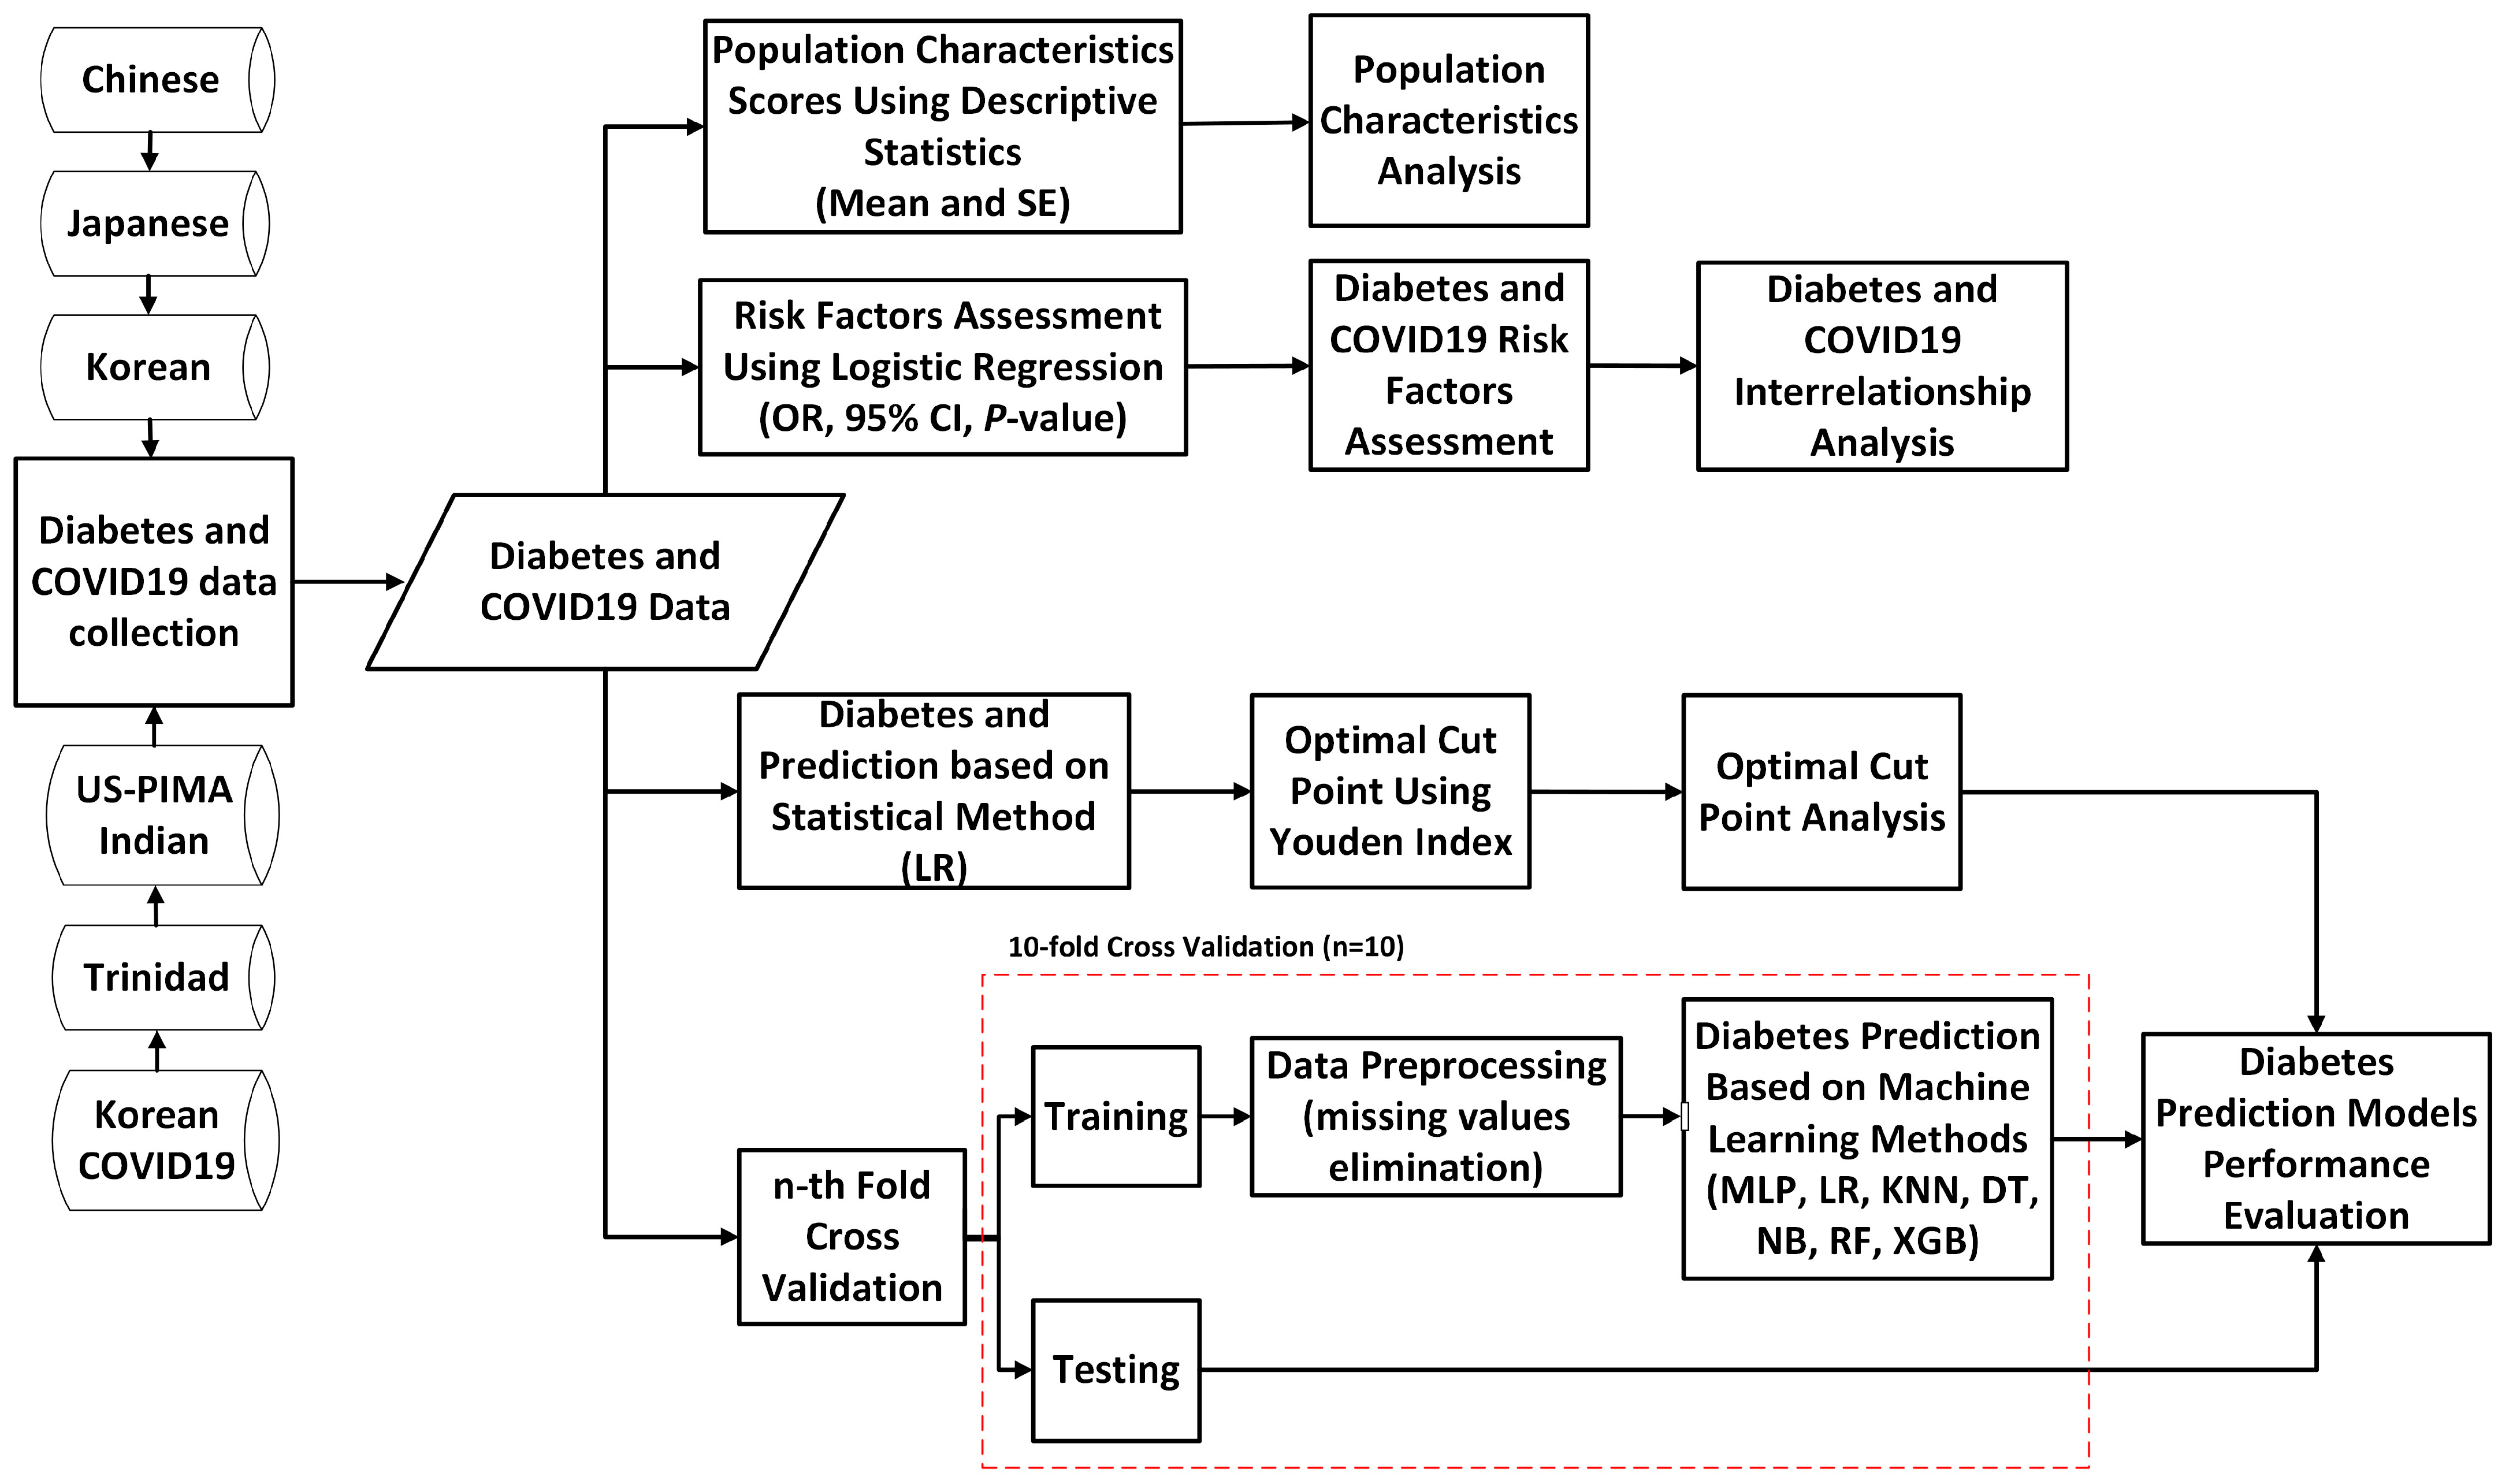
Figure 1. A flowchart of the proposed study design.
Mathematics 10 04027 g001
Figure 2. Sensitivity, specificity, PPV, and NPV for FPG in the Chinese adult population based on ADA and WHO cut point recommendations compared to the optimal cut point.
Mathematics 10 04027 g002
Figure 3. ROC curve for FPG values as a screening test on the Chinese diabetes dataset. FPG was used as the gold standard; the straight line represents the reference line.
Mathematics 10 04027 g003
Figure 4. Sensitivity, specificity, PPV, and NPV for (a) FPG and (b) HbA1c in the Japanese adult population based on ADA and WHO cut point recommendations compared to the optimal cut point.
Mathematics 10 04027 g004
Figure 5. ROC curve for (a) FPG and (b) HbA1c values as a screening test on the Japanese diabetes adult population; FPG and HbA1c were used as the gold standard; the straight line represents the reference line.
Mathematics 10 04027 g005
Figure 6. Sensitivity, specificity, PPV, and NPV for FBS in the Korean adult population based on ADA and WHO cut point recommendations compared to the optimal cut point.
Mathematics 10 04027 g006
Figure 7. Sensitivity, specificity, PPV, and NPV for 2hPG in the US-PIMA Indian adult population based on ADA and WHO cut point recommendations compared to the optimal cut point.
Mathematics 10 04027 g007
Figure 8. Sensitivity, specificity, PPV, and NPV for FBS in the Trinidadian adult population based on ADA and WHO cut point recommendations compared to the optimal cut point.
Mathematics 10 04027 g008
Figure 9. ROC curve for FBS values as a screening test on the Korean adult population; FBS was used as the gold standard; the straight line represents the reference line.
Mathematics 10 04027 g009
Figure 10. ROC curve for 2hPG values as a screening test on the US-PIMA Indian adult population; 2hPG was used as the gold standard; the straight line represents the reference line.
Mathematics 10 04027 g010
Figure 11. ROC curve for FBG values as a screening test on Trinidadian adult population; FBG was used as the gold standard; the straight line represents the reference line.
Mathematics 10 04027 g011
Figure 12. The results of diabetes prediction based on machine learning models on (a) Chinese, (b) Japanese, (c) Korean, (d) US-PIMA Indian, and (e) Trinidadian adult population samples.
Mathematics 10 04027 g012aMathematics 10 04027 g012b
Table 1. Characteristics of the population representing China, Japan, Korea, US-PIMA Indian, and Trinidad.
CharacteristicChina Population
(n = 211,833)
Japan Population
(n = 15,464)
Korea Population
(n = 837,174)
US-PIMA Indian Population (n = 768)Trinidad Population
(n = 121)
Age, year42.1 ± 0.02743.71 ± 0.07243.19 ± 0.01833.25 ± 0.424-
Male/Female, %54.82/45.1845.49/54.5157.40/42.60--
BMI, kg/m223.24 ± 0.00722.12 ± 0.02523.59 ± 0.003631.99 ± 0.28429.18 ± 0.70
Obesity Status, % (WHO/Asia Criteria)
-
BMI < 25/BMI < 23
-
25 ≤ BMI < 30/23 ≤ BMI < 27.5
-
30 ≤ BMI < 40/27.5 ≤ BMI < 35
-
BMI ≥ 40/BMI ≥ 35


71.28/49.60
25.47/39.64
3.23/10.52
0.02/0.24


83.68/65.08
14.60/29.46
1.71/5.30
0.01/0.16


68.91/44.91
27.33/43.56
3.75/11.18
0.01/0.35


15.23/7.94
23.31/17.97
48.70/41.80
12.76/32.29


25.62/11.57
38.02/33.88
30.58/43.80
5.79/10.74
SBP/
DBP, mmHg
119.06 ± 0.04/
74.18 ± 0.02
114.50 ± 0.12/
71.58 ± 0.08
120.18 ± 0.02/
74.96 ± 0.01
-/
79.11 ± 0.70
145.12 ± 1.94/
87.24 ± 0.98
Family history of diabetes, %2.05----
Exercise, %-17.52---
Current smoker, %28.4341.60---
Alcohol intake, %28.4323.66---
Outcomes-related
-
Fasting Plasma Glucose (FPG), mg/dL
-
Hemoglobin HbA1c,%
-
2-h plasma glucose (2hPG), mg/dL
-
Cholesterol, mg/dL
-
Triglyceride, mg/dL
-
HDL, mg/dL
-
LDL, mg/dL
-
ALT, U/L
-
AST, U/L
Diabetes based on lab tests, %

88.47 ± 0.02

-
-

82.78 ± 0.04
23.55 ± 0.04
24.70 ± 0.02
49.83 ± 0.04
23.95 ± 0.05
24.08 ± 0.04
1.97

-

5.17 ± 0.003
92.97 ± 0.06

198.20 ± 0.27
80.79 ± 0.47
56.54 ± 0.13
-
19.99 ± 012
18.40 ± 0.07
2.41

98.71 ± 0.03

-
-

-
-
-
-
-
-
11.53

-

-
120.89 ± 1.15

-
-
-
-
-
-
34.90

126.24 ± 5.19

-
-

191.09 ± 4.38
157.46 ± 9.30
47.08 ± 1.19
111.73 ± 4.00
-
-
58.68
Table 2. Chinese adults’ diabetes score in the Chinese diabetes dataset (4174 diabetes cases, n = 211,833, AUC = 0.97).
Diabetes Risk FactorsOR (95% CI)p-Value
Age, year
   35–442.91 (2.54–3.34)<0.001
   ≥4511.18 (9.92–12.59)<0.001
Male, %2.14 (2.00–2.29)<0.001
BMI, kg/m2 (Asia criteria)
   23–27.43.83 (3.51–4.17)<0.001
   ≥27.59.56 (8.72–10.49)<0.001
Hypertension (based on SBP/DBP)3.16 (2.96–3.37)<0.001
Cholesterol, mg/dL1.99 (1.87–2.12)<0.001
Triglyceride, mg/dL0.99 (0.24–4.02)<0.001
Smoking0.98 (0.92–1.05)<0.001
Alcohol0.98 (0.92–1.05)<0.001
Family history of diabetes2.08 (1.78–2.43)<0.001
Table 3. Japanese adults’ diabetes score in the Japanese diabetes dataset (373 diabetes cases, n = 15,464, AUC = 0.80).
Diabetes Risk FactorsOR (95% CI)p-Value
Age, year
   35–442.65 (1.50–2.58)0.230
   ≥454.53 (2.58–7.95)<0.001
Male, %2.80 (2.20–3.57)<0.001
BMI, kg/m2 (Asia criteria)
   23–27.42.97 (2.35–3.76)<0.001
   ≥27.58.78 (6.59–11.68)<0.001
Hypertension (based on SBP/DBP)2.81 (2.23–3.53)<0.001
Cholesterol, mg/dL1.94 (1.57–2.40)<0.001
Triglyceride, mg/dL5.10 (2.07–3.16)<0.001
Smoking2.25 (1.82–2.78)<0.001
Alcohol1.31 (1.04–1.64)0.534
Exercise0.74 (0.55–1.00)<0.001
Table 4. Korean adults’ diabetes Score in the Korean diabetes dataset (96,512 diabetes cases, n = 837,174, AUC = 0.85).
Diabetes Risk FactorsOR (95% CI)p-Value
Male, %1.11 (1.10–1.13)<0.001
Age, year
   35–444.33 (4.16–4.51)<0.001
   ≥4524.11 (23.28–24.96)<0.001
BMI, kg/m2 (Asia criteria)
   23–27.42.01 (1.98–2.04)<0.001
   ≥27.53.04 (2.98–3.10)<0.001
Hypertension (based on SBP/DBP)1.98 (1.95–2.01)<0.001
Table 5. US-PIMA Indian adults’ diabetes score in the US-PIMA Indian diabetes dataset (268 diabetes cases, n = 768, AUC = 0.79).
Diabetes Risk FactorsOR (95% CI)p-Value
Age, year
   35–443.08 (2.10–4.51)<0.001
   ≥452.83 (1.91–4.20)<0.001
BMI, kg/m2 (WHO criteria)
   25–303.45 (1.61–7.43)0.350
   ≥3010.32 (5.10–20.87)<0.001
Hypertension (based on DBP)1.69 (1.22–2.35)0.678
Table 6. Trinidadian adults’ diabetes score in the Trinidadian diabetes dataset (71 diabetes cases, n = 121, AUC= 0.905).
Diabetes Risk FactorsOR (95% CI)p-Value
BMI, kg/m2 (WHO criteria)
   25–301.80 (0.72–4.52)0.410
   ≥303.69 (1.39–9.78)0.432
Hypertension (based on SBP/DBP)1.99 (0.95–4.16)0.485
Cholesterol, mg/dL1.04 (0.50–2.17)0.691
Triglycerides, mg/dL1.78 (0.84–3.77)0.601
Table 7. Korean diabetes COVID-19 scores in the KCDC COVID-19 dataset (3496 COVID-19 cases, n = 20,976, AUC= 0.52).
Risk FactorsOR (95% CI)p-Value
Age, year
   <208.69 (2.53–29.91)<0.001
   20–292.76 (1.26–6.03)<0.001
   30–392.43 (1.57–3.75)<0.001
   40–491.27 (0.93–1.74)<0.001
   50–591.33 (1.08–1.66)<0.001
   60–695.18 (4.10–6.55)<0.001
   ≥703.62 (2.71–4.83)<0.001
Gender
   Male1.16 (1.20–1.33)<0.001
   Female1.28 (1.12–1.47)<0.001
Diabetes1.21 (1.10–1.34)<0.001
Table 8. Performance of diabetes score in the Chinese, Japanese, Korean, US-PIMA Indian, and Trinidadian adult populations.
Model PopulationChineseJapaneseKoreanUS-PIMA IndianTrinidadian
Diagnostic TestFPGFPGHbA1CFBS2hPGFBG
Cut point as recommended by ADA and WHO≥7 mmol/L≥5.6 mmol/L≥5.7%≥126 mg/dL≥140 mg/dL≥126 mg/dL
Optimal cut point6.2055.5235.375105.50–106.50 123.50107.50
Percentage of high risk, ADA and WHO/optimal cut points (%)1.96/4.0916.94/20.376.38/32.137.47/20.7025.65/41.9335.59/50.85
Sensitivity, ADA, and WHO/optimal cut points (%)81.93/88.9561.66/67.2936.19/76.2646.26/72.6950.37/70.1565.22/81.16
Specificity, ADA, and WHO/optimal cut points (%)100/97.4484.16/80.7994.35/68.9197.59/86.0787.60/73.20100/91.84
PPV, ADA, and WHO/optimal cut points (%)100/41.078.78/7.9713.68/5.5771.41/40.4868.53/58.39100/93.33
NPV, ADA, and WHO/optimal cut points (%)99.64/99.7798.89/99.0198.36/99.0993.31/96.0376.71/82.0667.12/77.59
LR+, ADA, and WHO/optimal cut points~/34.753.89/3.506.41/2.3919.17/5.224.06/2.62~/9.942
LR−, ADA, and WHO/optimal cut points0.18/0.110.46/0.400.68/0.370.55/0.320.57/0.410.35/0.205
Youden index, ADA, and WHO/optimal cut points (%)81.92/86.3945.82/48.0830.55/43.1743.85/58.7637.97/43.3565.22/73.00
AUC0.970.800.780.850.790.905
SE0.0020.0120.0130.0010.0170.028
95% CI0.965–0.9720.782–0.8280.752–0.8040.847–0.8500.755–0.8220.850–0.960
p-value<0.001<0.001<0.001<0.001<0.001<0.001
Table 9. Performance of proposed study as compared to earlier works for diabetes prediction in Chinese, Japanese, Korean, US-PIMA Indian, and Trinidadian datasets.
DatasetAuthorYearMethodAUC
ChineseWu et al. [44]2021XGBoost0.93
Proposed study2022LR0.97
Japanese (NAFLD)Cai et al. [45]2021Cox regression0.80
Proposed study2022LR0.80
Korean (NHISS)Alfian et al. [6]2020DNN + RFE0.80
Proposed study2022LR0.85
US-PIMA IndianSarker et al. [55]2018Optimal KNN0.73
Aiswarya and Vakula [49]2019LR0.736
Bani-Salameh et al. [52]2021MLP0.77
Proposed study2022LR0.79
TrinidadianRamnansingh and Nayak [85]2019Binomial LR0.72
Proposed study2022LR0.905
Publisher’s Note: MDPI stays neutral with regard to jurisdictional claims in published maps and institutional affiliations.