Article

Evaluation of Rock Brittleness Based on Complete Stress–Strain Curve

1
School of Transportation and Civil Engineering, Nantong University, Nantong 226000, China
2
Key Laboratory of Safety and High-Efficiency Coal Mining, Ministry of Education, Anhui University of Science and Technology, Huainan 232001, China
*
Author to whom correspondence should be addressed.
Mathematics 2022, 10(23), 4470; https://doi.org/10.3390/math10234470
Submission received: 7 November 2022 / Revised: 22 November 2022 / Accepted: 23 November 2022 / Published: 26 November 2022

Abstract

:
As a basic mechanical property of rocks, brittleness is closely related to the drillability, wellbore stability, and rockburst characteristics of reservoir rocks. Accurate evaluation of rock brittleness is of great significance for guiding oil and gas production and reservoir reconstruction. This paper systematically introduced the commonly used brittleness evaluation methods based on the stress–strain curve and analyzed their theoretical background and mathematical models. Combined with practical engineering application, the characterization effect of commonly used brittleness indexes in various rock samples is verified and optimized, and it is obtained that the brittleness index (B17 in this paper), based on the stress–strain curve and considering energy conversion, has the best characterization result for rock brittleness, which has good differentiation for different rock samples. At the same time, considering that the stress–strain curve under high confining pressure may result in a significant yield plateau phenomenon before and after the peak strength, the endpoint of the plastic yield plateau is used to replace the peak point as the starting point for the drop of bearing capacity. The revised brittleness index is consistent with the changing trend of the original curve, which verifies the reliability of the model. Finally, the method for characterizing the brittleness of Class II curves is supplemented, and the combined brittleness index of rock is established, which verifies the rationality and correctness of the index and provide a more general evaluation method for rock brittleness in engineering.

1. Introduction

The brittleness of rock refers to the property that the bearing capacity of rock will be rapidly lost when it produces minimal plastic deformation in the process of loading. As an important basic mechanical property of rocks, brittleness is closely related to reservoir rock drillability [1,2,3], well wall stability [4,5], rockburst characteristics [6,7,8], etc. Brittleness assessment has an important reference value for the safety of some tunnel support projects and destabilization aspects of block collapse [9,10]. Effective evaluation of rock brittleness is of great significance for the guidance of oil and gas production and reservoir reconstruction.
At present, researchers have established various brittleness evaluation indicators in terms of rock mineral composition and porosity [11,12,13,14,15,16], rock strength parameter [17,18,19,20,21], Young’s modulus and Poisson’s ratio [22,23,24], hardness and fracture toughness [25,26,27], impact penetration test [28], acoustic emission characteristics [29,30,31,32], etc. An effective and direct method to evaluate rock brittleness is by using characteristic parameters from full stress–strain curves obtained from laboratory mechanical experiments. Therefore, most of the new brittleness indexes in recent years are based on the stress–strain curve of rock [33]. Whether from the perspective of energy accumulation and dissipation or the perspective of the characteristics of the stress–strain curve, such indicators have a clear physical significance, and the parameters are relatively simple to obtain.
Due to the lack of corresponding theoretical background, the conclusions of some brittleness indexes used to evaluate rock brittleness are contradictory. The reliable and applicable brittleness index should not only have a sufficient scientific basis, but it should also cover the entire rock fracture process. In this paper, from the point of view of the complete stress–strain curve of rock, the commonly used and the latest brittle evaluation indexes are analyzed. Combined with the typical stress–strain curves obtained in practical engineering, the applicability of various brittleness indexes is verified and optimized, and the brittleness calculation method of rock class II curve is supplemented in order to provide a more general evaluation method for brittleness evaluation in rock engineering.

2. Research Progress of Rock Brittleness Evaluation Based on Stress–Strain Curve

Obtaining mechanical parameters such as rock strain and strength by triaxial compression test is the most common method to study the characteristics of rock failure, and it is also one of the more intuitive means to study rock brittleness. Due to the difference in lithology and loading conditions, different rocks will show different stress–strain curve characteristics, but after simplification, they can all be described by the four curves in Figure 1. In fact, the pre-peak stage of the stress–strain curve of different rocks is similar and can be roughly divided into four stages, the difference is that the proportions of each stage are different. The first stage is the initial compaction stage (AB segment). The primary cracks in the rock are compacted under small external forces, and the curve is concave. The endpoint of this stage is the crack closure stress. Second is the elastic deformation stage (BC segment). The stress–strain curve at this stage is approximately a straight line, and the elastic modulus of rock can be determined by the slope of the stress–strain curve at this stage. The endpoint of this stage is the crack initiation stress. Third is the stable crack growth stage (CD segment). With the increase of the load, new cracks are initiated, and the evolution speed of lateral strain starts to increase. In this stage, the crack damage stress (also known as long-term strength of rock [34,35,36]) is the endpoint. Finally, there is the unstable crack growth stage (DE segment). The internal microcracks of the rock are interconnected and form a macro tension or shear band, and the rock is subject to macro failure. In this stage, the peak stress is the endpoint.
At the post peak stage, due to the difference between the test method and the mechanical properties of the rock itself, the stress–strain curve may have significant differences in morphology. If limited by the response rate of the testing machine, it may not be possible to obtain a complete post peak curve, which is represented by curve ①. It is also possible to obtain a complete post peak curve when the rock reaches the balance of the next stage, which is represented by curve ②, and the tortuous part represents the characteristics of unsteady failure. Of course, for most rocks, in the triaxial compression test, the post peak stage will show strain softening, that is, with the increase of strain, the stress will gradually drop, which is represented by curve ③. In addition, when the confining pressure is large enough, a plastic yield platform appears in some rocks after the stress reaches the peak value, showing the brittle plastic transformation characteristics, which is represented by curve ④.
A large number of triaxial compression tests show that the brittle failure of rock is closely related to the whole process of its internal microcrack initiation, propagation, penetration and failure. As the embodiment of rock mechanical properties, the stress–strain curve reflects the whole process of rock from deformation to ultimate loss of bearing capacity under external load [37]. Use of the full stress–strain curve is an effective means to obtain characteristic parameters for the evaluation of rock brittleness. Therefore, many scholars have proposed a variety of methods to characterize rock brittleness based on the full stress–strain curve.

2.1. Brittleness Index Based on Stress–Strain Curve and Characteristic Parameters

In recent years, many scholars have conducted in-depth and detailed discussions on the evaluation of rock brittleness based on the stress–strain curve. For instance, the rock brittleness index (B1) established by Bishop (1967) [21] is related to the post-peak stress drop. The greater the stress drop, the stronger the rock brittleness. Hucka and Das (1974) [17] defined the brittleness index as the ratio of the elastic strain to the total strain (B2) when the rock fails. Andreev (1995) [38] defined brittleness as a lack of ability to withstand plastic deformation, used the absolute plastic strain before rock failure as an index (B3) to characterize rock brittleness, and used 0.3 and 0.5 as the characteristic values for brittle and ductile failure. The brittleness index reflects the influence of confining pressure on plastic deformation, but ignores the post-peak damage state, which may be inconsistent with the actual situation in an engineering application.
Li et al., (2012) [39] believed that the pre-peak and post-peak stages should be considered to characterize the brittleness of rocks and proposed the brittleness index (B4) based on the full stress–strain curve. Zhou et al., (2014) [40] put forward the brittleness evaluation index (B5), which considers both the relative value and the absolute rate of the post-peak stress drop of the rock mass, but the improved brittleness index only considers the post-peak stress–strain state and does not consider the influence of the pre-peak mechanical behavior changes on rock brittleness. Since then, Chen et al., (2018) [41] have established a new brittleness index (B6) by comprehensively considering the pre-peak stress growth rate and post-peak stress drop rate. Liu et al., (2019) [42] proposed a brittleness evaluation method (B7) based on post-peak stress drop rate and pre-peak brittleness damage failure difficulty, explored the influence of the variation of different rock meso-structure parameters on the degree of rock brittleness based on PFC2D software, and analyzed the relationship between different meso-structure parameters and the degree of brittleness, indicating that the established brittleness index can better reflect the brittleness differences of different rock samples. Cao et al., (2020) [43] concluded that post-peak brittle failure of granite should satisfy both the conditions of fast stress drop rate and fast strain growth rate, and proposed a new brittleness evaluation index (B8) that can reflect the whole process of granite deformation and damage, and combined this with a test to verify that the proposed brittleness index can accurately reflect the brittleness characteristics of granite with different moisture content. Zhang et al., (2021) [44] proposed a new method for evaluating the brittleness characteristics of rocks (B9) by considering the pre-peak stress growth rate, growth magnitude and post-peak stress–strain relationship. It was verified through experimental data that this brittleness index can not only accurately evaluate the brittleness of different rocks (marble, tuff, sandstone and granite), but also better reflect the brittle characteristics of rocks under complex stress states. Kuang et al., (2022) [45] proposed a new brittleness evaluation index (B10) that simultaneously considers the pre-peak stress growth rate, post-peak stress drop rate and the combined strain relationship at the peak point. The index has a clear physical meaning and can reflect the change in brittleness of various types of rocks under confining pressure. Several common brittleness indexes based on the shape of stress–strain curve and characteristic parameters are shown in Table 1.
It can be seen from Table 1 that the pre-peak curve reflects the ability of the rock to resist inelastic deformation before damage, while the post-peak curve reflects the magnitude of the bearing capacity of the rock after damage, and a sole consideration of the pre-peak or post-peak curve form cannot fully reflect the rock brittleness. The study shows that the smaller the total strain of the rock before stress damage, the steeper the straight-line section before the peak, the larger the post-peak stress drop, and the faster the stress drop is under that same post-peak stress drop, the stronger the brittleness is.

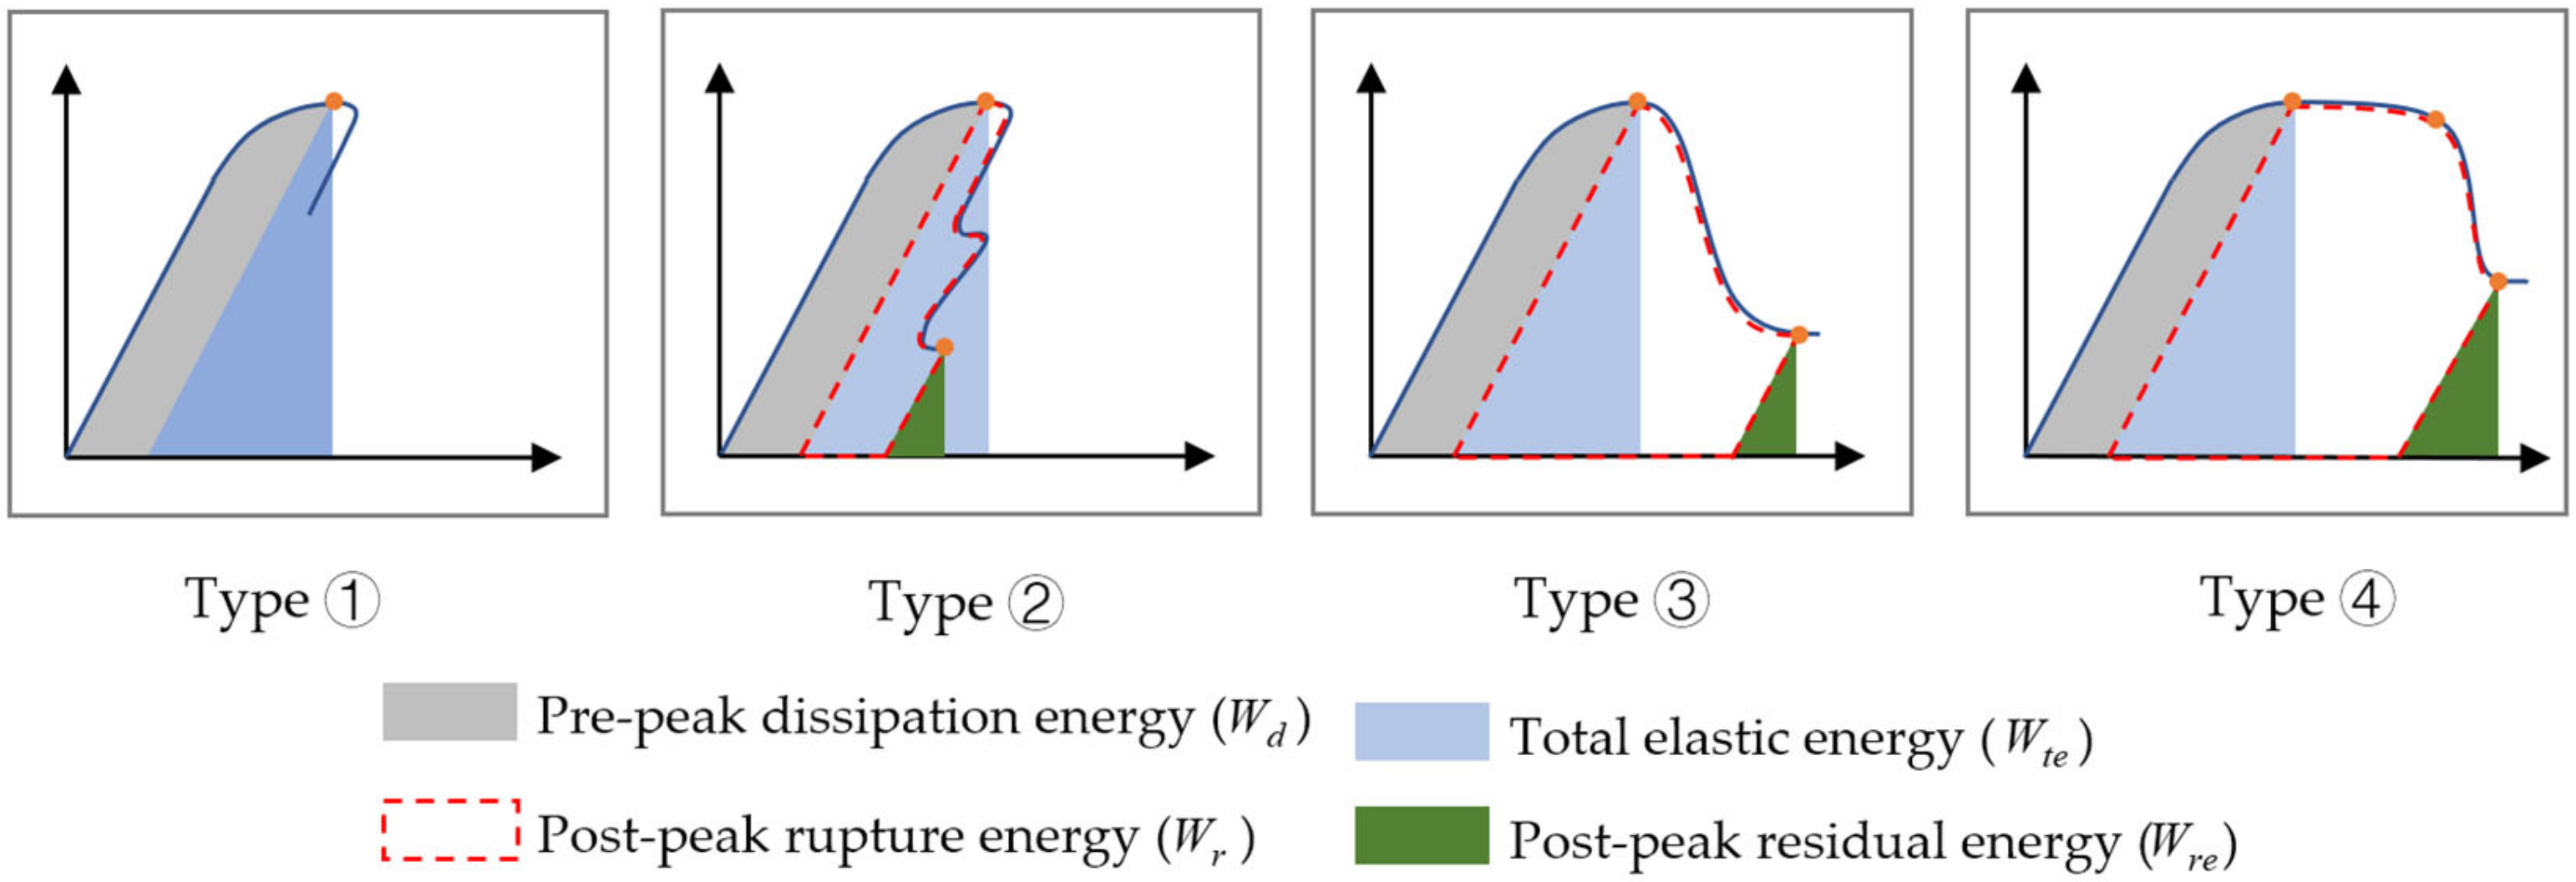
2.2. Brittleness Index Based on Stress–Strain Curve and Energy Evolution

In essence, rock deformation and failure are the comprehensive results of energy dissipation and energy release. Energy dissipation is mainly used to induce rock damage, leading to deterioration of rock properties and loss of strength. Energy release is the internal cause of sudden rock failure [46]. Therefore, the establishment of brittleness index from the perspective of energy can better reflect the nature of rock failure.
Hucka and Das (1974) [17] believed that the energy source of rock fracture was the elastic energy stored in the rock and defined the brittleness index (B11) as the ratio of elastic strain energy to the total energy at the peak point. Although the index considered the energy before the peak, it did not describe the energy release after the peak. Based on the post-peak energy balance theory, Tarasov and Potvin (2013) [47] proposed the use of the ratio of post-peak fracture energy or post-peak additional (released) energy to the elastic energy consumed in the whole process as the brittleness index (B12 and B12’). The brittleness index can describe the Class I and Class II brittle failure behavior of rocks and can reflect the whole process of brittle ductile transformation of rocks. It has good monotonicity and continuity, but there are also some problems. For example, the stress–strain curves ABG and ABE in Figure 2 have the same pre-peak behavior and post-peak modulus, and the results are the same when characterized by the brittleness indexes B12 and B12’, though obviously the two curves have different brittle failure characteristics.
Xia et al., (2016) [48] proposed a rock brittleness index (B13) characterized by the ratio of the post-peak stress drop rate of the rock and the elastic energy released during rock destruction to the total energy stored before the peak. The greater the index, the higher the brittleness of rock. Ai et al., (2016) [49] believed that more reasonable rock brittleness evaluation indicators should include: (1) the ability of materials to resist inelastic deformation before failure; (2) the decline of rock bearing capacity after brittle failure; (3) cohesion and friction of rock materials; and (4) the whole process from brittleness to plasticity. In addition, the evaluation results should be continuous and monotonous. On this basis, a new brittleness index (B14, B15) is defined based on the fracture energy, post-peak release energy and pre-peak dissipation energy. It is found that the brittleness of different rocks (red sandstone, shale and granite) changes differently with the increase of confining pressure. Zhang et al., (2017) [50] believed that the dissipated energy before the peak and the fracture energy after the peak are the essential factors determining whether brittle fracture occurs in rocks. Considering the energy evolution in the whole process of rock failure, a new brittleness index (B16) is established based on the linear elastic modulus, yield modulus and weakening modulus of the curve. It is found that the pre-peak dissipation energy and post-peak fracture energy of different rock materials increase with the increase of confining pressure, and that the brittle plastic transformation occurs in the rocks, but that the granite maintained strong brittleness. Kivi et al., (2018) [51] considered that the smaller the plastic deformation in the yield stage of the pre-peak region, the stronger the fracture process in the post-peak stage, and the more brittle the material character. Based on energy conversion, a new brittleness index (B17) is established, which describes the degree of plastic yield deformation, and the degree and rate of strength degradation during rock failure. However, this index only considers Class I failure behavior of rock, and whether it is applicable to Class II failure remains to be discussed. Chen et al., (2020) [52] concluded that the higher the pre-peak accumulation rate and post-peak dissipation rate of rocks, the stronger their brittleness. Therefore, they established the brittleness index (B18) based on the whole process of elastic energy evolution, analyzed the influence of confining pressure and water pressure on the brittleness of different rocks, and verified the rationality of the brittleness index through laboratory tests. Wen et al., (2021) [53] believed that the ideal brittle rock has no energy dissipation process before the stress reaches the peak strength. Considering the energy evolution characteristics of the rock before and after the peak, they established the brittleness index evaluation method (B19) to comprehensively describe the brittleness of the rock. This index only considers the energy evolution characteristics of the rock’s Class I curve and does not involve the rock’s Class II curve. Gong et al., (2022) [54] established a new brittleness index (B20) based on the dissipation ratio of peak elastic strain energy to failure energy and residual elastic strain energy. Combined with triaxial compression tests of different rocks, it verified the universality of the brittleness index to evaluate rocks. Some common brittleness indexes based on the stress–strain curve and energy evolution are shown in Table 2.
It can be seen from Table 2 that the dissipated energy, fracture energy and consumed elastic energy can reflect the brittleness characteristics of rocks. Combining different energies can reflect the ability of rock to resist inelastic deformation and crack propagation.

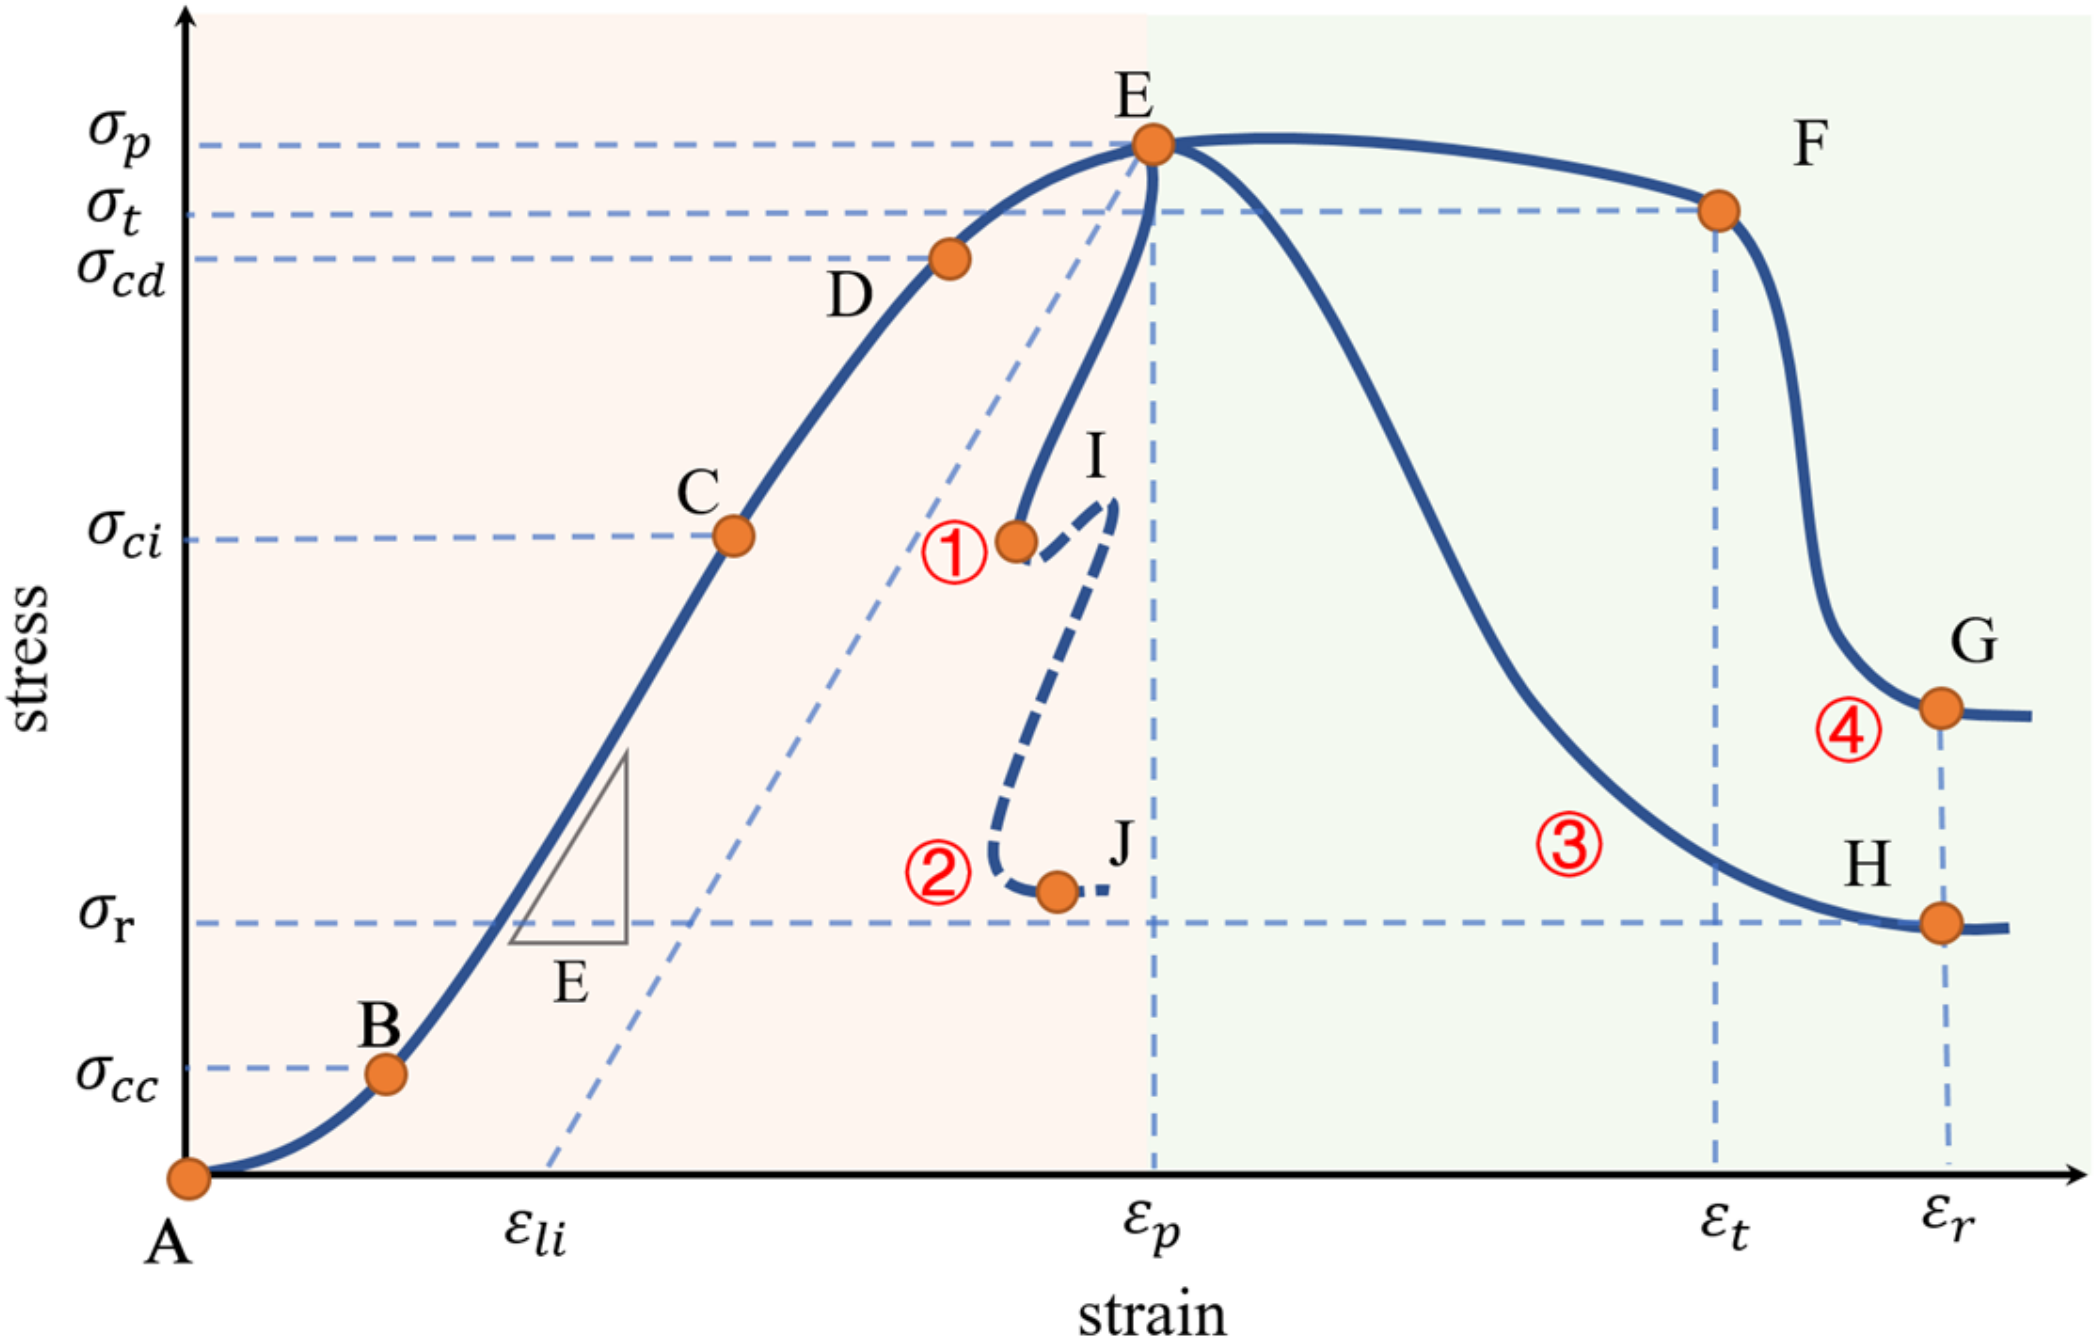
3. Verification and Optimization of Brittleness Index

It is found that the strength and plasticity of rock gradually increase with the increase of confining pressure, while the brittleness decreases accordingly [55,56,57]. With the increase of confining pressure, the rock has obvious brittle to ductile transformation characteristics [58]. In addition to a significant influence on reservoir strength and brittleness index, confining pressure also affects fracture propagation [59]. Therefore, it is of great importance to study the evaluation of rock brittleness under confining pressure.
In this paper, the variation law of various rock brittleness indexes with confining pressure is analyzed, so as to screen out the brittleness indexes with clear physical meaning, complete mathematical model and strong operability from the existing brittleness indexes, and provide reference for practical projects.

3.1. Basis for Rock Sample Selection

In excavation and crushing engineering, rock brittleness determines the drilling efficiency of the drilling rig during TBM tunneling [60,61]. Based on the Han to Wei River Diversion Project, Wang (2021) [62] considered the influence of surrounding rock and unfavorable geological conditions of caverns on TBM construction, in which the surrounding rock of the tunnel of the Han to Wei River Diversion Project is mainly granite. Tian (2020) [63] relied on the Yangtai Mountain Tunnel to study the tool wear and tunneling performance of TBM construction. According to the tunnel geological exploration data and the supplementary exploration core test report, the tunnel body of the Yangtai Mountain Tunnel is in the slightly weathered granite stratum. The surrounding rock of the tunnel body is hard granite with good integrity, undeveloped joints and high quartz content. Xu et al., (2014) [64] studied the influence of high temperature and confining pressure on the deformation and strength characteristics of granite and obtained the stress–strain curves of conventional triaxial compression under different confining pressures.
In hard rock tunneling and deep rock mass engineering, rock brittleness is an important internal factor of engineering disasters such as rock burst [65,66,67]. Several extremely strong rock bursts occurred in seven parallel tunnels in the Jinping-II hydropower station, and this consequently became a typical case in the analysis of related accidents [68]. The main rock types of Jinping mountain are hard and brittle marble and a small amount of slate and sandstone. Wang et al., (2019) [69] studied the effect of confining pressure on the mechanical properties of Jinping marble by triaxial compression test and proposed an elastoplastic brittle mechanical model. Zhang et al., (2010) [70] investigated the mechanical properties of deeply buried barite in the Jinping II hydropower station and carried out conventional triaxial compression tests under different confining pressures to obtain the corresponding stress–strain curves.
In the extraction engineering of unconventional oil and gas resources, rock brittleness, as a key indicator for reservoir evaluation, is closely related to the stability of the wall in vertical wells, the initiation and extension of hydraulic fractures and the effective communication of the final fracture network [71,72]. The Upper Ordovician Wufeng formation and the Lower Silurian Longmaxi formation in the Sichuan Basin and its surrounding areas are the only sets of shale gas strata that have been commercially developed in China [73]. He et al., (2017) [74] investigated the indoor macroscopic mechanical behavior of the Longmaxi formation outcrop shale in Sichuan and Chongqing and obtained multiple sets of stress–strain curves. Kivi et al., (2018) [51] collected several sets of shale samples from organic-rich shale formations in Iran, carried out conventional triaxial compression tests and obtained several sets of stress–strain curves.
In addition, red sandstone is a more widely distributed rock in East China, South China and Southwest China, and is a hard and brittle sedimentary rock. With the rapid development of regional engineering construction, there have been increasing problems with the foundations, road foundations, tunnels and slope works that consist of red sandstone, while red sandstone is often developed in large quantities as building stone, all of which indicate the need for in-depth study of the physical and mechanical properties of red sandstone. Su et al., (2014) [75] carried out triaxial compression tests on red sandstone and obtained stress–strain curves for different confining pressures.
Combining the above typical rock engineering fields, four common rock types, granite [64], marble [70], shale [51] and red sandstone [75], were selected for this paper, and their corresponding stress–strain curves are shown in Figure 3.
Based on their stress–strain curves, the mechanical parameters of various types of rocks under different confining pressures are calculated as shown in Table 3.

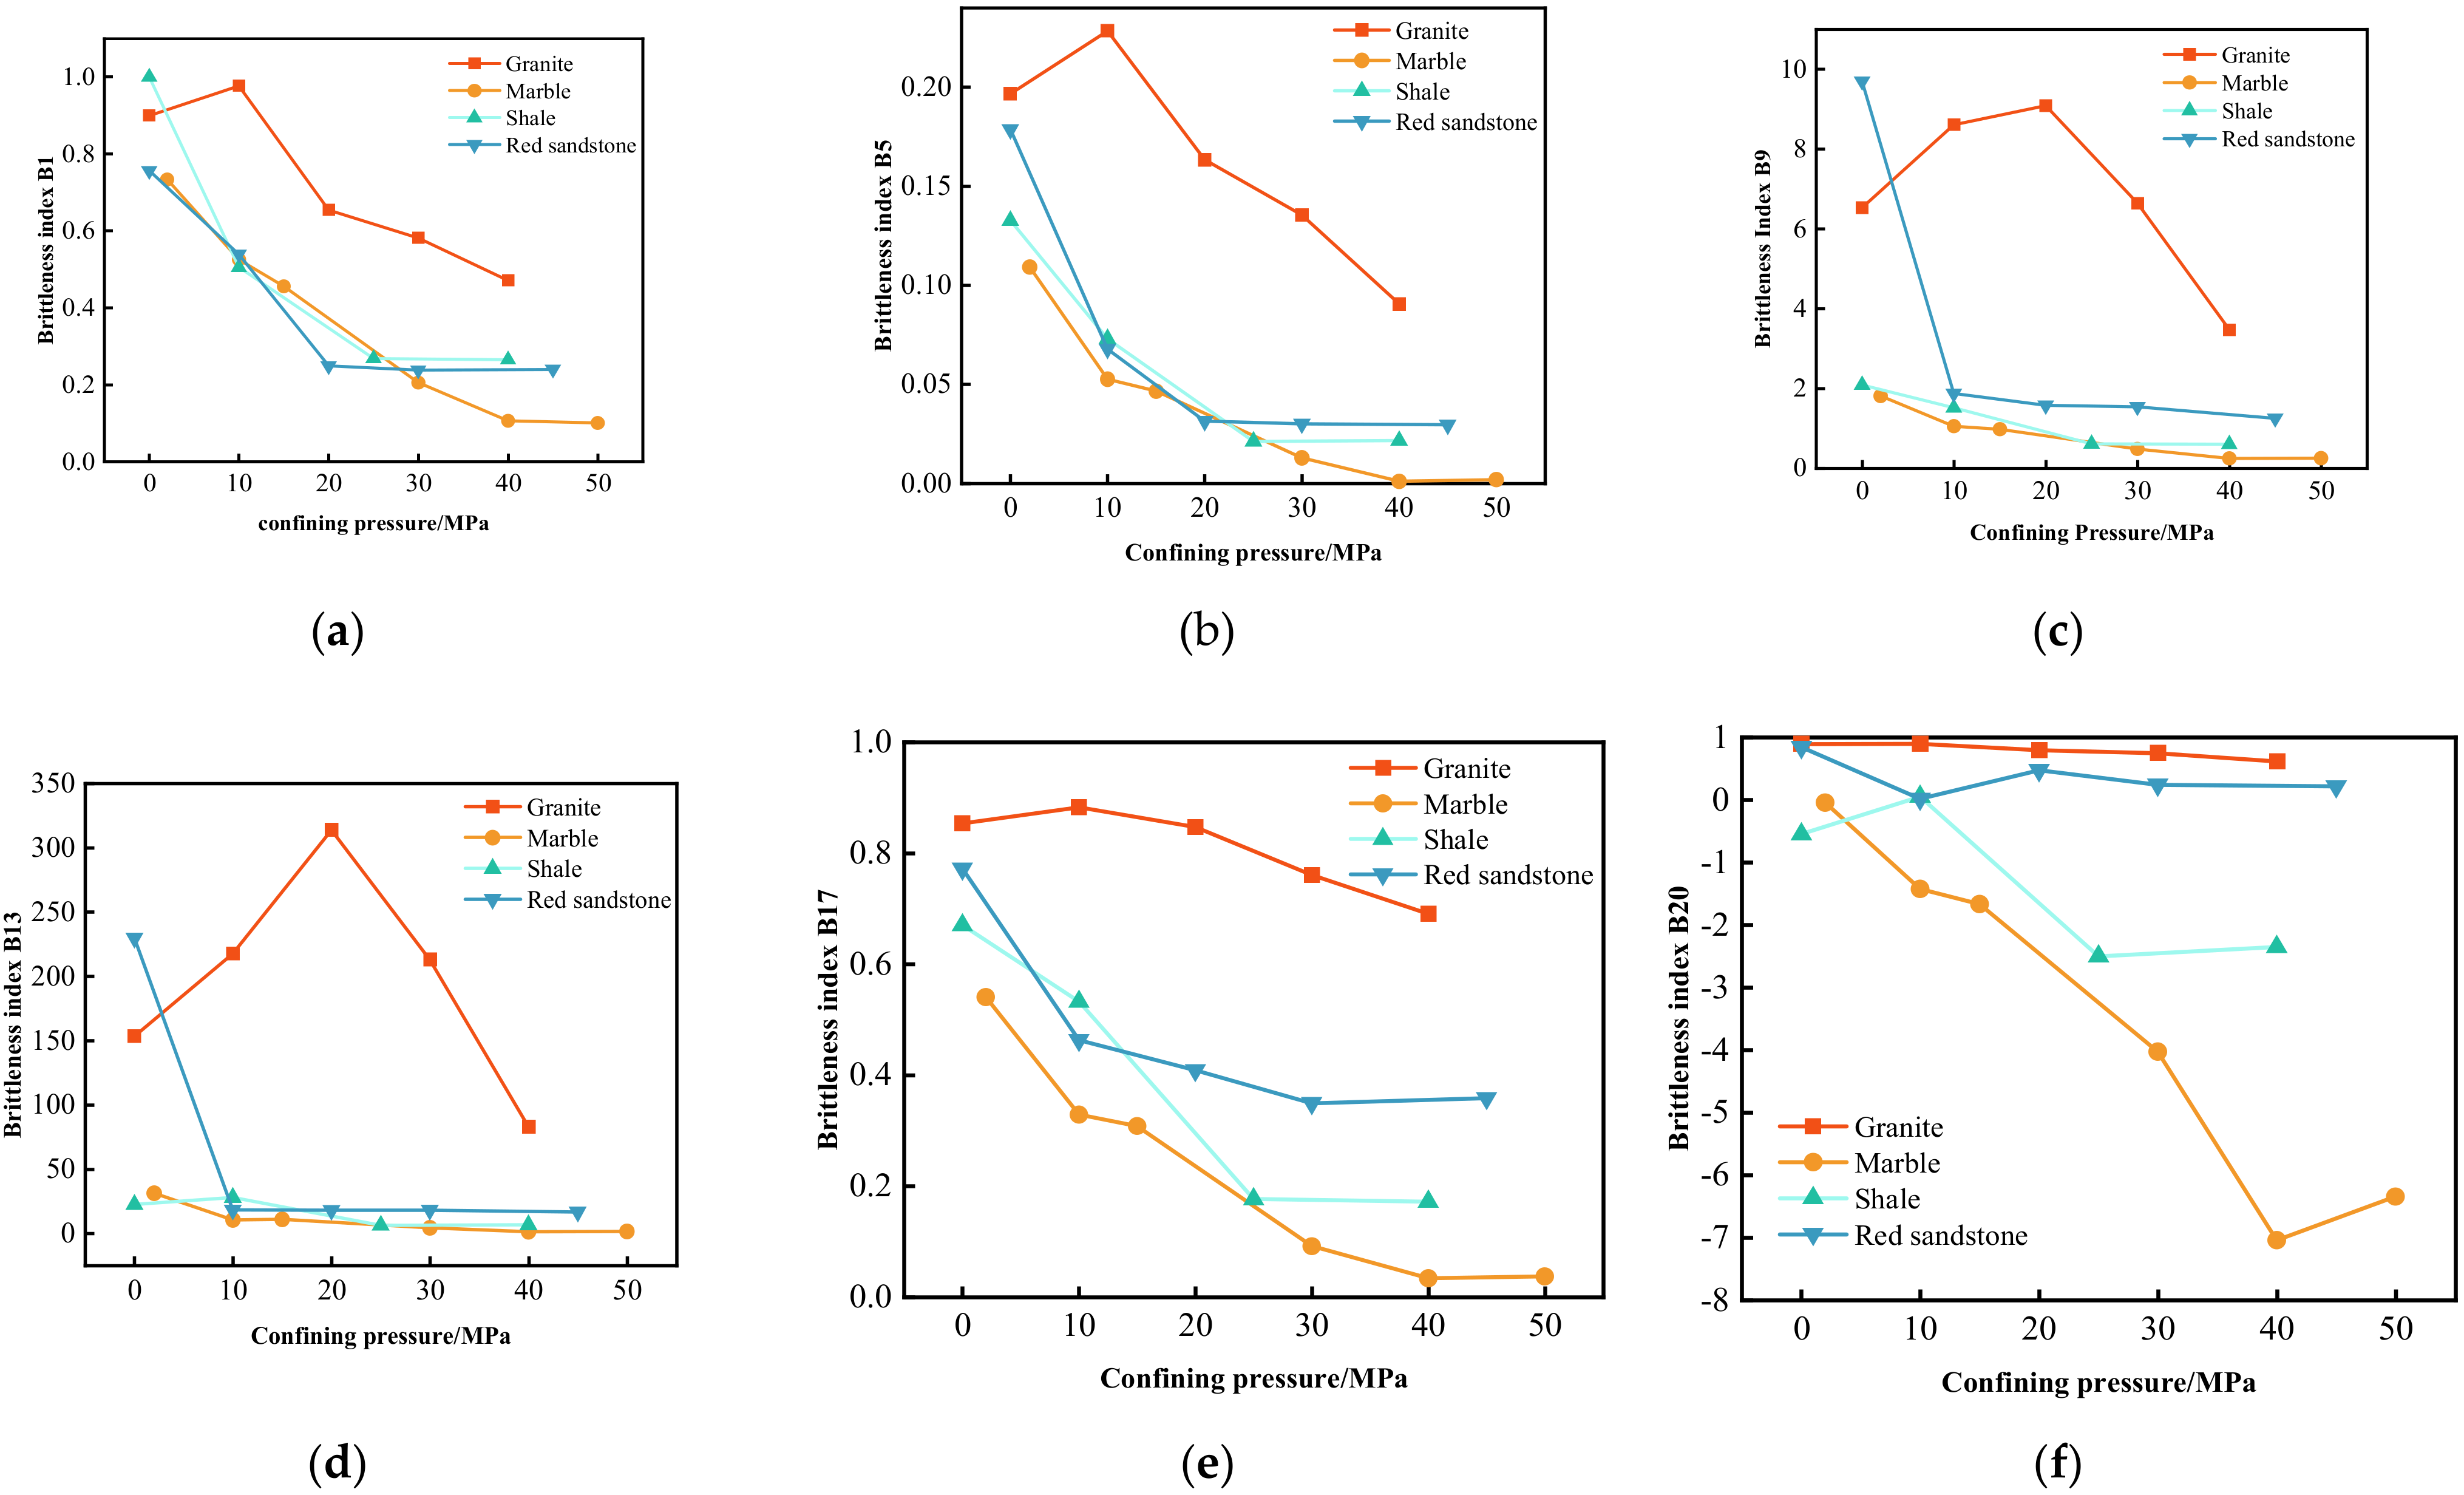
3.2. Analysis of Brittleness Index Calculation Results

Table 1 and Table 2 summarize 20 commonly used brittleness indexes based on the stress–strain curve. Since the establishment of various brittleness indexes is based on different theoretical backgrounds, their expression forms are different, and the characteristic points of curves selected in application are also different. Li et al., (2022) [33] believed that there would be some human error in selecting characteristic parameters. For example, when the crack volume strain inflection point method is used to determine the crack initiation stress, the crack initiation stress will vary with the selected linear elastic stage. Therefore, in the brittleness index summarized in Section 2, six brittleness evaluation methods with clear mathematical model, simple calculation and strong operability are selected for calculation, and the corresponding calculation results are shown in Figure 4.
As can be seen from Figure 4, the brittleness indexes B1 and B5 basically reflect the trend of brittleness of various types of rocks with the confining pressure. However, except for granite, the brittleness curves of the remaining three types of rocks have a lot of crossover and overlap, and the degree of differentiation is not high. When B9 is used to describe the brittleness of granite and red sandstone, they are basically coincident and cannot be effectively distinguished, and the brittleness characterization effect of marble and shale is also not well known. B13 is not ideal for characterizing the brittleness of the other three types of rocks except for granite. In fact, the brittleness indices B1 and B5 are based on the post-peak softening model of the rock, B9 considers the pre-peak stress growth rate, and B13 introduces the pre-peak energy ratio. However, only two state quantities, the peak point (or the onset of the yielding phase) and the residual point, are considered in the final expression, ignoring the specific curve form. Therefore, it is theoretically possible to obtain the same brittleness for different forms of the curve.
The evaluation results of B20 on the brittleness of marble are relatively reasonable, but the calculation results of the other three types of rocks vary slightly. However, B17 has a good representation effect on the brittleness trend of all kinds of rocks with confining pressure, and the brittleness curve has an obvious stratification phenomenon, indicating that the brittleness of different rock samples varies greatly. In conclusion, among the brittleness indexes based on the stress–strain curve, the brittleness index B17, considering the whole process of energy evolution, has the best characterization effect and should be the preferred method for brittleness evaluation of conventional rock Class I curves.

4. Optimization and Supplement of Brittleness Index

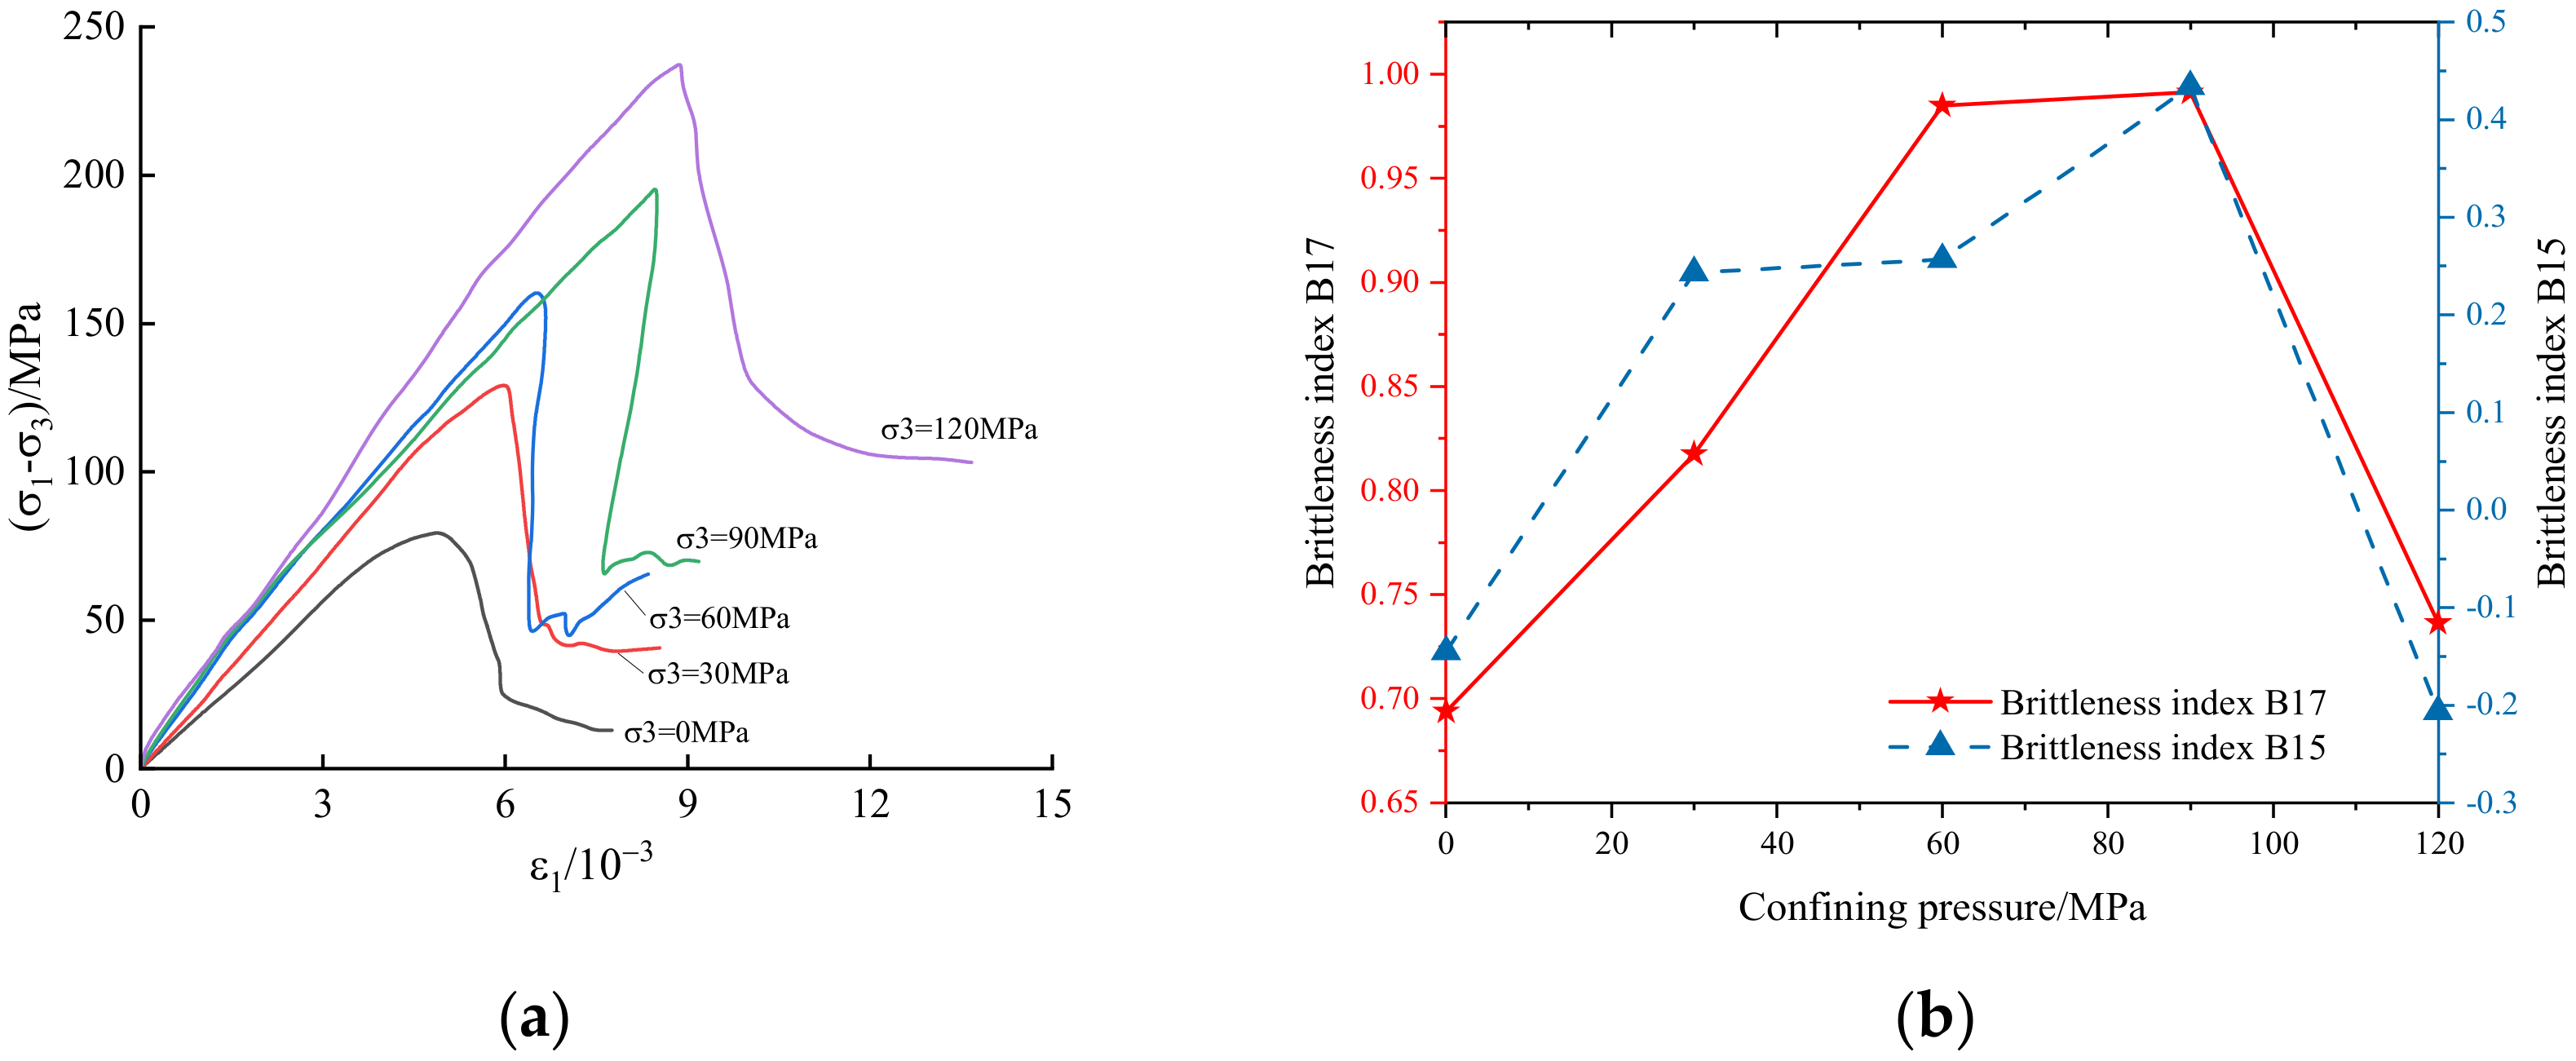
4.1. Optimization of Brittleness Index with Confining Pressure

It was found that the stress–strain curves of certain rocks under high confining pressure conditions would show a significant yield plateau around the peak strength, exhibiting significant brittle-plastic transition characteristics, and eventually exhibiting strain softening with increasing deformation [40,69]. As shown in Figure 5, point A indicates the stress–strain curve just entering the yielding phase, point B indicates the end of the yield plateau and point C indicates the residual phase of plastic flow.
Zhang et al., (2017) [50] argued that for plastic rocks, as the fracture continues to expand, the block continues to rotate and collapse into smaller pieces, so that the resistance to shear gradually changes from rock cohesion to friction between the fracture surfaces. Due to the need to maintain the extension of the fracture in the material, the collapse process of the block requires the absorption of a large amount of energy, and this energy corresponds to the energy corresponding to the yield plateau before and after the peak in the stress–strain curve. Therefore, the brittleness calculation for such curves can be approximated by describing it with an elastic–plastic brittle model [69], considering the endpoint of the plastic yield plateau instead of the peak rock point as the starting point of the load carrying capacity fall when taking values.
Among the four types of rock samples selected in Section 3.1, marble and shale have significant brittle to plastic transition characteristics under high confining pressure, i.e., long peak horizontal sections. Therefore, based on these two groups of data, the calculation results of B17 are compared with the results when replacing the peak point with the endpoint of the peak horizontal segment, as shown in Figure 6.
In the literature [70], it was pointed out that the deeply buried marble rocks of the Jinping Baishan formation showed obvious brittle characteristics at low envelope pressure; with the increase of the envelope pressure, the ductile characteristics were obviously enhanced. When the envelope pressure was further increased to 50 MPa, the post-yielding stage approached the mechanical response of an ideal plastic material, and the brittleness index tended to 0. Finally, the peak post-yielding characteristics were summarized by the brittle–ductile–plastic progressive transition law. In the literature [51], it was found that the strong brittle damage characteristics of shales develop at low envelope pressure states and the evolution to relatively ductile behavior develops at high envelope pressure states.
It can be seen from Figure 6 that the revised marble brittleness index decreases exponentially with the increase of confining pressure, and the curve fitting correlation coefficient is 0.993. The revised shale brittleness index decreases linearly with the increase of confining pressure before the confining pressure is 25 MPa, and then remains basically unchanged, with a curve fitting correlation coefficient of 0.975. The revised calculation result is consistent with the calculation result of B17, which verifies the correctness of the revised model, though the fitting accuracy is higher.

4.2. Applicability Analysis of Brittleness Index B17 to Rock Class II Curve

Class II stress–strain curve is the manifestation of the unstable failure of rock. After the external force exceeds the peak value, the testing machine does not need to do work. The accumulated elastic energy of the specimen itself makes the fracture continue to expand and leads to the failure of the whole rock sample. Chen et al., (2010) [76] believed that it is difficult to obtain a Class II curve for weak rock with low strength and elastic modulus regardless of the loading method used, indicating that the Class II curve itself indicates that the rock has high brittleness. Hou et al., (2015) [77] conducted uniaxial compression tests on Longmaxi formation shale in different bedding directions and obtained a Class II curve of unstable fracture type propagation, which also shows that rock with a Class II curve is relatively brittle.
The brittleness index B17 is based on the Class I stress–strain curve of typical rocks. Whether the brittleness of Class II curve rocks can be reasonably characterized has not been reported and is analyzed theoretically first below. Assuming no energy dissipation before the peak, the brittleness index is equal to 1 when the rock exhibits ideal brittleness, i.e., when the post-peak stress falls vertically to 0. When the stress–strain curve is Class II, the mechanical energy input is no longer required after the peak and the rock sample undergoes self-sustaining damage. As shown in curves ABC, ABD and ABF in Figure 2, the excess energy released gradually decreases, the fracture energy fraction gradually increases but is always less than the elastic energy consumed, and the brittleness index decreases, in line with the objective rule that the brittleness index B17 is also valid for the brittleness characterization of Class II curves.
Ai et al., (2016) [38] obtained stress–strain curves for black shale at different confining pressures, as shown in Figure 7a. As can be seen from the graph, the stress–strain curve of the rock sample changes from Class I to Class II and then to Class I as the confining pressure increases, indicating that the degree of brittleness first increases and then decreases. The brittleness index B17 was used to calculate and analyze it and the brittleness index variation curve was obtained as shown in Figure 7b; it can therefore be seen that the brittleness variation pattern is generally consistent with the findings of Ai et al., (2016) [49]. In addition, the calculated results are significantly greater for 60 MPa and 90 MPa confining pressure conditions, i.e., when the stress–strain relationship is a Class II curve, further demonstrating that the brittleness index B17 can reasonably characterize the brittleness of the rock for both types of curve.

4.3. Supplement to Class II Curves with Incomplete Post-Peak Curves

It was found that the Type II curve is essentially obtained during the unloading of brittle rock specimens during compression damage. It comes with conditions: one is the loading method, in which a slower circumferential deformation is used as the loading control variable when the rock sample is damaged; the other is that the rock sample itself has brittle properties and is able to accumulate a certain amount of elastic energy before damage [76].
He et al., (1994) [78] derived the full stress–strain curves of Class II characteristic rocks based on a linear combination of force and displacement controlling rock tests; Ai et al., (2016) [52] obtained the full stress–strain curves of granite by axial-radial control. This shows that the displacement control system has significant advantages in obtaining the complete post-peak curve.
Nevertheless, in the uniaxial compression of Longmaxi Formation shale, Hou et al., (2015) [77] used a hydraulic servo rigid test material machine with high accuracy and stable performance, and adopted circumferential displacement control, and the stress–strain curve obtained was still severely distorted in the post-peak stage. He et al., (2017) [74] considered the effect of surrounding pressure and used a combination of axial and circumferential loading, but did not obtain a complete post-peak shale softening curve. According to the author’s analysis, the main reason for this is that the failure mode of shale includes sudden brittle failure, the rapid interaction between the equipment and the specimen in a very short period of time, the difficulty of rapid response of the equipment or the over-range of the displacement transducer, etc., all of which forced the experiment to stop before it could obtain the residual strength.
When characterizing the brittleness of such rocks, it can only be analyzed from the pre-peak stage. In combination with the research method of Kivi et al., (2018) [51], supplementing the brittleness index of such rocks from the perspective of energy evolution has been considered. Hucka and Das (1974) [17] believed that the proportion of pre-peak elastic properties to brittleness has a good characterization role, and proposed the classic brittleness index B11 to describe the pre-peak brittleness characteristics. This model has a clear physical meaning and a concise mathematical model. However, the index is always less than 1, so this paper will supplement it in the numerical range.

5. Establishment of Joint Brittleness Index

Four types of stress–strain curve models summarized in Figure 1 are combined to establish the brittleness index of joint characterization from the perspective of energy evolution in this paper. The capacity distribution of each part of the rock during loading is shown in Figure 8.
From the above analysis, it can be seen that the brittleness index B17 can have a better evaluation effect on the brittleness of type ② and type ③ curves.
The index considered the degree of self-sustained damage of the rock from the perspective of energy evolution on the one hand, and the proportion of consumed elastic energy in the fracture process on the other. It can be expressed as:
B 17 = 1 2 W ue W te + W d + W ue W r
The corresponding strain energy can be expressed as:
W u e = W t e W r e = σ p 2 σ r 2 2 E
W t e = σ p 2 2 E
W d = W p r e W t e = 0 ε p σ d ε σ p 2 2 E
W r = W t e + W p o s t W r e + = σ p 2 σ r 2 2 E + ε p ε r σ d ε
The meanings of the relevant parameters are explained in Table 2.
This paper corrects the type ④ curve by adjusting the stress characteristic value. Therefore, it only needs to replace all σ p in Equation (2) to (5) with σ t .
It is known from the analysis in Section 4.3 that the type ① curve needs to be supplemented on the basis of the brittleness index B11. The basic formula of brittleness index B11 is as follows.
B 11 = W t e W t e + W d
The ideal brittle material does not have a plastic deformation stage before the peak, but the real rock dissipates part of its energy during deformation and has a yielding stage, resulting in B11 being necessarily less than 1. The brittleness index B17 also takes values in the range of 0 to 1. Therefore, when describing the hard and brittle characteristics of type ① curves, there should be a more significant distinction in numerical results from the remaining types of curves.
It can be seen from Table 1 that many scholars have considered the influence of peak strain ε p on brittleness [39,42,43,44,45]. According to the definition of brittleness, a small peak strain represents less axial deformation when the rock fails, which corresponds to a higher brittleness. Therefore, this paper supplements B11 with the perspective of peak strain.
First, the peak strain is normalized, so that the data with a large range of changes can be assigned to the same level, which is expressed as follows:
ε p , n o r = ε p ε p , min ε p , max ε p , min
After normalization, the minimum peak strain drops to 0, which cannot effectively supplement the value range of B11. A logistic function (or sigmoid function) with the maximum value of 2, which is monotonic between the independent variables of 0 and 1, is introduced and the interval of variation meets the requirements of this paper to complement the brittleness index. In addition, the peak strain is generally negatively correlated with the degree of brittleness, and the opposite of the normalized peak strain is used as the variable. Then, the added brittleness index is obtained, as follows:
B add = 2 1 + e ε p , n o r
The new brittleness index can be obtained by combining Equations (6)–(8):
B n e w = W t e W t e + W d + 2 1 + e ε p , n o r
Figure 9a shows the test curve of Longmaxi formation shale. The curve at the post peak stage is severely incomplete and tortuous, so the residual strength cannot be obtained. Equation (9) can be verified based on this data.
Figure 9b shows the calculation results of the brittleness index B11 and the revised brittleness index. It can be seen that the result of brittleness index B11 is between 0.5 and 0.75, and the revised result is significantly higher than that of a Class I curve, which can better reflect the brittle characteristics of such rock samples. In addition, the brittleness results of shale show a linear decreasing trend with the increase of confining pressure, which is basically consistent with the research conclusions of He et al., (2014) [74] and also verifies the reliability of the conclusions.
In summary, the four types of stress–strain models proposed in this paper all have corresponding brittleness indices, which can be integrated to obtain a joint brittleness index:
BI = W t e W t e + W d + 2 1 + e ε p , n o r = σ p 2 2 E 0 ε p σ i d ε i + 2 1 + exp ε p ε p , min ε p , max ε p , min         Type     curve 1 2 W ue W r + W ue W te + W d = 1 2 σ p 2 σ r 2 2 E σ p 2 σ r 2 2 E + ε p ε r σ i d ε i + σ p 2 σ r 2 2 E 0 ε p σ i d ε i         Type     and     curve 1 2 W ue W r + W ue W te + W d = 1 2 σ t 2 σ r 2 2 E σ t 2 σ r 2 2 E + ε t ε r σ i d ε i + σ t 2 σ r 2 2 E 0 ε t σ i d ε i         Type     curve  

6. Conclusions

In this paper, the existing commonly used evaluation indexes of rock brittleness are summarized from the perspective of the complete stress–strain curve, and the applicability of various brittleness indexes is verified and optimized by combining them with corresponding engineering cases. A new brittleness index was added for the incomplete post-peak curve, and a joint brittleness index which can characterize various curves was established. The results are as follows.
(1)
Among the brittleness indexes based on the stress–strain curve, the brittleness index B17, which considers the whole process of energy evolution, has the best characterization effect on rock brittleness. It can not only reflect the variation law of brittleness of various rocks with confining pressure but also represent the brittleness differences between rocks of different lithologies. The evaluation results show good differentiation, and it is recommended as the preferred method for brittleness evaluation of conventional rock Class I curves.
(2)
Under high confining pressure, a significant yield plateau may appear in the stress–strain curve before and after the peak strength. Given this situation, the endpoint of the plastic yield platform is used to replace the original peak stress point as the starting point of the drop of the bearing capacity, and the optimized brittleness index is revised. The revised brittleness index is consistent with the original curve, which further verifies that the brittleness index B17 can also better represent the failure behavior of the rock Class II curve.
(3)
Considering that the residual strength of rock cannot be obtained in the short post-peak stage of some stress–strain curves, the existing brittleness index is modified and supplemented, and a joint brittleness evaluation index that can reflect the four types of curve rocks is established. The newly established brittleness index can better reflect the brittleness of various rocks, which is reasonable and referential and can provide a more general evaluation method for rock brittleness evaluation in engineering.

Author Contributions

Conceptualization, X.X.; methodology, X.X. and L.X.; validation, L.X. and Y.S.; formal analysis, X.X.; investigation, X.X. and T.L.; resources, Y.S. and L.X.; data curation, T.L. and L.X.; writing—original draft preparation, L.X., Y.S. and T.L.; writing—review and editing, X.X. All authors have read and agreed to the published version of the manuscript.

Funding

This research was funded by the Open Research Fund of the Key Laboratory of Safety and High-efficiency Coal Mining, Ministry of Education (Anhui University of Science and Technology), No.JYBSYS2020208, Postgraduate Research & Practice Innovation Program of School of Transportation and Civil Engineering, Nantong University, No.NTUJTXYGI2204, and Innovation Training Program for Chinese College Students, No. 202210304065Z.

Institutional Review Board Statement

Not applicable.

Informed Consent Statement

Not applicable.

Data Availability Statement

Not applicable.

Conflicts of Interest

The authors declare no conflict of interest.

References

  1. Munoz, H.; Taheri, A.; Chanda, E.K. Rock Drilling Performance Evaluation by an Energy Dissipation Based Rock Brittleness Index. Rock Mech. Rock Eng. 2016, 49, 3343–3355. [Google Scholar] [CrossRef]
  2. Atici, U.; Ersoy, A. Correlation of specific energy of cutting saws and drilling bits with rock brittleness and destruction energy. J. Mater. Process. Tech. 2009, 209, 2602–2612. [Google Scholar] [CrossRef]
  3. Özfırat, M.K.; Yenice, H.; Şimşir, F.; Yaralı, O. A new approach to rock brittleness and its usability at prediction of drillability. J Afr. Earth Sci. 2016, 119, 94–101. [Google Scholar] [CrossRef]
  4. Meng, Y.F.; Liu, H.B.; Yu, A.R.; Hu, Y.Z.; Deng, Y.Z. Borehle Completion Stability of Deep Brittle Shale Horizontal Wells. J. Southwest Pet. Univ. Sci. Technol. 2019, 41, 51–59. [Google Scholar]
  5. Han, Z.B.; Liu, H.B.; Zhang, J.T.; Yang, H.J.; Shen, X.Y.; Yang, Q. Research on the Mechanical Properties and Borehole Stability of Deep Brittle Shale. Spec. Oil Gas Reserv. 2020, 27, 167–174. [Google Scholar]
  6. Wang, S.F.; Huang, L.Q.; Li, X.B. Analysis of rockburst triggered by hard rock fragmentation using a conical pick under high uniaxial stress. Tunn. Undergr. Space Technol. 2020, 96, 103195. [Google Scholar] [CrossRef]
  7. Wu, F.Q.; Wu, J.; Qi, S.W. Theoretical analysis on mechanism of rock burst of brittle rock mass. J. Eng. Geol. 2010, 18, 589–595. [Google Scholar]
  8. Liu, X.M.; Li, C.F. Damage mechanics analysis for brittle rock and rockburst energy index. Chin. J. Rock Mech. Eng. 1997, 16, 45–52. [Google Scholar]
  9. Li, J.X.; Zhang, R.; Huang, L.; Zou, Y.L.; Fang, Y. Study on Instability Mechanism and Disposal Measures of Brittle Fractured Surrounding Rock Area in High Geo-stress Tunnel. Chin. J. Undergr. Space Eng. 2018, 14, 1345–1351. [Google Scholar]
  10. Liu, H.B.; Cui, S.; Meng, Y.F.; Zhou, Y.X.; Luo, Y. Study on wellbore caving and instability of horizontal well in deep brittle shale. Fault Block Oil Gas Field 2021, 28, 323–328. [Google Scholar]
  11. Jarvie, D.M.; Hill, R.J.; Ruble, T.E.; Pollastro, R.M. Unconventional shale-gas systems: The Mississippian Barnett Shale of northcentral Texas as one model for thermogenic shale-gas assessment. AAPG. Bull. 2007, 91, 475–499. [Google Scholar] [CrossRef]
  12. Liu, Z.; Sun, Z.D. New brittleness indexes and their application in shale/clay gas reservoir prediction. Petrol. Explor. Dev. 2015, 42, 129–137. [Google Scholar] [CrossRef]
  13. Wang, F.P.; Gale, J.F.W. Screening criteria for shale-gas systems. GCAGS Trans. 2009, 59, 779–793. [Google Scholar]
  14. Jin, X.C.; Shah, S.N.; Roegiers, J.C.; Zhang, B. Fracability evaluation in shale reservoirs—An integrated petrophysics and geomechanics approach. In Proceedings of the SPE Hydraulic Fracturing Technology Conference, The Woodlands, TX, USA, 4–6 February 2014. [Google Scholar]
  15. Suorineni, F.T.; Chinnasane, D.R.; Kaiser, P.K. A procedure for determining rock-type specific Hoek-Brown brittle parameters. Rock Mech. Rock Eng. 2009, 42, 849–881. [Google Scholar] [CrossRef]
  16. Rybacki, E.; Meier, T.; Dresen, G. What controls the mechanical properties of shale rocks? Part II: Brittleness. J. Petrol. Sci. Eng. 2016, 144, 39–58. [Google Scholar] [CrossRef] [Green Version]
  17. Hucka, V.; Das, B. Brittleness determination of rocks by different methods. Int. J. Rock Mech. Min. 1974, 11, 389–392. [Google Scholar] [CrossRef]
  18. Altindag, R. The evaluation of rock brittleness concept on rotary blast hold drills. J. South. Afr. Inst. Min. Metall. 2002, 102, 61–66. [Google Scholar]
  19. Altindag, R. Assessment of some brittleness indexes in rock-drilling efficiency. Rock Mech. Rock. Eng. 2010, 43, 361–370. [Google Scholar] [CrossRef]
  20. Yagiz, S.; Gokceoglu, C. Application of fuzzy inference system and nonlinear regression models for predicting rock brittleness. Expert. Syst. Appl. 2010, 37, 2265–2272. [Google Scholar] [CrossRef]
  21. Bishop, A.W. Progressive failure with special reference to the mechanism causing it. Proc. Geotech. Conf. Oslo. 1967, 2, 142–150. [Google Scholar]
  22. Rickman, R.; Mullen, M.J.; Petre, J.E.; Grieser, W.V.; Kundert, D. A practical use of shale petrophysics for stimulation design optimization: All shale plays are not clones of the Barnett Shale. In Proceedings of the SPE Annual Technical Conference and Exhibition, Denver, CO, USA, 21–24 September 2008. [Google Scholar]
  23. Luan, X.; Di, B.; Wei, J.; Li, X.; Qian, K.; Xie, J.; Ding, P. Laboratory measurements of brittleness anisotropy in synthetic shale with different cementation. In SEG Technical Program Expanded Abstracts; Society of Exploration Geophysicists: Houston, TX, USA, 2014; pp. 3005–3009. [Google Scholar]
  24. Guo, J.C.; Zhao, Z.H.; He, S.G.; Liang, H.; Liu, Y.X. A new method for shale brittleness evaluation. Environ. Earth. Sci. 2015, 73, 5855–5865. [Google Scholar] [CrossRef]
  25. Honda, H.; Sanada, Y. Hardness of coal. Fuel 1956, 35, 451–461. [Google Scholar]
  26. Lawn, B.R.; Marshall, D.B. Hardness, toughness, and brittleness: An indentation analysis. J. Am. Ceram. Soc. 1979, 62, 347–350. [Google Scholar] [CrossRef]
  27. Quinn, J.B.; Quinn, G.D. Indentation brittleness of ceramics: A fresh approach. J. Mater. Sci. 1997, 32, 4331–4346. [Google Scholar] [CrossRef]
  28. Yagiz, S. Assessment of brittleness using rock strength and density with punch penetration test. Tunn. Undergr. Space Technol. 2009, 24, 66–74. [Google Scholar] [CrossRef]
  29. Bu, F.C.; Xue, L.; Zhai, M.Y.; Huang, X.L.; Dong, J.Y.; Liang, N.; Xu, C. Evaluation of the characterization of acoustic emission of brittle rocks from the experiment to numerical simulation. Sci. Rep. 2022, 12, 498. [Google Scholar] [CrossRef]
  30. Zhang, H.; Wang, Z.Z.; Song, Z.L.; Zhang, Y.Z.; Wang, T.T.; Zhao, W.C. Acoustic emission characteristics of different brittle rocks and its application in brittleness evaluation. Geomech. Geophys. Geo. 2021, 7, 1–14. [Google Scholar] [CrossRef]
  31. Zarastvand, M.R.; Asadijafari, M.H.; Talebitooti, R. Acoustic wave transmission characteristics of stiffened composite shell systems with double curvature. Compos. Struct. 2022, 292, 115688. [Google Scholar] [CrossRef]
  32. Seilsepour, H.; Zarastvand, M.; Talebitooti, R. Acoustic insulation characteristics of sandwich composite shell systems with double curvature: The effect of nature of viscoelastic core. J. Vib. Control. 2022, 10775463211056758. [Google Scholar] [CrossRef]
  33. Li, S.J.; Kuang, Z.H.; Qiu, S.L. Review of rock brittleness evaluation methods and discussion on their adaptabilities. J. Eng. Geol. 2022, 30, 59–70. [Google Scholar]
  34. Martin, C.D.; Chandler, N.A. The progressive fracture of Lac du Bonnet granite. Int. J. Rock Mech. Min. 1994, 31, 643–659. [Google Scholar] [CrossRef]
  35. Schmidtke, R.H.; Lajtai, E.Z. The long-term strength of Lac du Bonnet granite. Int. J. Rock Mech. Min. 1985, 22, 461–465. [Google Scholar] [CrossRef]
  36. Peng, J.; Cai, M.; Rong, G.; Zhou, C.B.; Zhao, X.G. Stresses for crack closure and its application to assessing stress-induced microcrack damage. Chin. J. Rock Meth. Eng. 2015, 34, 1091–1100. [Google Scholar]
  37. Zhang, C.; Lei, Y.; Cao, W.G. Study on damage constitutive model of brittle rock considering dual deformation characteristics of soft and hard materials. Chin. J. Appl Mech. 2020, 37, 1166–1171. [Google Scholar]
  38. Andreev, G.E. Brittle Failure of Rock Materials: Test Results and Constitutive Models; A.A. Balkema: Rotterdam, The Netherlands, 1995. [Google Scholar]
  39. Li, Q.H.; Chen, M.; Jin, Y.; Wang, F.P.; Hou, B.; Zhang, B.W. Indoor evaluation method for shale brittleness and improvement. Chin. J. Rock Mech. Eng. 2012, 31, 1680–1685. [Google Scholar]
  40. Zhou, H.; Meng, F.Z.; Zhang, C.Q.; Xu, R.C.; Lu, J.J. Quantitative evaluation of rock brittleness based on stress-strain curve. Chin. J. Rock Mech. Eng. 2014, 33, 1114–1122. [Google Scholar]
  41. Chen, G.Q.; Zhao, C.; Wei, T.; Wang, J.C. Evaluation method of brittle characteristics of rock based on full stress-strain curve and crack initiation stress. Chin. J. Rock Mech. Eng. 2018, 37, 51–59. [Google Scholar]
  42. Liu, C.Y.; Du, L.Z.; Zhang, X.P.; Wang, Y.; Hu, X.M.; Han, Y.L. A New Rock Brittleness Evaluation Method Based on the Complete Stress-Strain Curve. Lithosphere 2021, 4029886. [Google Scholar] [CrossRef]
  43. Cao, Y.B.; Chen, Y.H.; Huang, Z.P.; Liu, C.Y.; Qiu, D.D. Study on evaluation index of brittleness characteristics of granite under different water content conditions. Chin. J. Eng. Geol. 2020, 28, 29–38. [Google Scholar]
  44. Zhang, C.; Bai, Y.; An, Y.L. A new method for evaluating rock brittle characteristics based on full stress-strain curve. J. Highw. Transp. Res. Dev. 2021, 38, 63–72. [Google Scholar]
  45. Kuang, Z.H.; Li, S.J.; Du, C.X. Evaluation index of rock brittleness considering stress change rate. Rock. Soil. Mech. 2021, 43, 1–8. [Google Scholar]
  46. Xie, H.P.; Ju, Y.; Li, L.Y. Criteria for strength and structural failure of rocks based on energy dissipation and energy release principles. Chin. J. Rock Mech. Eng. 2005, 24, 3003–3010. [Google Scholar]
  47. Tarasov, B.; Potvin, Y. Universal criteria for rock brittleness estimation under triaxial compression. Int. J. Rock Mech. Min. 2013, 59, 57–69. [Google Scholar] [CrossRef]
  48. Xia, Y.J.; Li, L.J.; Tang, C.A.; Ma, S.; Li, M.; Bao, C.Y. Rock brittleness evaluation based on stress dropping rate after peak stress and energy ratio. Chin. J. Rock Mech. Eng. 2016, 35, 1141–1154. [Google Scholar]
  49. Ai, C.; Zhang, J.; Li, Y.W.; Zeng, J.; Yang, X.L.; Wang, J.G. Estimation Criteria for Rock Brittleness Based on Energy Analysis During the Rupturing Process. Rock Mech. Rock Eng. 2016, 49, 4681–4698. [Google Scholar] [CrossRef]
  50. Zhang, J.; Ai, C.; Li, Y.W.; Zeng, J.; Qiu, Z.D. Brittleness evaluation index based on energy variation in the whole process of rock failure. Chin. J. Rock Mech. Eng. 2017, 35, 1141–1154. [Google Scholar]
  51. Rahimzadeh Kivi, I.R.; Ameri, M.; Molladavoodi, H. Shale brittleness evaluation based on energy balance analysis of stress-strain curves. J. Petrol. Sci. Eng. 2018, 167, 1–19. [Google Scholar] [CrossRef]
  52. Chen, G.Q.; Wu, J.C.; Jiang, W.Z.; Li, S.J.; Qiao, Z.B.; Yang, W.B. An evaluation method of rock brittleness based on the whole process of elastic energy evolution. Chin. J. Rock Mech. Eng. 2020, 39, 901–911. [Google Scholar]
  53. Wen, T.; Zhang, X.; Sun, J.S.; Jia, Y.S.; Lang, M.; Jia, W.J.; Li, D.C.; Sun, L.X.; Tang, M.H. Evaluation of rock brittleness based on energy evolution characteristics before and after peak. Earth Sci. 2021, 46, 3385–3396. [Google Scholar]
  54. Gong, F.Q.; Wang, Y.L. A New Rock Brittleness Index Based on the Peak Elastic Strain Energy Consumption Ratio. Rock Mech. Rock Eng. 2022, 55, 1571–1582. [Google Scholar] [CrossRef]
  55. Xu, S.L.; Wu, W.; Wang, G.Y.; Zhang, Q.H.; Xu, J.P. Study on complete procedures of marble under triaxial compression Ⅰ: Testing Study on complete procedure of triaxial compression and the processes of unloading confining at the pre-peak and post-peak. Chin. J. Rock Mech. Eng. 2001, 20, 763–767. [Google Scholar]
  56. Xu, S.L.; Wu, W.; Wang, G.Y.; Zhang, H.; Wu, S. Study on complete procedures of marble under triaxial compression Ⅱ: Shear fracture energy analysis. Chin. J. Rock Mech. Eng. 2002, 21, 65–69. [Google Scholar]
  57. Yang, S.Q.; Xu, W.Y.; Su, C.D. Study on the deformation failure and energy properties of marble specimen under triaxial compression. Chin. J. Eng. Mech. 2007, 24, 136–142. [Google Scholar]
  58. Xie, H.P.; Gao, M.Z.; Fu, C.X.; Lu, Y.Q.; Yang, M.Q.; Hu, J.K.; Yang, B.G. Mechanical behavior of brittle-ductile transition in rocks at different depths. Chin. J. Coal. Sci. 2021, 46, 701–715. [Google Scholar]
  59. Dou, L.B.; Yang, H.J.; Xiao, Y.J.; Gao, H.; Li, T.T.; Sun, H.B. Probability study of formation brittleness and new quantitative evaluation of fracability for shale reservoirs. Prog. Geophys. 2021, 36, 576–584. [Google Scholar]
  60. Kahraman, S. Correlation of TBM and drilling machine performances with rock brittleness. Eng. Geol. 2002, 65, 269–283. [Google Scholar] [CrossRef]
  61. Gong, Q.M.; Zhao, J. Influence of rock brittleness on TBM penetration rate in Singapore granite. Tunn. Undergr. Space Technol. 2007, 22, 317–324. [Google Scholar] [CrossRef]
  62. Wang, S.L. Study and Application of Surrounding Rock Classification Method for TBM Tunnel Construction of Hanjiang-Weihe River Diversion Project. Master’s Thesis, Xi’an University of Technology, Xi’an, China, 2007. [Google Scholar]
  63. Tian, J.L. Study on Tool Wear Law and Tunneling Performance Evaluation in TBM Construction of Hard Rock Mass. Master’s Thesis, Xi’an University of Architecture and Technology, Xi’an, China, 2010. [Google Scholar]
  64. Xu, X.L.; Gao, F.; Zhang, Z.Z. Influence of confining pressure on deformation and strength properties of granite after high temperatures. Chin. J. Geot. Eng. 2014, 36, 2246–2252. [Google Scholar]
  65. Zhang, J.J.; Fu, B.J. Rock burst and its criterion and Prevention. Chin. J. Rock Mech. Eng. 2008, 27, 2034–2042. [Google Scholar]
  66. Feng, X.T.; Xiao, Y.X.; Feng, G.L.; Yao, Z.B.; Chen, B.R.; Yang, C.X.; Su, G.S. Study on the development process of rockbursts. Chin. J. Rock Mech. Eng. 2009, 38, 649–673. [Google Scholar]
  67. Liang, W.Z.; Zhao, G.Y. A review of research on long-term and short-term rockburst risk evaluation in deep hard rock. Chin. J. Rock Mech. Eng. 2021, 41, 1–21. [Google Scholar]
  68. Zhang, C.Q.; Feng, X.T.; Zhou, H.; Qiu, S.L.; Wu, W.P. Case histories of four extremely intense rockbursts in deep tunnels. Rock Mech. Rock Eng. 2012, 45, 275–288. [Google Scholar] [CrossRef]
  69. Wang, H.Y.; Zhang, Q. Research on influence of confining pressure on mechanical properties of Jinping deep buried marble. Chin. J. Basic. Sci Eng. 2019, 27, 843–853. [Google Scholar]
  70. Zhang, C.S.; Chen, X.R.; Hou, J.; Chu, W.J. Study of mechanical behavior of deep-buried marble at Jinping II hydropower station. Chin. J. Rock Mech. Eng. 2010, 29, 1999–2009. [Google Scholar]
  71. Lai, J.; Wang, G.W.; Fan, Z.Y.; Chen, J.; Wang, S.C.; Zhou, Z.L.; Fan, X.Q. Research progress in brittleness index evaluation methods with logging data in unconventional oil and gas reservoirs. Petro. Sci. Bull. 2016, 3, 330–341. [Google Scholar]
  72. Cao, D.S.; Zeng, L.B.; Lu, W.Y.; Xu, X.; Tian, H. Progress in brittleness evaluation and prediction methods in unconventional reservoirs. Petro. Sci. Bull. 2021, 1, 31–45. [Google Scholar]
  73. Li, S.Z.; Zhou, Z.; Nie, H.K.; Zhang, L.F.; Song, T.; Liu, W.B.; Li, H.H.; Xu, Q.C.; Wei, S.Y.; Tao, S. Distribution characteristics, exploration and development, geological theories research progress and exploration directions of shale gas in China. China Geol. 2022, 5, 110–135. [Google Scholar] [CrossRef]
  74. He, B.; Xie, L.Z.; Li, F.X.; Zhao, P.; Zhang, Y. Anisotropic mechanism and characteristics of deformation and failure of Longmaxi shale. Sci. China Phys. Mech. Astron. 2017, 47, 114611. [Google Scholar] [CrossRef]
  75. Su, C.D.; Fu, Y.S. Experimental study of triaxial compression deformation and strength characteristics of red sandstone. Chin. J. Rock Mech. Eng. 2014, 33, 3164–3169. [Google Scholar]
  76. Chen, S.J.; Guo, W.J.; Liu, J.X. Experiment on formation mechanism of rock class II curve. Chin. J. Coal Soc. 2010, 35, 54–58. [Google Scholar]
  77. Hou, Z.K.; Yang, C.H.; Guo, Y.T.; Zhang, B.P.; Wei, Y.L.; Heng, S.; Wang, L. Experimental study on anisotropic properties of Longmaxi formation shale under uniaxial compression. Rock Soil Mech. 2015, 36, 2541–2550. [Google Scholar]
  78. He, R.C.; Zhang, L.; Guo, Y.L. A testing method controlling the combination of load and displacement. J. Eng. Geol. 1994, 2, 38–45. [Google Scholar]
Figure 1. Stress–strain curves of different rocks. Note: σ c c is the initial crack closure stress, σ c i is the crack initiation stress, σ c d is the crack damage stress, σ p is the peak stress, σ t is the drop stress, σ r is the residual stress, ε l i is the unrecoverable plastic deformation, ε p is the peak strain,   ε t is the drop strain, and ε r is the residual strain.
Mathematics 10 04470 g001
Figure 2. Schematic diagram of rock stress–strain with different post-peak curves. Note: A is the starting point; AB is the pre-peak stress–strain curve; BC, BD, BE, BF, BG, and BH are different post-peak curves; AI is the unrecoverable axial strain; and BJ is the boundary between two types of curves.
Mathematics 10 04470 g002
Figure 3. Stress–strain curves of various rocks under different confining pressures.
Mathematics 10 04470 g003
Figure 4. Brittleness index of various types of rocks under different confining pressures. Note: (af) represent the characterization results of different rock samples by brittleness indexes of B1, B5, B9, B13, B17, and B20, respectively.
Mathematics 10 04470 g004
Figure 5. Schematic diagram of brittle to plastic transition caused by yield platform. Note: a is the peak point, A and B are the starting and ending points of the yield plateau, c and C are the residual points of different models respectively.
Mathematics 10 04470 g005
Figure 6. The change of brittleness index B17 and modified brittleness index with confining pressure. (a) Marble, (b) Shale.
Mathematics 10 04470 g006
Figure 7. Calculation of stress–strain curve and brittleness index of shale. Note: (a) and (b) represent the variation law of the shale stress–strain curve and brittleness index with confining pressure, respectively.
Mathematics 10 04470 g007
Figure 8. Energy distribution of different stress–strain models.
Mathematics 10 04470 g008
Figure 9. Calculation results of shale stress–strain curve (a) and brittleness index with incomplete post-peak curve (b).
Mathematics 10 04470 g009
Table 1. Brittleness indexes based on stress–strain curve and characteristic parameters.
Brittleness IndexDescriptionResearchers
B 1 = σ p σ r σ p σ p   and σ r are the peak stress and residual stress, respectivelyBishop,
1967 [21]
B 2 = ε e ε p = σ P E ε P ε e is the recoverable (or elastic) strainHucka and Das,
1974 [17]
B 3 = ε 1 i × 100 % = ε p σ P E × 100 % ε 1 i is the unrecoverable axial strainAndreev,
1995 [38]
B 4 = B i + B j , B i = ( ε p ε n ) / ε m ε n  
B j = α C S + β C S + η , C S = ε P / σ p σ p σ r / ε r ε P
B i and B j are the pre-peak index and post-peak index, respectively; ε m   and ε n are the maximum and minimum peak strains, respectively; ε P is the peak strain; α , β   and   η are the standardized coefficientsLi et al.,
2012 [39]
B 5 = B i 1 B i 2 , B i 1 = σ p σ r σ p , B i 2 = lg k a c A C 10 B i 1 and   B i 2 are the relative magnitude and absolute rate of post-peak stress drop, respectively; k a c A C is the absolute value of slope from yield starting point to residual starting pointZhou et al.,
2014 [40]
B 6 = B i 1 + B i 2 = σ p σ c i ε p ε p ε c i σ p + σ p σ r ε p ε r ε p σ p σ ci   is the crack initiation stress; ε ci is the crack initiation strainChen et al.,
2018 [41]
B 7 = B i B j = 1 ε p ε p / σ p σ p σ r ε p ε r σ p and σ r are the peak stress and residual stress, respectively; ε p   and ε r are the peak strain and residual strain, respectivelyLiu et al.,
2019 [42]
B 8 = lg 1 ε p / 5 + σ p σ r σ p t + ε r ε p ε p t t is the time interval between the peak strength point on the stress–strain curve and the starting point of residual strength (s)Cao et al.,
2020 [43]
B 9 = B i + B j = 2 π ε p arctan σ p ε p + σ p σ r / σ p ε r ε p / ε r σ p   and σ r are the peak stress and residual stress, respectively; ε p   and ε r are the peak strain and residual strain, respectivelyZhang et al.,
2021 [44]
B 10 = B i B j B k , B i = σ p σ ci ε p ε ci , B j = e 10 ε p ε r σ p σ r ,
  B k = 1 / ε p
B k is the coefficient of strain control; σ ci   is the crack initiation stress; ε ci is the crack initiation strainKuang et al.,
2022 [45]
Table 2. Brittleness indexes based on stress–strain curves and energy evolution.
Brittleness IndexDescriptionResearchers
B 11 = W t e W te + W d = σ p 2 2 E 0 ε p σ i d ε i W t e   is the total elastic energy; W d is the dissipated plastic energyHucka and Das, 1974 [17]
B 12 = W r W ue = M E M , B 12 = W a W ue = E M W r is the rupture energy; W a   is the additional (or released) energy;   W ue is the consumed elastic energy; E   and M are the Young’s modulus and drop modulus, respectivelyTarasov and
Potvin, 2013 [47]
B 13 = B i + B j ,   B i = σ p σ r ε r ε p B j = σ p σ r ( ε r ε p ) σ p ε p B i and B j are the pre-peak brittleness index and post-peak brittleness index, respectivelyXia et al.,
2016 [48]
B 14 = W r + W d W ue + W d = σ p 2 σ r 2 M E 2 E M + 0 ε p σ i d ε i σ p 2 2 E σ p 2 σ r 2 2 E + 0 ε p σ i d ε i σ p 2 2 E   W ue is the consumed elastic energyAi et al.,
2016 [49]
B 15 = W a W ue + W d = σ p 2 σ r 2 2 M σ p 2 σ r 2 2 E + 0 ε p σ i d ε i σ p 2 2 E W a   is the additional (or released) energyAi et al.,
2016 [49]
B 16 = E D M E M , B 16 = E D D E M E   and M are the Young’s modulus and drop modulus, respectively; D is the pre-peak yield modulusZhang et al.,
2017 [50]
B 17 = 1 2 W ue W r + W ue W te + W d = 1 2 σ p 2 σ r 2 2 E σ p 2 σ r 2 2 E + ε p ε r σ i d ε i + σ p 2 σ r 2 2 E 0 ε p σ i d ε i W r is the rupture energy; W ue is the consumed elastic energyKivi et al.,
2018 [51]
B 18 = 1 2 W te W te + W d + W ue W r = 1 2 σ p 2 2 E 0 ε p σ i d ε i + σ p 2 σ r 2 2 E σ p 2 σ r 2 2 E + ε p ε r σ i d ε i W t e   is the total elastic energy; W d is the dissipated plastic energy; W r is the rupture energy; W ue is the consumed elastic energyChen et al.,
2020 [52]
B 19 = W p r e W c W t e W t e W t e W u e W u e W p o s t   = 0 ε p σ i d ε i 0 ε c c σ i d ε i + σ c c 2 2 E σ c d 2 2 E σ p 2 2 E σ c d 2 2 E σ p 2 2 E σ r 2 2 E σ p 2 2 E σ r 2 2 E + ε p ε r σ i d ε i W t e is the total elastic energy; W te is the elastic energy in elastic stage; w c is the compaction stage energy; W pre is the total energy before peak; ε c c and σ c c are the crack closure strain and stress, respectivelyWen et al.,
2021 [53]
B 20 = W ue W r W te = 1 2 E W r + σ r 2 σ p 2 W r = ε p ε r σ 1 d ε 1 σ r 2 2 E , ε p < ε r σ r E ε p ε r σ 1 d ε 1 σ r 2 2 E + ε p ε r + σ r E 2 E / 2 , ε p > ε r σ r E W r is the failure energy density; W ue is the consumed elastic energy;   W t e   is the total elastic energyGong et al.,
2022 [54]
Table 3. Mechanical parameters of various rocks under different confining pressures.
Rock Type σ 3
/MPa
ε p
/10−3
σ p
/MPa
ε r
/10−3
σ r
/MPa
E
/GPa
W pre /
(kJ/m3)
W total /
(kJ/m3)
Granite [53]04.229120.2514.93412.02537.622236.683256.840
106.826198.4137.7174.50935.789641.066696.774
207.531284.8438.12598.45541.8671029.6121161.984
309.498339.70810.425142.04642.5991637.6211852.088
4011.464326.93113.319172.86035.3711651.3682069.166
Marble [59]23.728140.9277.09137.50054.334278.495468.527
106.056164.51614.74078.02440.135629.7651446.567
156.256179.03214.07797.37940.421685.2281742.071
308.480217.74219.185172.98455.6561374.9953515.755
4012.888238.30633.779212.90350.8902649.1037135.708
5015.571258.87132.914232.86350.1312608.1097517.521
Shale [40]03.00384.0556.9670.00032.509114.634282.584
105.526183.8278.88990.88837.816544.030966.653
257.928224.14617.778164.00941.6441188.8203300.789
409.249260.36419.940191.34442.8181631.9234284.461
Red sandstone [64]06.06767.6836.29016.46317.143191.788207.505
109.010132.31712.96060.97623.555608.519973.384
2011.999173.78014.404130.48822.8181152.6571373.155
3014.518212.80517.310162.19522.4701617.7032161.071
4514.518264.02418.673200.61022.9672123.2433028.882
Publisher’s Note: MDPI stays neutral with regard to jurisdictional claims in published maps and institutional affiliations.

