Abstract
Biodiesel is considered to be a promising alternative option to diesel fuel. The main contribution of the current work is to improve compression ignition engine performance, fueled by several biodiesel blends. Three metrics were used to evaluate the output performance of the compression ignition engine, as follows: brake torque (BT), brake specific fuel consumption (BSFC), and brake thermal efficiency (BTE), by varying two input parameters (engine speed and fuel type). The engine speeds were in the 1200–2400 rpm range. Three biodiesel blends, containing 20 vol.% of vegetable oil and 80 vol.% of pure diesel fuel, were prepared and tested. In all the experiments, pure diesel fuel was employed as a reference for all biodiesel blends. The experimental results revealed the following findings: although all types of biodiesel blends have low calorific value and slightly high viscosity, as compared to pure diesel fuel, there was an improvement in both BT and brake power (BP) outputs. An increase in BSFC by 7.4%, 4.9%, and 2.5% was obtained for palm, sunflower, and corn biodiesel blends, respectively, as compared to that of pure diesel. The BTE of the palm oil biodiesel blend was the lowest among other biodiesel blends. The suggested work strategy includes two stages (modeling and parameter optimization). In the first stage, a robust fuzzy model is created, depending on the experimental results, to simulate the output performance of the compression ignition engine. The particle swarm optimization (PSO) algorithm is used in the second stage to determine the optimal operating parameters. To confirm the distinction of the proposed strategy, the obtained outcomes were compared to those attained by response surface methodology (RSM). The coefficient of determination (R2) and the root-mean-square-error (RMSE) were used as comparison metrics. The average R2 was increased by 27.7% and 29.3% for training and testing, respectively, based on the fuzzy model. Using the proposed strategy in this work (integration between fuzzy logic and PSO) may increase the overall performance of the compression ignition engine by 2.065% and 8.256%, as concluded from the experimental tests and RSM.
1. Introduction
Recently, the energy crisis, environmental contamination, and climate change are considered the most critical difficulties facing the country [1,2,3,4,5,6]. Therefore, the increased awareness of potential environmental risks on human health has been focused on keeping engine emissions under control. Diesel fuel has a crucial problem related to exhaust, vibration, and acoustic emissions [7,8,9,10,11]. Biodiesel is considered an eco-friendly, bio-degradable, energy efficient, renewable, scientifically feasible, and non-toxic fuel alternative [12,13,14]. Besides, it is considered one of the safest fuels, because it has a high flash point amongst all conventional fuels [15], and can operate diesel engines with little or no adjustments [16]. Biodiesel can be produced from a variety of animal fats, as well as vegetable oils, processed with a catalyst and alcohol. For example, the utilization of palm oil as biodiesel is recognized as palm oil methyl ester, which is growing rapidly in popularity, due to its huge productivity and low prices. Biodiesel produced from palm oil is categorized by a high amount of saturated fatty acids and displays tremendous combustion characteristics, such as the calorific value and cetane number, despite its high kinematic viscosity at low temperatures [17]. The continuous improvement of the cetane number will actually impact the injection time, the coefficients of combustion variables, and heat release aspects, according to Labeckas and Slavinskas [18]. Various mixtures and fuel attributes have a significant impact in the ignition delay and evaporation processes, within similar experimental settings. Generally, most of the biodiesel blends have a high cetane number, no sulfur, no aromatics, and they contain up to 11 wt% oxygen. The National Renewable Energy Laboratory (NREL) [19] reported that the oxygen concentration in biodiesel fuel, including vegetable oil blends, ranges from 2.5% to 11%, for biodiesel blends of 20% and 100% by volume. In contrast, pure diesel does not contain any oxygen molecules. The significant oxygen concentration in the biodiesel enhances the combustion efficiency and decreases some of the exhaust emissions. Conversely, the main crucial drawback of biodiesel, in terms of high viscosity, leads to many difficulties in the atomization and pumping processes. Therefore, there was a need for a transesterification process. Furthermore, biodiesel fuels have greater surface tension and viscosity than regular diesel fuels, and these differences become crucial in cold circumstances, because the rate of fuel injection is greatly influenced, and the combustion mechanism might be influenced as a result. Additives have been used in biodiesel fuels to improve the biodiesel cold filter plugging point (CFPP) property and, consequently, improve the properties of the flow at low temperatures, to make them more appropriate for low-temperature operations [20]. Other drawbacks are the lower calorific value, which is about 80% of the heating value compared to that of pure diesel, low oxidation stability, high pour point, and low volatility [21,22]. To address the difficulties related to biodiesel fuel having a high viscosity, the following techniques could be adopted [23,24,25,26]: (i) Use small blend ratios with pure diesel [23]. It is commonly recognized that up to 20% of biodiesel blends can be used without engine modifications; (ii) Make a micro-emulsification by the use of ethanol or methanol [24]; (iii) Use nanoparticles as fuel additives to lower the density and viscosity of the fuel mixture [25,26]. In terms of feasibility issues, Rajak et al. [27] examined the economics of diesel fuel compared to biodiesel fuels made from Jatropha curcas and Moringa oleifera. According to the authors, the cost of diesel is nearly equal to the cost of alternative biofuels. The prior viewpoint was examined in detail and scientifically interpreted by Tasca et al. [28,29,30]. Yee et al. [30] introduced the concept of life cycle assessment (LCA), to investigate and assess whether biodiesel fuel is a sustainable fuel. The three phases of the LCA analysis were as follows: biodiesel transesterification process, agricultural processes, and oil milling. For each process, the energy and greenhouse gas balances were computed. According to the findings, the use of palm biodiesel was found to be more ecologically friendly than regular diesel fuel, with a significant 38% reduction in CO2 emissions per liter combusted.
1.1. A Literature Review of Biodiesel Engine Performance
Numerous previous works have been conducted to assess the impacts of different types of biodiesel blends on engine durability, injection manner, exhaust emission, performance, heat losses and availability, spray formation, engine vibration analysis, catalyst synthesis for biodiesel production, and acoustic emissions [31,32,33,34,35,36]. Nalgundwar et al. [37] stated that a higher cetane of palm biodiesel blends is the reason for improved brake power and results in reduced ignition delay, which makes combustion start in advance. Moreover, a higher cetane number is required for the higher engine rotational speed. Sanjid et al. [38] compared the performances of two types of biodiesels; namely, mustard and palm biodiesel fuels, with volume blends of 10% and 20%. The results showed that the BSFC for mustard biodiesel is 1% and 3.5% higher than palm biodiesel blends of 10% and 20%, respectively. Ndayishimiye and Tazerout [39] examined the engine performance of a diesel engine fueled with palm oil blends. The authors found a small increase in BSFC and BTE, compared to pure diesel fuel.
Patel et al. [40] suggested the employment of biodiesel fuel instead of pure diesel to make some modifications in diesel engines, especially for the fuel filter, fuel pumps, and injector needle, to overcome the higher viscosity of biodiesel fuel and, therefore, to improve its performance.
1.2. Literature Review on Engine Performance Optimization Approaches
To avoid financial constraints and time-consuming experiments, scholars have employed different modeling techniques, including artificial intelligence (AI), in terms of an artificial neural network (ANN) tool, and fuzzy modeling in modeling engine performances and exhaust emissions [41,42,43,44]. Accordingly, the correlation coefficient between the experimental data and ANN predictions can accurately forecast the engine efficiency and exhaust emissions powered with biodiesel mixes [45].
The fuzzy model is a more advantageous method to estimate the parameters of the diesel engine that maximized the engine performance, as compared to other techniques, such as the computational fluid dynamics reaction kinetic model, because it necessitates less time and effort [46,47]. On the other hand, computational techniques for studying internal combustion engines have several drawbacks. To avoid this, Salam and Verma [48] innovated an alternate, non-traditional way to explore the challenge of empirical redundancy in engine operation and behavioral characterization. This study provided a unique empirical approach to assess the relative empirical importance of chosen variables of interest, addressing the comprehensibility of engine operation. Furthermore, Salam and Verma [49,50] employed redundancy to create a sequence of variables of interest, depending on their importance in the ICE operation. Dey et al. [51] examined the performance of a single-cylinder compression ignition (CI) engine, fueled by palm/diesel and ethanol biofuel blends, using two models of ANN and RSM. The results revealed that the optimized engine performance, in terms of BTE and BSFC, was obtained from a blend of 20% palm biodiesel, mixed with 5% ethanol and 75% pure diesel at full load. Krishnamoorthi et al. [52] maximized the diesel engine performance responses with two approaches (ANN tool and RSM). The engine was powered with diesel/vegetable oil/diethyl ether blends at different engine loads, along with various compression ratios. The error percentage of the two approaches was rated less than 5%. Therefore, the authors stated that the application of previous approaches plays a crucial role in improving engine performance. Dey et al. [53] and Reang et al. [54] employed the fuzzy-based Taguchi technique, to boost CI performance and reduce emission characteristics for a CI engine, with varying engine loads and varied biodiesel blends. Shirneshan et al. [55] used response surface techniques to investigate the effects of biodiesel–ethanol fuel mixes on the performance of a CI engine. Parameter optimizations were also performed, using the genetic method. According to the findings, increasing the quantity of ethanol in the gasoline combination reduced BP and BT by around 30%. Because ethanol has a lower calorific value than biodiesel, the BSFC of fuel blends increased by roughly 16% with a larger proportion of ethanol. To minimize and identify the proper number of experimental trials, the Taguchi experimental approach could be utilized [56]. Rith et al. [57] employed RSM and the desired function to optimize a dual gas-diesel fuel engine, with several objectives. The goal was to use the desired function to optimize the desirability of SFC and specific exhaust emissions, at a high engine speed of 3000 rpm. The optimal desirability of 0.829 was reached with input parameters of 11° BTDC. Ghanbari et al. [58] examined how the percentage of alumina nanoparticles in biodiesel blends affected the exhaust emissions and performance of a CI engine. Furthermore, the authors designed empirical correlations, using RSM, to simulate diesel engine performance and exhaust emissions powered by nano biodiesel fuel mixes. The findings of the experiments demonstrated that alumina nanoparticles are a useful addition to diesel–biodiesel blends, to boost engine performance and reduce exhaust emissions. Devarajan et al. [59] examined CI engine performance by adding nanoparticles of silver oxide as additives, in various weight fractions, to a palm oil biodiesel. According to the results, the addition of nanoparticles to biodiesel improves the igniting behavior.
1.3. Research Gap, Objectives, and Originality
Although there are many articles in the literature about engine performance using different biodiesel fuel blends, there is still a gap in its modeling-based AI and modern optimization of the diesel engine. The current research aims to investigate a diesel engine, operated at full load conditions and at various engine speeds. In this work, engine performance has been studied extensively for an unmodified diesel engine, fueled with corn, sunflower, and palm biodiesel blends. Then, based on the experimental results, a robust fuzzy model, to simulate the output performance of the compression ignition engine, was created. Finally, a PSO algorithm was used to establish the best operating parameters. To confirm the distinction of the proposed strategy, the obtained outcomes were compared to those attained by RSM. Therefore, the novelty of this study relates to the integration between fuzzy logic and particle swarm optimization, to determine the optimal engine speed and the best fuel type that maximizes the output BT and BTE and significantly minimizes the BSFC.
1.4. Manuscript Organization
The rest of the manuscript is structured as follows: The experimental setup is discussed, in terms of biodiesel preparation, biodiesel characteristics, experimental equipment and procedure, engine performance measurements, proposed modeling and optimization, including fuzzy modeling, ANOVA test, and PSO in section two. The influence of biodiesel blends on diesel engine performance in terms of BT, BSFC, and BTE under full load and at various engine speeds was examined in section three, using the observed experimental results, combined with the uncertainty analysis. In addition, in section three, the outcomes of modeling and optimization, using fuzzy-based modeling logic, PSO algorithm to determine the optimal engine speed and best fuel type that maximize output BT and BTE, while momentarily minimizing the BSFC, RSM based on ANOVA test, and the best input parameters and related output performance from the RSM-based optimization method, were discussed and analyzed. In section four, we compared the performance of the experimental, RSM, and suggested strategies. Finally, the findings of the investigation were summarized in section five, which leads to the conclusion.
2. Experimental Setup, Equipment, Procedure, Modeling, and Optimization
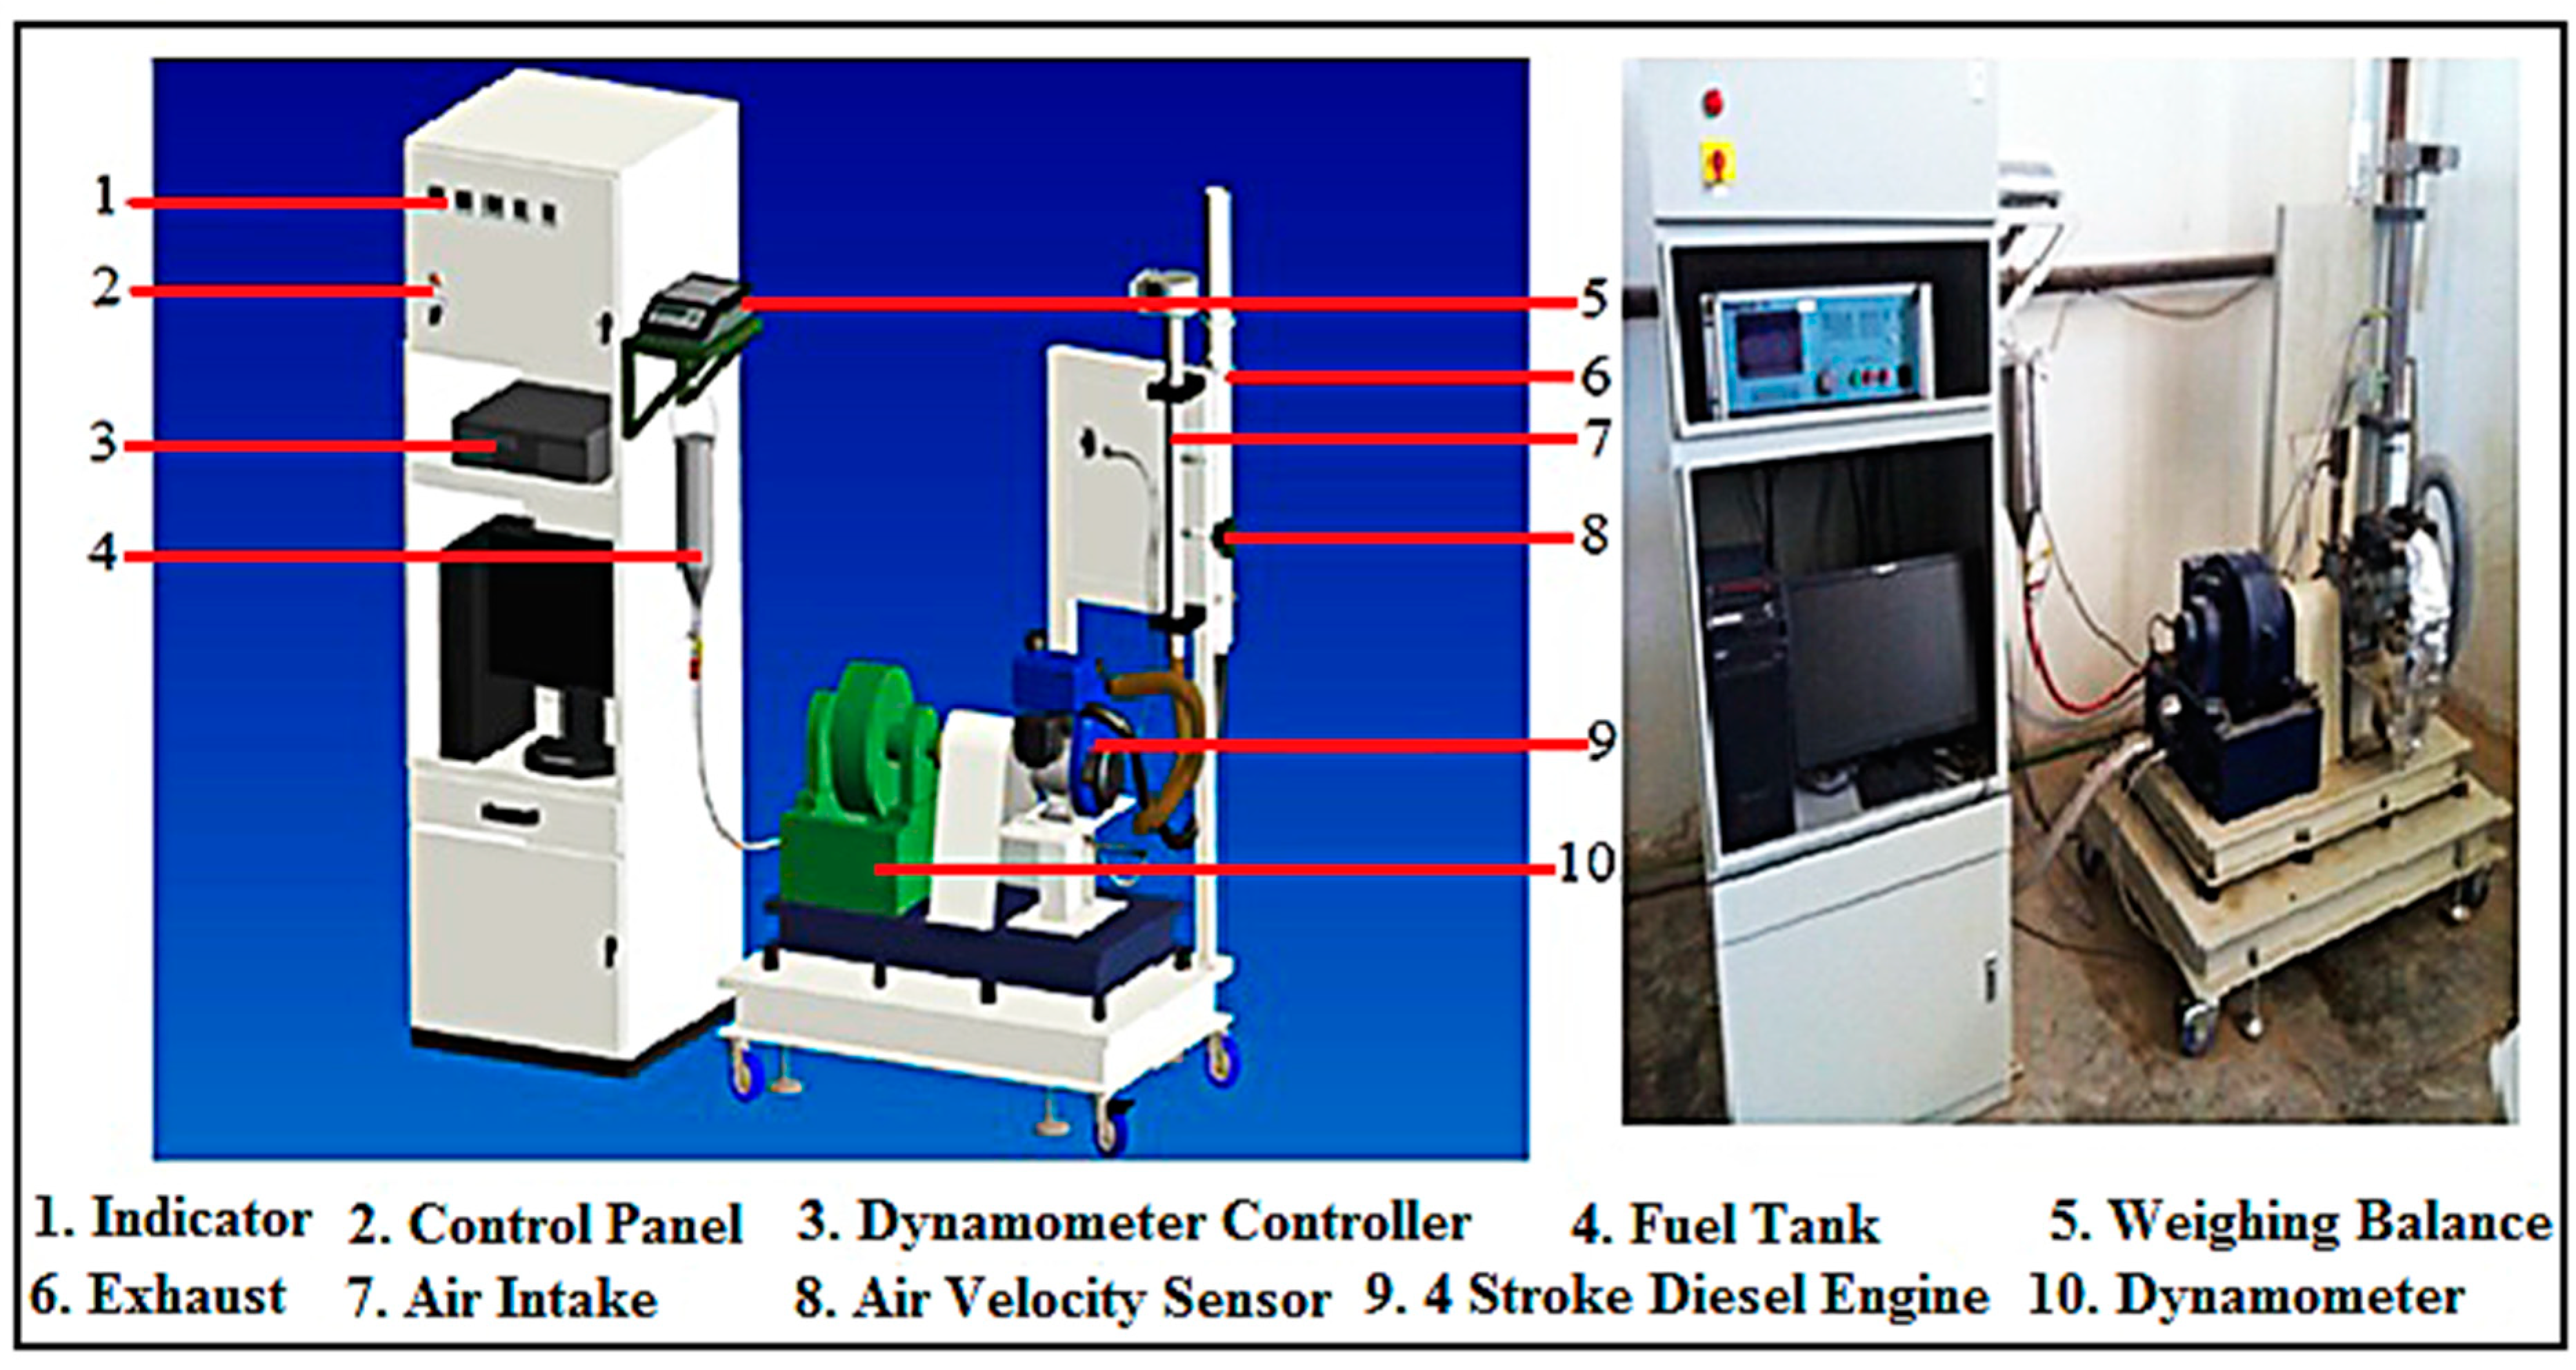
A set of tests were carried out using a single-cylinder, water-cooled, four-stroke, and a direct injection PETTER PHIW Lister LV1 CI engine, with a compression ratio of 17:1, which is primarily powered by pure diesel fuel. The details of diesel engine specifications are demonstrated in Table 1. All tested fuels, which were pure diesel, corn biodiesel, sunflower biodiesel, and palm biodiesel, were implemented without making any adjustments to the diesel engine. The schematic diagram of an experimental diesel test engine is depicted in Figure 1.

Table 1.
Technical data of PETTER PHIW diesel engine.
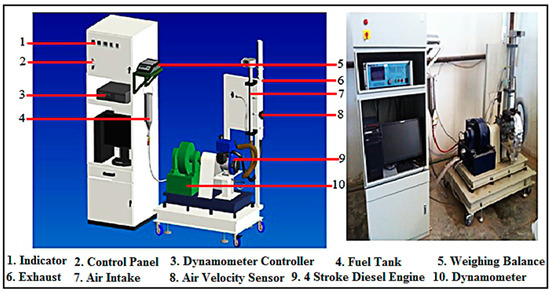
Figure 1.
Schematic diagram of an experimental diesel test engine.
2.1. Biodiesel Preparation
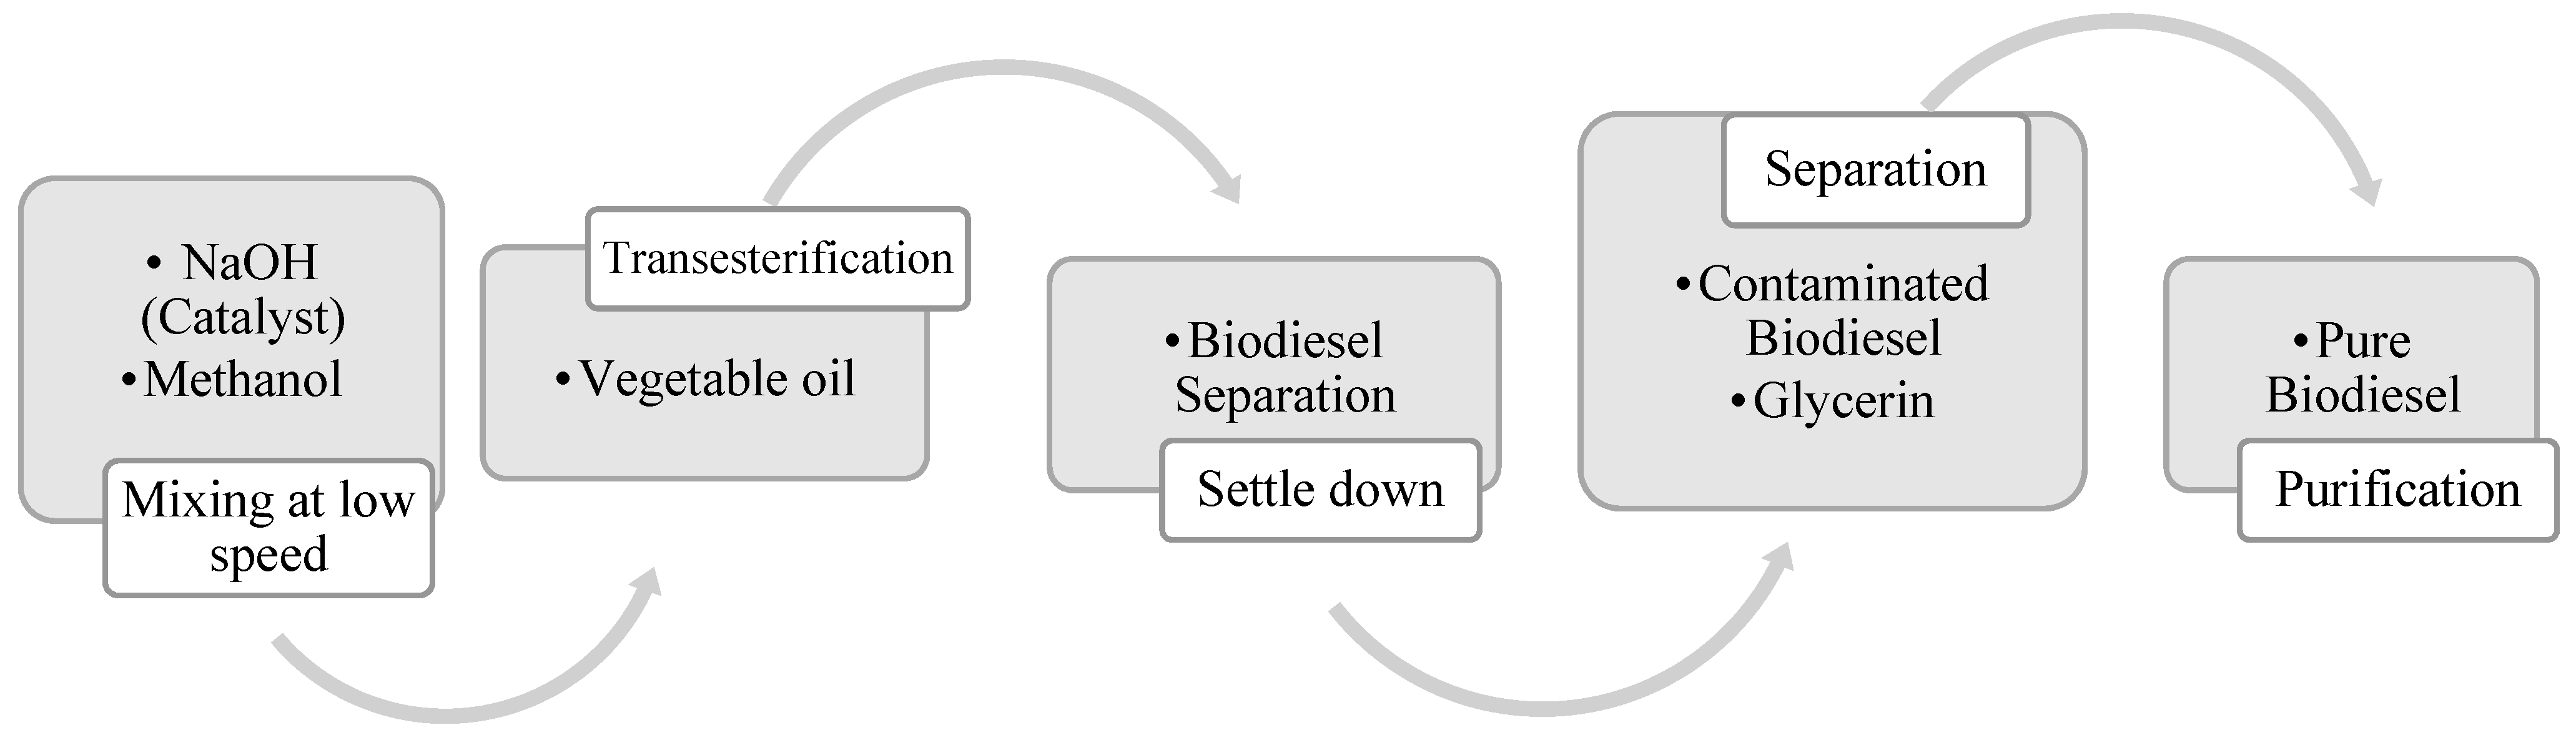
As displayed in Table 2, numerous techniques have been used, including blending with transesterification, petrodiesel, pyrolysis, and microemulsification [60,61,62,63,64]. In our experimental test, three different biodiesel blends, consisting of 20 vol.% of vegetable oil and 80 vol.% of pure diesel fuel (namely, corn, sunflower, and palm biodiesels) were prepared according to the following procedure and depicted in Figure 2: 4 g of sodium hydroxide was added to 200 cm3 of methanol in an electrical blender at low speed for around 2 min. The reaction heats up the mixture. It was vigorously stirred until all of the sodium hydroxide was fully dissolved in the methanol to form sodium methoxide. 1000 cm3 of vegetable oil was preheated to 65 °C and added gradually to the previous mixture, while the electrical blender continued operating for around 30 min. After blending, the solution was left for 4 h of reaction time to settle down. Finally, the solution is separated by gravity into two layers; one at the top is the biodiesel and one at the bottom is glycerin. Darker colored glycerin was gathered in a distinct layer at the bottom of the container, with an obvious line of separation from the pale liquid above, which was biodiesel. To eliminate all traces of glycerin and contaminants, the biodiesel product must be rinsed. The washing technique involves adding hot water to the biodiesel and allowing it to settle for 12 h in a separating funnel. The bottom layer was gradually removed until the sample was transparent. To eliminate the water content, the purified biodiesel was poured into a beaker and heated to 55 °C. Table 3 displays the percentage of fatty acids in oil materials used [60,64,65]. The measured fuel properties are recorded in Table 4, accompanied by equipment specifications.
Table 2.
A summary of alternative biodiesel preparation approaches [60,61,62,63,64].

Figure 2.
Production steps of vegetable oil biodiesel.
Table 3.
Percentage of fatty acids in oil materials used [60,64,65].
Table 4.
Measured fuel blend properties of all tested fuel [60,68,69,70,71,72,73].
According to the following equation [66,67], the % error related to the experimental quantities was determined as depicted in Table 4.
2.2. Engine Performance Measurements
A trunnion-mounted, swinging field of a direct current (DC) electrical machine capable of absorbing a maximum load of 10 kW at a speed of 4000 rpm was utilized as the dynamometer. The rated BT was 50 Nm. Torque was measured with a precision of ±0.2–0.3% of full scale (FS), whereas rotational speed measurement accuracy was ±1 r/min. The engine was driven by a speed-increasing tooth belt. A strain gauge load cell system with mechanical overload protection was included, as well as appropriate calibration equipment. For speed measurement and feedback to the control system, a toothed wheel and magnetic pick-up were employed. A dynamometer attached with a DC motor to produce a load was used to evaluate the engine brake power. A varying field current regulated the load and operation. Therefore, this dynamometer can work at different loads and speeds according to any required amount of torque. Because the test used a regular engine speed, the dynamometer power absorption unit absorbed the power generated by the engine to drive a DC motor that works as a generator to produce a load. This absorption unit delivered a variable quantity of braking torque to operate the engine at the desired rotation. Moreover, the braking power absorption unit on the engine was executed using an electronic control unit. The dynamometer control system is a microprocessor-controlled, completely regenerative thyristor drive that enables the dynamometer to run a motor or generator at a constant speed. A strain gauge load cell sensor was used to assess engine load. The magnetic pick-up sensor was used to monitor engine speed using a dented wheel on the dynamometer shaft. The performance test measurements are regulated according to the following procedure: The engine warms up until the cooling water and lubricating oil reach the set operating temperatures. After that, the choke is opened gradually by turning the lever to its widest setting. The speed control lever is set to the low-speed position and warms it up without applying the load for a few minutes. The speed control lever is gradually moved towards the high-speed position and set to the required engine speed. The tested fuel is applied. The following parameters were recorded: a digital tachometer was utilized to quantify the engine speed, the dynamometer was employed to measure a BT, temperatures of the exhaust gases, lubricating oil, and cooling water were monitored with a thermocouple type K of resistance temperature detectors (RTD) integrated with a high-temperature surface probe with accuracy of ±1.6 °C. Finally, install the air velocity sensor in the air intake duct, ensuring that the sensor element is aligned with the airflow and in the middle of the duct with an accuracy of ±0.3% full-scale deflection (FSD). The twin bulb glass burette and timer were used to calculate the fuel consumption rate with an accuracy of (±0.05 cm3).
The previous steps were repeated for different biodiesel fuel blends. Before conducting any test, the engine and dynamometer were calibrated and regulated to their default values. After the engine was stabilized, all of the measurement data were logged. For each tested fuel, the experiments were repeated three times and the average of the measurements was taken.
2.3. Modeling and Optimization
There are two stages to the suggested modeling and optimization technique. The first phase involves fuzzy modeling based on an experimental dataset to predict the compression ignition engine’s output performance. To confirm the distinction of the fuzzy model proposed in this work, the obtained results are compared to those attained by ANOVA. The second phase is determining the engine speed and the best types of fuel using PSO. Unlike mathematical methods, the definition of the model structure that makes up the system rule base is the first step in the fuzzy modeling technique. Thus, the relation between inputs and outputs are represented by fuzzy IF-THEN rules. In the case under study, the Takagi–Sugeno fuzzy was adopted to build the fuzzy rules because it can track the nonlinear input data. The inputs’ membership functions were selected as the Gaussian shape. The rules are typically established depending on dataset inputs [74]. The following expressions are simply adopting the form of a fuzzy rule statement for a two-input single-output system:
where, MFx, and MFy are the fuzzy membership functions for two inputs, x and y, respectively; MFz is the fuzzy membership function for a single output z.
IF x is MFx and y is MFy THEN z is MFz
One of the most well-known optimizers is PSO. Kennedy and Eberhart proposed the initial form of PSO. The main concept of PSO is derived from the natural flocking behavior of birds [75]. The original PSO is fairly simple and straightforward. Every particle has the potential to be a prospective solution. It consists of the two following vectors: velocity and position. The values for each of the variables in the problem are included in the location vector. The velocity is taken into account while changing the position of particles. For each dimension and particle separately, the velocity determines the magnitude and direction of step size. Further information on the mathematical representation and physical dispersion can be found in [76]. The following is a description of the updating process for particle velocity and location.
where, V indicates velocity, Pbest is the best solution, gbest is the best solution globally. c1 and c2 denote cognitive and social aspects, r1 and r2 are random values, and t represents the number of iterations.
Figure 3 displays a schematic diagram of the experimental approach integrated with an optimization process.
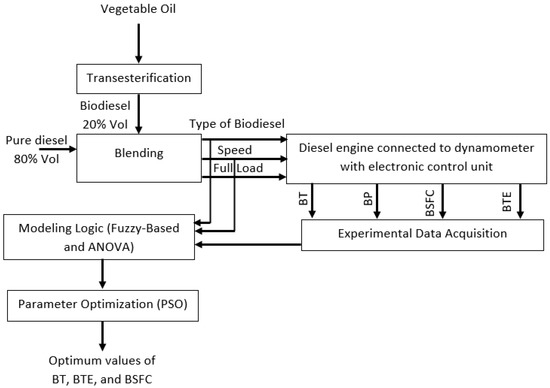
Figure 3.
A schematic diagram of the experimental approach integrated with an optimization process.
3. Results and Discussion
The generated experimental findings provide a thorough examination of the impact of biodiesel blends on diesel engine performance, under full load and at different engine speeds.
3.1. Engine Performance Analysis
The effects of biodiesel blends on the CI engine BT, BP, BSFC, and BTE, at different engine speeds, have been investigated and discussed in the following sections.
3.1.1. Engine Brake Torque (BT) and Brake Power (BP)
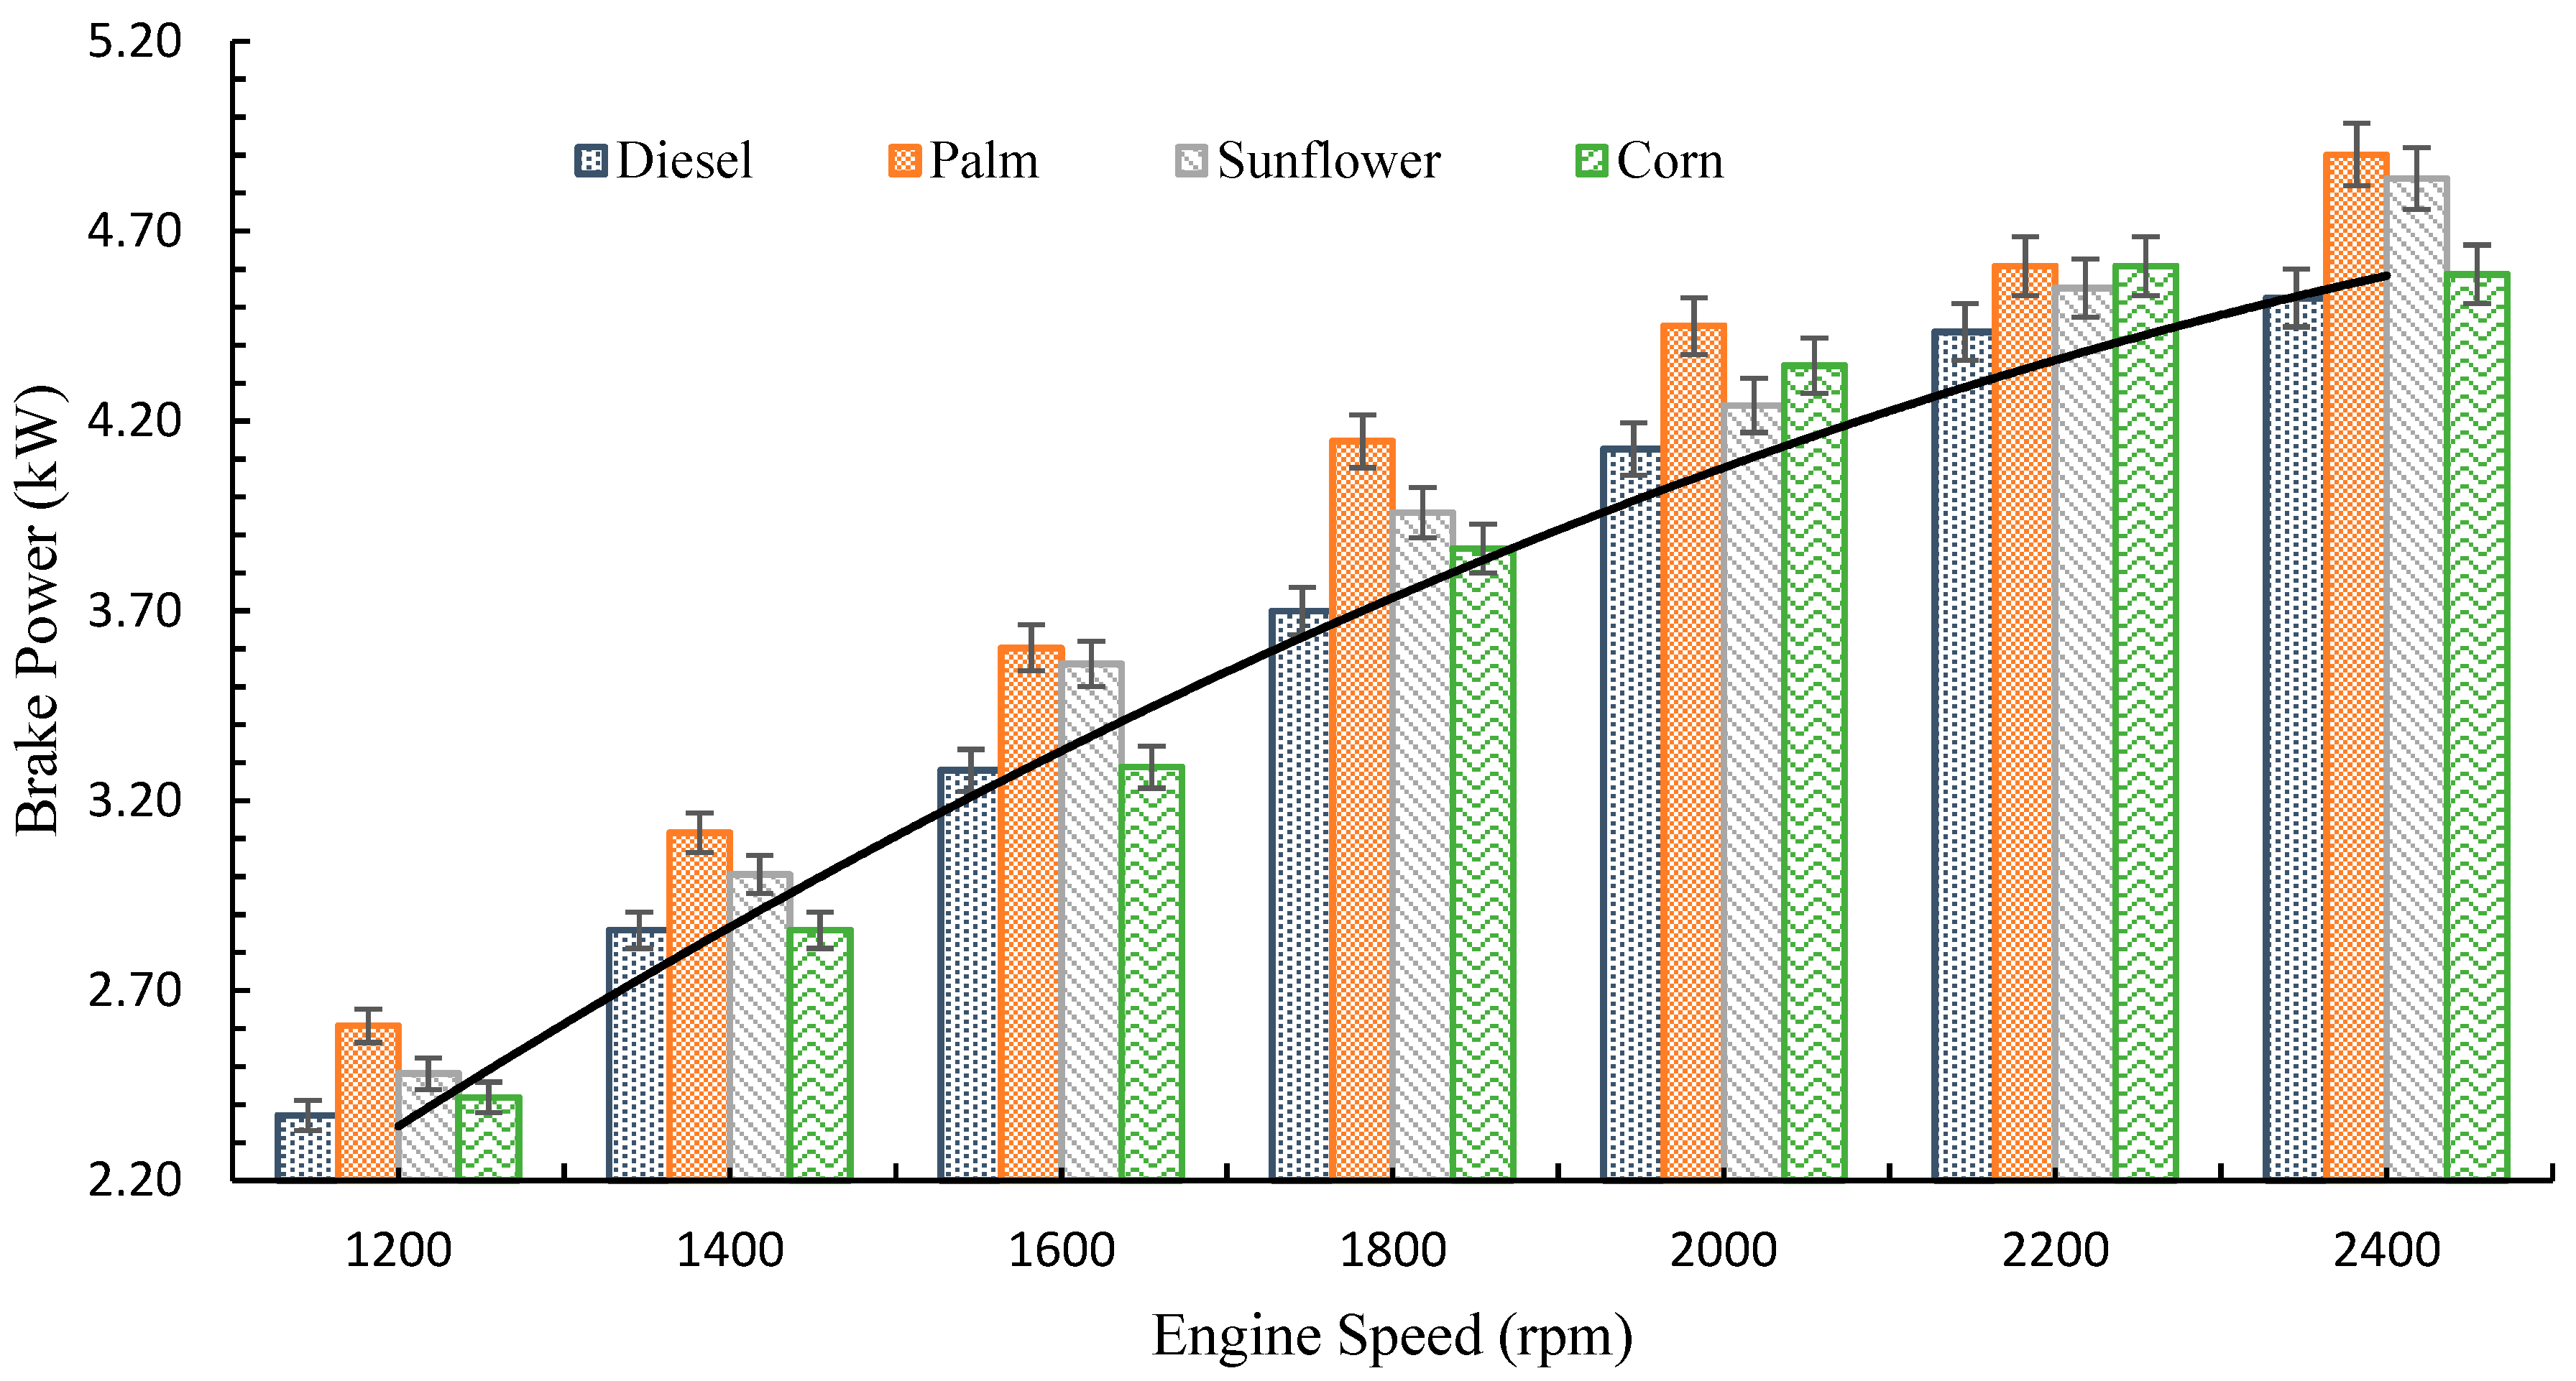
The variations of BT and BP output of the diesel engine, at various engine speeds, powered by different biodiesel blends, are displayed in Figure 4 and Figure 5, respectively. As depicted in Figure 4 and Figure 5, the BT of a diesel engine increases with the engine speed, peaking at 1800 rpm, and then decreasing as the engine speed increases. The decrease might be attributed to the higher friction loss and a lack of air consumption at high speeds [77,78]. Although all types of biodiesels have a lower calorific value and a slightly higher viscosity than pure diesel, engine BT and BP are improved. On average, palm, sunflower, and corn biodiesels improved brake power by 8.7%, 5.4%, and 2.5%, respectively, as compared to pure diesel. The higher content of oxygen in all blends of biodiesel, which improves the combustion behavior to become more complete [43], might be responsible for the increased brake power. Typically, the diesel fuel is pumped into the engine according to volumetric measures. The density of all forms of biodiesel mixes is greater than pure diesel. As a consequence, for the same fuel volume, a higher fuel flow rate must be injected into the engine cylinder. Because of the high viscosity of biodiesel blends, there was less internal leakage in the diesel fuel pump [79]. Lapuerta et al. [80] attributed the change in brake power not only to the change in fuel mass supplied, but also due to the fact that the volume pumped was greater (1.2–3.2%) when biodiesel was used, especially in full-load settings. Biodiesel has a greater viscosity, which lowers backflow over the piston clearance for the injection pump. Furthermore, as the injection temperature was increased, the disparity in fuel delivery reduced, indicating that the viscosity of the fuel had decreased. However, when the injection temperatures for diesel and biodiesel were altered to achieve comparable viscosities, the volume of diesel fuel injection was somewhat higher, due to its lower density, which boosts flow rate across orifices. The increased lubricity of biodiesel may contribute to reducing friction loss, resulting in more effective braking [16]. Mekonen and Sahoo [81] proposed a method of preheating intake air, to increase the braking power of palm biodiesel engines. Preheating the intake air decreases the ignition delay, allowing the obtainable oxygen in the combustion chamber to be utilized for combustion, resulting in completing combustion and improved energy conversion. Furthermore, preheating the intake air has a significant impact on fuel atomization, resulting in full combustion and, hence, increased brake power. Many studies [82,83] have shown that increasing the biodiesel content ratio reduces the heating value and increases the viscosity of biodiesel, resulting in erratic combustion, which reduces engine BT and BP. On the other hand, the reduced fuel leakages in the injection pumping system, the advanced combustion process, and better biodiesel lubricity have all been identified in response to the aforementioned power regeneration.
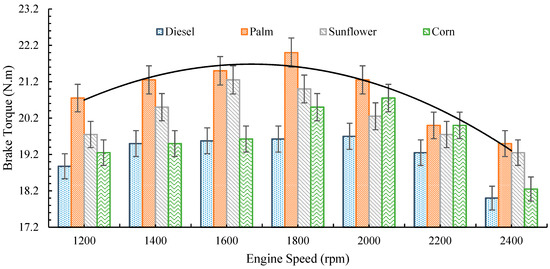
Figure 4.
Variation of BT output vs. engine speed for different biodiesel blends.
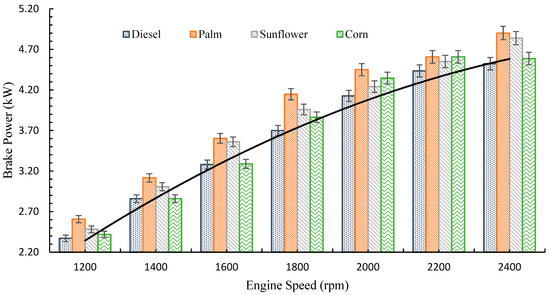
Figure 5.
Variation of brake power vs. engine speed for different biodiesel blends.
3.1.2. Brake Specific Fuel Consumption (BSFC)
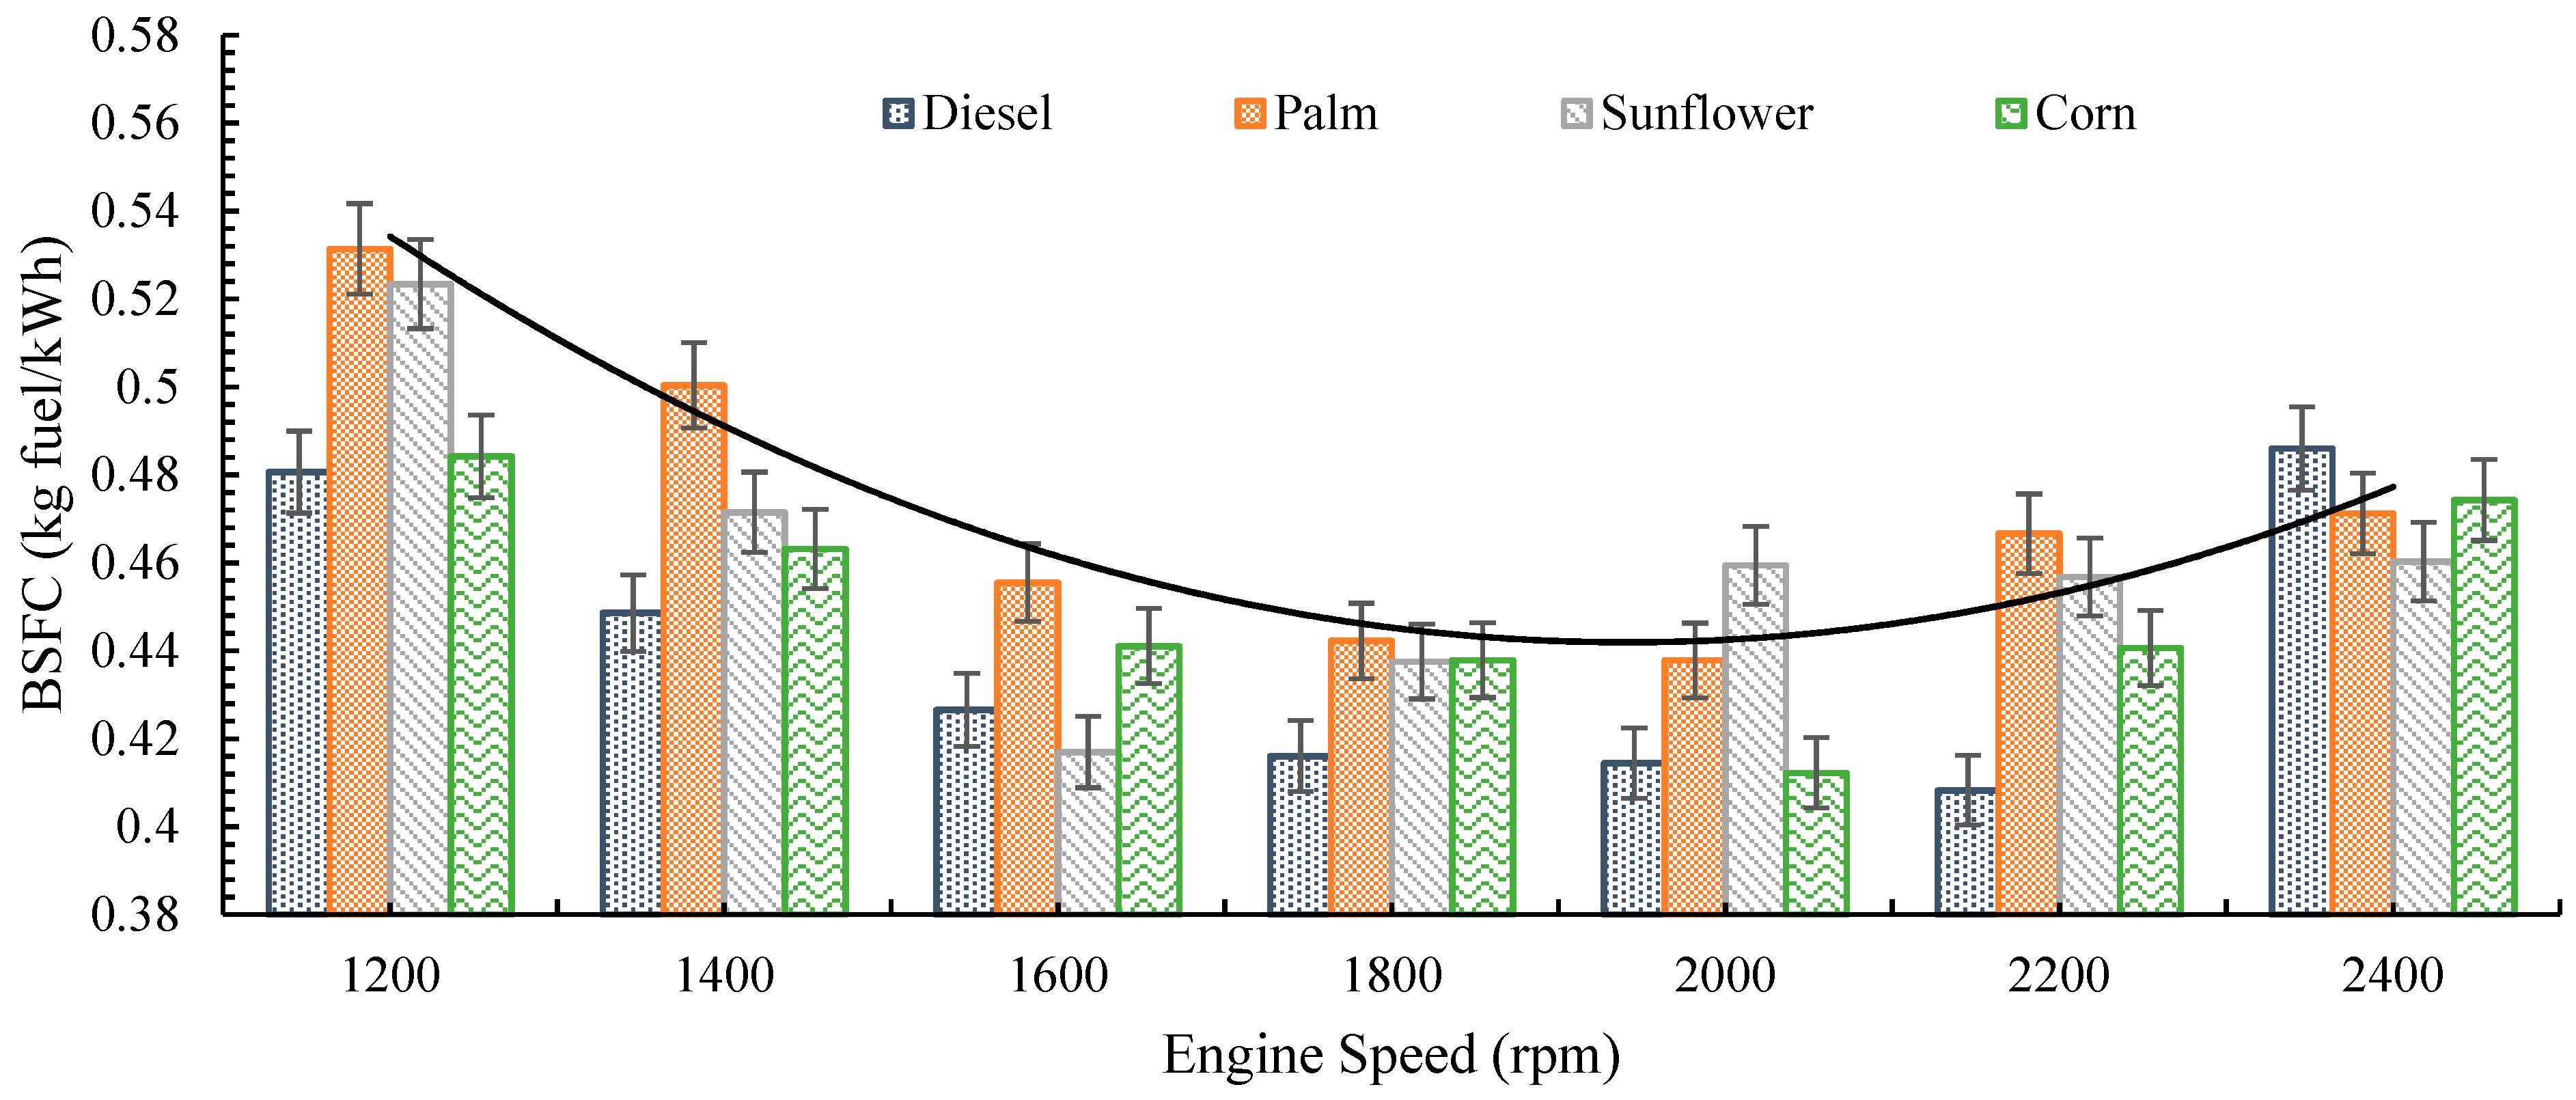
Figure 6 depicts the nature of BSFC against engine speed, for pure diesel and various kinds of biodiesel fuel. The BSFC gradually declines with engine speed, until it hits a minimum, then increases with engine speed. This was the case for all of the tested fuels. Greater heat loss towards the combustion chamber walls, which decreases combustion efficiency and increases fuel consumption, is a major cause of this reduction. The rise in BSFC is due to an increase in engine friction at high engine speeds. Another finding was that all biodiesel mixes had greater BSFC than pure diesel, especially at low engine speeds. The indirect reasons for the increased specific fuel consumption are as follows: (i) lesser formation of a finer dispersion, due to relatively low biodiesel vaporization (micro-explosion), (ii) less air entrained in the spray due to decreased momentum and penetrating force, and (iii) decrease in the local excess air ratio due to the biodiesel being replaced. In comparison to pure diesel, palm, sunflower, and corn biodiesels showed, on average, an increase in BSFC of 7.4%, 4.9%, and 2.5%, respectively. Because all biodiesel mixes have a lower calorific value than pure diesel, they require greater fuel consumption to generate the same braking power output. Since palm biodiesel has the highest kinematic viscosity, which leads to poor fuel atomization and mixture formation, it has a higher rise in BSFC than the other tested fuels [84]. Another observation was that at high engine speeds, above 2000 rpm, there was a small difference in BSFC for all biodiesel mixes, compared to pure diesel. It indicates that all biodiesel fuels tested may get an increase in combustion efficiency. This enhancement is attributed to increased diffusion rates for biodiesel fuel vapor inside the combustion chamber, which stimulates the formation of an air–fuel mixture prior to beginning the ignition, in the form of fine spray, related to fast evaporation. Due to an increase in the cetane number, the studied biodiesel fuel blends featured a shorter ignition delay, resulting in more power combustion efficiency and less fuel burning in pre-mixed combustion [85]. According to Fayad et al. [86], increasing the proportion of biodiesel in fuel mixes increases the BSFC, for various engine loads and speeds. Further investigations have shown similar outcomes [83,87,88].

Figure 6.
Variation of BSFC vs. engine speed for different biodiesel blends.
3.1.3. Brake Thermal Efficiency (BTE)
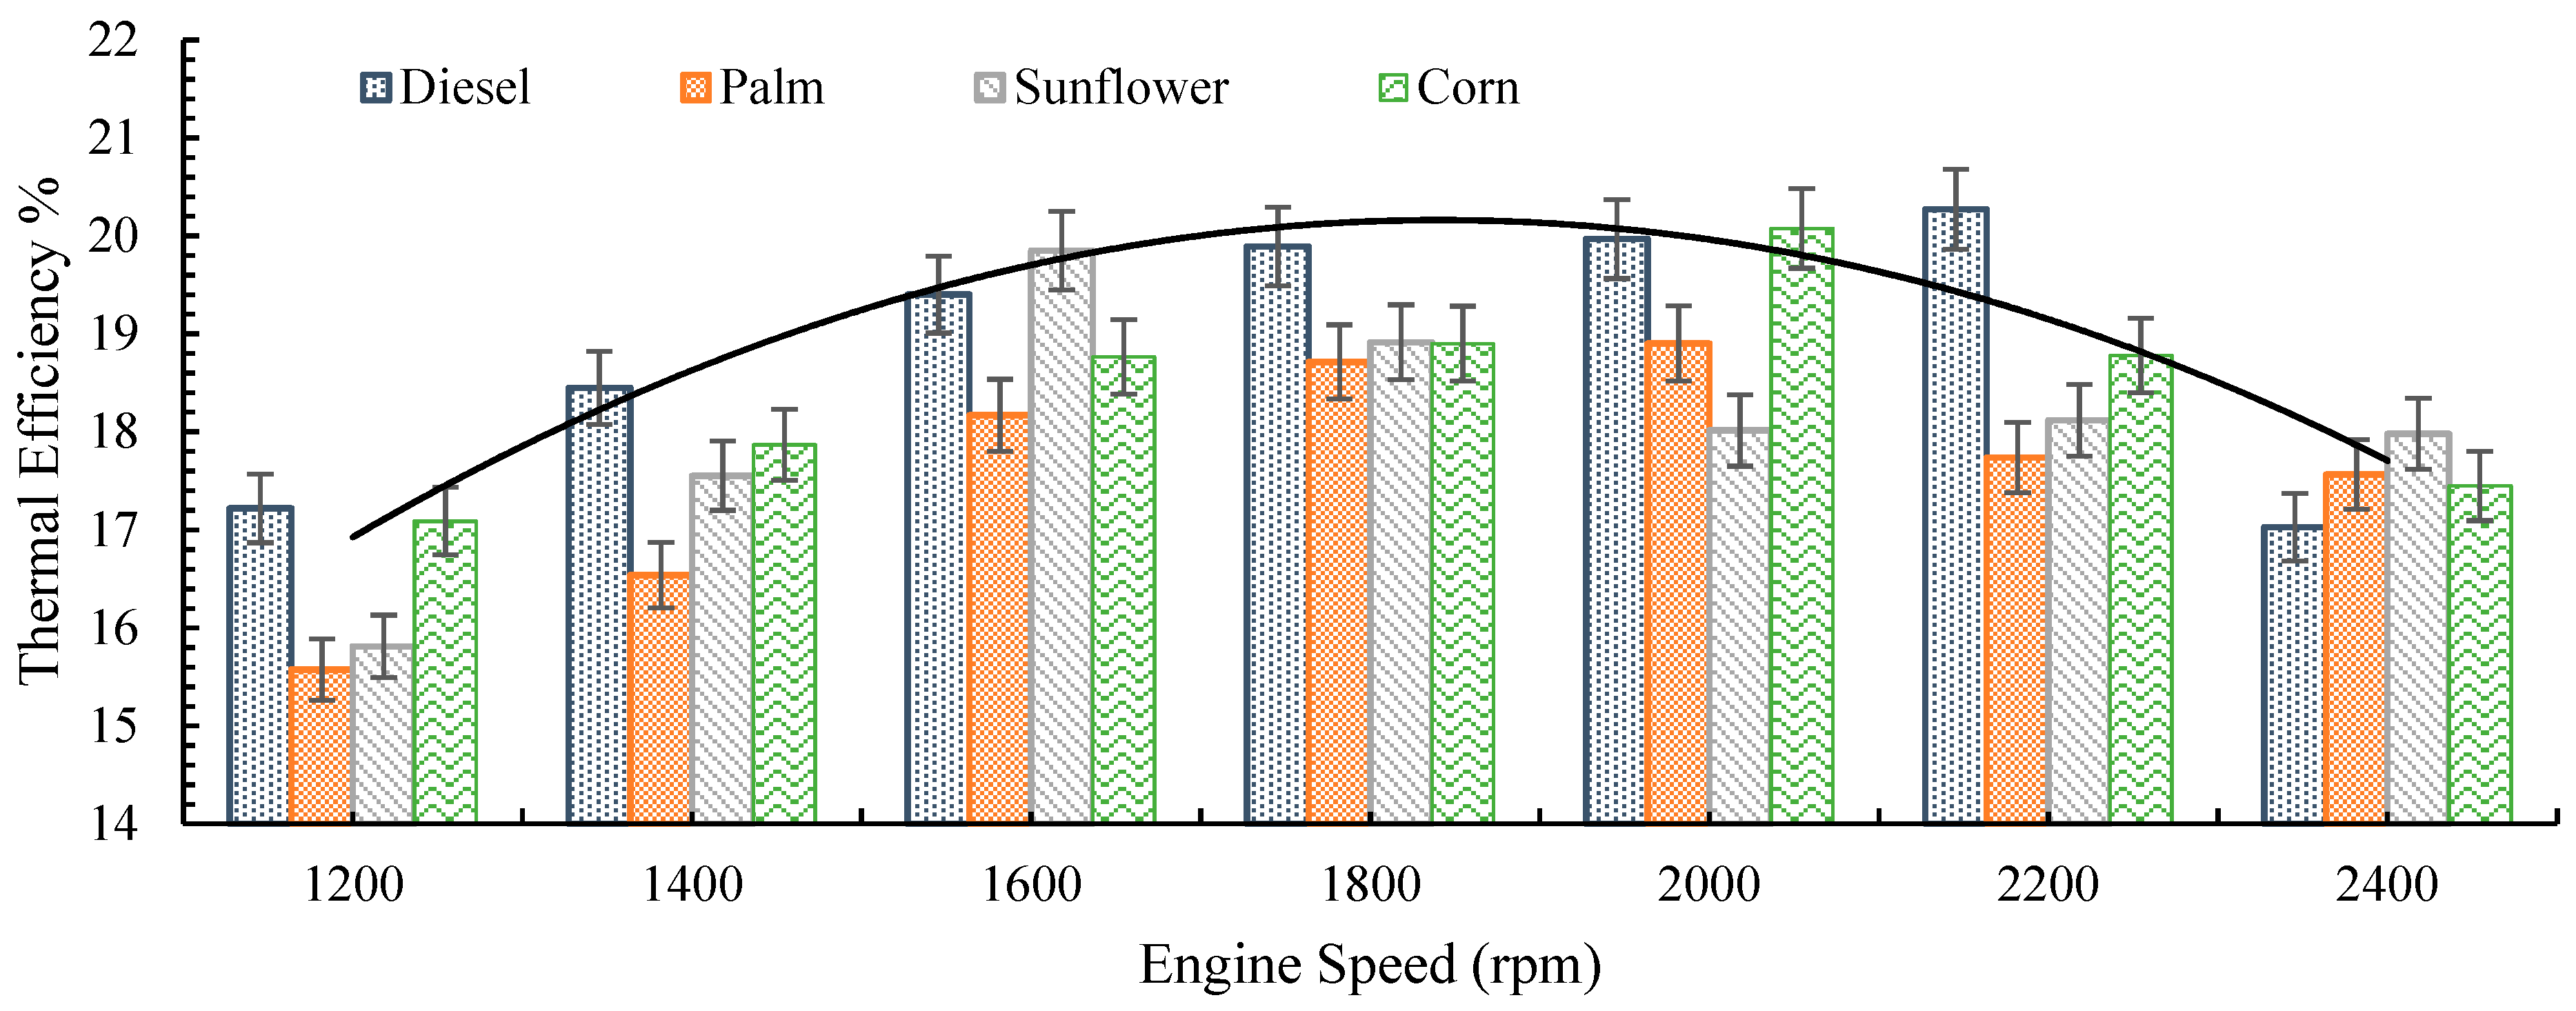
The fluctuation of BTE for pure diesel and various biodiesel blends, over a range of engine speeds, is displayed in Figure 7. The BTE steadily improves with engine speed, until it reaches a maximum value, as depicted in this figure. This then lowers, as the engine speed rises. This trend might be explained by the fact that cylinder walls take a long time to transmit heat, especially at low speeds, resulting in a considerable amount of fuel being required to compensate for the increased heat loss. The braking power increases as the engine speed rises, resulting in better BTE. Due to the high inertia of the moving parts, friction power increases fast at higher speeds, which might be a result of the decrease in BTE. Another observation is that, as compared to pure diesel, all biodiesel blends have a poorer BTE. In comparison to pure diesel, palm, sunflower, and corn biodiesel had, on average, BTE drops of 6.7%, 4.4%, and 2.4%, respectively. The use of biodiesel fuel causes higher thermal friction losses, which transfer to the cylinder walls and engine coolant. The brake BTE is known to be inversely related to the BSFC and heating value [89]. For all biodiesel blends, for example, BSFC increased, while the heating value dropped. In this scenario, however, the brake-specific fuel consumption increase is more prominent. This explains why, despite their low heating value, biodiesel blends have a lower BTE. Furthermore, as compared to pure diesel, biodiesel blends have a shorter ignition delay, which implies that combustion begins sooner. As a result of the shorter ignition delay, more heat is lost to the environment, requiring more power for the piston to complete the compression stroke. According to Khiraiya et al. [90], the kinematic viscosity of palm biodiesel is 150% that of pure diesel fuel. Palm biodiesel requires a greater injection pressure than diesel, due to its higher kinematic viscosity, resulting in smaller diameter droplets and poorer BTE. In terms of fuel injection system design, sound speed and bulk modulus data are critical. In the fuel injection system, the speed of sound and the bulk modulus of the fuel have a significant impact on the fuel injection time. The propagation of pressure waves, from the fuel injection pump to the injectors, requires a few degrees of crank angle, especially in pump-line-nozzle injection systems [91]. According to Szybist et al. [92], biodiesel has a higher bulk modulus and sound velocity, as well as its higher viscosity, resulting in earlier injection starts. This, combined with any increment in the cetane number, has the potential to dramatically speed up and advance the combustion process. Traditional diesel engines require delayed combustion to reduce pressure and temperature peaks in the combustion chamber. A delay will result in a reduction in BTE and braking power. When the injection starts, and therefore the combustion process is advanced, the combustion process is re-centered, and the BP improves [93]. Many researchers reached the same conclusions [37,87,90,94,95,96]. However, a few scholars [21,23,97] observed the opposite pattern. They attributed the enhanced BTE to the oxygenated biodiesel fuel’s better combustion characteristics, or to the lower friction loss as a result of increased lubricity. Because of the tight tolerances in the injectors and injection system, high lubricity is essential for diesel fuels. More friction and wear between moving elements inside the injection system may occur if a diesel fuel with low lubricity is utilized.

Figure 7.
Variation of thermal efficiency vs. engine speed for different biodiesel blends.
Table 5 presents a brief quantitative comparison of the current work to previous studies published in the literature.
Table 5.
Comparison of the current work to previous studies published in the literature [39,86,98,99,100,101,102,103].
3.2. Uncertainty Analysis
The outcomes evaluated from the experimental tests were commonly estimated from measured physical parameters. These values have some errors, due to their uncertainty measurements. Therefore, to compute the difference between the experimentally measured value and the typical true value of a quantity, an uncertainty analysis was used to certify the reliability of the calculated physical quantities. The technique, suggested by Holman [104], was anticipated to measure the experimental uncertainties. According to this technique, if the outcome, R, is a set function of the variables x1, x2, x3… xn, and ω1, ω2, ω3… ωn are the uncertainties in the independent variables. Therefore, uncertainty in the results ωR is evaluated by Equation (5) [105], as follows:
The quantity of uncertainty percentage is calculated by Equation (6), as follows:
For instance, the uncertainty error in braking power (BP) is evaluated as a function of rotating engine speed (N) and torque (T).
In regard to Equation (5), the uncertainties for measured physical quantities, such as BT, BP, BSFC, and BTE were evaluated as ±1.82%, ±1.68, ±1.94%, and ± 2.02% respectively, which indicates the evaluated results are reliable.
3.3. Modeling and Optimization
3.3.1. Fuzzy-Based Modeling Logic
The following three outputs were utilized to replicate the CI engine’s output performance: BT, BTE, and BSFC. The output performance of the CI engine was investigated by varying the following two input parameters: engine speed and fuel type. The tests were conducted at various engine speeds, ranging from 1200 to 2400 rpm. Pure diesel, palm oil, sunflower oil, and corn oil were the four types of fuel examined. The experimental dataset was split into two parts, with a ratio of 70:30 training:testing stages. The fuzzy model structure is a Sugeno-type, adaptive network-based fuzzy inference system (ANFIS). In addition, the fuzzy rules were developed using the subtractive clustering approach, which yielded 10 fuzzy rules. For the fuzzification procedure, the MFs inputs were chosen as the Gaussian shape, and just 10 epochs were determined to be adequate for training. During training and testing, the following three metrics were used to assess the accuracy of a fuzzy model: mean square error (MSE), root-mean-square error (RMSE), and R2. The values of the statistical metrics of the fuzzy model response are shown in Table 6.
Table 6.
Statistical evaluation for the fuzzy-based models.
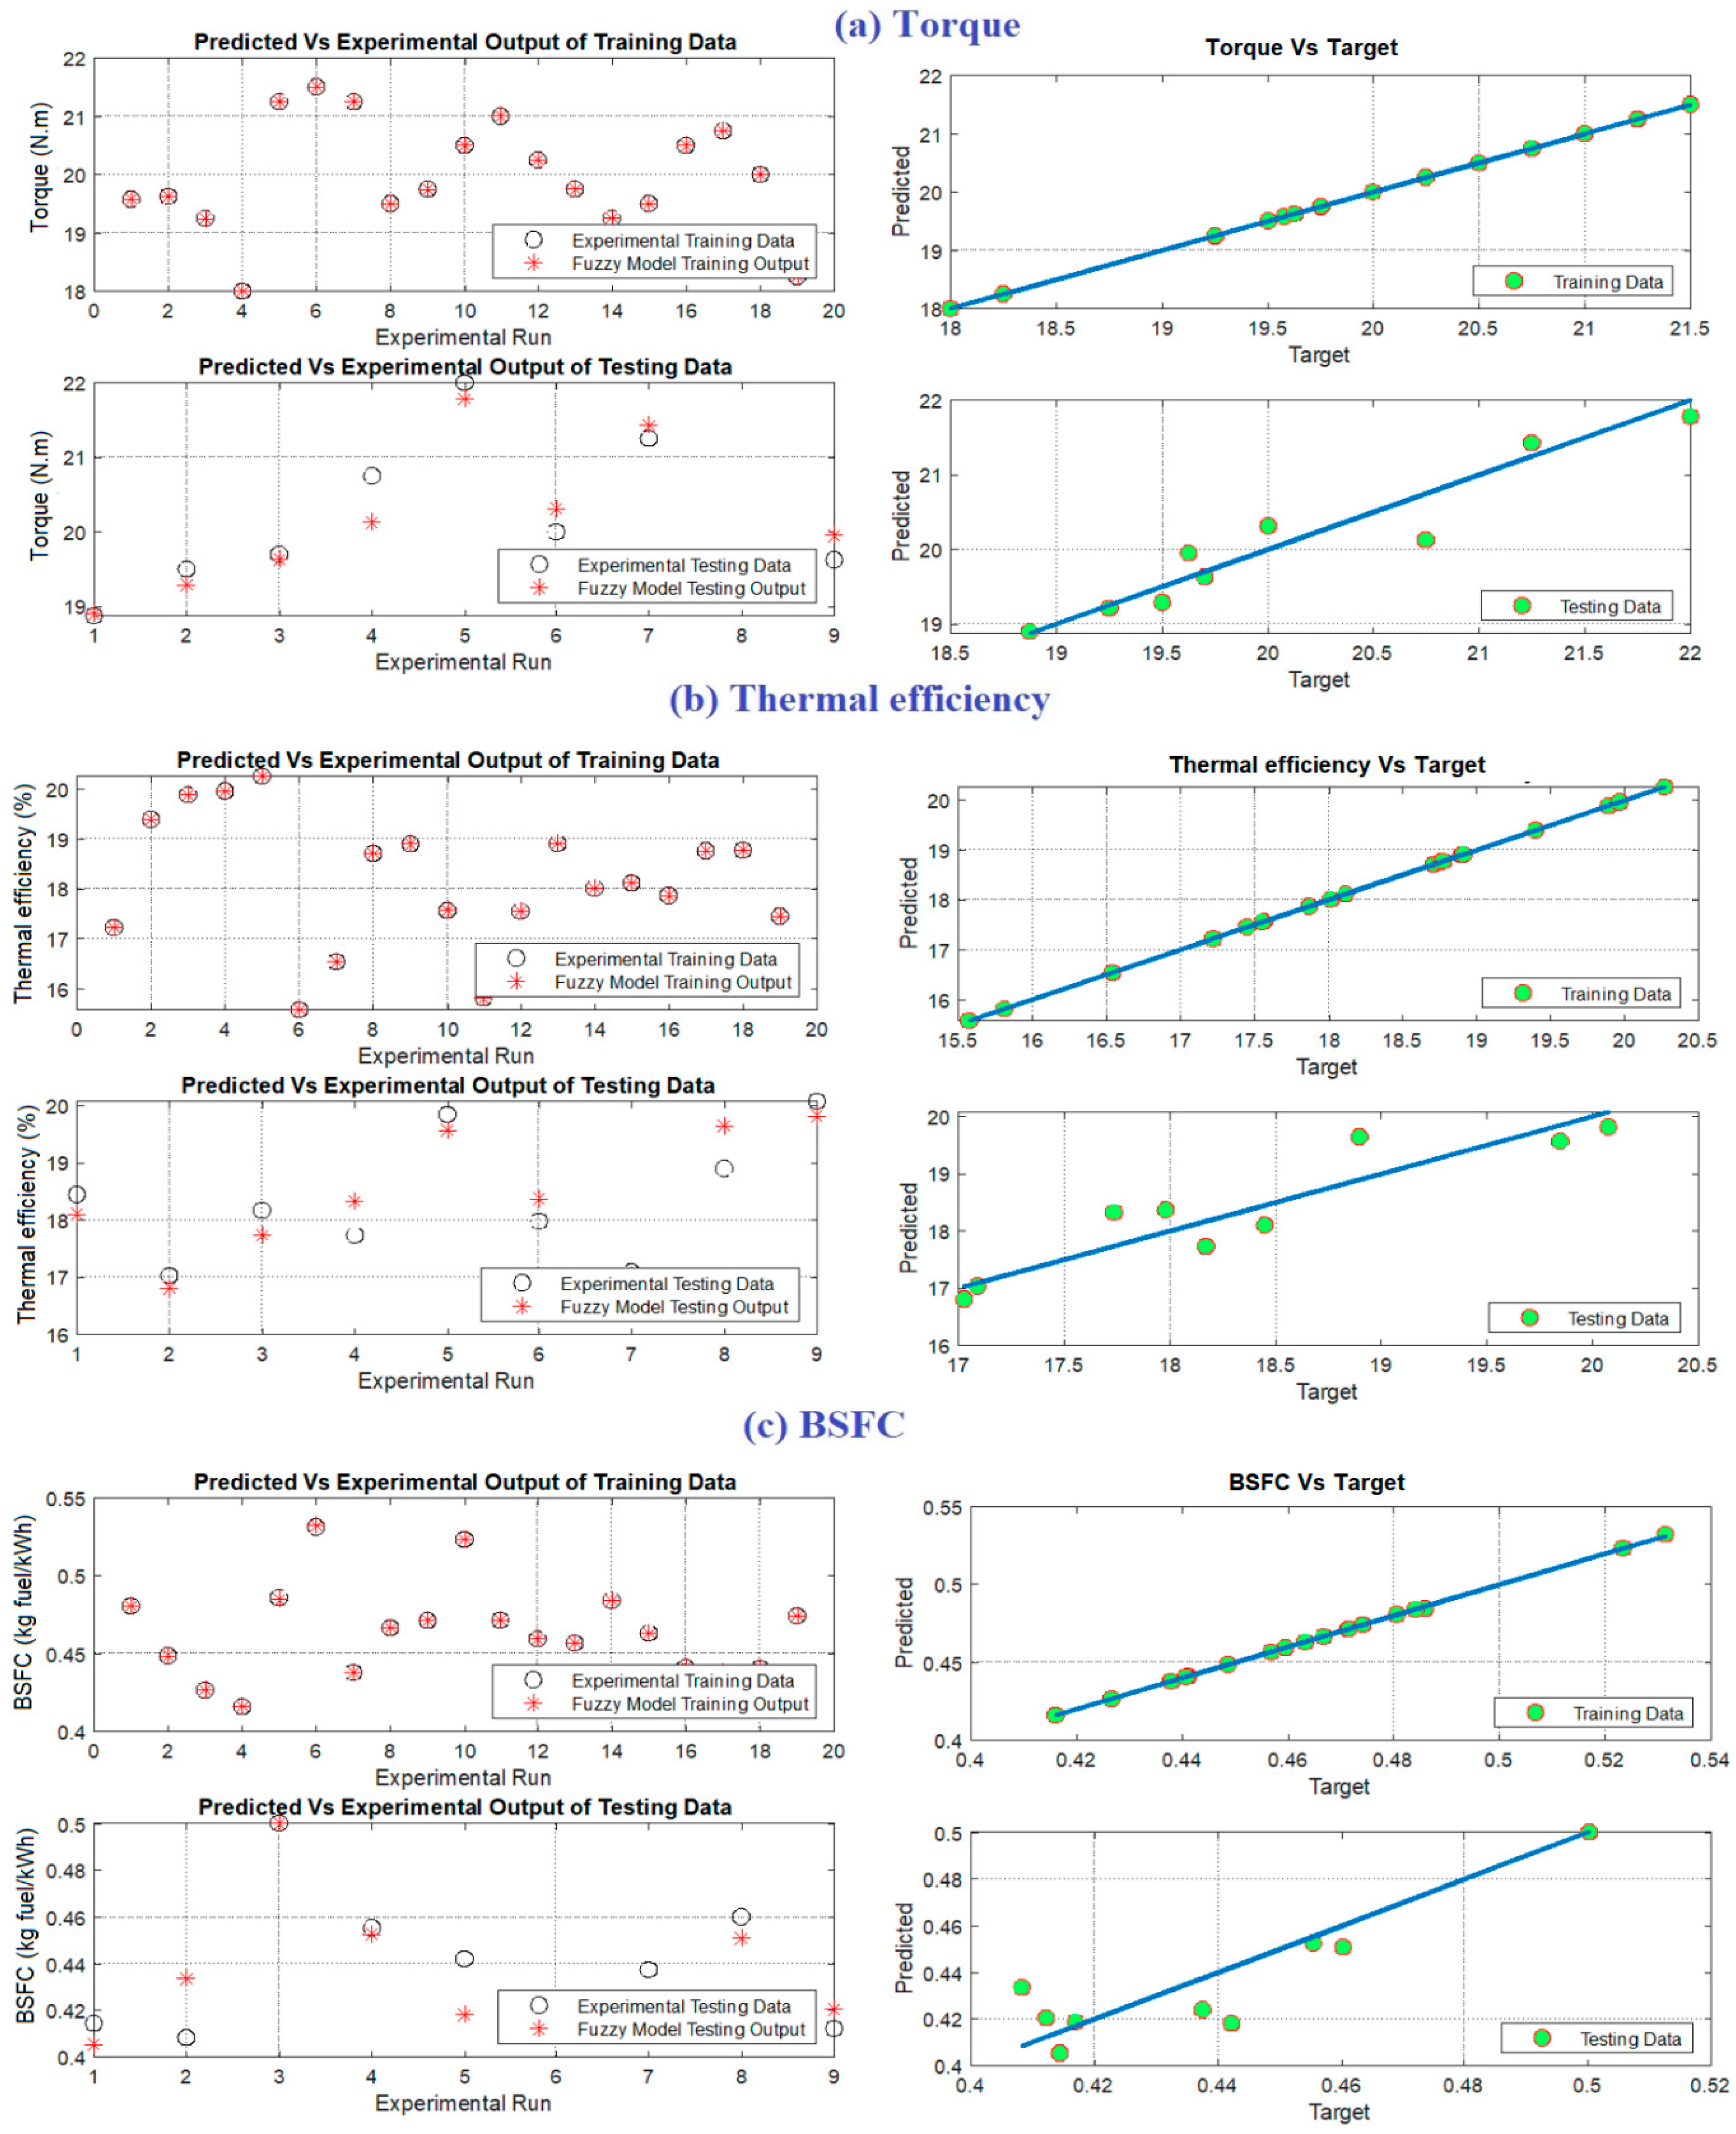
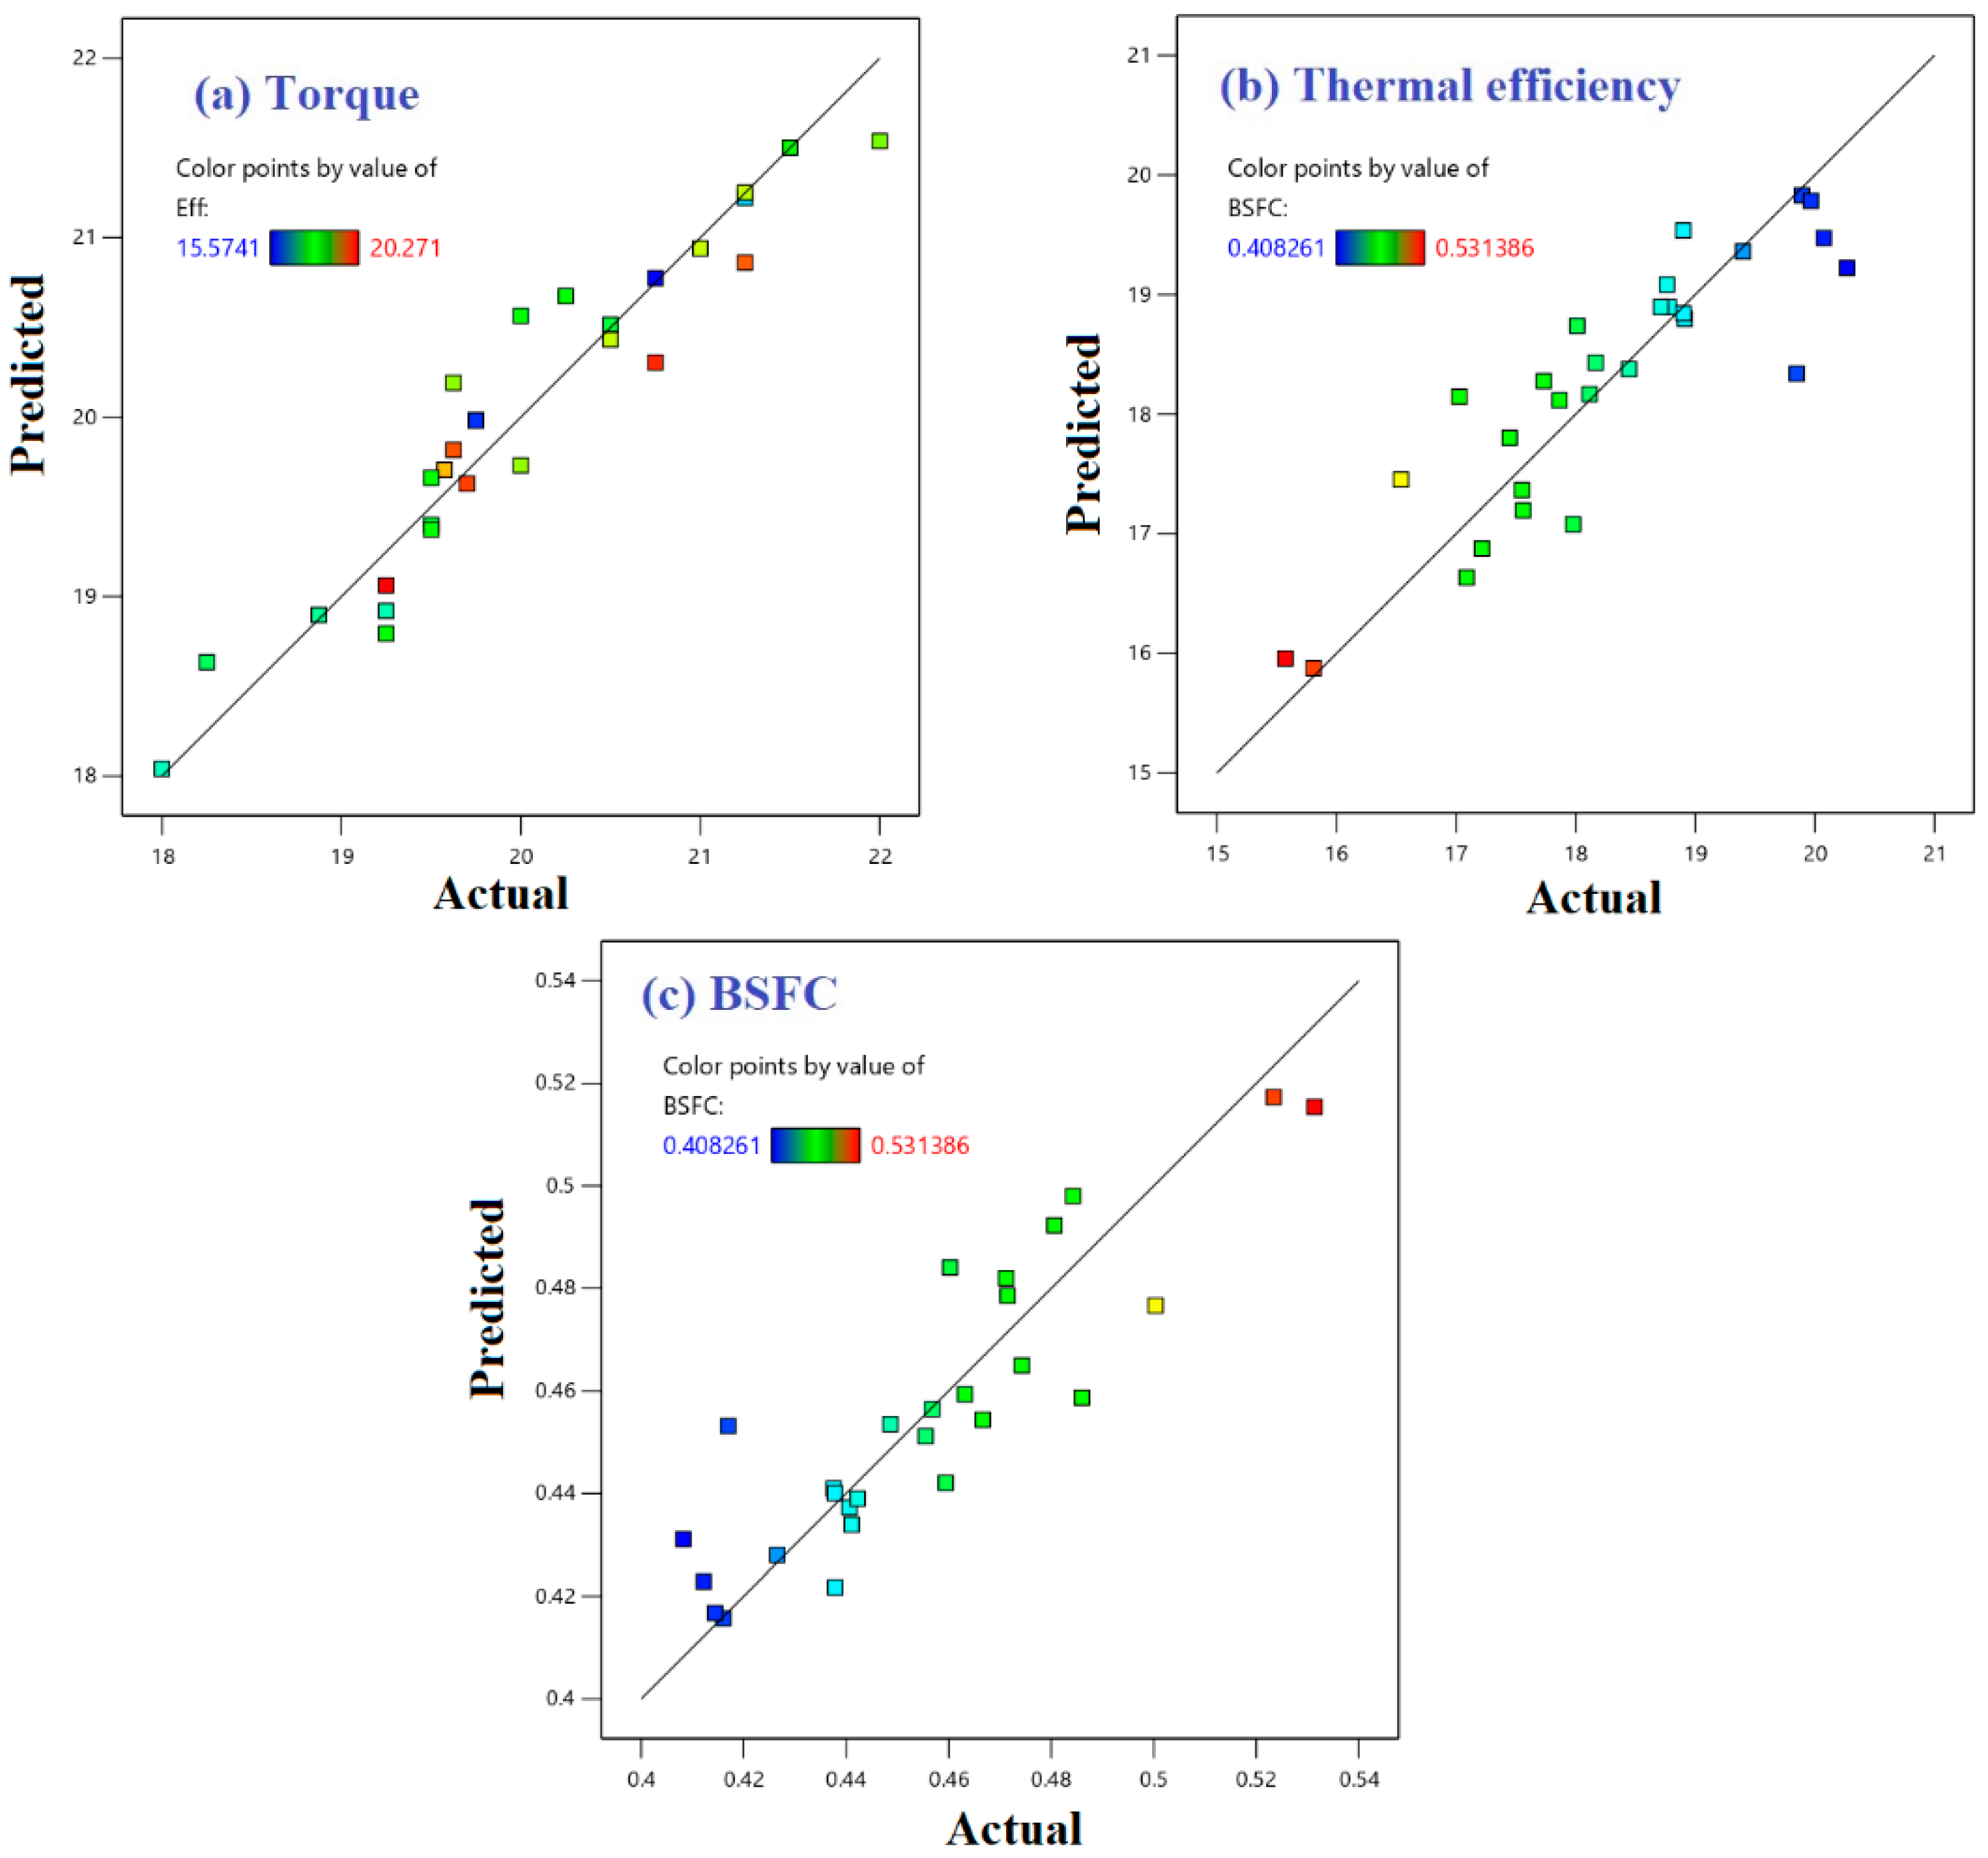
Considering Table 6 for the modeling of the BT, the MSE values are 6.71 × 10⁻⁶ and 0.0805, and the coefficients of determination values represent 1.00 and 0.9145, for the training and testing, respectively. This indicates the advantageous nature of fuzzy modeling. For modeling the BTE, the MSE values are 5.99 × 10⁻⁸ and 0.1736, and the R2 values are 1.00 and 0.845, for training and testing, respectively. For modeling the BSFC, the MSE values are 1.53 × 10⁻⁷ and 0.0002, and the R2 values are 0.9998 and 0.7845, for training and testing, respectively.
The graphical description is essential to evaluate the fuzzy-based model. As a result, the training and testing phase prediction accuracies were emphasized by graphing the model’s predictions against their associated targets, as shown in Figure 8. The forecasts are clearly distributed tightly over the % line, indicating that the model’s performance accuracy is confirmed.
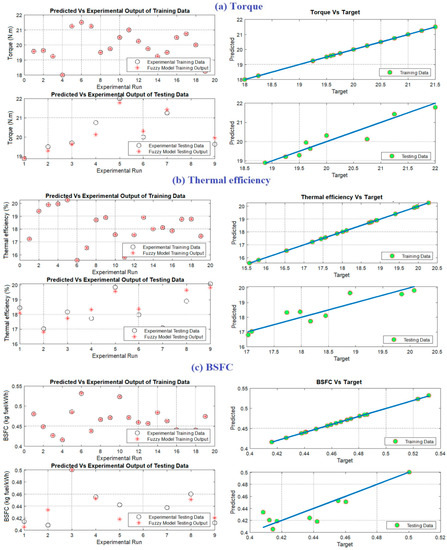
Figure 8.
Fuzzy models’ prediction precision.
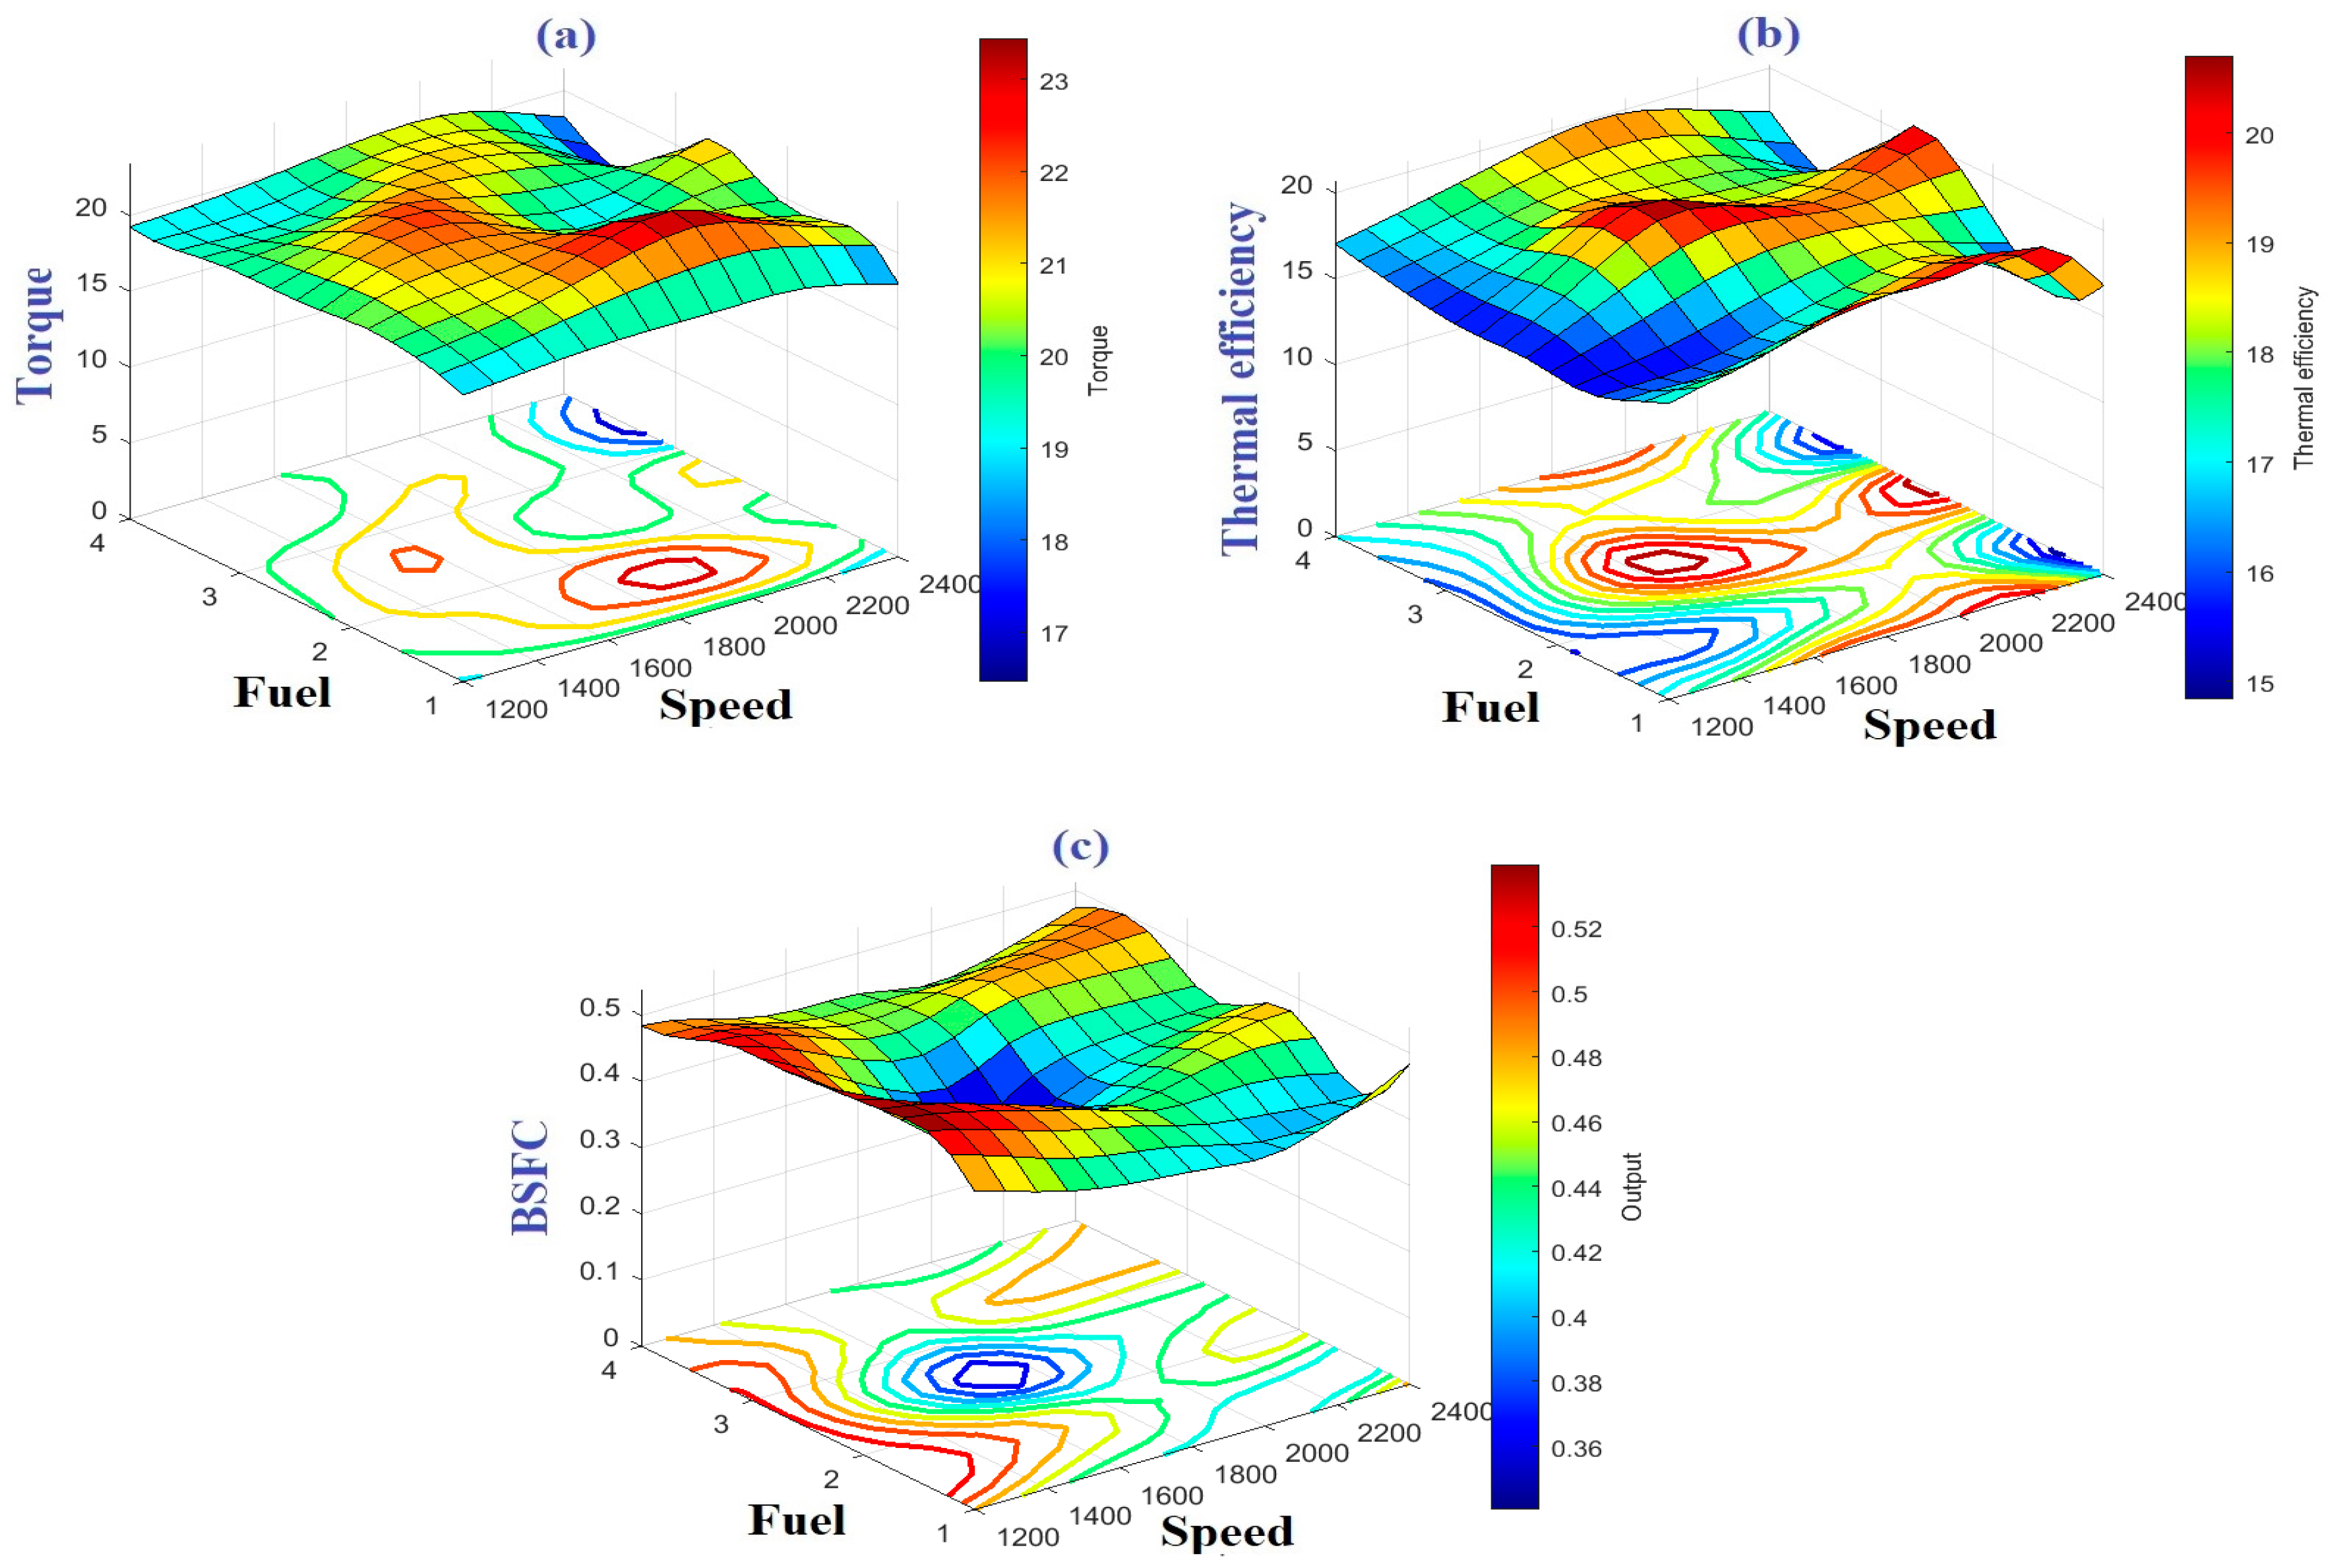
The whole values of the output with the input space may be shown once the fuzzy model has been established. Figure 9 illustrates the 3D surfaces created, using fuzzy-based modeling, to simulate the CI engine’s performance. The colored contours enable us to recognize the input–output function’s nature and to characterize the minimum and maximum regions.
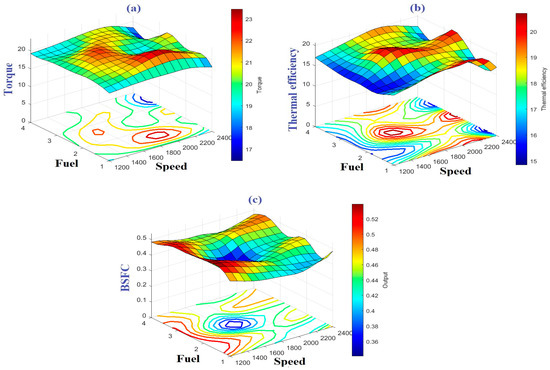
Figure 9.
The 3D Surfaces of the fuzzy-based models, (a) brake torque, (b) brake thermal efficiency, and (c) BSFC. Note: Fuel (1 for diesel, 2 for palm oil, 3 for sunflower oil and 4 for corn oil).
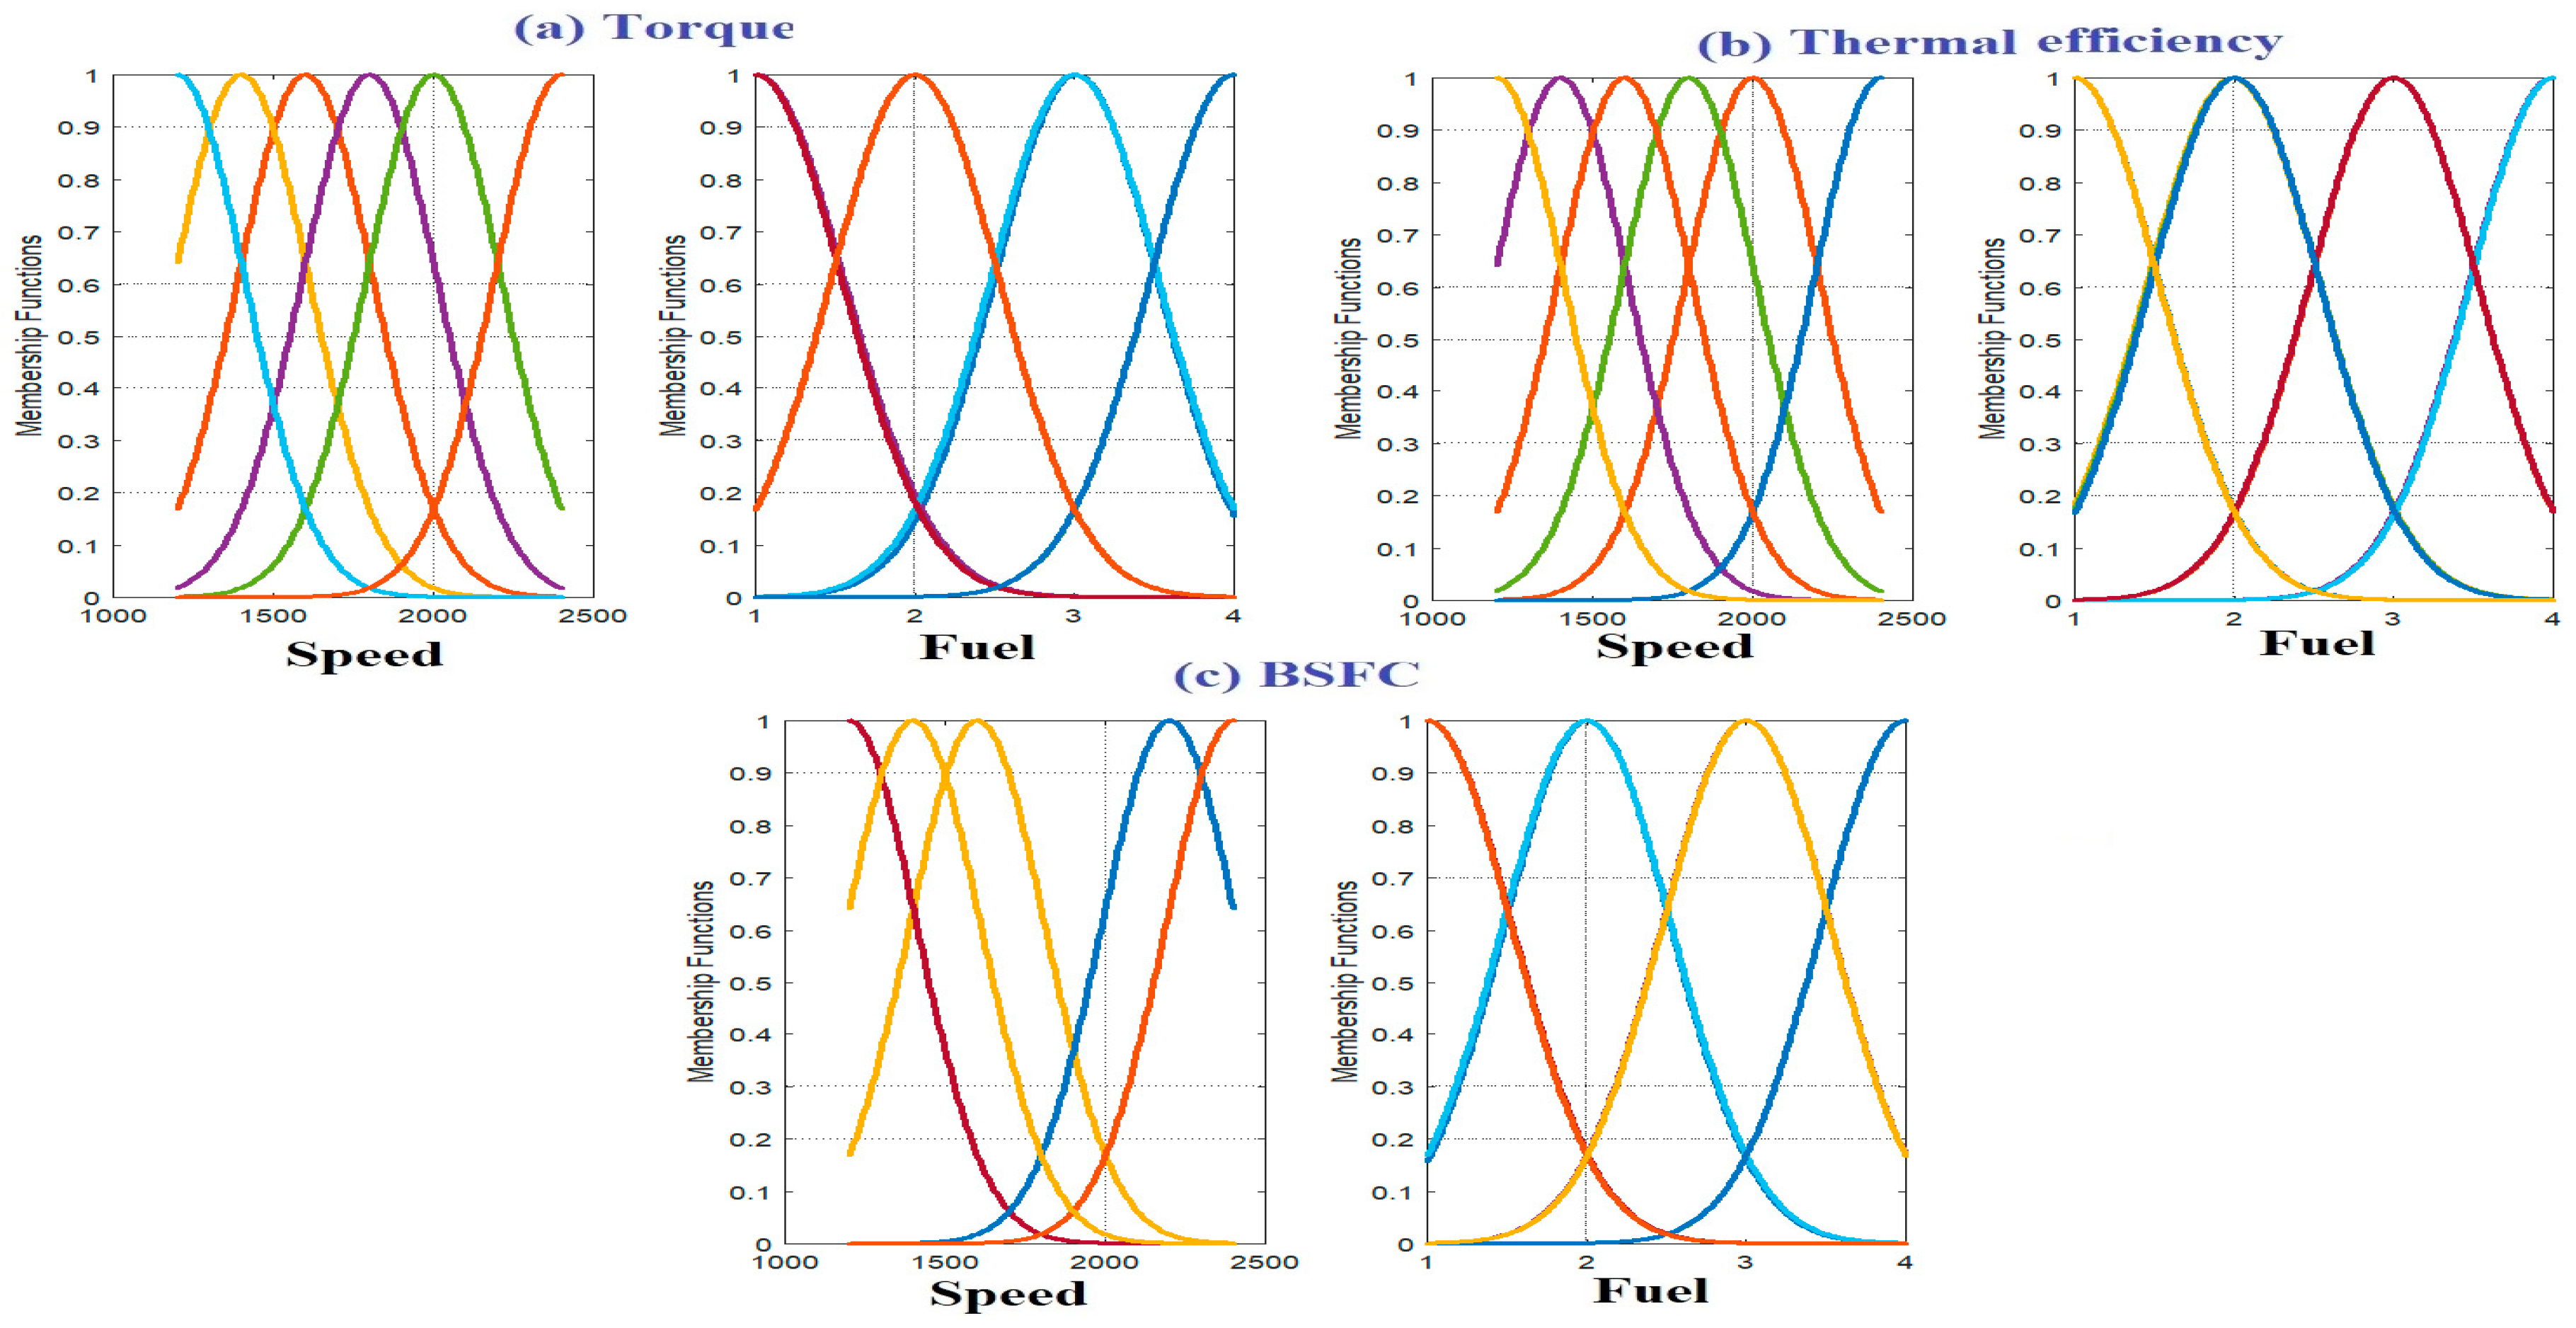
The membership functions of the fuzzy model for the CI engine are displayed in Figure 10. The two inputs’ membership functions (MFs) were determined to be Gaussian-shape, which is better for providing a smooth prediction surface. A Gaussian MF is defined by two parameters {m, σ}; m indicates the Gaussian curve’s mean, and σ represents the curve’s spread. This is a more natural method to show the distribution of data. The subtractive clustering technique, depending on the number of formed clusters, determines the number of MFs for each input.
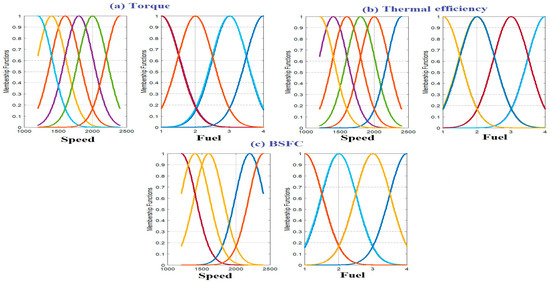
Figure 10.
The membership functions of fuzzy models; (a) BT, (b) BTE, and (c) BSFC. (Each color represents fuzzy membership function).
3.3.2. Parameter Optimization
The PSO algorithm is used to calculate the optimal engine speed and best fuel type, based on the fuzzy-based model of the CI engine, which maximizes the output BT and BTE, while momentarily minimizing the BSFC. The number of searching agents is 20 and the number of iterations is 100. The cost objective function is demonstrated in Equation (8), and the optimization statement is as follows: identify the ideal values of the controlling variables (S and F) that optimize CI engine performance within their established constraints.
where, BT (S, F), BTE (S, F), and BSFC (S, F) are the three outputs of the fuzzy models, respectively, for BT, BTE, and BSFC. S and F are the inputs (speed and fuel type). The negative sign in Equation (8) indicates that the optimization process is being treated as a maximization problem, rather than a minimization. Numerically merging the outputs in the cost function has the physical meaning of optimizing all of them simultaneously. The cost function terms have been converted to a dimensionless quantity that has been divided by the maximum value.
Cost function = −BT (S, F) – BTE (S, F) + BSFC (S, F)
Based on the optimization process, the optimal engine speed is 1648 rpm, and the best fuel is sunflower oil. Under this condition, the BT, BTE, and BSFC values are 21.482, 19.71, and 0.41, respectively. The graph of the iterative values of engine speed, as in Figure 11, demonstrated that the 100 iterations are sufficient to reach the optimal point before the end of the optimization procedure.
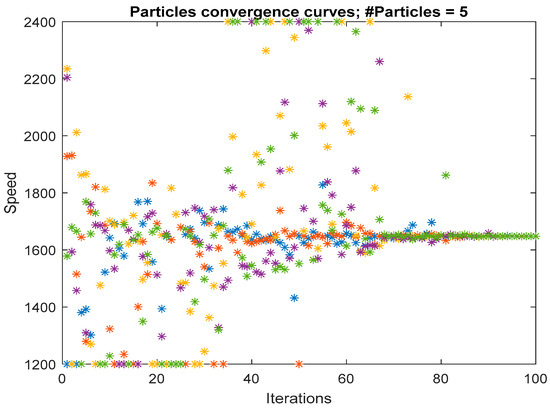
Figure 11.
The convergence curve of the engine speed during the optimization process. (There are five different particles. Each color corresponds to one particle.)
3.3.3. Response Surface Methodology (RSM)
In the context of complicated interactions, RSM may be used to assess the relative importance of various elements. It is an effective method for evaluating many process variables [106]. RSM developed a polynomial model to describe and predict the data. It guarantees perfect interactions between the independent variables and no lack of fit related to surface curvature [107]. The second-order quadratic polynomial model may be defined using the following relation:
where, Y denotes the predicted output response; B0, Bi, Bii, and Bij denote the regression coefficients; k is the number of factors; xi denotes the factors.
Based on ANOVA, and considering the design matrix presented in Table 7, the first output response, BT, is modeled and displayed in Table 8. The model F-value of 20.93 in this table indicates that the model is significant. Due to noise, there is only a 0.01% chance that an F-value will display such a large amount. The model terms are significant if the p-values are less than 0.05. In this scenario F, S2, F2, and F3 are significant model variables. The model terms are not significant if the value is higher than 0.1. In terms of actual factors, the following relationship may be utilized to generate BT predictions:
Table 7.
ANOVA design matrix.
Table 8.
ANOVA table for first output response (BT).
Table 9 shows the ANOVA statistics for the second output response. The model F-value of 15.77 indicates that the model is statistically significant. Due to noise, there is only a 0.01% chance that an F-value will be this large. The model terms are significant if their p-values are less than 0.05. In this situation S, S2, and F2 are crucial model variables. The model terms are not significant if their values are higher than 0.1000. The following relationship can be utilized to construct BTE predictions, in terms of actual variables:
Table 9.
ANOVA table for second output response (BTE).
Table 10 displays the ANOVA statistics for the third output response. The F-value of 17.07 for the model indicates that it is significant. Due to noise, there is only a 0.01% chance that an F-value will appear this large. The model terms are significant if the p-values are less than 0.05. In this case S, S2, and F2 are important significant model variables. The model terms are not significant if the value is higher than 0.1000. The following relationship can be utilized to construct BSFC predictions in terms of actual variables:
Table 10.
ANOVA table for third output response (BSFC).
Table 11 shows the statistical analysis of the ANOVA models. The anticipated R2 value of 0.7278 for the BT model is rather close to the adjusted R2 value of 0.8692; that is, the difference is less than 0.2. The signal-to-noise ratio is measured with sufficient precision. It is preferable to have a ratio of more than four. The signal-to-noise ratio of 16.795 suggests a good signal. The design space may be navigated using this concept. The anticipated R2 value of 0.6130 for the second model, the BTE, is in reasonable agreement with the corrected R2 value of 0.7322; that is, the difference is less than 0.2. The appropriate precision ratio is 13.368 and shows that the signal is sufficient. The design space may be navigated using this concept. The projected R2 value of 0.6274 for the third model, BSFC, is in reasonable agreement with the adjusted R2 value of 0.7485; that is, the difference is less than 0.2. The appropriate precision ratio is 13.807, indicating that the signal is sufficient. The design space may be navigated using this concept. The 3D response surface plots for three output responses, using RSM, are shown in Figure 12. In detail, Figure 11 shows the map variation between the engine speed and different types of fuels on the y-axis, where values of 1, 2, 3, and 4, represent pure diesel, palm, sunflower, and corn biodiesel fuel, respectively. The outputs are BT, BTE, and BSFC, displayed in Figure 12a–c, respectively. The physical meanings of Figure 12 were analyzed in Section 3.1, whereas comparison of the predicted and actual values of output responses is presented in Figure 13. In general, the average R2 value for both training and testing is 0.783 and 0.656, respectively.
Table 11.
Statistical analysis of the ANOVA model.
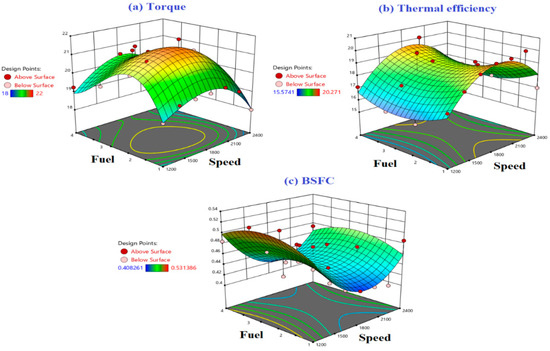
Figure 12.
3D response surface plots for three output responses.
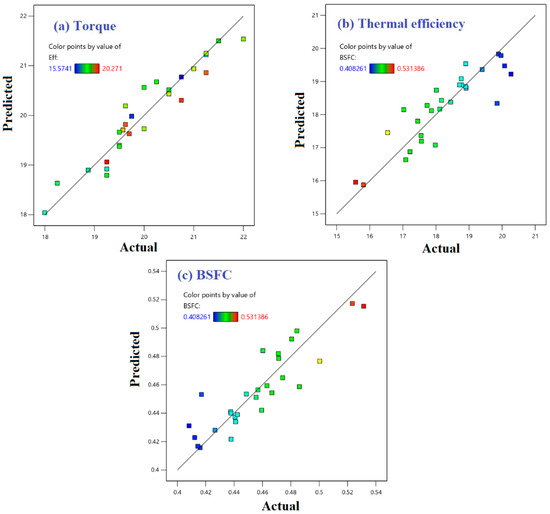
Figure 13.
Comparison of the predicted and actual values of output responses.
3.3.4. Optimization-Based Response Surface Methodology (RSM)
The best input parameters and related output performance from the RSM-based optimization method are presented in Table 12. The best performance is achieved using corn oil, with an engine speed of 1862.7 rpm. Under this condition, the overall performance is increased by 0.268%, 1.9%, and 5.9%, as compared to pure diesel, palm oil, and sunflower oil, respectively.
Table 12.
Optimization-based RSM.
3.4. Comparison Study
In summary, the average R2 values for training and testing, using fuzzy logic, are 1 and 0.84801, respectively, whereas the average R2 values for both training and testing are 0.783 and 0.656, respectively. Therefore, in comparison with the ANOVA, the average R2 value, using fuzzy-based modeling, has been increased by 27.7% and 29.3%, for training and testing, respectively.
Twenty-eight experiments, using four different types of fuel (pure diesel, corn biodiesel, palm biodiesel, and sunflower biodiesel) were carried out. As a result, each fuel was tested seven times, relating to seven different speeds (1200 to 2400, step 200 rpm). The first experiment was used as a baseline to compare the three determinants, in terms of BT, BTE, and BSFC, to find the best improvement. The optimum improvement was selected according to the following equations:
The optimum% of improvement = % of improvement of torque + % of improvement of thermal efficiency + % of improvement of BSFC
Based on the particle swarm optimization process, the optimal engine speed is 1648 rpm, and the best fuel is sunflower oil. Under this condition, the overall performance has been increased by 2.065% and 8.256%, as compared to the experimental results and RSM. The performance comparison of experimental, RSM, and proposed strategy is presented in Table 13.
Table 13.
Performance comparison of experimental, RSM and proposed strategy.
4. Conclusions
The impact of utilizing various biodiesel blends, such as corn, sunflower, and palm biodiesels on the performance of a CI engine were examined experimentally in this research paper. According to the experimental observations and main findings, the most important outcomes can be concluded as follows:
- When compared to pure diesel, all biodiesel blends boost brake power. Because of its slightly higher calorific value and higher oxygen content, palm biodiesel offers the highest brake power increase of 8.7%, compared to other biodiesel blends.
- On average, there is a reduction in BTE of 6.7%, 4.4%, and 2.4% for palm, sunflower, and corn biodiesels, respectively, as compared to pure diesel. For all the biodiesel blends, BSFC increases, while heating value decreases. However, in this case, the increase in brake-specific fuel consumption is more significant. This explains why biodiesel blends have a poorer BTE, despite their low heating value. Furthermore, biodiesel mixes have a shorter ignition delay than pure diesel, implying that combustion starts sooner. More heat is lost to the atmosphere, as a result of the shorter ignition delay, necessitating more power for the piston to perform the compression stroke.
- Palm, sunflower, and corn biodiesels had an average increase in BSFC of 7.4%, 4.9%, and 2.5%, respectively, compared to pure diesel. Because biodiesel blends have a lower calorific value than pure diesel, they consume more fuel to provide the same braking power output.
- Palm biodiesel has the highest kinematic viscosity, resulting in poor fuel atomization and mixture formation, as well as a larger BSFC rise than the other test fuels.
- The physical and chemical characteristics of biodiesel blends, such as oxygen content, cetane number, calorific value, kinematic viscosity, and latent heat of vaporization have a direct impact on combustion efficiency.
- The average R2 value, utilizing a fuzzy-based model, has been increased by 27.7% and 29.3%, for training and testing, respectively, as compared to ANOVA.
- Based on the optimization process using PSO, the optimal engine speed is 1648 rpm, and the best fuel is sunflower oil.
- Using the proposed strategy (integration between fuzzy logic and PSO), the overall performance has been increased by 2.065% and 8.256%, as compared to the experimental results and RSM.
Author Contributions
Conceptualization, A.A., H.R. and M.A.-Z.; methodology, A.A., H.R., H.A. and W.A.; software, H.R., A.A.A., H.A. and M.R.G., validation, A.A., H.A. and R.M.G.; formal analysis, A.A., M.A.-Z. and H.R.; investigation, A.A., H.R. and A.O.M.; resources, H.R.; data curation, A.A., H.R., M.A.-Z. and W.A.; writing—original draft preparation, A.A., H.R., H.A. and A.O.M.; writing—review and editing, A.A., H.R. and A.O.M.; visualization, A.A., H.R., H.A. and R.M.G.; supervision, A.A. and H.R.; project administration, A.A., A.A.A. and H.R.; funding acquisition, H.R., A.A.A. and R.M.G. All authors have read and agreed to the published version of the manuscript.
Funding
Princess Nourah bint Abdulrahman University Researchers Supporting Project number (PNURSP2022R138), Princess Nourah bint Abdulrahman University, Riyadh, Saudi Arabia.
Institutional Review Board Statement
Not applicable.
Informed Consent Statement
Not applicable.
Acknowledgments
We would like to thank Princess Nourah bint Abdulrahman University Researchers Supporting Project number (PNURSP2022R138), Princess Nourah bint Abdulrahman University, Riyadh, Saudi Arabia.
Conflicts of Interest
The authors declare no conflict of interest.
Nomenclatures
| AI | artificial intelligence |
| ANFIS | adaptive network-based fuzzy inference system |
| ANN | artificial neural network |
| ANOVA | analysis of variance |
| ASTM | American Society for Testing and Materials |
| B0, Bi, Bii, and Bij | regression coefficients |
| BP | brake power |
| BSFC | brake specific fuel consumption |
| BT | brake torque |
| BTDC | before top dead center |
| BTE | brake thermal efficiency |
| c1, c2 | a cognitive and social factor |
| CFPP | cold filter plugging point |
| CN | cetane number |
| CO | carbon monoxide |
| DC | direct current |
| F | fuel type |
| FS | full scale |
| FSD | full scale deflection |
| FTIR | Fourier-transform infrared spectroscopy |
| gbest | the global best |
| K | number of factors |
| M | mean of the gaussian curve |
| MF | fuzzy membership function of the input |
| MSE | mean square error |
| N | rotation engine speed |
| NOx | nitrogen oxides |
| NREL | national renewable energy laboratory |
| Pbest | best solution |
| PSO | particle swarm optimization |
| R | outcome function |
| r | random value |
| RMS | root mean square |
| RMSE | root mean square error |
| rpm | revolution per minute |
| RSM | response surface methodology |
| RTD | resistance temperature detectors |
| R2 | coefficient of determination |
| S | speed |
| SFC | specific fuel consumption |
| TBHQ | tert-butylhydroquinone |
| V | velocity |
| vol. | volume |
| WR | uncertainty error |
| Wt. | weight |
| x | Variable, factors |
| Y | predicted output response |
| ω | realistic error |
| σ | spread of the curve |
References
- Chaichan, M.T. Performance and Emission Characteristics of CIE Using Hydrogen, Biodiesel, and Massive EGR. Int. J. Hydrogen Energy 2018, 43, 5415–5435. [Google Scholar] [CrossRef]
- Aladayleh, W.; Alahmer, A. Recovery of Exhaust Waste Heat for ICE Using the Beta Type Stirling Engine. J. Energy 2015, 1–8. [Google Scholar] [CrossRef] [Green Version]
- Alahmer, A.I.; Adaileh, W.M.; Al Zubi, M.A. Monitoring of a Spark Ignition Engine Malfunctions Using Acoustic Signal Technique. Int. J. Veh. Noise Vib. 2014, 10, 201–213. [Google Scholar] [CrossRef]
- Zacharczuk, W.; Andruszkiewicz, A.; Tatarek, A.; Alahmer, A.; Alsaqoor, S. Effect of Ca-Based Additives on the Capture of SO2 during Combustion of Pulverized Lignite. Energy 2021, 231, 120988. [Google Scholar] [CrossRef]
- Gomaa, M.R.; Al-Dmour, N.; AL-Rawashdeh, H.A.; Shalby, M. Theoretical Model of a Fluidized Bed Solar Reactor Design with the Aid of MCRT Method and Synthesis Gas Production. Renew. Energy 2020, 148, 91–102. [Google Scholar] [CrossRef]
- Borowski, G.; Alsaqoor, S.; Alahmer, A. Using Agglomeration Techniques for Coal and Ash Waste Management in the Circular Economy. Adv. Sci. Technol. Res. J. 2021, 15, 264–276. [Google Scholar] [CrossRef]
- Taghizadeh-Alisaraei, A.; Ghobadian, B.; Tavakoli-Hashjin, T.; Mohtasebi, S.S. Vibration Analysis of a Diesel Engine Using Biodiesel and Petrodiesel Fuel Blends. Fuel 2012, 102, 414–422. [Google Scholar] [CrossRef]
- Dal, H.; Emiroğlu, A.O.; Bilge, H.; Şen, M. Experimental Investigation of the Effects of Chicken and Turkey Biodiesel Blends on Diesel Engine Noise Emissions. Int. J. Environ. Sci. Technol. 2019, 16, 5147–5154. [Google Scholar] [CrossRef]
- Alahmer, A. Reduction a Particulate Matter of Diesel Emission by the Use of Several Oxygenated Diesel Blend Fuels. Int. J. Therm. Environ. Eng. 2014, 7, 45–50. [Google Scholar]
- Gomaa, M.R.; Mustafa, R.J.; Al-Dmour, N. Solar Thermochemical Conversion of Carbonaceous Materials into Syngas by Co-Gasification. J. Clean. Prod. 2020, 248, 119185. [Google Scholar] [CrossRef]
- Dey, S.; Deb, M.; Das, P.K. An Investigation of Diesohol-Biodiesel Mixture in Performance-Emission Characteristics of a Single Cylinder Diesel Engine: A Trade-off Benchmark. Int. J. Automot. Mech. Eng. 2019, 16, 7464–7479. [Google Scholar] [CrossRef] [Green Version]
- Bae, C.; Kim, J. Alternative Fuels for Internal Combustion Engines. Proc. Combust. Inst. 2017, 36, 3389–3413. [Google Scholar] [CrossRef]
- Hasan, A.O.; Osman, A.I.; Ala’a, H.; Al-Rawashdeh, H.; Abu-jrai, A.; Ahmad, R.; Gomaa, M.R.; Deka, T.J.; Rooney, D.W. An Experimental Study of Engine Characteristics and Tailpipe Emissions from Modern DI Diesel Engine Fuelled with Methanol/Diesel Blends. Fuel Process. Technol. 2021, 220, 106901. [Google Scholar] [CrossRef]
- Reang, N.M.; Dey, S.; Deb, M.; Deb Barma, J. Effect of Diesel-biodiesel-alcohol Blends on Combustion, Performance, and Emission Characteristics of a Single Cylinder Compression Ignition Engine. Environ. Prog. Sustain. Energy 2021, e13752. [Google Scholar] [CrossRef]
- Song, J.T.; Zhang, C.H. An Experimental Study on the Performance and Exhaust Emissions of a Diesel Engine Fuelled with Soybean Oil Methyl Ester. Proc. Inst. Mech. Eng. Part D J. Automob. Eng. 2008, 222, 2487–2496. [Google Scholar] [CrossRef]
- Ramadhas, A.S.; Muraleedharan, C.; Jayaraj, S. Performance and Emission Evaluation of a Diesel Engine Fueled with Methyl Esters of Rubber Seed Oil. Renew. Energy 2005, 30, 1789–1800. [Google Scholar] [CrossRef]
- Pinzi, S.; Garcia, I.L.; Lopez-Gimenez, F.J.; Luque de Castro, M.D.; Dorado, G.; Dorado, M.P. The Ideal Vegetable Oil-Based Biodiesel Composition: A Review of Social, Economical and Technical Implications. Energy Fuels 2009, 23, 2325–2341. [Google Scholar] [CrossRef]
- Labeckas, G.; Slavinskas, S. Comparative Evaluation of the Combustion Process and Emissions of a Diesel Engine Operating on the Cetane Improver 2-Ethylhexyl Nitrate Doped Rapeseed Oil and Aviation JP-8 Fuel. Energy Convers. Manag. X 2021, 11, 100106. [Google Scholar] [CrossRef]
- Graboski, M.S.; McCormick, R.L.; Alleman, T.L.; Herring, A.M. The Effect of Biodiesel Composition on Engine Emissions from a DDC Series 60 Diesel Engine. Natl. Renew. Energy Lab. 2003. Available online: https://www.nrel.gov/docs/fy03osti/31461.pdf (accessed on 25 November 2021).
- Broatch, A.; Tormos, B.; Olmeda, P.; Novella, R. Impact of Biodiesel Fuel on Cold Starting of Automotive Direct Injection Diesel Engines. Energy 2014, 73, 653–660. [Google Scholar] [CrossRef] [Green Version]
- Rakopoulos, D.C.; Rakopoulos, C.D.; Giakoumis, E.G.; Dimaratos, A.M.; Founti, M.A. Comparative Environmental Behavior of Bus Engine Operating on Blends of Diesel Fuel with Four Straight Vegetable Oils of Greek Origin: Sunflower, Cottonseed, Corn and Olive. Fuel 2011, 90, 3439–3446. [Google Scholar] [CrossRef]
- Sureshkumar, K.; Velraj, R.; Ganesan, R. Performance and Exhaust Emission Characteristics of a CI Engine Fueled with Pongamia Pinnata Methyl Ester (PPME) and Its Blends with Diesel. Renew. Energy 2008, 33, 2294–2302. [Google Scholar] [CrossRef]
- Rakopoulos, C.D.; Antonopoulos, K.A.; Rakopoulos, D.C.; Hountalas, D.T.; Giakoumis, E.G. Comparative Performance and Emissions Study of a Direct Injection Diesel Engine Using Blends of Diesel Fuel with Vegetable Oils or Bio-Diesels of Various Origins. Energy Convers. Manag. 2006, 47, 3272–3287. [Google Scholar] [CrossRef]
- Atmanlı, A.; Ileri, E.; Yüksel, B. Experimental Investigation of Engine Performance and Exhaust Emissions of a Diesel Engine Fueled with Diesel–n-Butanol–Vegetable Oil Blends. Energy Convers. Manag. 2014, 81, 312–321. [Google Scholar] [CrossRef]
- Chacko, N.; Jeyaseelan, T. Comparative Evaluation of Graphene Oxide and Graphene Nanoplatelets as Fuel Additives on the Combustion and Emission Characteristics of a Diesel Engine Fuelled with Diesel and Biodiesel Blend. Fuel Process. Technol. 2020, 204, 106406. [Google Scholar] [CrossRef]
- Gad, M.S.; Jayaraj, S. A Comparative Study on the Effect of Nano-Additives on the Performance and Emissions of a Diesel Engine Run on Jatropha Biodiesel. Fuel 2020, 267, 117168. [Google Scholar] [CrossRef]
- Rajak, U.; Chaurasiya, P.K.; Nashine, P.; Verma, M.; Kota, T.R.; Verma, T.N. Financial Assessment, Performance and Emission Analysis of Moringa Oleifera and Jatropha Curcas Methyl Ester Fuel Blends in a Single-Cylinder Diesel Engine. Energy Convers. Manag. 2020, 224, 113362. [Google Scholar] [CrossRef]
- Tasca, A.L.; di Capaci, R.B.; Tognotti, L.; Puccini, M. Biomethane from Short Rotation Forestry and Microalgal Open Ponds: System Modeling and Life Cycle Assessment. Bioresour. Technol. 2019, 273, 468–477. [Google Scholar] [CrossRef]
- Dey, S.; Reang, N.M.; Das, P.K.; Deb, M. A Comprehensive Study on Prospects of Economy, Environment, and Efficiency of Palm Oil Biodiesel as a Renewable Fuel. J. Clean. Prod. 2021, 286, 124981. [Google Scholar] [CrossRef]
- Yee, K.F.; Tan, K.T.; Abdullah, A.Z.; Lee, K.T. Life Cycle Assessment of Palm Biodiesel: Revealing Facts and Benefits for Sustainability. Appl. Energy 2009, 86, S189–S196. [Google Scholar] [CrossRef]
- Jiaqiang, E.; Liu, T.; Yang, W.M.; Li, J.; Gong, J.; Deng, Y. Effects of Fatty Acid Methyl Esters Proportion on Combustion and Emission Characteristics of a Biodiesel Fueled Diesel Engine. Energy Convers. Manag. 2016, 117, 410–419. [Google Scholar]
- Boudy, F.; Seers, P. Impact of Physical Properties of Biodiesel on the Injection Process in a Common-Rail Direct Injection System. Energy Convers. Manag. 2009, 50, 2905–2912. [Google Scholar] [CrossRef]
- Erdoğan, S.; Aydın, S.; Balki, M.K.; Sayin, C. Operational Evaluation of Thermal Barrier Coated Diesel Engine Fueled with Biodiesel/Diesel Blend by Using MCDM Method Base on Engine Performance, Emission and Combustion Characteristics. Renew. Energy 2020, 151, 698–706. [Google Scholar] [CrossRef]
- Patel, C.; Tiwari, N.; Agarwal, A.K. Experimental Investigations of Soyabean and Rapeseed SVO and Biodiesels on Engine Noise, Vibrations, and Engine Characteristics. Fuel 2019, 238, 86–97. [Google Scholar] [CrossRef]
- Krishania, N.; Rajak, U.; Chaurasiya, P.K.; Singh, T.S.; Birru, A.K.; Verma, T.N. Investigations of Spirulina, Waste Cooking and Animal Fats Blended Biodiesel Fuel on Auto-Ignition Diesel Engine Performance, Emission Characteristics. Fuel 2020, 276, 118123. [Google Scholar] [CrossRef]
- Singh, T.S.; Verma, T.N. Analysis of the Effect of Temperature on the Morphology of Egg Shell Calcium Oxide Catalyst: Catalyst Production for Biodiesel Preparation. Sci. Iran. 2020, 27, 2915–2923. [Google Scholar]
- Nalgundwar, A.; Paul, B.; Sharma, S.K. Comparison of Performance and Emissions Characteristics of DI CI Engine Fueled with Dual Biodiesel Blends of Palm and Jatropha. Fuel 2016, 173, 172–179. [Google Scholar] [CrossRef]
- Sanjid, A.; Masjuki, H.H.; Kalam, M.A.; Abedin, M.J.; Rahman, S.M.A. Experimental Investigation of Mustard Biodiesel Blend Properties, Performance, Exhaust Emission and Noise in an Unmodified Diesel Engine. APCBEE Procedia 2014, 10, 149–153. [Google Scholar] [CrossRef] [Green Version]
- Ndayishimiye, P.; Tazerout, M. Use of Palm Oil-Based Biofuel in the Internal Combustion Engines: Performance and Emissions Characteristics. Energy 2011, 36, 1790–1796. [Google Scholar] [CrossRef]
- Patel, C.; Agarwal, A.K.; Tiwari, N.; Lee, S.; Lee, C.S.; Park, S. Combustion, Noise, Vibrations and Spray Characterization for Karanja Biodiesel Fuelled Engine. Appl. Therm. Eng. 2016, 106, 506–517. [Google Scholar] [CrossRef]
- Bhowmik, S.; Panua, R.; Ghosh, S.K.; Paul, A.; Debroy, D. Prediction of Performance and Exhaust Emissions of Diesel Engine Fuelled with Adulterated Diesel: An Artificial Neural Network Assisted Fuzzy-Based Topology Optimization. Energy Environ. 2018, 29, 1413–1437. [Google Scholar] [CrossRef]
- Alahmer, A.; Ajib, S. Solar Cooling Technologies: State of Art and Perspectives. Energy Convers. Manag. 2020, 214, 112896. [Google Scholar] [CrossRef]
- Rajak, U.; Nashine, P.; Singh, T.S.; Verma, T.N. Numerical Investigation of Performance, Combustion and Emission Characteristics of Various Biofuels. Energy Convers. Manag. 2018, 156, 235–252. [Google Scholar] [CrossRef]
- Dey, S.; Deb, M.; Das, P.K. Application of Fuzzy-Assisted Grey Taguchi Approach for Engine Parameters Optimization on Performance-Emission of a CI Engine. Energy Sources Part A Recover. Util. Environ. Eff. 2019, 1–17. [Google Scholar] [CrossRef]
- Umeuzuegbu, J.C.; Okiy, S.; Nwobi-Okoye, C.C.; Onukwuli, O.D. Computational Modeling and Multi-Objective Optimization of Engine Performance of Biodiesel Made with Castor Oil. Heliyon 2021, 7, e06516. [Google Scholar] [CrossRef] [PubMed]
- Ismail, H.M.; Ng, H.K.; Queck, C.W.; Gan, S. Artificial Neural Networks Modelling of Engine-out Responses for a Light-Duty Diesel Engine Fuelled with Biodiesel Blends. Appl. Energy 2012, 92, 769–777. [Google Scholar] [CrossRef]
- Li, J.; Wu, D.; Attar, H.M.; Xu, H. Geometric Neuro-Fuzzy Transfer Learning for in-Cylinder Pressure Modelling of a Diesel Engine Fuelled with Raw Microalgae Oil. Appl. Energy 2022, 306, 118014. [Google Scholar] [CrossRef]
- Salam, S.; Verma, T.N. An Empirical Investigation on the Influence of Operating Conditions on Internal Combustion Engine Behavior and Their Graded Significance. Energy Sources Part A Recover. Util. Environ. Eff. 2021, 1–19. [Google Scholar] [CrossRef]
- Salam, S.; Verma, T.N. Analysis of Significance of Variables in IC Engine Operation: An Empirical Methodology. Energy Convers. Manag. 2020, 207, 112520. [Google Scholar] [CrossRef]
- Salam, S.; Choudhary, T.; Pugazhendhi, A.; Verma, T.N.; Sharma, A. A Review on Recent Progress in Computational and Empirical Studies of Compression Ignition Internal Combustion Engine. Fuel 2020, 279, 118469. [Google Scholar] [CrossRef]
- Dey, S.; Reang, N.M.; Das, P.K.; Deb, M. Comparative Study Using RSM and ANN Modelling for Performance-Emission Prediction of CI Engine Fuelled with Bio-Diesohol Blends: A Fuzzy Optimization Approach. Fuel 2021, 292, 120356. [Google Scholar] [CrossRef]
- Krishnamoorthi, M.; Malayalamurthi, R.; Sakthivel, R. Optimization of Compression Ignition Engine Fueled with Diesel-Chaulmoogra Oil-Diethyl Ether Blend with Engine Parameters and Exhaust Gas Recirculation. Renew. Energy 2019, 134, 579–602. [Google Scholar] [CrossRef]
- Dey, S.; Reang, N.M.; Deb, M.; Das, P.K. Study on Performance-Emission Trade-off and Multi-Objective Optimization of Diesel-Ethanol-Palm Biodiesel in a Single Cylinder CI Engine: A Taguchi-Fuzzy Approach. Energy Sources Part A Recover. Util. Environ. Eff. 2020, 1–21. [Google Scholar] [CrossRef]
- Reang, N.M.; Dey, S.; Debbarma, J.; Deb, M. Effect of Linseed Methyl Ester and Diethyl Ether on the Performance–Emission Analysis of a CI Engine Based on Taguchi-Fuzzy Optimisation. Int. J. Ambient Energy 2019, 1–15. [Google Scholar] [CrossRef]
- Shirneshan, A.; Bagherzadeh, S.A.; Najafi, G.; Mamat, R.; Mazlan, M. Optimization and Investigation the Effects of Using Biodiesel-Ethanol Blends on the Performance and Emission Characteristics of a Diesel Engine by Genetic Algorithm. Fuel 2021, 289, 119753. [Google Scholar] [CrossRef]
- Patil, A.R.; Desai, A.D. Parametric Optimization of Engine Performance and Emission for Various N-Butanol Blends at Different Operating Parameter Condition. Alex. Eng. J. 2020, 59, 851–864. [Google Scholar] [CrossRef]
- Rith, M.; Gitano-Briggs, H.W.; Gonzaga, J.A.; Biona, J.B.M. Optimization of Control Factors for a Diesel Engine Fueled with Jatropha Seed Producer Gas on Dual Fuel Mode. Int. Energy J. 2019, 19, 149–158. [Google Scholar]
- Ghanbari, M.; Mozafari-Vanani, L.; Dehghani-Soufi, M.; Jahanbakhshi, A. Effect of Alumina Nanoparticles as Additive with Diesel-Biodiesel Blends on Performance and Emission Characteristic of a Six-Cylinder Diesel Engine Using Response Surface Methodology (RSM). Energy Convers. Manag. X 2021, 11, 100091. [Google Scholar] [CrossRef]
- Devarajan, Y.; Mahalingam, A.; Munuswamy, D.B.; Arunkumar, T. Combustion, Performance, and Emission Study of a Research Diesel Engine Fueled with Palm Oil Biodiesel and Its Additive. Energy Fuels 2018, 32, 8447–8452. [Google Scholar] [CrossRef]
- Zahan, K.A.; Kano, M. Biodiesel Production from Palm Oil, Its by-Products, and Mill Effluent: A Review. Energies 2018, 11, 2132. [Google Scholar] [CrossRef] [Green Version]
- Avhad, M.R.; Marchetti, J.M. A Review on Recent Advancement in Catalytic Materials for Biodiesel Production. Renew. Sustain. Energy Rev. 2015, 50, 696–718. [Google Scholar] [CrossRef]
- Charusiri, W.; Vitidsant, T. Response Surface Methodology Optimization of Biofuels Produced by Catalytic Pyrolysis of Residual Palm Oil from Empty Fruit Bunch over Magnesium Oxide. J. Chem. Eng. Jpn. 2017, 50, 727–736. [Google Scholar] [CrossRef] [Green Version]
- Sommani, P.; Mankong, N.; Vitidsant, T.; Lothongkum, A.W. Cracking of Used Vegetable Oil Mixed with Polypropylene Waste in the Presence of Activated Carbon. ASEAN Eng. J. 2015, 4, 16–24. [Google Scholar]
- Ito, T.; Sakurai, Y.; Kakuta, Y.; Sugano, M.; Hirano, K. Biodiesel Production from Waste Animal Fats Using Pyrolysis Method. Fuel Process. Technol. 2012, 94, 47–52. [Google Scholar] [CrossRef]
- Alptekin, E.; Canakci, M.; Sanli, H. Biodiesel Production from Vegetable Oil and Waste Animal Fats in a Pilot Plant. Waste Manag. 2014, 34, 2146–2154. [Google Scholar] [CrossRef] [PubMed]
- Rajaseenivasan, T.; Srithar, K. Performance Investigation on Solar Still with Circular and Square Fins in Basin with CO2 Mitigation and Economic Analysis. Desalination 2016, 380, 66–74. [Google Scholar] [CrossRef]
- Al-Dabbas, M.; Alahmer, A.; Mamkagh, A.; Gomaa, M.R. Productivity Enhancement of the Solar Still by Using Water Cooled Finned Condensing Pipe. Desalin. Water Treat. 2021, 213, 35–43. [Google Scholar] [CrossRef]
- Giakoumis, E.G.; Sarakatsanis, C.K. A Comparative Assessment of Biodiesel Cetane Number Predictive Correlations Based on Fatty Acid Composition. Energies 2019, 12, 422. [Google Scholar] [CrossRef] [Green Version]
- Shehata, M.S.; Attia, A.M.A.; Razek, S.M.A. Corn and Soybean Biodiesel Blends as Alternative Fuels for Diesel Engine at Different Injection Pressures. Fuel 2015, 161, 49–58. [Google Scholar] [CrossRef]
- Kim, J.-K.; Yim, E.S.; Jeon, C.H.; Jung, C.-S.; Han, B.H. Cold Performance of Various Biodiesel Fuel Blends at Low Temperature. Int. J. Automot. Technol. 2012, 13, 293–300. [Google Scholar] [CrossRef]
- El-Araby, R.; Amin, A.; El Morsi, A.K.; El-Ibiari, N.N.; El-Diwani, G.I. Study on the Characteristics of Palm Oil–Biodiesel–Diesel Fuel Blend. Egypt. J. Pet. 2018, 27, 187–194. [Google Scholar] [CrossRef]
- Tutunea, D.; Dumitru, I. Analysis of Performance and Emissions of Diesel Engine Using Sunflower Biodiesel. IOP Conf. Ser. Mater. Sci. Eng. 2017, 252, 12085. [Google Scholar]
- Naureen, R.; Tariq, M.; Yusoff, I.; Chowdhury, A.J.K.; Ashraf, M.A. Synthesis, Spectroscopic and Chromatographic Studies of Sunflower Oil Biodiesel Using Optimized Base Catalyzed Methanolysis. Saudi J. Biol. Sci. 2015, 22, 332–339. [Google Scholar] [CrossRef] [PubMed] [Green Version]
- Rezk, H.; Nassef, A.M.; Inayat, A.; Sayed, E.T.; Shahbaz, M.; Olabi, A.G. Improving the Environmental Impact of Palm Kernel Shell through Maximizing Its Production of Hydrogen and Syngas Using Advanced Artificial Intelligence. Sci. Total Environ. 2019, 658, 1150–1160. [Google Scholar] [CrossRef] [PubMed]
- Rezk, H.; Arfaoui, J.; Gomaa, M.R. Optimal Parameter Estimation of Solar PV Panel Based on Hybrid Particle Swarm and Grey Wolf Optimization Algorithms. Int. J. Interact. Multimed. Artif. Intell. 2021, 6, 145–155. [Google Scholar] [CrossRef]
- Gao, D.; Li, X.; Chen, H. Application of Improved Particle Swarm Optimization in Vehicle Crashworthiness. Math. Probl. Eng. 2019, 2019, 8164609. [Google Scholar] [CrossRef] [Green Version]
- Alahmer, A.; Yamin, J.; Sakhrieh, A.; Hamdan, M.A. Engine Performance Using Emulsified Diesel Fuel. Energy Convers. Manag. 2010, 51, 1708–1713. [Google Scholar] [CrossRef]
- Alahmer, A. Influence of Using Emulsified Diesel Fuel on the Performance and Pollutants Emitted from Diesel Engine. Energy Convers. Manag. 2013, 73, 361–369. [Google Scholar] [CrossRef]
- Adaileh, W.M.; AlQdah, K.S. Performance of Diesel Engine Fuelled by a Biodiesel Extracted from a Waste Cocking Oil. Energy Procedia 2012, 18, 1317–1334. [Google Scholar] [CrossRef] [Green Version]
- Lapuerta, M.; Armas, O.; Rodriguez-Fernandez, J. Effect of Biodiesel Fuels on Diesel Engine Emissions. Prog. Energy Combust. Sci. 2008, 34, 198–223. [Google Scholar] [CrossRef]
- Walle Mekonen, M.; Sahoo, N. Combined Effects of Fuel and Intake Air Preheating for Improving Diesel Engine Operating Parameters Running with Biodiesel Blends. J. Renew. Sustain. Energy 2018, 10, 43103. [Google Scholar] [CrossRef]
- Muralidharan, K.; Vasudevan, D.; Sheeba, K.N. Performance, Emission and Combustion Characteristics of Biodiesel Fuelled Variable Compression Ratio Engine. Energy 2011, 36, 5385–5393. [Google Scholar] [CrossRef]
- Buyukkaya, E. Effects of Biodiesel on a DI Diesel Engine Performance, Emission and Combustion Characteristics. Fuel 2010, 89, 3099–3105. [Google Scholar] [CrossRef]
- Ganapathy, T.; Gakkhar, R.P.; Murugesan, K. Influence of Injection Timing on Performance, Combustion and Emission Characteristics of Jatropha Biodiesel Engine. Appl. Energy 2011, 88, 4376–4386. [Google Scholar] [CrossRef]
- Abdullah, Z.; Suhaimi, H.; Abdullah, A.; Taufik, M.F.; Mrwan, A.G. Effect of Pentanol-Diesel Fuel Blends on Thermo-Physical Properties, Combustion Characteristics, Engine Performance and Emissions of a Diesel Engine. Int. J. Automot. Mech. Eng. 2018, 15, 5435–5450. [Google Scholar] [CrossRef] [Green Version]
- Fayad, M.A.; Chaichan, M.T.; Dhahad, H.A. Engine Performance and PM Concentrations from the Combustion of Iraqi Sunflower Oil Biodiesel under Variable Diesel Engine Operating Conditions. J. Phys. Conf. Ser. 2021, 1973, 12051. [Google Scholar]
- Abedin, M.J.; Masjuki, H.H.; Kalam, M.A.; Varman, M.; Arbab, M.I.; Fattah, I.M.; Masum, B.M. Experimental Investigation of a Multicylinder Unmodified Diesel Engine Performance, Emission, and Heat Loss Characteristics Using Different Biodiesel Blends: Rollout of B10 in Malaysia. Sci. World J. 2014, 2014, 349858. [Google Scholar] [CrossRef] [PubMed] [Green Version]
- Masum, B.M.; Kalam, M.A.; Masjuki, H.H.; Palash, S.M.; Fattah, I.M.R. Performance and Emission Analysis of a Multi Cylinder Gasoline Engine Operating at Different Alcohol–Gasoline Blends. RSC Adv. 2014, 4, 27898–27904. [Google Scholar] [CrossRef]
- Stone, R. Introduction to Internal Combustion Engines, 3rd ed.; Springer: Berlin/Heidelberg, Germany, 1999. [Google Scholar]
- Khiraiya, K.; Ramana, D.V.; Panchal, H.; Sadasivuni, K.K.; Doranehgard, M.H.; Khalid, M. Diesel-Fired Boiler Performance and Emissions Measurements Using a Combination of Diesel and Palm Biodiesel. Case Stud. Therm. Eng. 2021, 27, 101324. [Google Scholar] [CrossRef]
- Tat, M.E.; Van Gerpen, J.H. Effect of Temperature and Pressure on the Speed of Sound and Isentropic Bulk Modulus of Mixtures of Biodiesel and Diesel Fuel. J. Am. Oil Chem. Soc. 2003, 80, 1127–1130. [Google Scholar] [CrossRef]
- Szybist, J.P.; Boehman, A.L.; Taylor, J.D.; McCormick, R.L. Evaluation of Formulation Strategies to Eliminate the Biodiesel NOx Effect. Fuel Process. Technol. 2005, 86, 1109–1126. [Google Scholar] [CrossRef]
- Altıparmak, D.; Keskin, A.; Koca, A.; Gürü, M. Alternative Fuel Properties of Tall Oil Fatty Acid Methyl Ester–Diesel Fuel Blends. Bioresour. Technol. 2007, 98, 241–246. [Google Scholar] [CrossRef]
- Ramakrishnan, S.; Karthick, J.; Saravanan, S.; LakshmiNarayanaRao, G. Engine Analysis of Single Cylinder DI Diesel Engine Fuelled With Sunflower Oil, Sunflower Oil Methyl Ester and Its Blends. In ASME Internal Combustion Engine Division Fall Technical Conference; World Congress and Exhibition: Sacramento, CA, USA, 2006; Volume 42606, pp. 219–224. [Google Scholar]
- Rahman, S.M.A.; Masjuki, H.H.; Kalam, M.A.; Abedin, M.J.; Sanjid, A.; Sajjad, H. Production of Palm and Calophyllum Inophyllum Based Biodiesel and Investigation of Blend Performance and Exhaust Emission in an Unmodified Diesel Engine at High Idling Conditions. Energy Convers. Manag. 2013, 76, 362–367. [Google Scholar] [CrossRef]
- Sharon, H.; Karuppasamy, K.; Kumar, D.R.S.; Sundaresan, A. A Test on DI Diesel Engine Fueled with Methyl Esters of Used Palm Oil. Renew. Energy 2012, 47, 160–166. [Google Scholar] [CrossRef]
- Huang, J.; Wang, Y.; Qin, J.; Roskilly, A.P. Comparative Study of Performance and Emissions of a Diesel Engine Using Chinese Pistache and Jatropha Biodiesel. Fuel Process. Technol. 2010, 91, 1761–1767. [Google Scholar] [CrossRef]
- Ozsezen, A.N.; Canakci, M.; Turkcan, A.; Sayin, C. Performance and Combustion Characteristics of a DI Diesel Engine Fueled with Waste Palm Oil and Canola Oil Methyl Esters. Fuel 2009, 88, 629–636. [Google Scholar] [CrossRef]
- Dulger, Z.; Kaplan, C. Utilization of Sunflower Methyl Ester as a Diesel Engine Fuel; SAE Technical Paper; SAE International: Warrendale, PA, USA, 2001. [Google Scholar] [CrossRef]
- Lin, B.-F.; Huang, J.-H.; Huang, D.-Y. Experimental Study of the Effects of Vegetable Oil Methyl Ester on DI Diesel Engine Performance Characteristics and Pollutant Emissions. Fuel 2009, 88, 1779–1785. [Google Scholar] [CrossRef]
- Canakci, M.; Ozsezen, A.N.; Arcaklioglu, E.; Erdil, A. Prediction of Performance and Exhaust Emissions of a Diesel Engine Fueled with Biodiesel Produced from Waste Frying Palm Oil. Expert Syst. Appl. 2009, 36, 9268–9280. [Google Scholar] [CrossRef]
- Suryanarayanan, S.; Janakiraman, V.M.; Rao, G.L.N.; Sampath, S. Comparative Study of the Performance and Emission Characteristics of Biodiesels from Different Vegetable Oils with Diesel. 2008. Available online: https://www.sae.org/publications/technical-papers/content/2008-01-1581/ (accessed on 20 July 2021).
- Rama Krishna Reddy, E.; Subbalakshmi, Y.; Dhana Raju, V.; Appa Rao, K.; Harun Kumar, M.; Rami Reddy, S.; Tharun Sai, P. Assessment of Performance, Combustion and Emission Characteristics of the Diesel Engine Powered with Corn Biodiesel Blends. Int. J. Ambient Energy 2019, 1–9. [Google Scholar] [CrossRef]
- Holman, J.P. Experimental Methods for Engineers, 8th ed.; McGraw-Hill Education: New York, NY, USA, 2011. [Google Scholar]
- Alahmer, A.; Aladayleh, W. Effect Two Grades of Octane Numbers on the Performance, Exhaust and Acoustic Emissions of Spark Ignition Engine. Fuel 2016, 180, 80–89. [Google Scholar] [CrossRef]
- Bai, Y.; Saren, G.; Huo, W. Response Surface Methodology (RSM) in Evaluation of the Vitamin C Concentrations in Microwave Treated Milk. J. Food Sci. Technol. 2015, 52, 4647–4651. [Google Scholar] [CrossRef] [PubMed] [Green Version]
- Nwosu, C.; Ayodele, O.; Ibrahim, H. Optimization of Hydrogen Production via Catalytic Autothermal Reforming of Crude Glycerol Using Response Surface Methodology and Artificial Neural Network. Int. J. Energy Res. 2021, 45, 18999–19013. [Google Scholar] [CrossRef]


Publisher’s Note: MDPI stays neutral with regard to jurisdictional claims in published maps and institutional affiliations. |
© 2022 by the authors. Licensee MDPI, Basel, Switzerland. This article is an open access article distributed under the terms and conditions of the Creative Commons Attribution (CC BY) license (https://creativecommons.org/licenses/by/4.0/).