Article

Study on Flow Distribution and Structure Optimization in a Mix Chamber and Diffuser of a CO2 Two-Phase Ejector

1
School of Electric Power, Civil Engineering and Architecture, Shanxi University, Taiyuan 030006, China
2
Wind Turbine Monitoring and Diagnosis NTRC of Shanxi Province, Taiyuan 030006, China
*
Author to whom correspondence should be addressed.
Mathematics 2022, 10(5), 693; https://doi.org/10.3390/math10050693
Submission received: 27 January 2022 / Revised: 20 February 2022 / Accepted: 21 February 2022 / Published: 23 February 2022
(This article belongs to the Special Issue Advances in Computational Science and Its Applications)

Abstract

:
This paper establishes a mathematic model of a CO2 two-phase ejector to investigate flow distribution in the components of a mixing chamber and diffuser. The suction chamber was modeled using the characteristic line method to describe the development process of the supersonic expansion wave, and the mixing chamber, as well as diffuser models, were built based on the double-flow model. The reliability of the model was verified by experimental data. The distributions of flow parameters along the axis of the mixing chamber and diffuser were analyzed under different expansion ratios of the ejector. Structure optimizations of the mixing chamber and diffuser were conducted. The results showed that the primary flow temperature gradually increased along the axis of the mixing chamber and diffuser, but the Mach number distribution decreased for a certain ejector expansion ratio. The temperature and Mach number of the secondary flow showed the opposite trend. Moreover, at the initial stage of mixing, the fluid pressure increased rapidly, and the Mach number of the primary flow decreased rapidly. The gas-phase fraction of primary flow increased gradually in the mixing chamber and was stable in the diffuser. When the length–diameter ratio of the mixing chamber was about 10.8–12, it was beneficial to mix uniformity, and when the expansion angle of the diffuser was 4–6°, the ejector had a better ejector efficiency.

1. Introduction

Recently, ejectors have been subject to great focus in energy systems, the process industry and low-grade heat use, by virtue of its advantages of saving energy and its simple structure. Nevertheless, due to the complex flow characteristics in the CO2 ejector, it is particularly difficulty to comprehensively understand the flow behavior in each part, including the motive nozzle, suction chamber, mixing chamber, and diffuser [1,2]. Numerous scholars have carried out many theoretical analyses and numerical simulations on ejectors [3,4]. Palacz and Haida et al. [5,6,7] conducted a series of studies to continuously perfect the delay equilibrium model (DEM) and homogeneous equilibrium model (HEM) of a CO2 ejector, and obtained abundant field information to optimize the ejector structure. Nakagawa et al. [8] established a CO2 supersonic two-phase model based on HEM, and discussed how the shockwave changes. Although the above-mentioned CFD models have advantages in the evaluation of detailed flow field inside the ejector, numerical techniques are time-consuming and need powerful computers, and it is not easy to deal with the stability criteria [9]. By contrast, the reasonable one-dimensional thermodynamic model is more computationally cheap and operationally reliable. Li et al. [10] studied two-phase flow in a transcritical CO2 ejector using a visualization experiment. Based on the isentropic expansion process of primary flow, the transition position of the phase change was discovered by experiment and theoretical analysis. Banasiak et al. [11] constructed a CO2 ejector model where the control equations were developed for the mixing chamber and diffuser to obtain internal flow distribution characteristics. Chen et al. [12] used the characteristic line method to study the Mach wave structure of primary flow and predicted the flow pattern in the ejector, and pointed out that the influence of the Mach wave should be considered under off-design conditions. Though many CO2 ejector models have been established based on the thermodynamic method or gas dynamic method, the suction chamber model is usually constructed based on the zero-dimension model, given the lack of the understanding of the expansion wave and flow distribution analysis [11]. In addition, the condensation and entrainment of fluid in the mixing process increases the difficulty of analyzing mass and energy transfer. Therefore, it is necessary to investigate the distribution of thermodynamic parameters along the flow path of an ejector to further improve ejector performance.
The theoretical analysis of flow characteristics is an effective method for guiding geometry optimization [13,14]. Many studies have been conducted to optimize the structural parameters of the ejector [15,16,17]. Yan et al. [18] numerically and experimentally improved the convergence angle of a suction chamber and an optimized convergence angle improved the entrainment ratio of ejector by 15%. Wu et al. [19] found that there was an optimal convergence angle and length of mixing chamber for achieving the best ejector performance by virtue of CFD simulation. Yan et al. [20] improved mixing performance of the ejector by simulating key ejector geometric parameters such as the length of the constant pressure-mixing section and the length of the constant area-mixing section. Li et al. [21,22] proposed the optimal length–diameter ratio of the ejector mixing chamber by comparing the difference in shockwave lengths. Kandakure et al. [23] explored the structure of the mixing chamber and found the length–diameter ratio of the mixing chamber had a strong impact on internal flow loss and efficiency of the ejector. Balamurugan et al. [24] provided the optimal matching range between the mixing chamber length–diameter ratio as well as the semi-cone angle of the diffuser and the nozzle outlet velocity to reduce operating costs. A too-large or too-small semi-cone angle and inappropriate length of diffuser was found to be counterproductive for improving the performance of the ejector. Although there are many studies that have investigated ejector geometry, only a few radial dimensions have been discussed and determined by theoretical deduction. Axial dimensions, including nozzle exit position and lengths of mixing chamber and diffuser, are rarely determined by theoretical foundation. In particular, the lengths of the mixing chamber and diffuser, which achieves momentum and heat transfer, should be studied in more depth. At present, the lengths of mixing chamber and diffuser are mainly decided by the empirical formula summarized from experimental data [25]. However, the universality of the empirical formula is also problematic for different working conditions and working media. Even so, an in-depth study of flow distribution in the mixing chamber and diffuser can provide important theoretical references for the analysis of energy and mass transfer, as well as irreversible loss.
In this paper, a global mathematical model of a CO2 two-phase ejector was established, in which the suction chamber model was developed using the characteristic line method, focusing on supersonic expansion of primary flow, and the mixing chamber and diffuser was molded using the double-flow model to obtain the flow distribution characteristics in the mixing process. Based on the experimental structural and thermodynamic parameters of the CO2 ejector, the variation of flow parameters, such as temperature, velocity, Mach number and pressure in the ejector, were analyzed, and optimization strategies regarding the length–diameter ratio of the mixing chamber and semi-cone angle of the diffuser were proposed.

2. Mathematical Model

2.1. Motive Nozzle and Suction Chamber

Figure 1 gives a schematic diagram of the ejector. To simplify the calculation of the motive nozzle and suction chamber, the following assumptions have been made: (1) the fluid flow in the motive nozzle is a one-dimensional steady adiabatic flow; (2) the motive nozzle is a converge nozzle; (3) the two fluids in the suction chamber are coaxial flow, and do not mix; (4) the velocity of primary flow and secondary flow at the ejector inlet is ignored; (5) thermal diffusion and turbulent viscous heat transfer are ignored. Therein, the converging nozzle is assumed to be correctly validated by the experimental data, which is tested based on this kind of nozzle [26].
The primary flow inlet pressure pp and temperature Tp are the known parameters, and inlet enthalpy hp and thermodynamic entropy sp are obtained by REFPROP [27]. Assuming the nozzle outlet pressure pt, the enthalpy at nozzle outlet ht is obtained by isentropic flow between the nozzle inlet and outlet. The energy conservation in the nozzle is used to determine the nozzle outlet velocity Vt:
h t = h p η n h p h t
V t = 2 h p h t
where ηn is the nozzle efficiency, which is evaluated according to [26]. As the primary flow is chocked at the nozzle throat, the sound velocity Vc at the nozzle outlet is compared with the Vt, and the outlet pressure pt is constantly updated until the velocities converge. Considering that the exit of the motive nozzle is a two-phase flow, the sound velocity model presented by [28] is adopted to consider the non-equilibrium phase transformation.
To describe the expansion wave of primary flow in the suction chamber, the characteristic line method is used to solve the Mach line and node parameters of the expansion wave region to obtain the flow parameters in the suction chamber. The characteristic line method is commonly employed in simulations involving supersonic flow, to calculate the flow parameters along the characteristic curve direction. The perturbation in the supersonic flow field always spreads along the Mach line, while the Mach line is the characteristic line of supersonic flow field. Based on characteristic line method, a more accurate numerical solution can be obtained. In addition, because the finite differential method is adopted, the expansion wave and shockwave are considered to be simple waves, which can be described by the characteristic curve.
Though the thermophysical properties of CO2 would impart dramatic changes at the critical point, if the real-time thermophysical properties are used in the model calculation, it must affect the robustness of the simulations. Thus, the gas dynamics equations are established based on the isentropic relationship and mass conservation, which is the commonly accepted approach for shockwave prediction, and it can guarantee that the simulation robust.
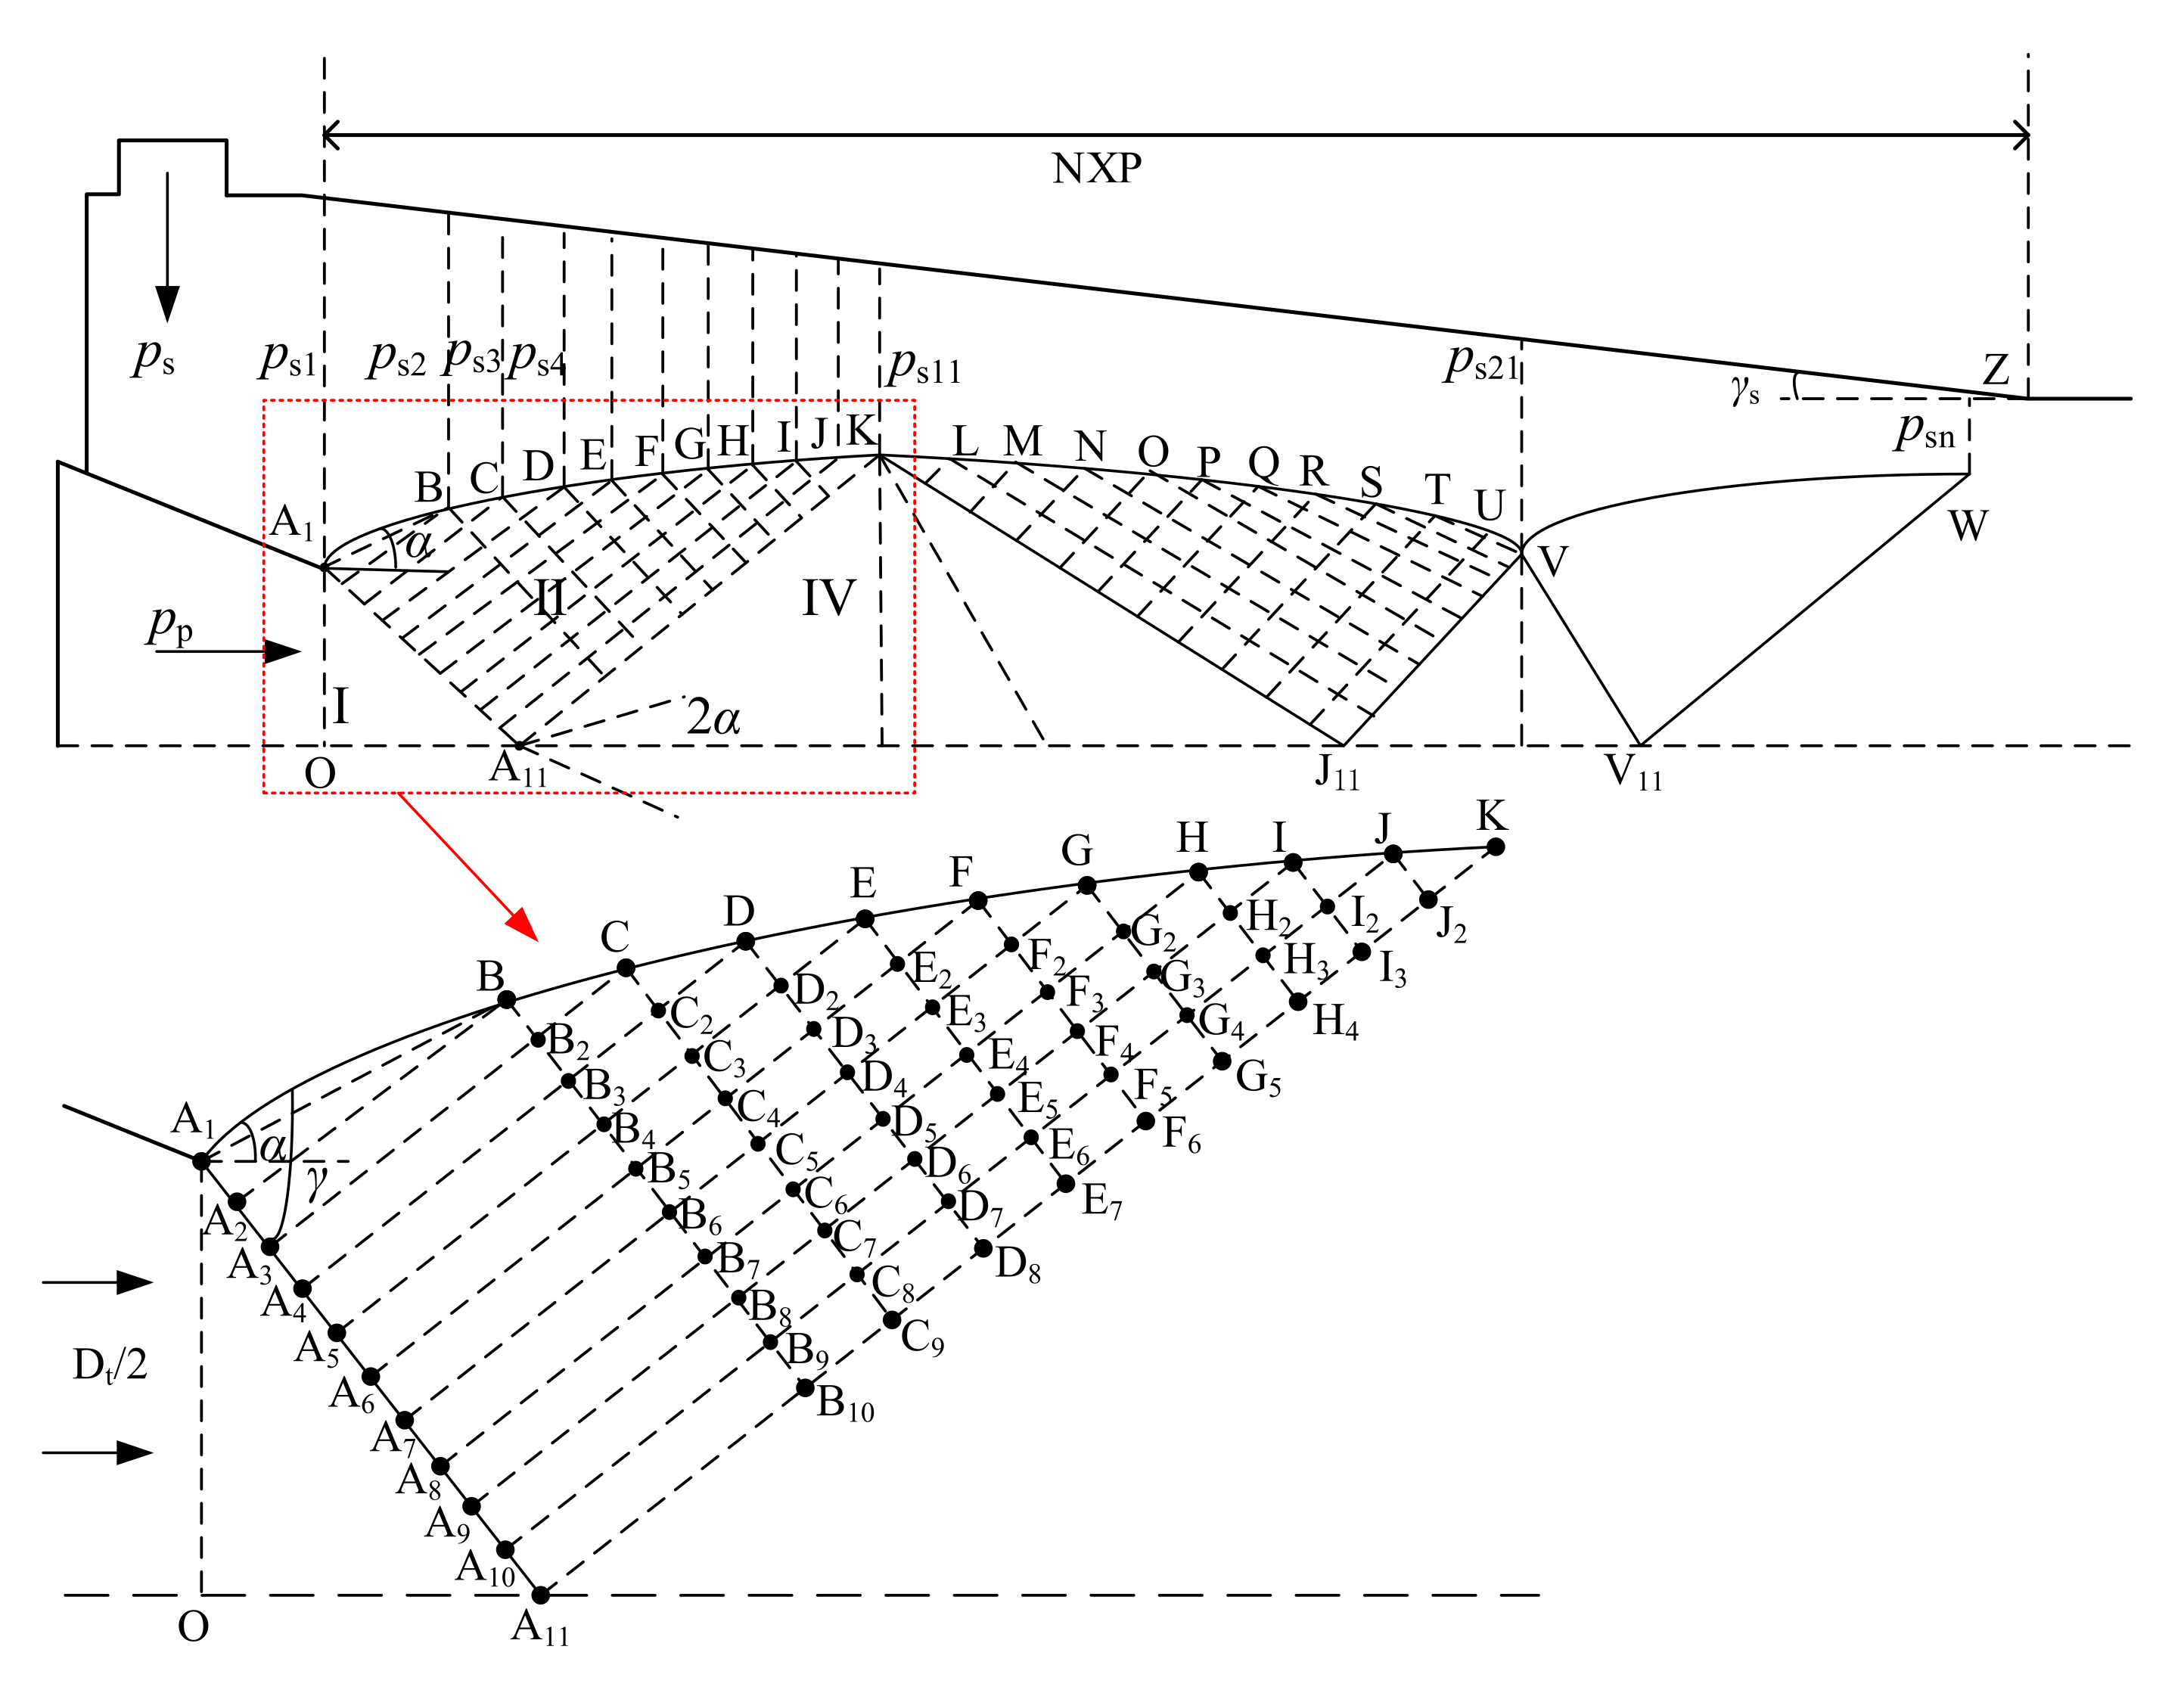
It is assumed that the fluid at the nozzle outlet flows axially, and its half-amplitude expansion region is the A1OA11 region, as shown in Figure 2. The expansion region is considered to be composed of many weak expansion waves, each of which is along the Mach line. The A1A11 line in Figure 2 shows a Mach line in the first expansion wave at the outlet of the primary flow nozzle. Since all flow parameters are the same along the Mach lines in the expansion wave, and the Mach lines are straight, the Mach line A1A11 can be evenly divided into several points.
Since the flow is deflected counterclockwise after passing through the expansion wave, the expansion wave system A1OA11 is a right-extension expansion wave, and the expansion angle α of the flow can be obtained by Prandtl–Meyer function [29]:
α = v M a p , s 1 v M a t
where Mat and Map,s1 are the Mach numbers of the primary flow at the nozzle outlet before and after the expansion wave, respectively. According to the isentropic flow, the Mach number Map,s1 can be obtained as follows:
p t p p , s 1 = 1 + k 1 2 M a p , s 1 2 k k 1
Herein, due to the adiabatic isentropic flow, the boundary pressure of primary flow at post-wave pp,s1 is equal to the pressure of the secondary flow at Section s1 ps1. The corresponding Mach angle γma is expressed as:
γ ma = arcsin 1 / M a p , s 1
The slope of Mach line A1A11 can be calculated by:
k = tan α γ
According to the coordinates of point A1 and the slope of Mach line A1A11, the equation of Mach line A1A11 is solved. According to the two-phase flow sound velocity model, the local sound velocity Vc at the outlet of the primary flow in nozzle is calculated. Then, the velocity of the primary flow after the first expansion wave system Vp,s1 is given as:
V p , s 1 = M a p , s 1 V c
Then the axial velocity uA1 and radial velocity vA1 of fluid at each point of Mach line A1A11 are expressed, respectively as:
u A 1 = V p , s 1 cos α
v A 1 = V p , s 1 sin α
The position information and flow parameters of point B are obtained by the solving approach of the free pressure boundary points of the characteristic line method. Then, the subsequent position and flow parameters of point B2 are also calculated using the finite difference method. Similarly, the spatial positions and flow parameters of all nodes in the A1A11K region are solved.
Because both the upper and lower edges of the nozzle outlet would generate expansion waves, two bunches of new expansion waves are produced to maintain the pressure balance after the expansion wave. Subsequently, the fluid flows inward and close to the middle axis, forming the compression wave. Then, expansion waves and compression waves appear alternately, forming a brick-like shockwave chain.
Since the inlet parameters of the secondary flow are known, according to the isentropic relationship and energy conservation between the inlet section of the ejector and Section s1 (as shown in Figure 1), the Mach number, density and velocity of the secondary flow at Section s1 can be obtained by assuming the pressure ps:
p s p s , s 1 = ρ s ρ s , s 1 = 1 + k 1 2 M a s , s 1 2 k k 1
u s , s 1 = 2 h s h s , s 1
h s , s 1 = h s η s h s h s , s 1
where k is the adiabatic index, and ηs is the suction chamber efficiency, which is referred to in [26].
According to the mass conservation of the secondary flow, the density could be expressed as:
ρ s , s i u s , s i A s , s i = ρ s , s i + 1 u s , s i + 1 A s , s i + 1
In addition, based on the Bernoulli equation, the fluid pressure is defined as:
k k 1 p s , s i ρ s , s i + u s , s i 2 2 = k k 1 p s , s i + 1 ρ s , s i + 1 + u s , s ( i + 1 ) 2 2
According to Equation (10), the Mach number Mas,s1 and density ρs,s1 of the secondary flow in Section s1 have been obtained. The density ρs,s2, Mach number Mas,s2 and velocity us,s2 in Section s2 are determined using the continuity and energy conservation equation as well as isentropic flow. Combining Equations (13) and (14), ps,s2 can be solved, and ps,sn is iterated. In return, the pressure, velocity, Mach number and density of the secondary flow along the flow axis can be obtained.
The primary flow expands and compresses alternately, and the flow deflection angle also changes continually. Based on the Prandtl–Meyer function and the deflection angle of the primary flow in each region, the Mach number along the axis can be determined by iterative calculation, where the pressure of the primary flow is consistent with the secondary flow pressure as the iterative convergence condition. In addition, then, the primary flow pressure pp,pn along the axis can be obtained.

2.2. Mixing Chamber and Diffuser Model

The distributed parameter method is used to model the mixing chamber and diffuser, where the mixing chamber and diffuser is divided into many elements along the flow path. The double-flow model is used where the primary stream flow in the center and the suction stream flow annularly. The partial differential governing equations of mass, momentum and energy are established on each element. To facilitate the construction of mixing chamber and diffuser model, the following assumptions are made [11]:
  • The fluid in the mixing chamber and diffuser is the steady flow state.
  • The external forces are ignored.
  • The mass transfer between the two streams is calculated by the condensation and entrainment.
  • The momentum transfer is determined by the drag forces of interface between the two streams and the mass transfer resulted in the momentum gain or loss.
  • The friction pressure drop is accounted for by the wall boundary layer and the imaginary mixing layer between the two streams.
According to the above hypothesis, the mass equation is determined by:
d d l ρ j A j u j = Γ j
j ∈ (1, 2), 1 represents the primary flow and 2 represents the secondary flow. Γ j is the mass transfer differential at the interface between the primary flow and the secondary flow, which mainly includes the mass transfer differential Γ c generated by the condensation of the primary flow to the secondary flow, and the mass transfer differential generated by the primary flow entraining secondary flow Γ 2 1 , as well as the mass transfer differential Γ 1 2 generated by the deposition of the primary flow to secondary flow, since the deposition of primary flow to secondary flow is not considered, Γ 1 2 = 0 .
The mass differential formula for condensation of primary flow to secondary flow is expressed as [30]:
Γ c = α int T 1 T 2 h int h l , sat d F int d l
The mass transfer differential F 2 1 generated by the primary flow entraining secondary flow is calculated by the following equation [11].
Γ 2 1 = 1.175 × 10 4 × u 1 ρ 1 ρ 2 η 2 R e 2 R e 2 , R e 2 R e 2 , 0 R e 2 < R e 2 ,
where R e 2 is the Reynolds number of secondary flow, R e 2 , is the local equilibrium Reynolds number, and the calculation formula is as follows:
R e 2 , = exp 5.8504 + 0.4249 μ 1 μ 2 ρ 2 ρ 1
Therefore, the mass equation of the primary flow is expressed as:
d d l ρ 1 A 1 u 1 = Γ 1 = Γ 2 1 Γ c
The mass equation of the secondary flow has the following form:
d d l ρ 2 A 2 u 2 = Γ 2 = Γ c Γ 2 1
The momentum equation of primary flow is as follows:
A 1 ρ 1 u 1 d u 1 d l + A 1 d p d l = Γ 2 1 Γ c u 1 , int u 1 + M 1 , int F 1 , w
where M 1 , int is the momentum transfer differential at an interface between the primary flow and the secondary flow:
M 1 , int = 0.5 C 1 2 ρ 1 u 1 u 2 u 1 u 2 d F 1 , int d l
F 1 , w is the friction differential at the interface between the primary flow and the secondary flow:
F 1 , W = f 1 , w 2 ρ 1 u 1 u 2 2 d F 1 , int d l
C1–2 is the interface resistance coefficient of primary flow and secondary flow, calculated by:
C 1 2 = b ρ 2 μ 2 u 1 u 2 D A 1 A 1 + A 2 0.25
where b is the scale factor, which is measured experimentally.
The momentum equation of the secondary flow can be obtained as follows:
A 2 ρ 2 u 2 d u 2 d l + A 2 d p d l = Γ c Γ 2 1 u 2 , int u 2 + M 2 , int F 2 , w
where M 2 , int is the friction differential between the primary flow and the secondary flow:
M 2 , int = 0.5 C 1 2 ρ 1 u 1 u 2 u 1 u 2 d F 1 , int d l
F 2 , w is the friction differential at the wall surface, expressed as follows:
F 2 , w = f 2 , W 2 ρ 2 u 2 2 d F W d l
The friction coefficient of single-phase flow is given as the following:
1 f k = 2 lg R e f k 0.8
The friction coefficient of two-phase flow is calculated by the Churchill model [31].
The energy equations of two streams are expressed, respectively:
A 1 u 1 2 ρ 1 d u 1 d l + A 1 u 1 ρ 1 d h 1 d l = Γ 2 1 Γ c h 1 , int h 1 + u 1 , int 2 2 u 1 2 2
A 2 u 2 2 ρ 2 d u 2 d l + A 2 u 2 ρ 2 d h 2 d l = Γ c Γ 2 1 h 2 , int h 2 + u 2 , int 2 2 u 2 2 2
In addition, the geometric relationship is showed as follows:
d A m d l = d A 1 d l + d A 2 d l
Combining Equations (19)–(21), (25) and (29)–(31), a 9-order control equation including state and structural parameters of primary flow and secondary flow is developed, and its independent variable parameters are expressed as: x = d u 1 d l , d u 2 d l , d h 1 d l , d h 2 d l , d ρ 1 d l , d ρ 2 d l , d A 1 d l , d A 2 d l , d p d l . Using the fourth-order Runge–Kutta method, the fluid state parameters along the flow path of the primary flow and the secondary flow in the mix chamber and diffuser can be obtained. The specific calculation steps of the mixing chamber and diffuser are given as follows: first, the fluid parameters calculated by the motive nozzle and suction chamber are taken as the initial boundary parameters of the inlet of the mixing chamber, such as pressure, velocity, temperature, cross-sectional area and enthalpy. Then, the variables Γ c , Γ 2 1 , F 1 , int , F 1 , w , F 2 , w are calculated. In the end, the 9-order control equation for every element is solved to obtain the pressure, velocity, enthalpy, density, and cross-sectional area.

3. Model Validation

The authors carried out experimental tests on the transcritical CO2 ejector expansion refrigeration system with an adjustable structure ejector, and the performance parameters of the ejector under different NXP and the motive nozzle throat area are obtained [26,30]. In addition, among the calculations of the differential of interface momentum transfer rate M1,int presented in Section 2.2, the scale coefficient b in the interface drag coefficient C1–2 is confirmed to be 1.5. The heat transfer coefficient between the primary flow and suction flow refers to the study by Hwang and is amended with the operating conditions [32]. During the calculation of differential of mass transfer F2–1, the kinetic viscosity of suction flow is adjusted for the working conditions.
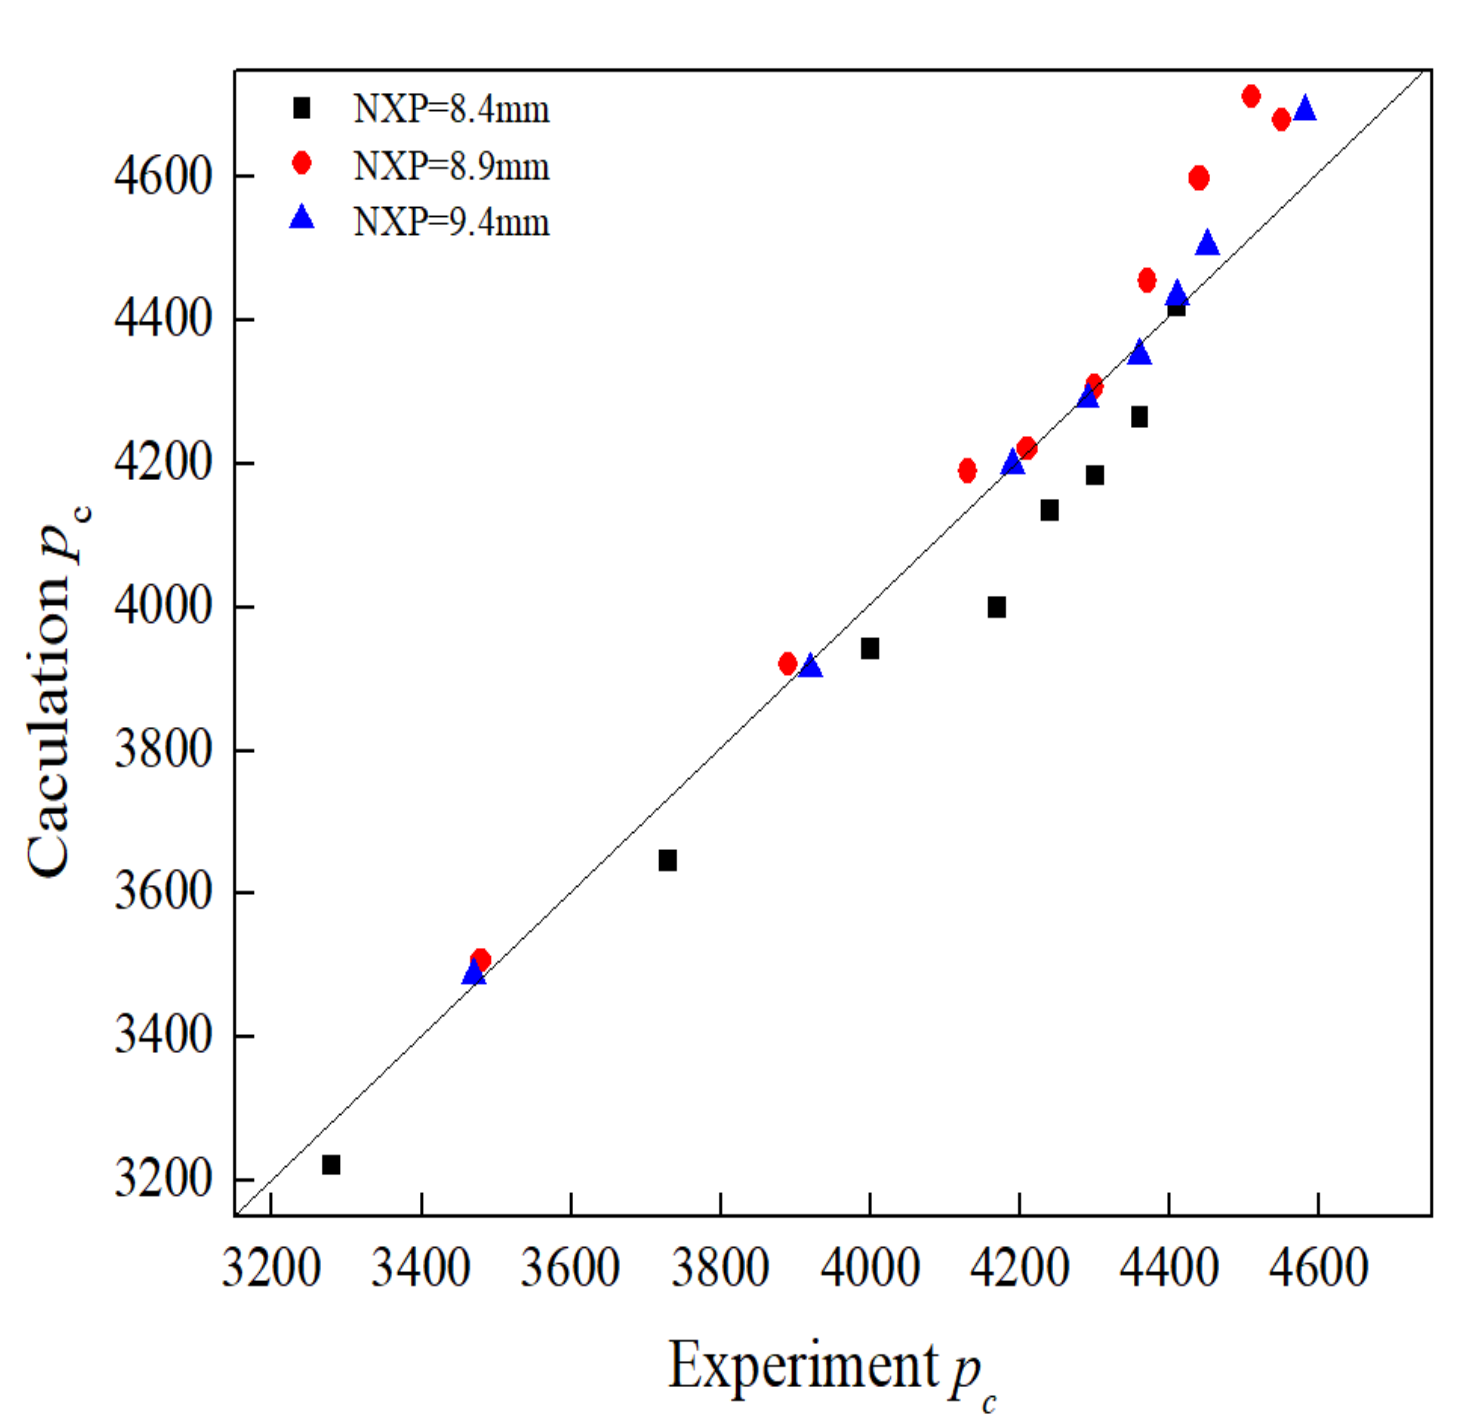
Here, the entrainment ratio µ and the ejector outlet pressure pc calculated by the present model are compared with the above experimental data to verify mode accuracy. Figure 3 shows that the maximum deviation, minimum deviation, and average deviation of the entrainment ratios between the model calculation value and the experimental measurement are 12.21%, 0.37%, and 4.93%, respectively. To compare the ejector outlet pressure pc, as shown in Figure 4, the maximum deviation, minimum deviation, and average deviation are 4.48%, 0.025%, and 1.55%, respectively. The deviation is mainly due to the machining accuracy of ejector, the influence of friction, and heat transfer model; however, the calculation error is within the allowable range.

4. Result and Discussion

4.1. Flow Distribution

According to the structural and flow parameters of the CO2 ejector tested in [26,30], in this paper, five groups of expansion ratios pp/ps (ratio of primary flow pressure to secondary flow pressure) are selected to analyze the flow distribution in the mixing chamber and diffuser. The specific experimental data can be found in [26,30].
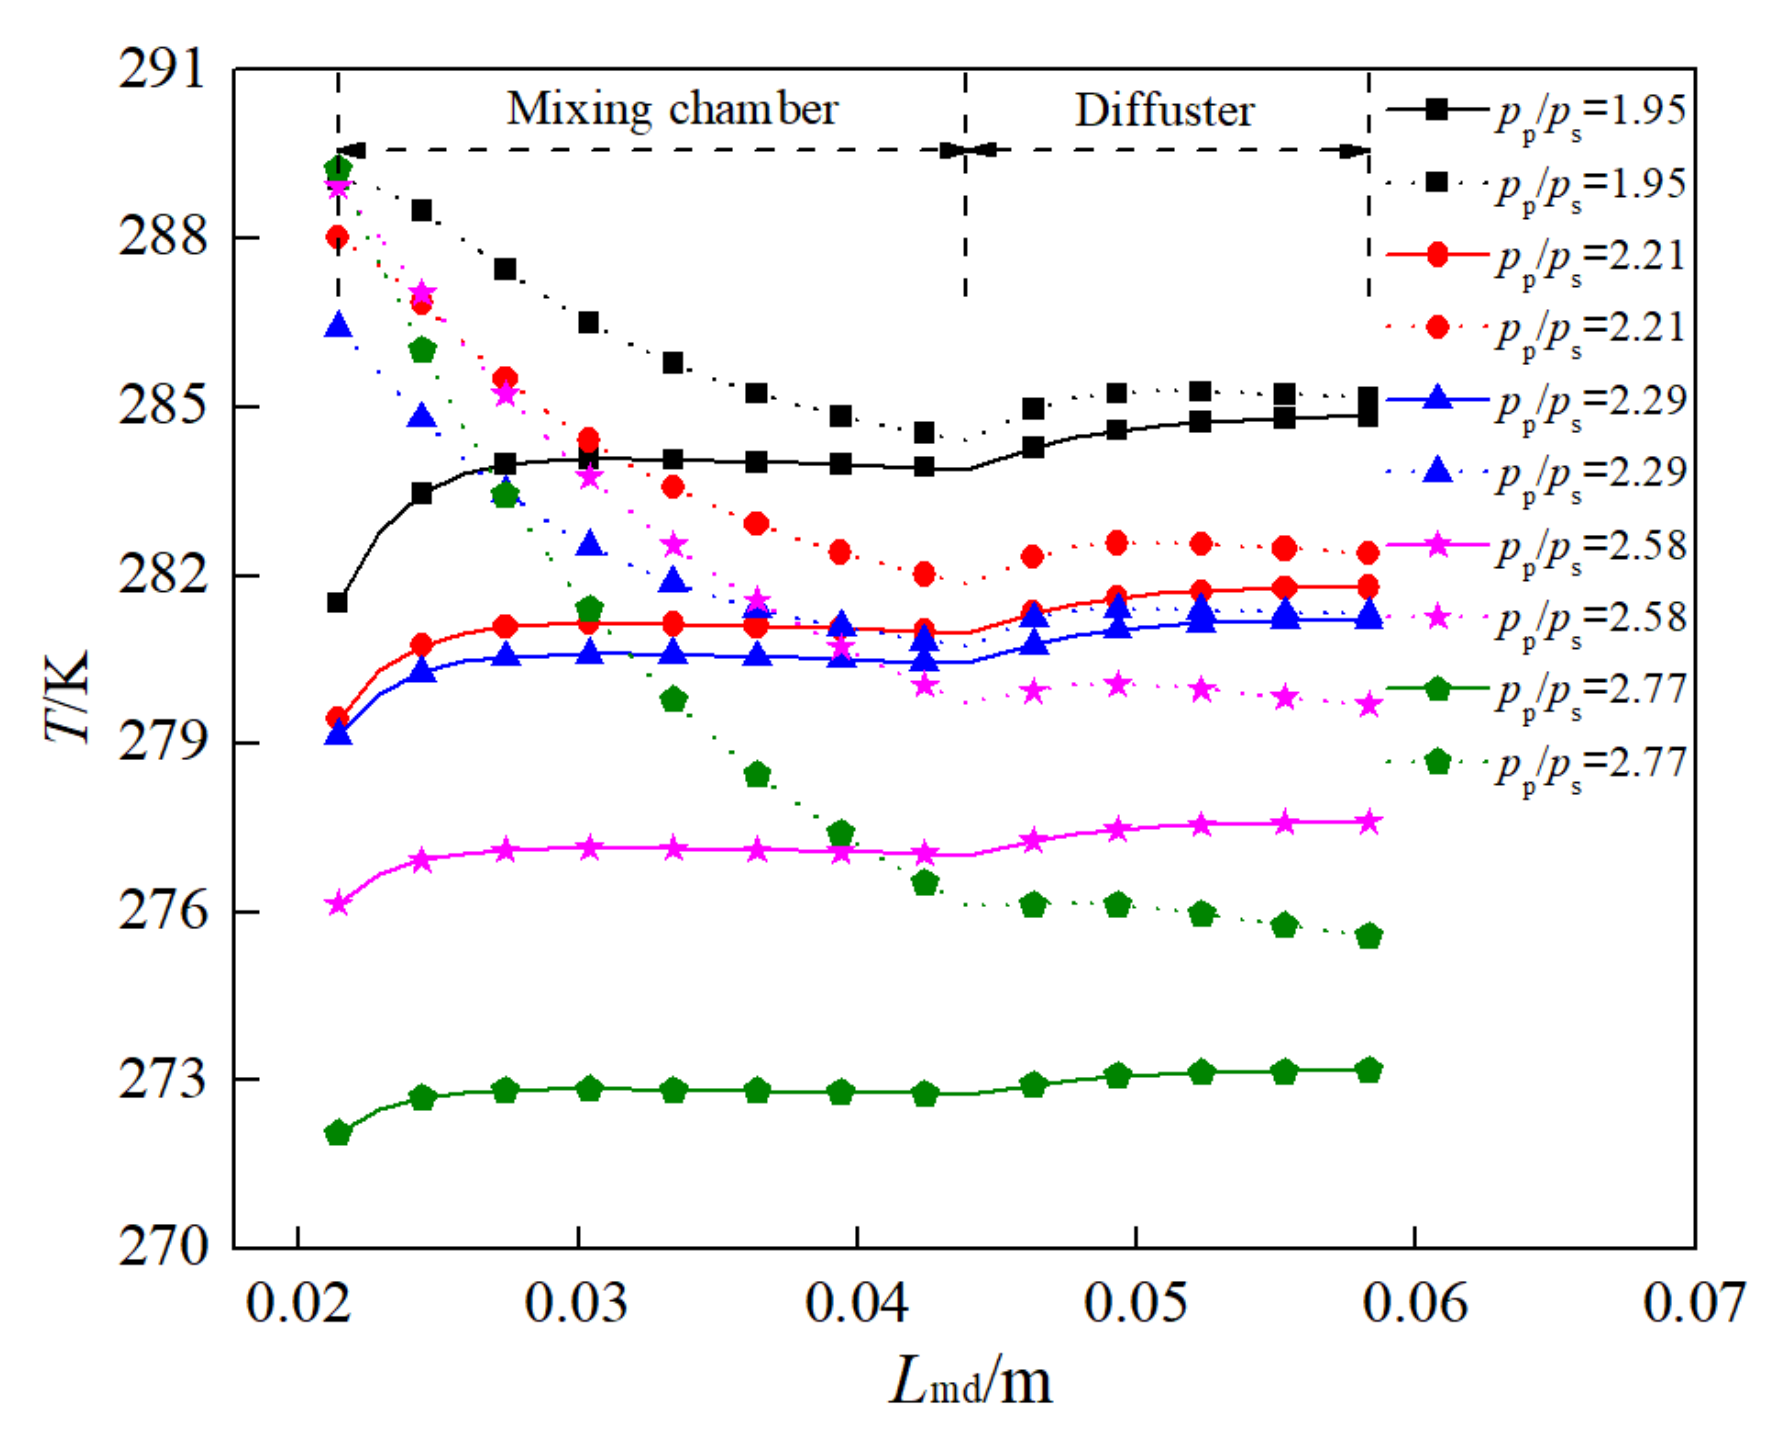
Figure 5 shows the temperature distribution of the primary flow and secondary flow along the path of the mixing chamber and diffuser under different expansion ratios pp/ps. The temperature of the primary flow is represented with a solid line, and for the secondary flow a dashed line. It can be seen from Figure 5 that the temperature of the primary flow along the path gradually increases, while the temperature of the secondary flow gradually decreases, and the temperatures of the two fluids tend to be equal in the flow process. This is mainly due to the supersonic expansion of the primary flow in the nozzle and the suction chamber, resulting in its temperature lower than that of the secondary flow. In the process of energy transfer between the two streams in the mixing chamber and diffuser, the secondary flow will condense and release heat into the primary flow, making the temperature of primary flow rise until the temperature of the two streams reaches equilibrium. Moreover, the temperature difference between the two streams at the entrance of mixing chamber is largest, which accelerates the energy transfer rate. In addition, for the small expansion ratio, the temperature of primary flow rises rapidly at the initial stage of mixing, while the large expansion ratio makes the secondary flow temperature decrease significantly in the mixing process. The final temperature difference between the two streams is 2.4 K at high expansion ratio (pp/ps = 2.77), and it is higher than that at low expansion ratio (pp/ps = 1.95) where the temperature difference is only 0.32 K. Due to the limitations of existing ejector structure, the energy exchange between two streams cannot be completed in a limited space. Therefore, it is necessary to optimize the mixing process of the ejector to improve energy transfer efficiency.
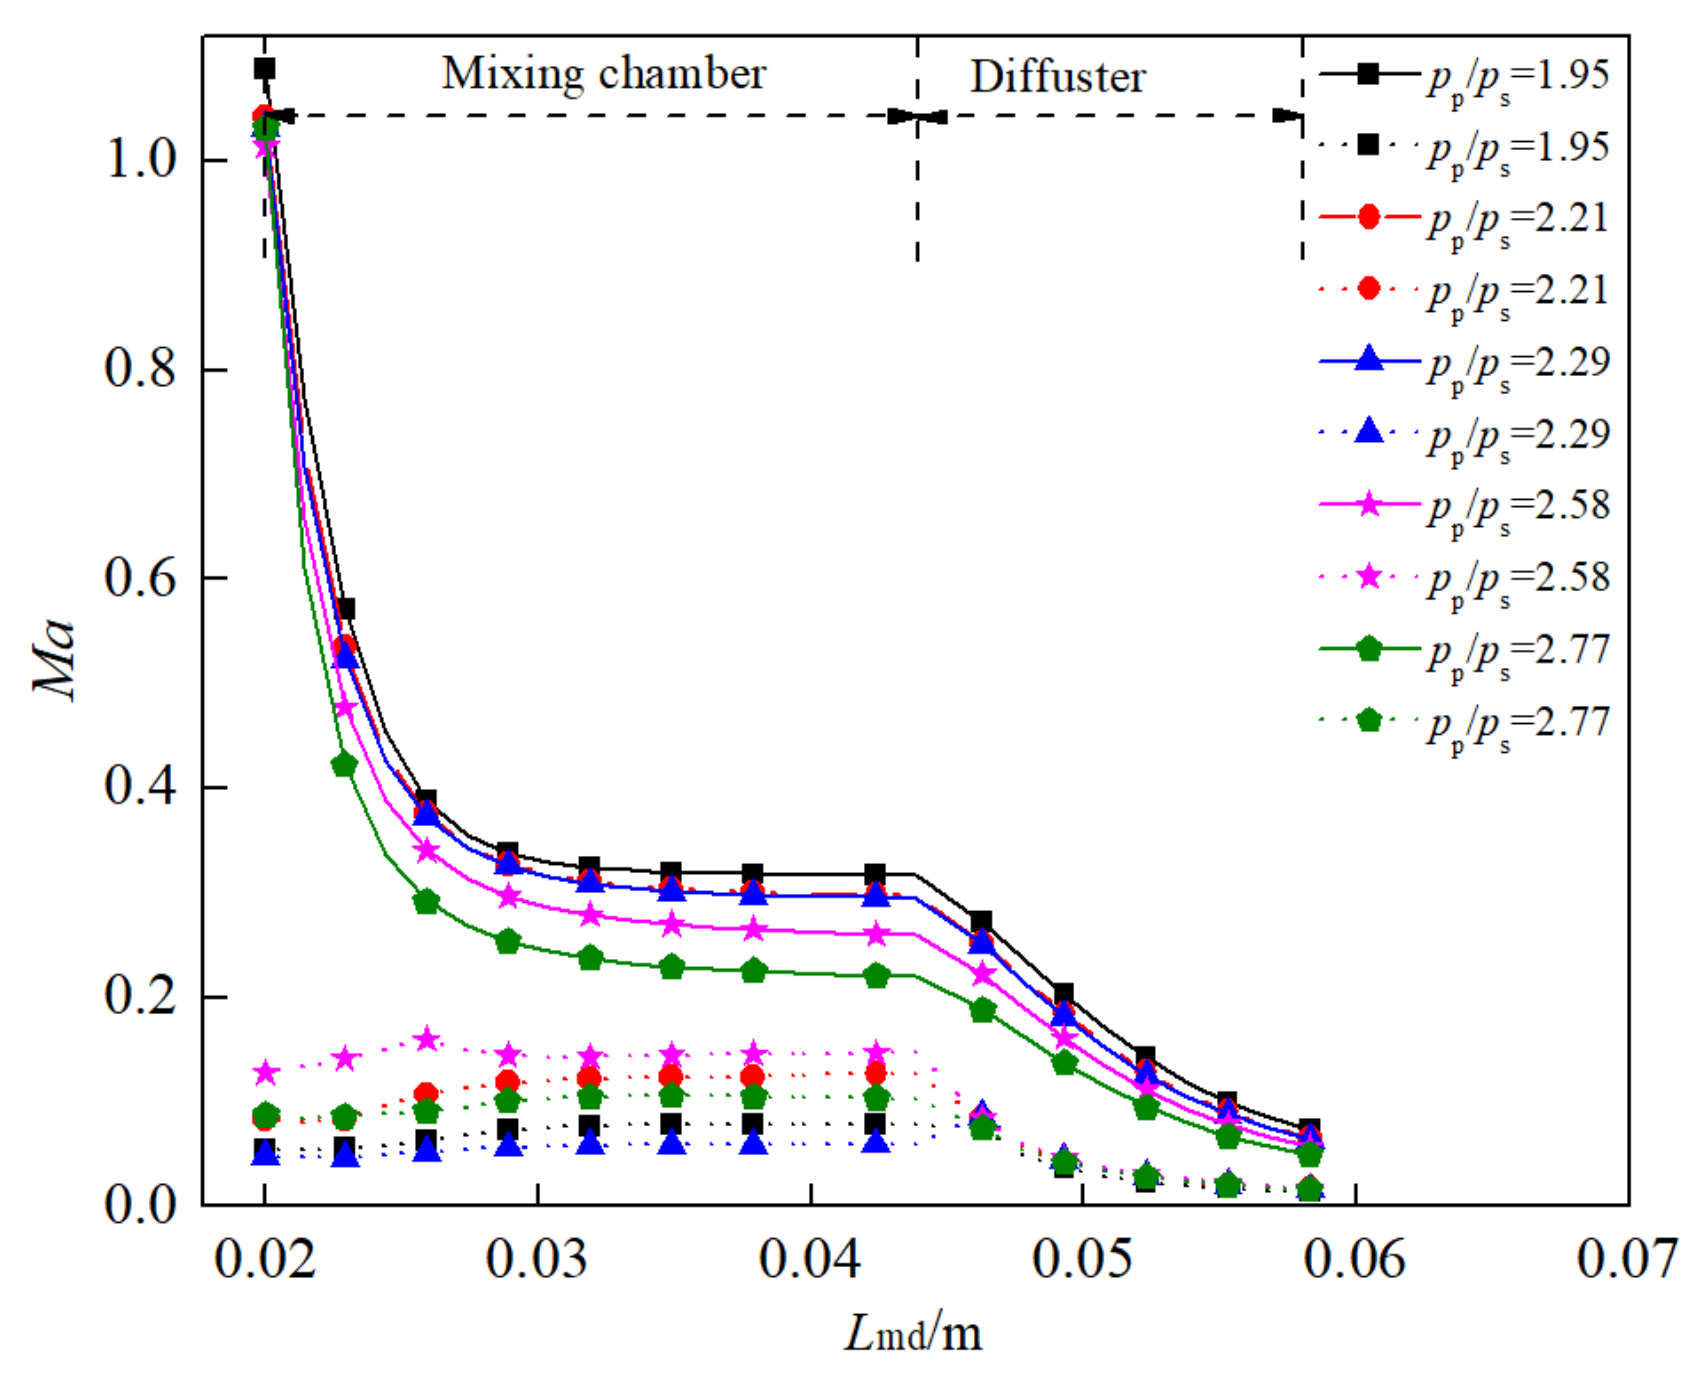
Figure 6 shows the Mach number distribution of the primary flow and secondary flows along the path of the mix chamber and diffuser under different expansion ratios pp/ps. From Figure 6 it can be seen that the primary flow is in a supersonic state at the beginning of the mixing process, and the Mach number of primary flow decreases gradually, falling fastest in the initial stage of mixing chamber (the top 15% of the total length). More specifically, under the five groups of expansion ratio, the declines of Mach number at the initial stage of the mixing chamber, accounting for the whole process, are 74.6%, 73.7%, 74.2%, 76.6% and 80.8%, respectively. In the diffuser, the Mach number of the primary flow decreases more obviously than in the secondary flow, and the Mach number differences between the two fluids decrease gradually. At the beginning of the mixing chamber, the supersonic velocity of the primary flow is much larger than that of the secondary flow, and the momentum transfers of the two fluids results in the rapid decrease in the primary flow velocity in the limited mixing space. After entering the diffuser, the velocity of both fluids decreases significantly. Moreover, there is still a gap of the Mach numbers between the two fluids at the diffuser, which indicates that there is still room for further improvement to the ejector used in the experiment. Moreover, the larger velocity difference between the two streams leads to evident velocity slip, and this is accompanied by the larger Reynolds number [33]. In addition, a favorable heart transfer occurs, which has similar conclusions to that of Figure 5.
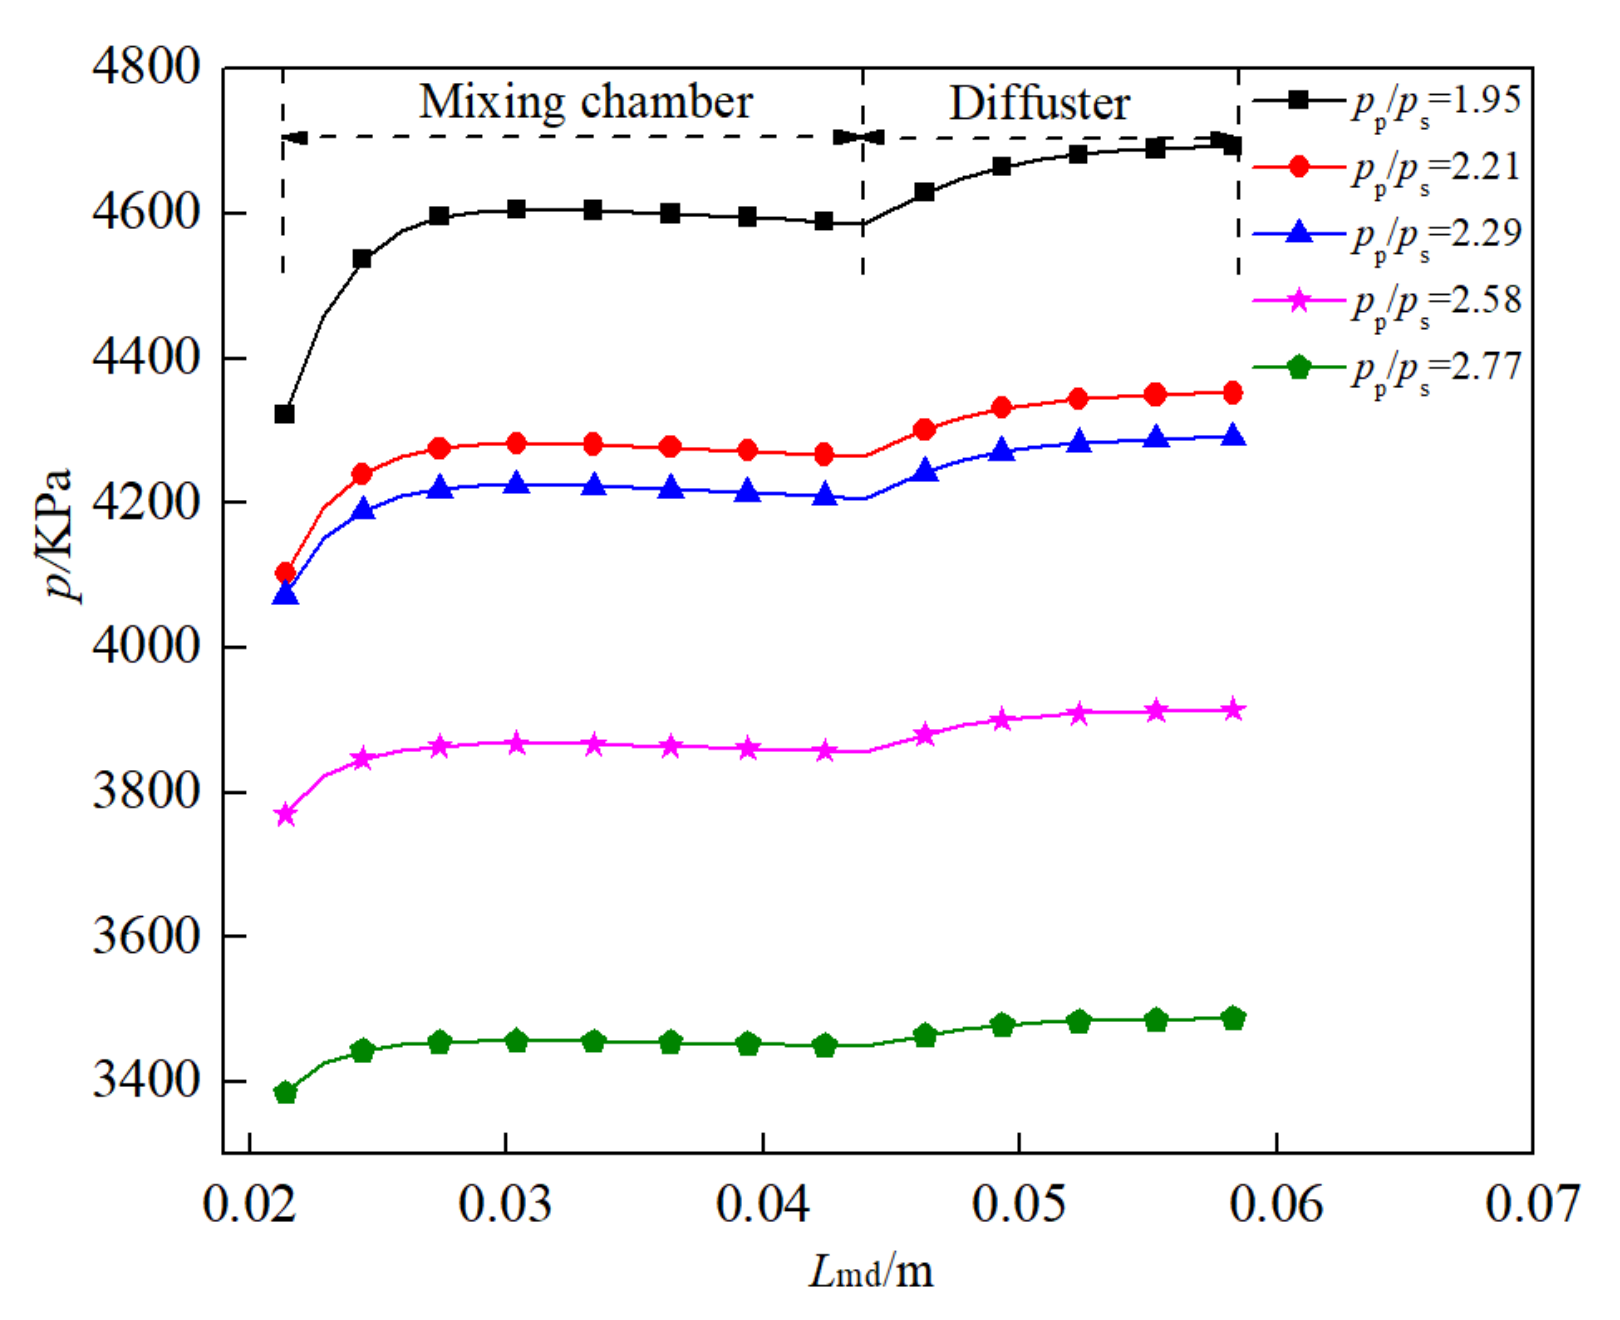
Figure 7 shows the pressure distribution along the mixing chamber and diffuser under different expansion ratios pp/ps. At the initial stage of the mixing chamber, the fluid pressure increases rapidly, and at the five expansion ratios, the pressure increase at the initial stage of the mixing chamber (the first 15% of the total length of the mixing chamber) accounts for 73.7%, 69.3%, 67.2%, 65.1%, and 63.9% of the total pressure increase, respectively. With the increase in expansion ratio, the proportion of pressure lift in the initial stage of the mixing chamber decreases gradually. In the diffuser, the pressure increase is more obvious at a smaller expansion ratio. It can be seen that the pressure lift at the initials stage of the mixing chamber is obvious, but in the final one it decreases in the case of a large expansion ratio. This is reasonable because the velocity difference between the two streams increases with the decline of expansion ratio, as shown Figure 6. When the fluid enters the mixing chamber, the flow cross-sectional area decreases, and more kinetic energy is transformed to pressure energy for a smaller expansion ratio. Thus, the smaller expansion ratio is helpful for increasing mixing pressure.
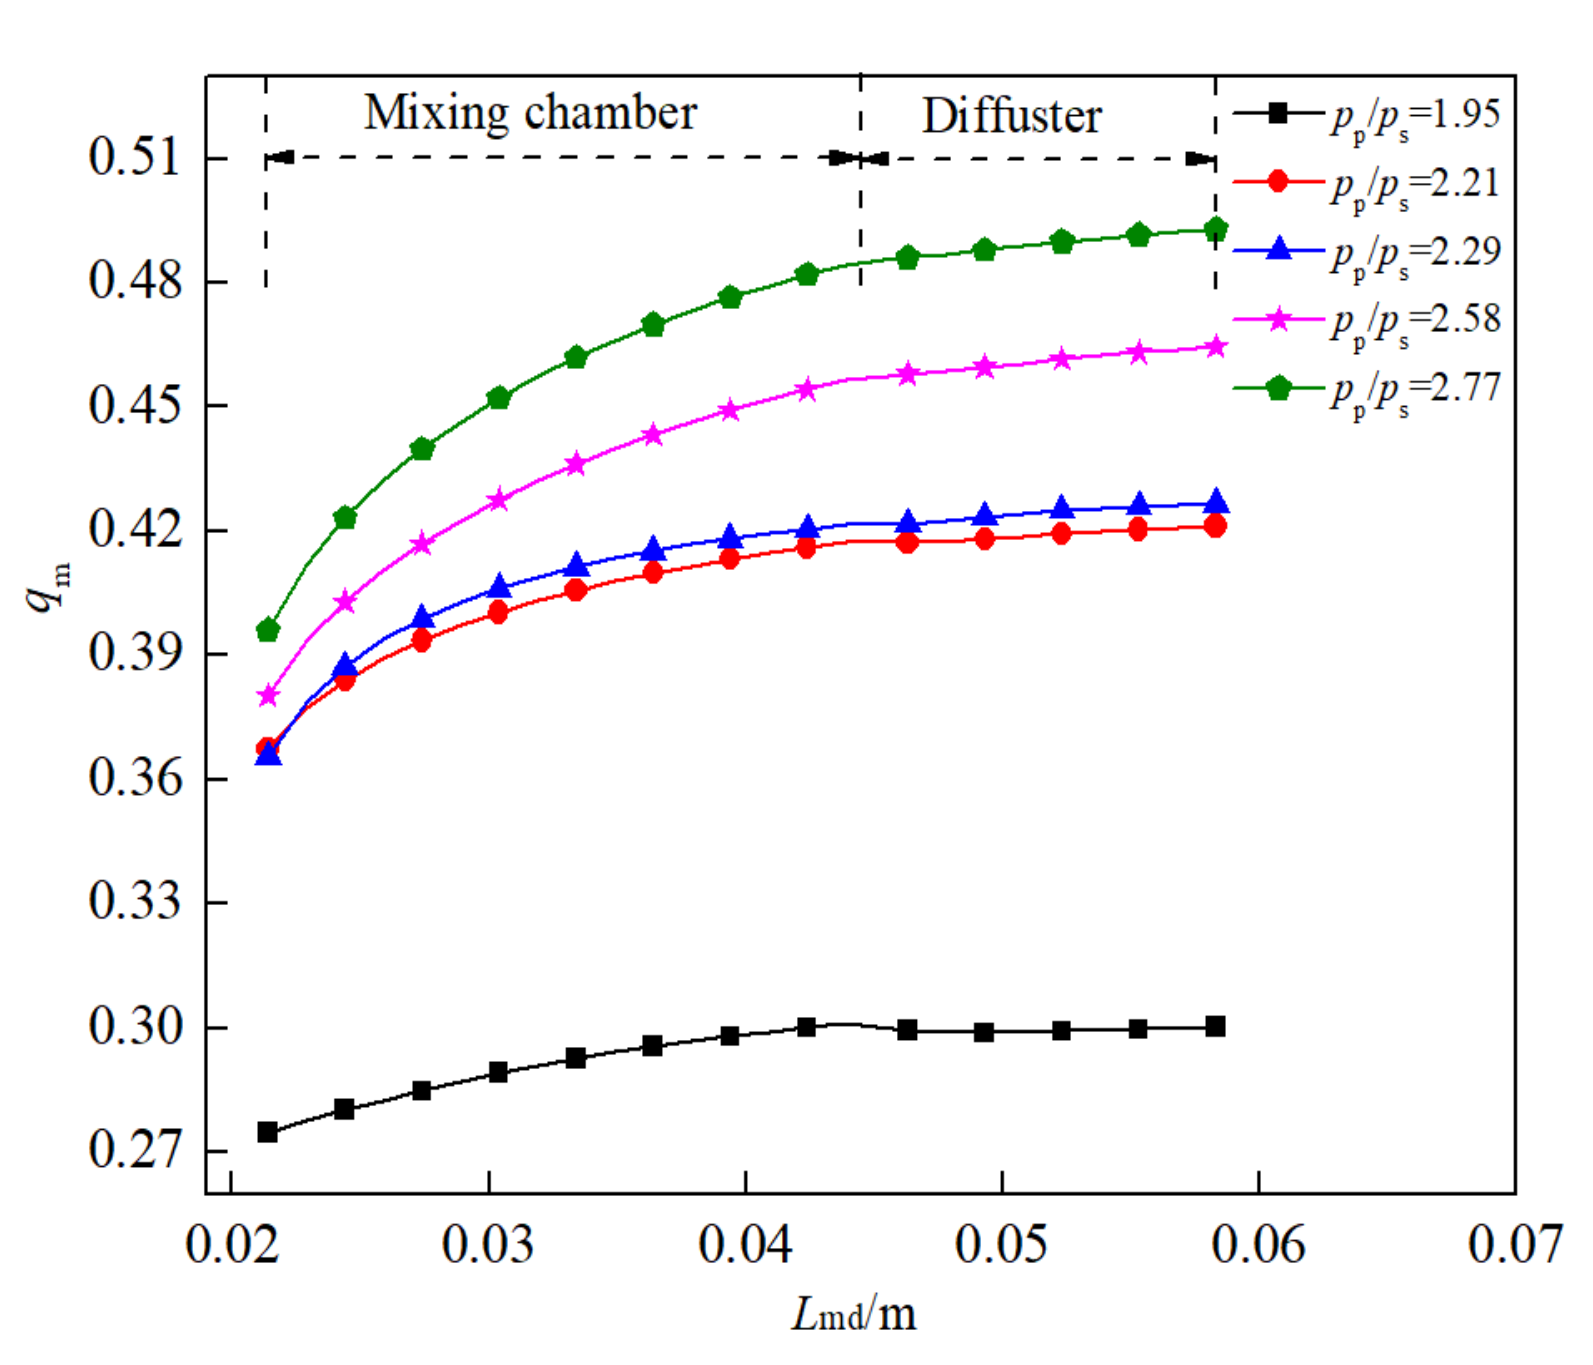
Figure 8 shows the distribution of the gas-phase mass fraction of the primary flow qm along the path of the mixing chamber and diffuser under different expansion ratios pp/ps. The gas-phase mass fraction qm increases gradually along the path of the mixing chamber and diffuser, and the largest increase is in the mixing chamber. This is because when just entering the mixing chamber, the temperature difference between the primary flow and the secondary flow is large, which accelerates energy transfer. The primary flow temperature increases, and leads to an increase in gas-phase mass fraction of primary flow qm. After entering the diffuser, the temperature difference between the two streams is relatively small, and the increase range of qm decreases. In addition, a larger expansion ratio of pp/ps leads to a larger increase in qm. The foremost reason for this is that the large temperature difference between the two streams under a large expansion ratio makes energy exchange more intense and leads to a larger increase in qm.
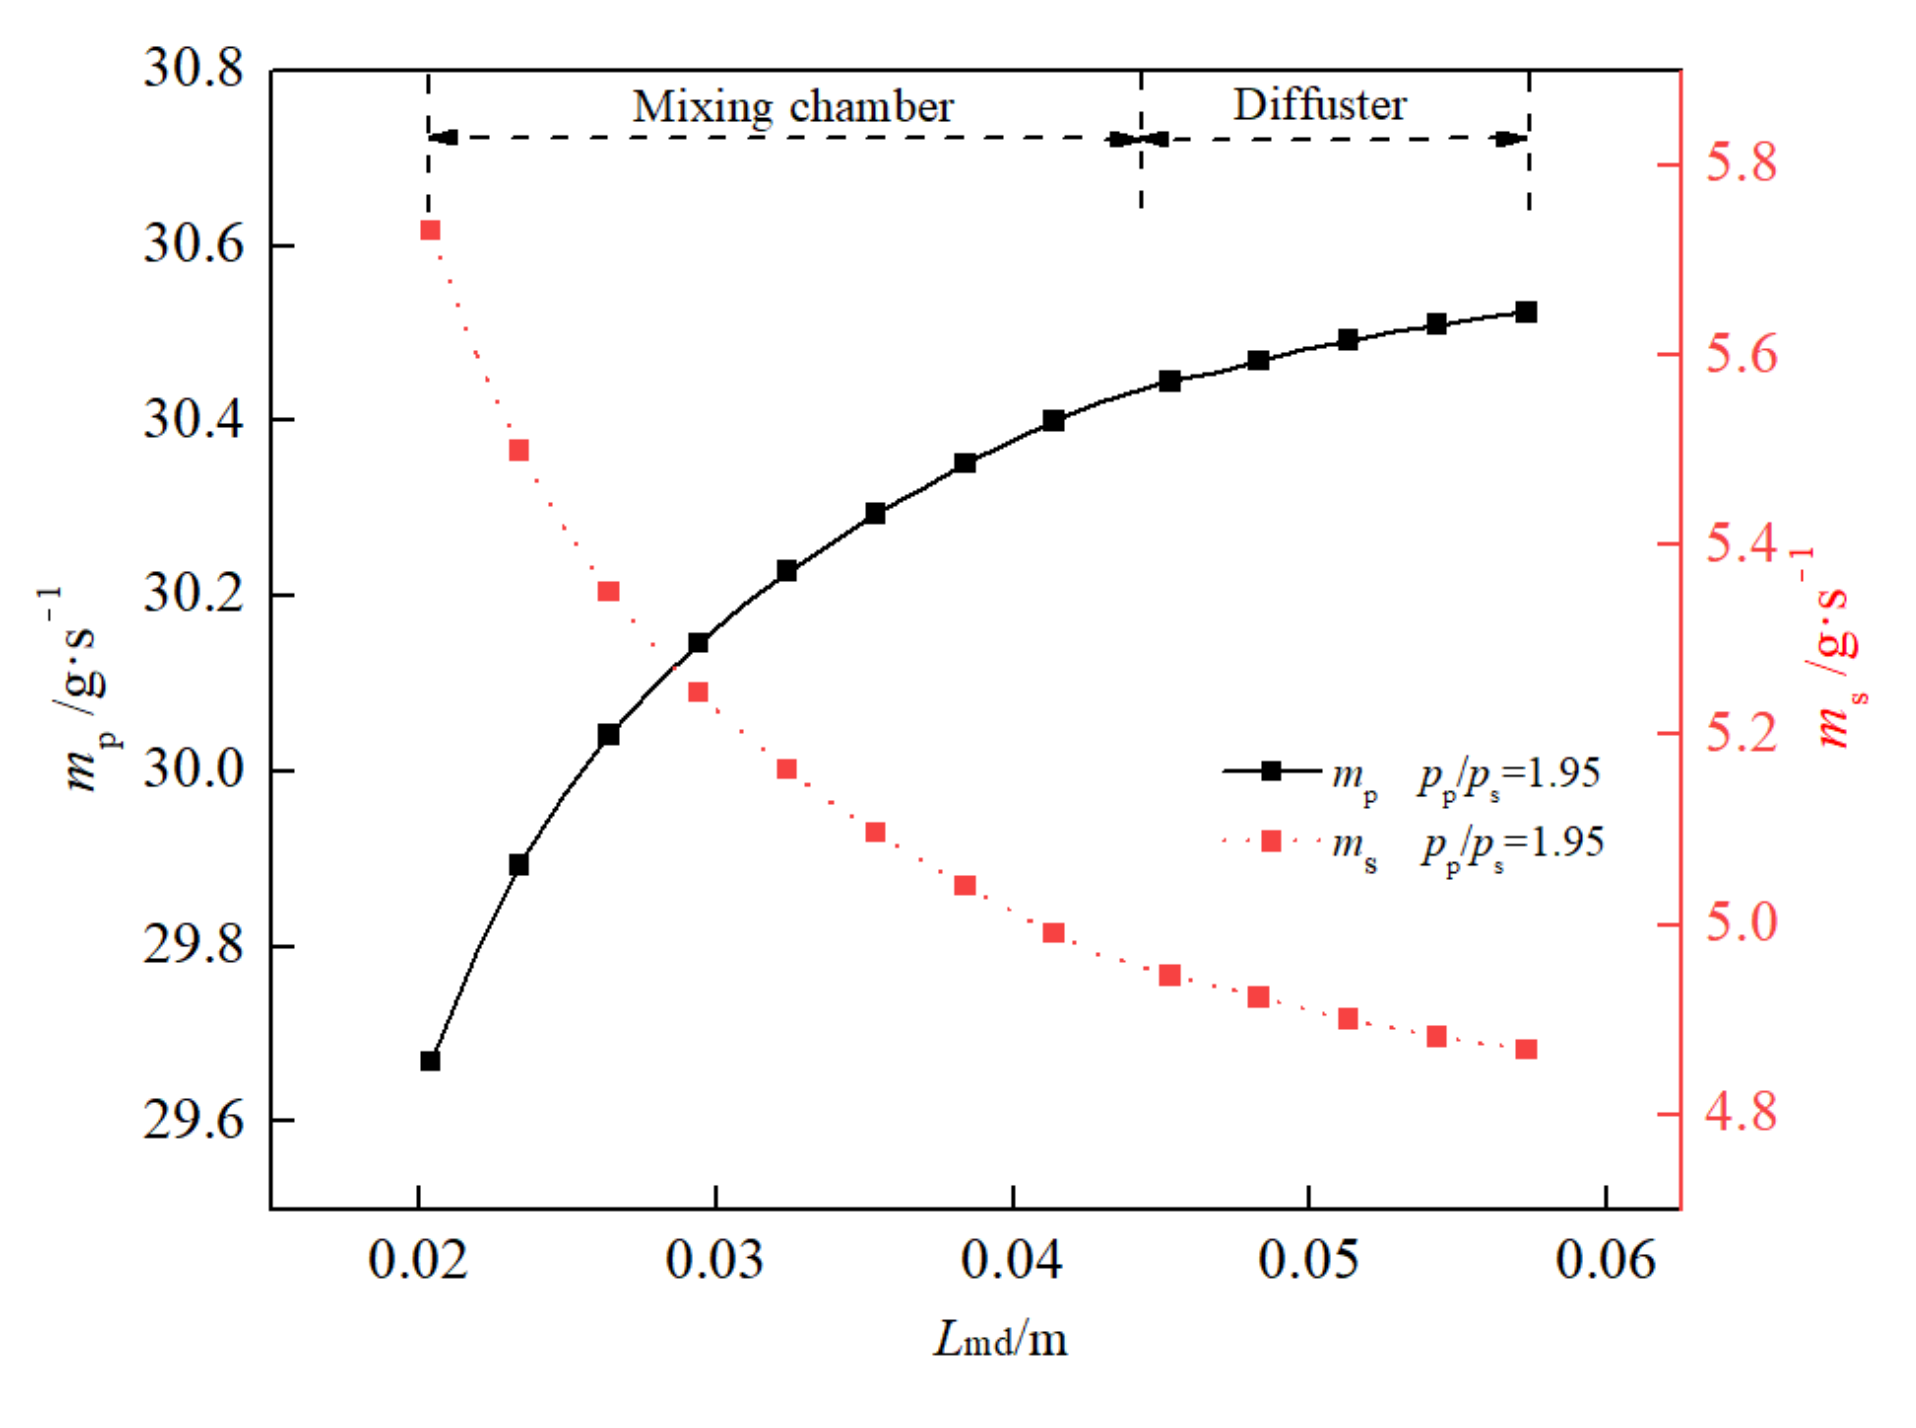
Figure 9 shows the mass distribution of the two streams in the mixing chamber and diffuser when the expansion ratio pp/ps = 1.95. The mass flow rate of primary flow mp gradually increases, while the mass flow rate of the secondary flow ms decreases. Combined with Figure 5, it can be seen that in the mixing chamber and diffuser, the temperature of the secondary flow is always higher than that of the primary flow, resulting in the condensation of the secondary flow. At the same time, it can be seen from Figure 6, in the mixing process of the two streams, that the primary flow velocity is faster than that of the secondary flow, and the primary flow would entrain the secondary flow. This mass transfer is caused by condensation and entrainment between the two fluids that leads to an increase in the mass flow rate of primary flow mp and the decrease in the mass flow rate of secondary flow m ˙ s .

4.2. Optimization of Mixing Chamber Length

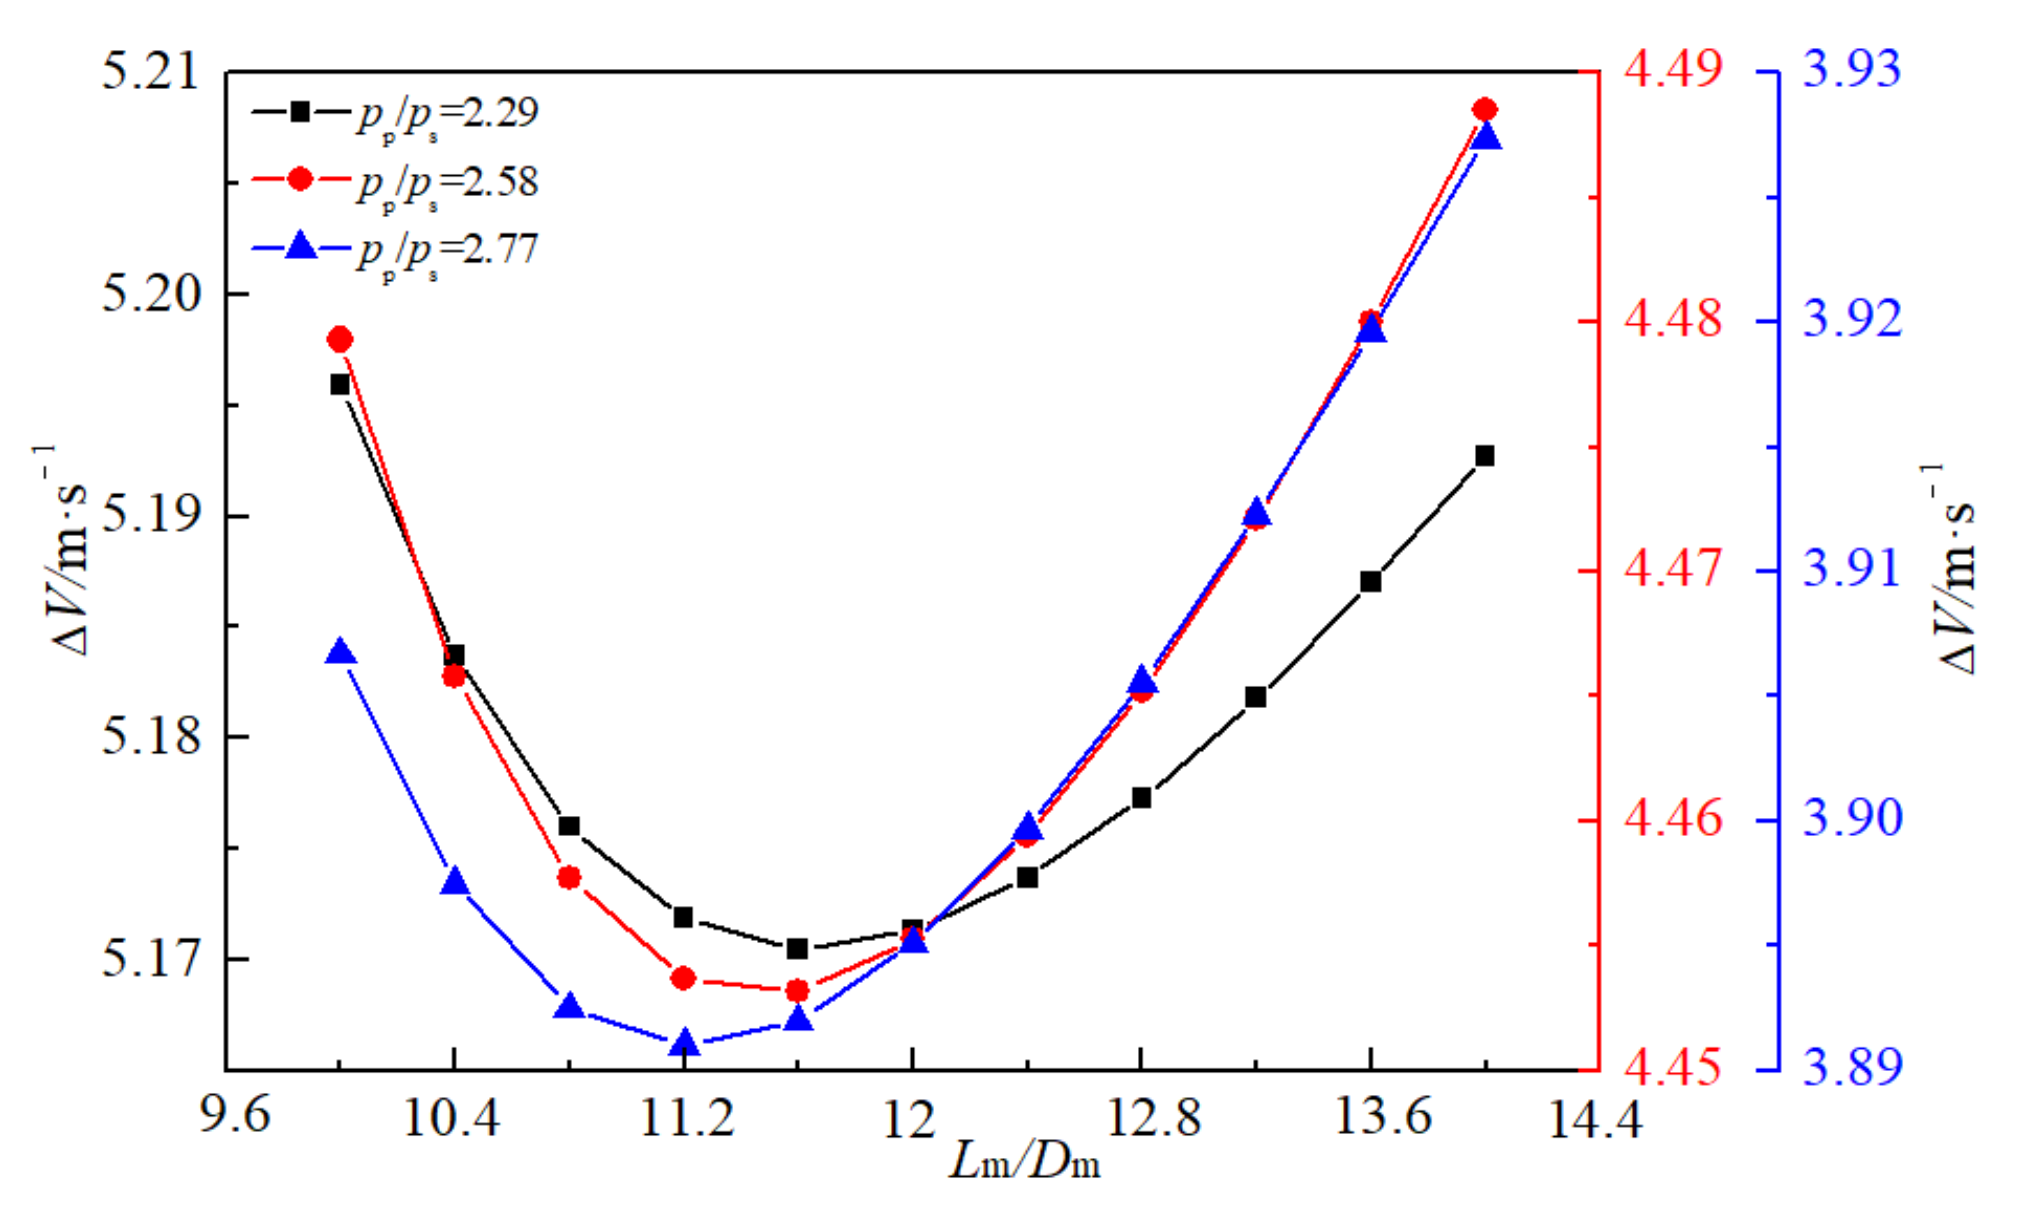
According to the above analysis, an optimization method of mixing chamber length is now investigated. We keep the diameter of the mixing chamber and other operating parameters unchanged as per experimental tests in [26,30]. The length of mixing chamber Lm is calculated under different expansion ratio pp/ps. Figure 10 shows the relationship between the velocity difference of two fluids at the mixing chamber exit and the length–diameter ratio of the mixing chamber Lm/Dm. It can be seen from Figure 10 that when the ejector expansion ratio remains unchanged, the velocity difference ∆V decreases first and then increases with the increase in the length–diameter ratio of the mixing chamber Lm/Dm. When the velocity difference between the two streams is the smallest, the two fluids are mixed more fully at this time, and the corresponding mixing chamber length is considered to be the optimal value. In the calculation range, when Lm/Dm is about 10.8–12, the exit velocity difference of the ejector mixing chamber is the smallest, and the mixing uniformity is better. Ref. [34] has recommended the Lm/Dm to be 5–10 from the perspective of ejector efficiency. Ref. [35] found the maximum value of entrainment ratio when Lm/Dm was near to 6.1. There are differences between the literature values and the present results, and this is mainly because of the diversity of working conditions and optimization objectives. In this present range, it is more favorable to mix with uniformity.

4.3. Optimization of Diffuser Angle

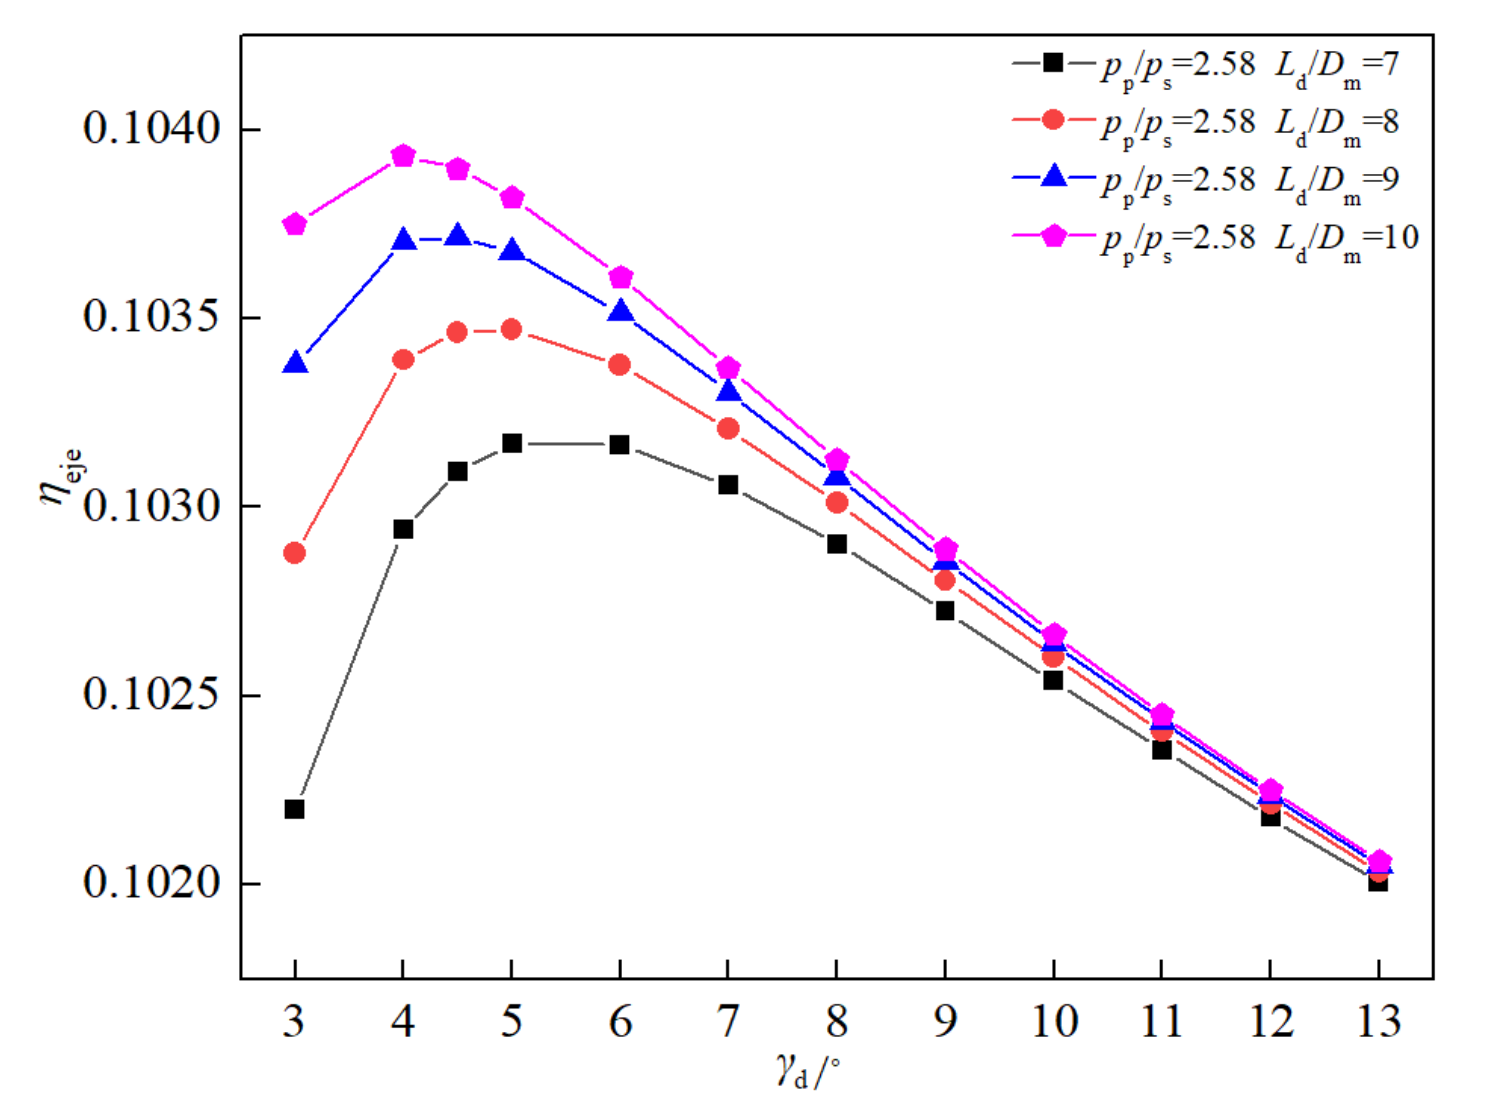
The diffuser is the last portion of the ejector, and the semi-cone angle and length of the diffuser have an important influence on the pressure lift of the ejector. A too-large or too-small semi-cone angle and inappropriate length of the diffuser would be counterproductive to improving the performance of the ejector. Therefore, the overall performance index of ejector efficiency ηeje is used to guide the optimization of the diffuser semi-cone angle γd, as shown in Figure 1. Figure 11 and Figure 12 show the influence of the diffuser expansion angle γd on the ejector efficiency ηeje at different expansion ratios pp/ps, respectively. It can be seen from Figure 11 that with an increase in semi-cone angle γd, the efficiency ηeje increases first and then decreases, but the overall change is not obvious, and the ejector efficiency difference is small under different expansion ratios. Figure 12 shows that when the expansion ratio is constant, the ejector efficiency ηeje increases gradually with the increase in Ld/Dm, but the increase rate is small. For the ejector, the higher the ejector efficiency, the better the thermal performance, and its corresponding semi-cone angle is the best expansion angle. As can be seen from Figure 11 and Figure 12, within the range of calculation, the optimal expansion angle ranges from 4–6°. Ref. [36] pointed out that there was an optimal range of diffuser divergence angle, and the best performances were recorded with an included angle of 5°. Ref. [34] also indicated the optimum diffuser divergence angle was between 3° and 5°. If the expansion angle is too large, an eddy in the boundary layer will be formed, and the static pressure recovery characteristics of the diffuser will be reduced. It is recommended that the semi-cone angle of the best performance of the diffuser is 5°, which is basically consistent with the conclusion of the present model in this paper.

5. Conclusions

In this paper, a global mathematics model of a CO2 ejector is established, where the suction chamber is modeled with the characteristic line method to describe the development process of a supersonic expansion wave, and the mixing chamber and diffusion model are developed using the double fluid model and distributed parameter method. The parameter distribution along the axis of the ejector including pressure, temperature, Mach number, mass fraction, and mass flow rate are presented. In addition, the length of the mixing chamber and the semi-cone angle of the diffuser are optimized based on the above distribution law. The most important findings of this investigation are summarized as follows:
(1)
The suction chamber model established by the characteristic line method is embedded into the global mathematical model of the CO2 ejector. The expansion wave development in the suction chamber is considered, and its influence on the subsequent mixing process can be obtained. Compared with the experimental values presented in the literature [30], the average deviation of the entrainment ratio µ and the ejector outlet pressure pc calculated by the present model are 4.93% and 1.55%, respectively.
(2)
In the mix chamber and diffuser, the temperature of the primary flow increases gradually along the path, while the Mach number and velocity decrease gradually, while the secondary flow shows an opposite trend. For the small expansion ratios, the temperature of the primary flow rises rapidly with the initial stage of mixing, while the large expansion ratio makes the secondary flow temperature decrease significantly in the mixing process. In the diffuser, the Mach number of the primary flow decreases more obviously than that of the secondary flow. The mass of the secondary flow is continuously transferred to the primary flow, and the gas-phase mass fraction of the primary flow increases gradually due to the transfer of energy and the rise of temperature.
(3)
The velocity difference between the two streams in the mixing chamber is proposed as the optimized parameter. It is found that the mixing uniformity is better when the length–diameter ratio of the mixing chamber is 10.8–12, and the ejector has a better ejector efficiency when the semi-cone angle of the diffuser is 4–6°.
Although the suction chamber model is established using the characteristic line method, it is based on the gas dynamic function and does not consider real gas physical properties. Additional research efforts on model optimization will be performed to improve prediction accuracy and extend the application range.

Author Contributions

Conceptualization, L.Z. and H.H.; methodology, L.Z., H.H. and W.W.; software, L.Z., H.H. and W.W.; validation, L.Z., H.H. and W.W.; formal analysis, H.H. and W.W.; investigation, H.H., W.W. and Y.Z.; resources, L.Z. and L.W.; data curation, L.Z., H.H. and W.W.; writing—original draft preparation, L.Z., H.H. and Y.Z.; writing—review and editing, H.H. and Y.Z.; visualization, H.H. and L.W.; supervision, L.Z. and L.W.; project administration, L.Z.; funding acquisition, L.Z. and L.W. All authors have read and agreed to the published version of the manuscript.

Funding

This research was funded by The National Natural Science Foundation of China, grant number 51806132 and Scientific and Technological Innovation of colleges and universities of Shanxi Province, grant number 201802011.

Data Availability Statement

The data presented in this study are available upon reasonable request from the corresponding author.

Conflicts of Interest

The authors declare no conflict of interest.

References

  1. Ramesh, A.S.; Sekhar, S.J. Experimental and numerical investigations on the effect of suction chamber angle and nozzle exit position of a steam-jet ejector. Energy 2018, 164, 1097–1113. [Google Scholar] [CrossRef]
  2. Bodys, J.; Smolka, J.; Palacz, M. Experimental and numerical study on the R744 ejector with a suction nozzle bypass. Appl. Therm. Eng. 2021, 194, 117015. [Google Scholar] [CrossRef]
  3. Besagni, G.; Mereu, R.; Inzoli, F. Ejector refrigeration: A comprehensive review. Renew. Sustain. Energy Rev. 2016, 53, 373–407. [Google Scholar] [CrossRef] [Green Version]
  4. Ker, A.; Ya, A.; Pg, B. A detailed review on CO2 two-phase ejector flow modeling. Therm. Sci. Eng. Prog. 2020, 20, 100647. [Google Scholar] [CrossRef]
  5. Palacz, M.; Smolka, J.; Fic, A.; Bulinski, Z.; Nowak, A.J.; Banasiak, K.; Hafner, A. Application range of the HEM approach for CO2 expansion inside two-phase ejectors for supermarket refrigeration systems. Int. J. Refrig. 2015, 59, 251–258. [Google Scholar] [CrossRef]
  6. Haida, M.; Smolka, J.; Hafner, A.; Ostrowski, Z.; Palacz, M.; Madsen, K.B.; Försterling, S.; Nowak, A.J.; Banasiak, K. Performance mapping of the R744 ejectors for refrigeration and air conditioning supermarket application: A hybrid reduced-order model. Energy 2018, 153, 933–948. [Google Scholar] [CrossRef]
  7. Haida, M.; Smolka, J.; Hafner, A.; Palacz, M.; Banasiak, K.; Nowak, A.J. Modified homogeneous relaxation model for the R744 trans-critical flow in a two-phase ejector. Int. J. Refrig. 2018, 85, 314–333. [Google Scholar] [CrossRef]
  8. Nakagawa, M.; Berana, M.S.; Harada, A. Shock waves in supersonic two-phase flow of CO2 in converging-diverging nozzles. HVACR Res. 2009, 15, 1081–1098. [Google Scholar] [CrossRef] [Green Version]
  9. Fardi, M.; Pishkar, I.; Alidousti, J.; Khan, Y. Numerical investigation of the MHD suction–injection model of viscous fluid using a kernel-based method. Arch. Appl. Mech. 2021, 91, 4205–4221. [Google Scholar] [CrossRef]
  10. Li, Y.F.; Deng, J.Q.; Ma, L. Experimental study on the primary flow expansion characteristics in transcritical CO2 two-phase ejectors with different primary nozzle diverging angles. Energy 2019, 186, 115839. [Google Scholar] [CrossRef]
  11. Banasiak, K.; Hafner, A. 1D Computational model of a two-phase R744 ejector for expansion work recovery. Int. J. Therm. Sci. 2011, 50, 2235–2247. [Google Scholar] [CrossRef]
  12. Chen, Z.Z.; Dang, C.; Hihara, E. Investigations on driving flow expansion characteristics inside ejectors. Int. J. Heat Mass Transf. 2017, 108, 490–500. [Google Scholar] [CrossRef]
  13. Yan, J.; Li, S.; Liu, Z. Numerical investigation on optimization of ejector primary nozzle geometries with fixed/varied NXP. Appl. Therm. Eng. 2020, 175, 115426. [Google Scholar] [CrossRef]
  14. Barta, R.B.; Dhillon, P.; Braun, J.E. Design and optimization strategy for ejectors applied in refrigeration cycles. Appl. Therm. Eng. 2021, 189, 116682. [Google Scholar] [CrossRef]
  15. Elbel, S.; Hrnjak, P. Experimental validation of a prototype ejector designed to reduce throttling losses encountered in transcritical R744 system operation. Int. J. Refrig. 2008, 31, 411–422. [Google Scholar] [CrossRef]
  16. Chong, D.T.; Yan, J.J.; Wu, G.S. Structural optimization and experimental investigation of supersonic ejectors for boosting low pressure natural gas. Appl. Therm. Eng. 2009, 29, 2799–2807. [Google Scholar] [CrossRef]
  17. Wen, H.; Yan, J. Effect of mixing chamber length on ejector performance with fixed/varied area ratio under three operating conditions in refrigerated trucks. Appl. Therm. Eng. 2021, 197, 117379. [Google Scholar] [CrossRef]
  18. Yan, J.; Cai, W.; Li, Y. Geometry parameters effect for air-cooled ejector cooling systems with R134a refrigerant. Renew. Energy 2012, 46, 155–163. [Google Scholar] [CrossRef]
  19. Wu, H.Q.; Liu, Z.L.; Han, B. Numerical investigation of the influences of mixing chamber geometries on steam ejector performance. Desalination 2014, 353, 15–20. [Google Scholar] [CrossRef]
  20. Yan, J.; Wen, N.; Wang, L.; Li, X.; Liu, Z.; Li, S. Optimization on ejector key geometries of a two-stage ejector-based multi-evaporator refrigeration system. Energy Convers. Manag. 2018, 175, 142–150. [Google Scholar] [CrossRef]
  21. Li, C.; Li, Y.; Lei, W. Configuration dependence and optimization of the entrainment performance for gas–gas and gas–liquid ejectors. Appl. Therm. Eng. 2012, 48, 237–248. [Google Scholar] [CrossRef]
  22. Li, C.; Li, Y.Z. Investigation of entrainment behavior and characteristics of gas–liquid ejectors based on CFD simulation. Chem. Eng. Sci. 2011, 66, 405–416. [Google Scholar] [CrossRef]
  23. Kandakure, M.T.; Gaikar, V.G.; Patwardhan, A.W. Hydrodynamic aspects of ejectors. Chem. Eng. Sci. 2005, 60, 6391–6402. [Google Scholar] [CrossRef]
  24. Balamurugan, S.; Gaikar, V.G.; Patwardhan, A.W. Effect of ejector configuration on hydrodynamic characteristics of gasliquid ejectors. Chem. Eng. Sci. 2008, 63, 721–731. [Google Scholar] [CrossRef]
  25. Metin, C.; Gök, O.; Atmaca, A.U.; Erek, A. Numerical investigation of the flow structures inside mixing section of the ejector. Energy 2019, 166, 1216–1228. [Google Scholar] [CrossRef]
  26. Zheng, L.X. Simulation and Experimental Study on Dynamic Characteristics of Transcritical CO2 Ejector Refrigeration System. Ph.D. Thesis, Xi’an Jiaotong University, Xi’an, China, 2018. [Google Scholar]
  27. NIST. Reference Fluid Thermodynamic and Transport Properties Database (REFPROP); Version 9.0; U.S. Department of Commerce: Gaithersburg, MD, USA, 2002. [Google Scholar]
  28. Liu, F.; Groll, E.A. Study of ejector efficiencies in refrigeration cycles. Appl. Therm. Eng. 2013, 52, 360–370. [Google Scholar] [CrossRef]
  29. Liepmann, H.W.; Roshko, A. Elements of Gasdynamics, 1st ed.; John Wiley & Sons: New York, NY, USA, 1957; pp. 98–100. [Google Scholar]
  30. Zheng, L.X.; Deng, J.Q. Research on CO2 ejector component efficiencies by experiment measurement and distributed-parameter modeling. Energy Convers. Manag. 2017, 142, 244–256. [Google Scholar] [CrossRef]
  31. Churchill, S.W. Friction factor equation spans all fluid flow regimes. Chem. Eng. 1977, 84, 91–92. [Google Scholar]
  32. Hwang, Y. Comprehensive Investigation of a Carbon Dioxide Refrigeration Cycle. Ph.D. Thesis, University of Maryland, College Park, MA, USA, 1997. [Google Scholar]
  33. Faraz, N.; Khan, Y.; Anjum, A.; Kahshan, M. Three-Dimensional Hydro-Magnetic Flow Arising in a Long Porous Slider and a Circular Porous Slider with Velocity Slip. Mathematics 2019, 7, 748. [Google Scholar] [CrossRef] [Green Version]
  34. Banasiak, K.; Hafner, A.; Andresen, T. Experimental and numerical investigation of the influence of the two-phase ejector geometry on the performance of the R744 heat pump. Int. J. Refrig. 2012, 35, 1617–1625. [Google Scholar] [CrossRef]
  35. Li, Y.; Deng, J. Numerical investigation on the performance of transcritical CO2 two-phase ejector with a novel non-equilibrium CFD model. Energy 2022, 238, 121995. [Google Scholar] [CrossRef]
  36. Elbel, S. Historical and present developments of ejector refrigeration systems with emphasis on transcritical carbon dioxide air-conditioning applications. Int. J. Refrig. 2011, 34, 1545–1561. [Google Scholar] [CrossRef]
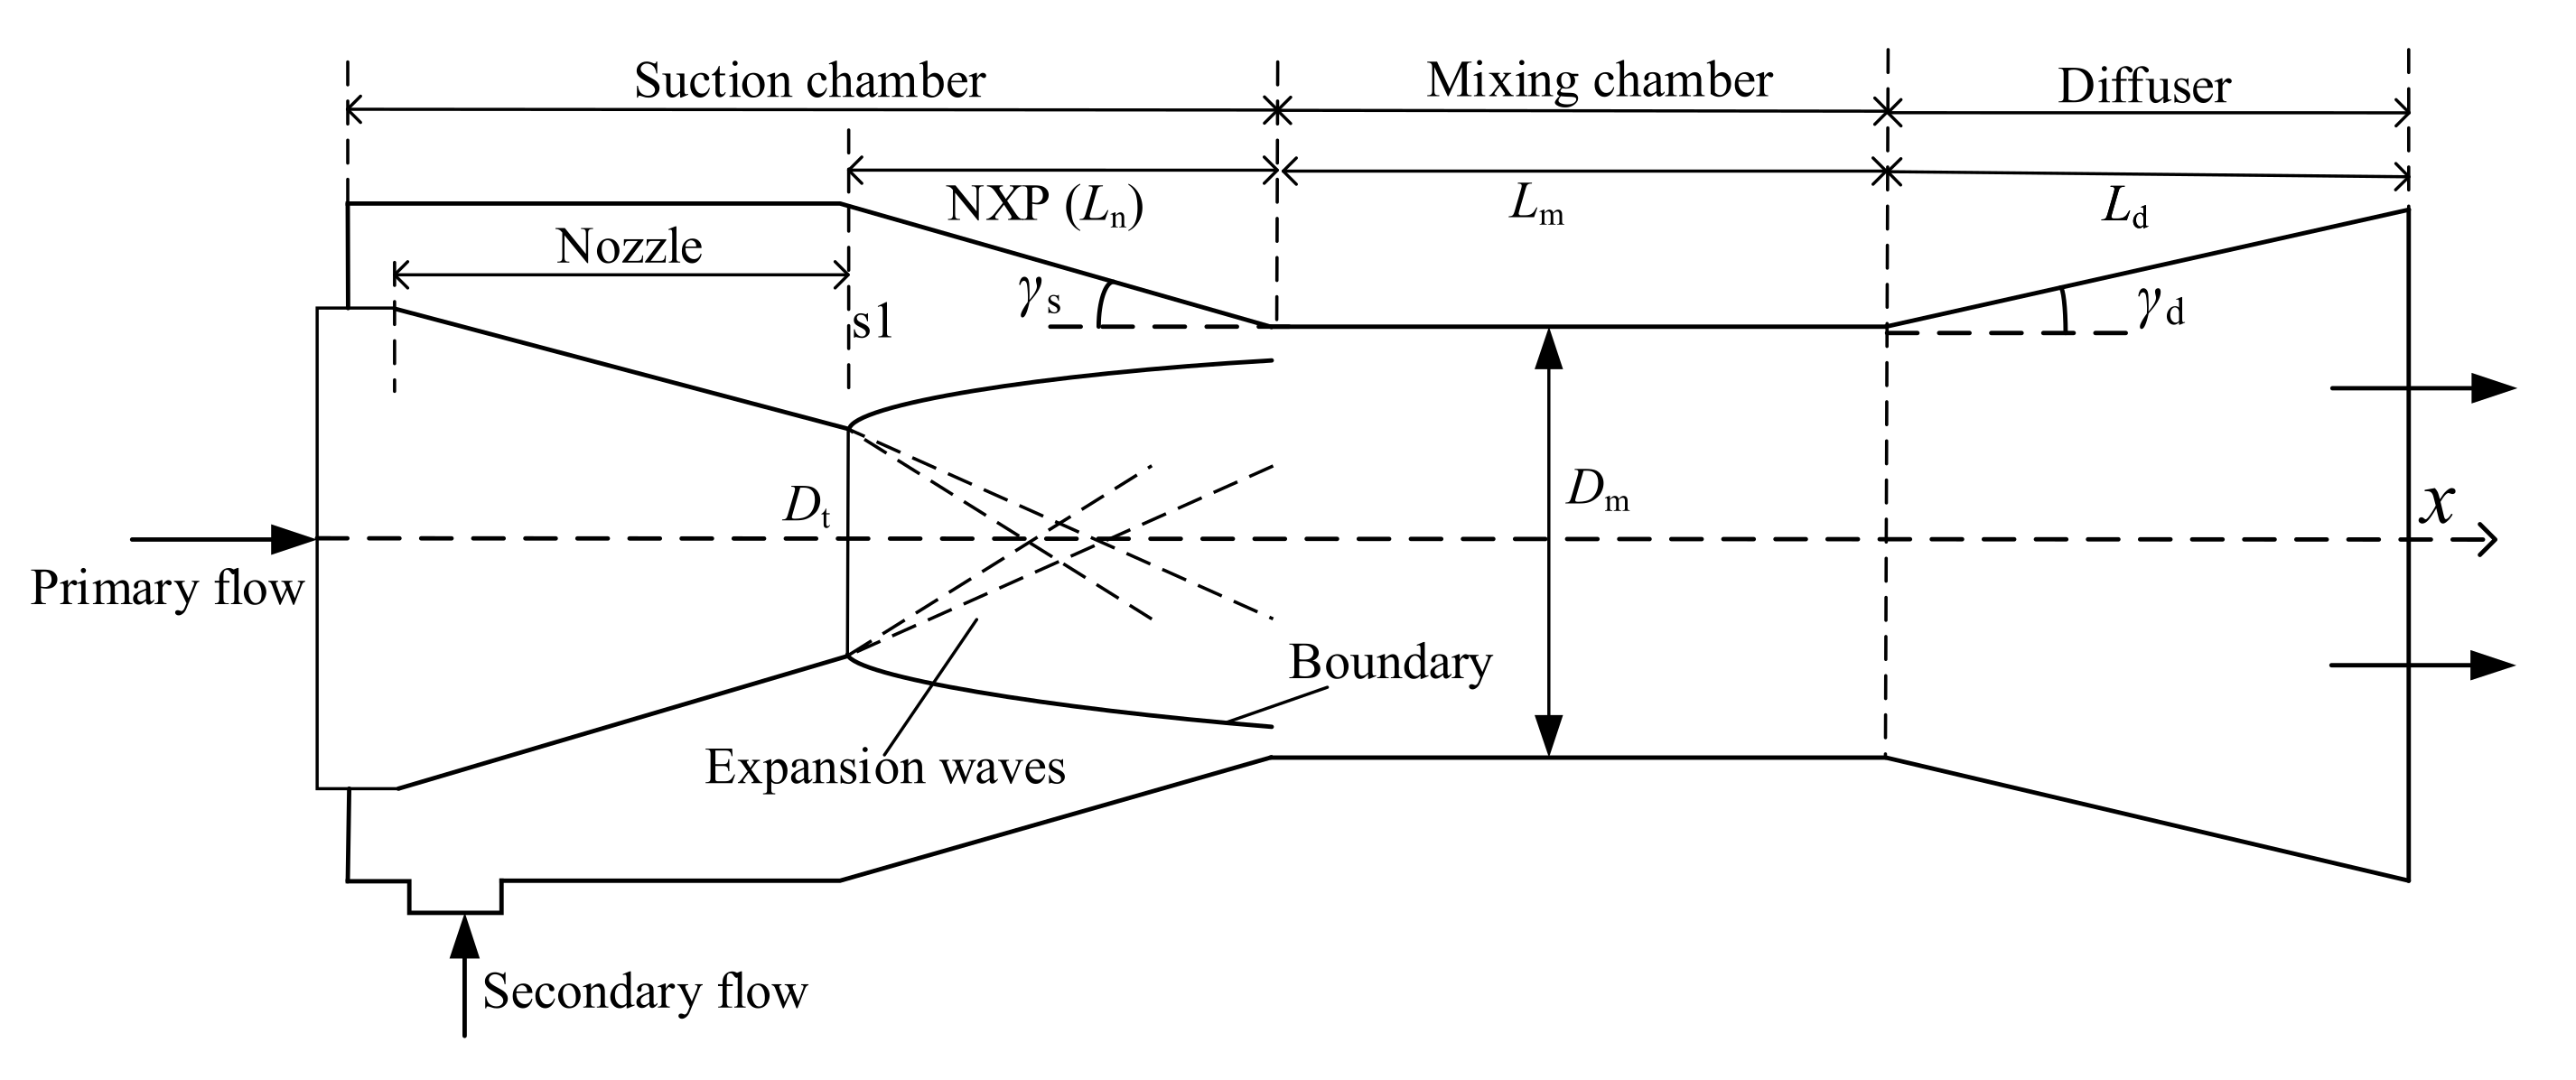
Figure 1. Schematic diagram of ejector structure.
Mathematics 10 00693 g001
Figure 2. Grid of characteristic lines at the motive nozzle outlet of the primary flow.
Mathematics 10 00693 g002
Figure 3. Comparison between calculated and experimental entrainment ratio µ.
Mathematics 10 00693 g003
Figure 4. Comparison between calculated and experimental pressure pc.
Mathematics 10 00693 g004
Figure 5. Temperature distribution along the path of the mixing chamber and diffuser.
Mathematics 10 00693 g005
Figure 6. Mach number distribution along the mixing chamber and diffuser.
Mathematics 10 00693 g006
Figure 7. Pressure distribution along the path of the mixing chamber and diffuser.
Mathematics 10 00693 g007
Figure 8. The gas-phase mass fraction distribution in the mixing chamber and diffuser.
Mathematics 10 00693 g008
Figure 9. Fluid mass distributions along the mixing diffuser chamber.
Mathematics 10 00693 g009
Figure 10. Influence of length–diameter ratio Lm/Dm on velocity difference of two fluids at the outlet of mixing chamber.
Mathematics 10 00693 g010
Figure 11. Effect of diffuser expansion angle γd on ejector efficiency ηeje under different expansion ratio pp/ps.
Mathematics 10 00693 g011
Figure 12. Effect of diffuser expansion angle γd on ejector efficiency ηeje under different Ld/Dm.
Mathematics 10 00693 g012
Publisher’s Note: MDPI stays neutral with regard to jurisdictional claims in published maps and institutional affiliations.