Abstract
In this study, a multiscale monitoring method for nonlinear processes was developed. We introduced a machine learning tool for fault detection and isolation based on the kernel principal component analysis (PCA) and discrete wavelet transform. The principle of our proposal involved decomposing multivariate data into wavelet coefficients by employing the discrete wavelet transform. Then, the kernel PCA was applied on every matrix of coefficients to detect defects. Only those scales that manifest overruns of the squared prediction errors in control limits were considered in the data reconstruction phase. Thus, the kernel PCA was approached on the reconstructed matrix for detecting defects and isolation. This approach exploits the kernel PCA performance for nonlinear process monitoring in combination with multiscale analysis when processing time-frequency scales. The proposed method was validated on a photovoltaic system related to a complex industrial process. A data matrix was determined from the variables that characterize this process corresponding to motor current, angular speed, convertor output voltage, and power voltage system output. We tested the developed methodology on 1000 observations of photovoltaic variables. A comparison with monitoring methods based on neural PCA was established, proving the efficiency of the developed methodology.
Keywords:
artificial intelligence; discrete wavelet transform; fault detection and isolation; kernel method; principal component analysis MSC:
68T05; 62H25; 30C40; 65T60
1. Introduction and Bibliographical Review
Machine learning and artificial intelligence algorithms, as well as big data tools, have taken a prominent place in the determination of strategies and management of companies that have understood their relevance [1,2,3,4,5,6,7,8]; particularly, a study on machine learning methods for automatic defects detection was conducted in [1]. Some manufacturers have seized the opportunity offered by these predictive algorithms to establish their leadership in the market. Machine learning and statistical learning refer to a set of learning algorithms, supervised or not, and/or by reinforcement, obtained from historical data, allowing the solution of a problem. Also, these algorithms permit us to interpret data without explicit or deterministic programming and to manage a strategy making operational decisions. Modern production systems are gradually incorporating machine learning predictive algorithms into all stages of the manufacturing process.
The most common industrial applications of machine learning are anomaly detection, inventory management, optimization of electricity consumption in production, and predictive maintenance. Our study comes in the context of predictive maintenance related to fault detection and isolation (FDI) by introducing machine learning methods. In the literature, several works have addressed this issue. An investigation on automated FDI based on deep learning was developed in [9]. The investigation was validated on data generated by computerized manufacturing systems equipped with local and remote sensing devices. Another vision of machine learning was presented by introducing a statistical tool for the analysis of multidimensional processes in [10]. This tool is the principal component analysis (PCA), which makes it possible to reduce the data dimension of a process and subsequently to facilitate the analysis of the disturbances occurring on the system. Several types of PCA have arisen for application in varied FDI schemes as: (i) linear PCA [11], nonlinear PCA [12,13,14], multiblock PCA [15], multiscale PCA [16,17,18], dynamic PCA [19,20], and combinations of them [21]. With the complexity of such industrial processes, nonlinear PCA is utilized for detecting and isolating defects. Our review of the literature has established dual types of nonlinear PCA. The first relies on neural networks to compensate for data nonlinearity, while the second type is the kernel PCA [22,23,24,25,26].
Machine learning techniques are numerous in the literature [27,28], but we focus on FDI methods, which combine statistical analysis and wavelet networks. These methods provide considerable advantages to improve the performance of FDI. This occurs particularly in the treatment of complex system properties such as autocorrelation, stationarity, nonlinearity, and determinism. Consequently, they have been often used in several industrial applications.
A multiscale method based on the tracking of reconstructed signals after filtering wavelet coefficients has been presented in [29]. It consists in associating the major element analysis with wavelets. This method allows us to detect errors in each of the scales and then to reconstruct the signals by keeping the significant scales (where the detection took place). A comparative analysis was performed between different approaches [30], which are: dissimilarity measure [31], multi-scale PCA [32], and moving PCA [33]. Implemented on the Tennessee Eastman process, the work showed that the multiscale PCA is superior to conventional methods in some cases and equivalent to them in others. Another FDI approach was developed combining multidirectional PCA and wavelets to demonstrate the value of multiscale analysis by improving defect detection ladders from mono techniques [34]. The advantage of the time-scale analysis has been shown in [35,36,37] for detecting defects affecting gears. In addition, the interest of using wavelets to increase monitoring performance is shown in several works.
Summarizing, the combination of wavelets and machine learning techniques, commonly referred to as multiscale monitoring approaches, has contributed to the development of new FDI methods. This is especially valid for efficiently considering the characteristics of complex systems, such as defects at different scales of time and frequency.
In this context, the objective of the present investigation is to propose a new multiscale monitoring approach based on a discrete wavelet transform (DWT) and a machine learning technique corresponding to the kernel PCA. Our contribution aims at ensuring the detection of defects that cannot be detected by various FDI schemes, as presented in the literature. The selected and combined tools used for the designed FDI in this work promote efficient data analysis for complex industrial processes.
The rest of this paper is organized as follows. In Section 2, we describe the kernel PCA. Then, Section 3 provides the tools for multiscale monitoring using the kernel PCA. In Section 4, the experimental results are described employing a photovoltaic system for FDI and compared with other monitoring techniques as an industrial application. Finally, the conclusion, limitations, and future research are presented in Section 5.
2. Kernel Principal Component Analysis
2.1. Notations and Symbols
Table 1 shows the nomenclature and acronyms that are employed in this work.

Table 1.
Acronyms and notations used in the present work.
2.2. Principle
The kernel PCA introduces a nonlinear PCA approach for the input space [26]. If a PCA is utilized to decouple nonlinear correlations of a given data set namely, for , with their covariance matrix diagonalized, then the covariance may be expressed in terms of a linear feature space in place of such nonlinear input space. Thus, the covariance matrix can be formulated as
where and expresses a nonlinear mapping function that projects the input vectors from the input space into . Note that the dimension of this feature space can be possibly infinite or else arbitrarily large [26]. To diagonalize the covariance matrix, the eigen-value problem in this feature space needs to be solved as:
where are the eigen-values and are the corresponding eigen-vectors. Hence, along the largest is confirmed by the equation given in (2) and develops as the initial principal component in F, whereas along the smallest develops as the last principal component. Observe from (1) and (2) that:
with denoting the dot product between x and y. Such a representation implies that all solutions for lie in the range of ,…,, with as stated in (2). Observe that is equivalent to the expression given by:
Furthermore, there exist coefficients to be formulated by means of:
By combining (3), (4) and (5), we get:
for . Note that the eigen-value problem expressed in (6) relates to the dot products of certain mapped shape vectors found in the feature space. Generally, the mapping function might not be always computationally tractable, even though it does exist. Nevertheless, it does not need to be derived explicitly. Indeed, only the dot products of the two vectors involved in this feature space are required. Hence, to avoid eigen-decomposing of the covariance matrix directly, the kernel matrix may be defined with elements given by:
where is a kernel function. Observe from (7) that the left-hand side of (6) can be established as:
for Thus, from (6) and (8), we have that:
Therefore, we get that:
for Notice that the expressions given in (8) and (10) become and , respectively. Thus, by combining (8) and (10), we reach:
where . To determine solutions of the equation given in (9), we solve the eigen-values problem formulated in terms of the system defined as:
For non-zero eigen-values, a reasoning of this process is mentioned in [32]. Hence, by conducting a PCA in F, it is equivalent to solving the eigen-values problem given in (12), which yields the eigen-vectors , …, with the eigen-values The dimensionality of this problem may be reduced by retaining only the initial P eigen-vectors. We normalize , …, by using the corresponding vectors in F, that is, for , we obtain:
for with , so that the expression given in (13) becomes
Observe that the principal component of the test vector are then obtained by projecting onto eigen-vectors in F, where, for , we have that:
To solve the eigen-value problem given in (10), as well as projecting the input space towards the kernel PCA space by employing (13), performing the nonlinear mappings can be evaded. In addition, both dot products can be computed in the feature space by bringing a kernel function as [31,32].
Note that different kernel functions are available. For example, we have:
- [Polynomial kernel]
- [Sigmoid kernel]
- [Radial kernel]
2.3. Fault Detection and Control Limits
The squared prediction error (SPE) was introduced for fault detection and defined by:
A defect is detected on the observation if The calculation of the threshold can be done experimentally or by a theoretical method. This threshold may be calculated as:
where the values stated in (20) are defined as , , and , with being the jth eigen-value of the covariance matrix, and r ∈ {1,2}. The value corresponds to percentile of a chi-square distribution with degrees of freedom and a confidence threshold γ. For the experimental threshold, it can be calculated by taking a percentage of the SPE index applied to normal distributed data (it being 95% or 99%).
To ensure fault isolation, a method that was proposed in [21] and considers the calculated contributions of each of the variables was used in this work. Variables that accounted for high contributions were deemed defective.
2.4. Kernel PCA Algorithm
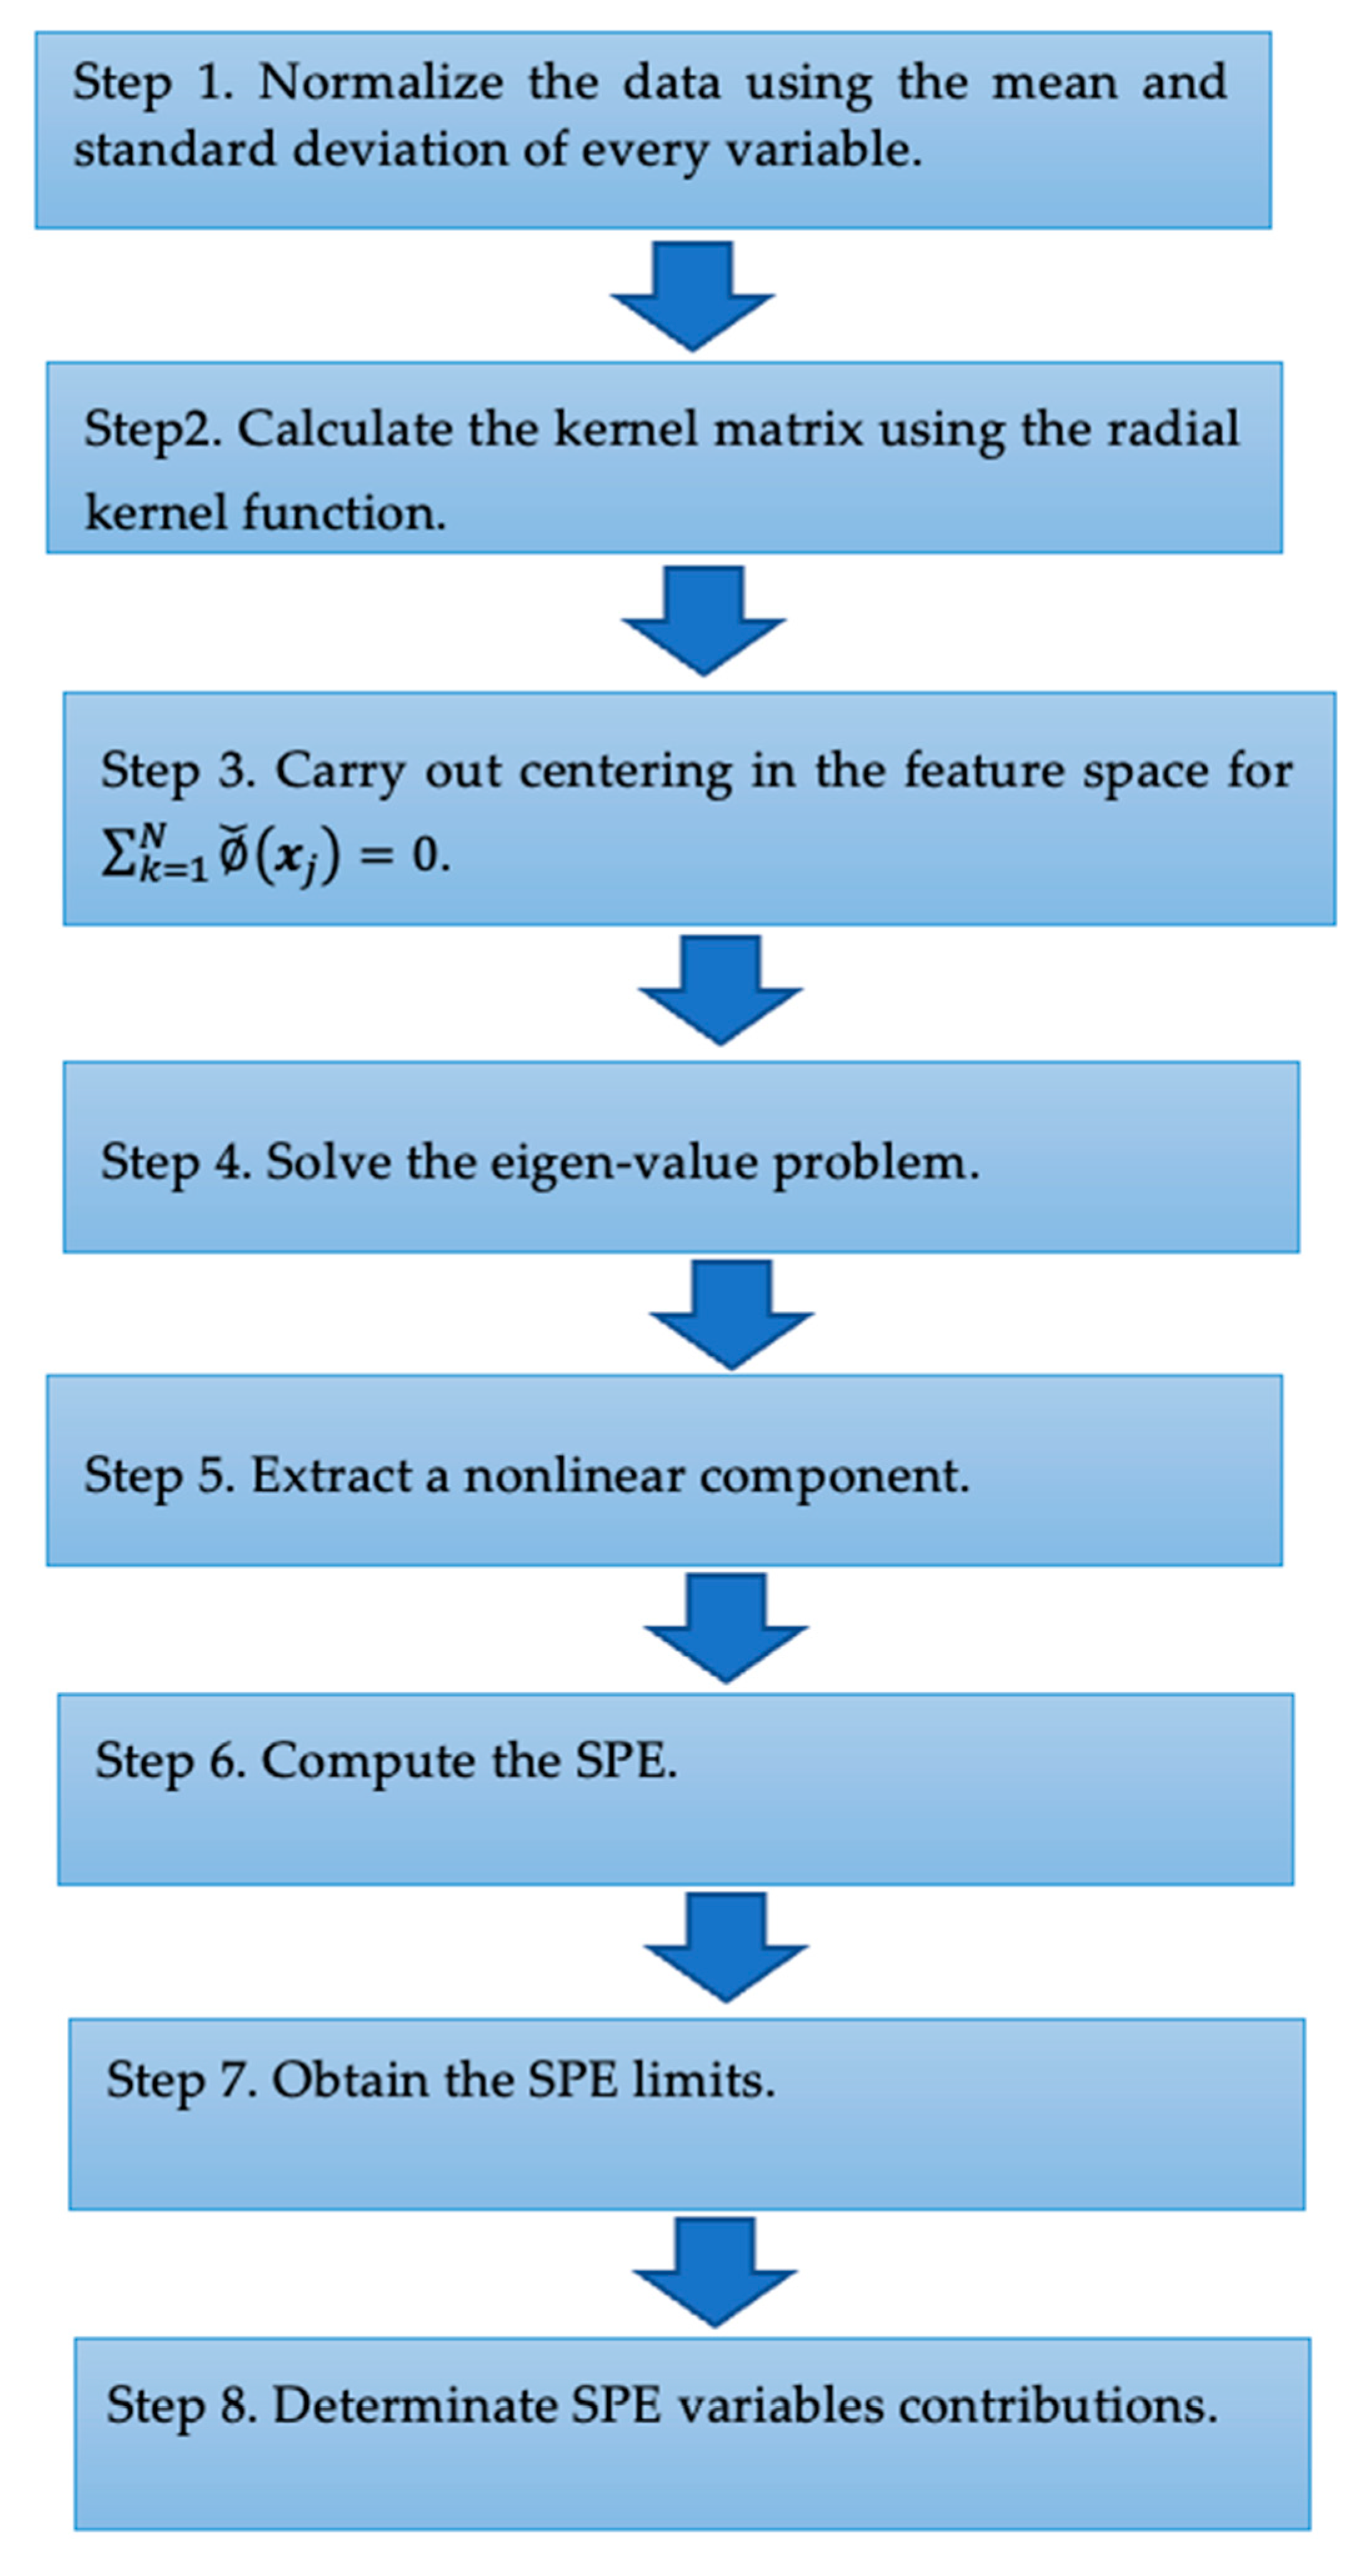
The kernel PCA algorithm is described using the eight steps defined in Figure 1. Note that the test system of Step 3 is used to validate the developed approach on a simple example to highlight the main steps of the designed technique in a simple and straight way.
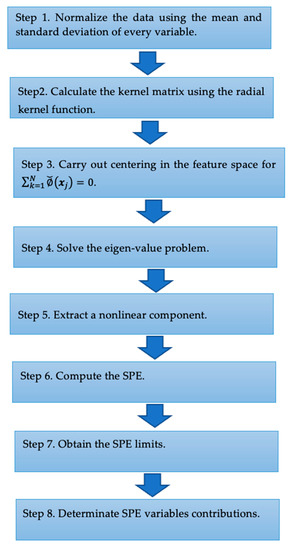
Figure 1.
Designed kernel PCA algorithm.
3. Multiscale Monitoring Using Kernel PCA
3.1. Principle
The multiscale monitoring using the kernel PCA is aimed at in-depth analysis of the data by employing multiscale analysis to isolate and identify time-frequency scales, as presented in Figure 2.
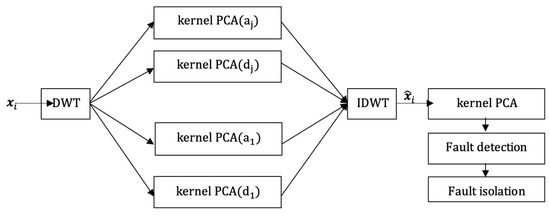
Figure 2.
Multiscale kernel PCA: are the original data, are the reconstructed data, and is the inverse of DWT.
The steps of the algorithm are as follows:
- Step 1: Decompose multivariate data into wavelet coefficients with the help of the DWT. We introduce “haar” as a mother wavelet and use DWT on five scales.
- Step 2: Apply the kernel PCA to coefficients of approximation. At that level (scale), the SPE is employed for identifying defects, while the coefficients displaying an overrun pertaining to the control thresholds are reserved for data reconstruction.
- Step 3: Reconstruct with the inverse of DWT.
- Step 4: Use the kernel PCA to the reconstructed data to identify and isolate defects. Note that bulleted lists look as in Figure 1.
3.2. Numerical Example
Next, a numerical example of simulation is provided. Consider a nonlinear system described as:
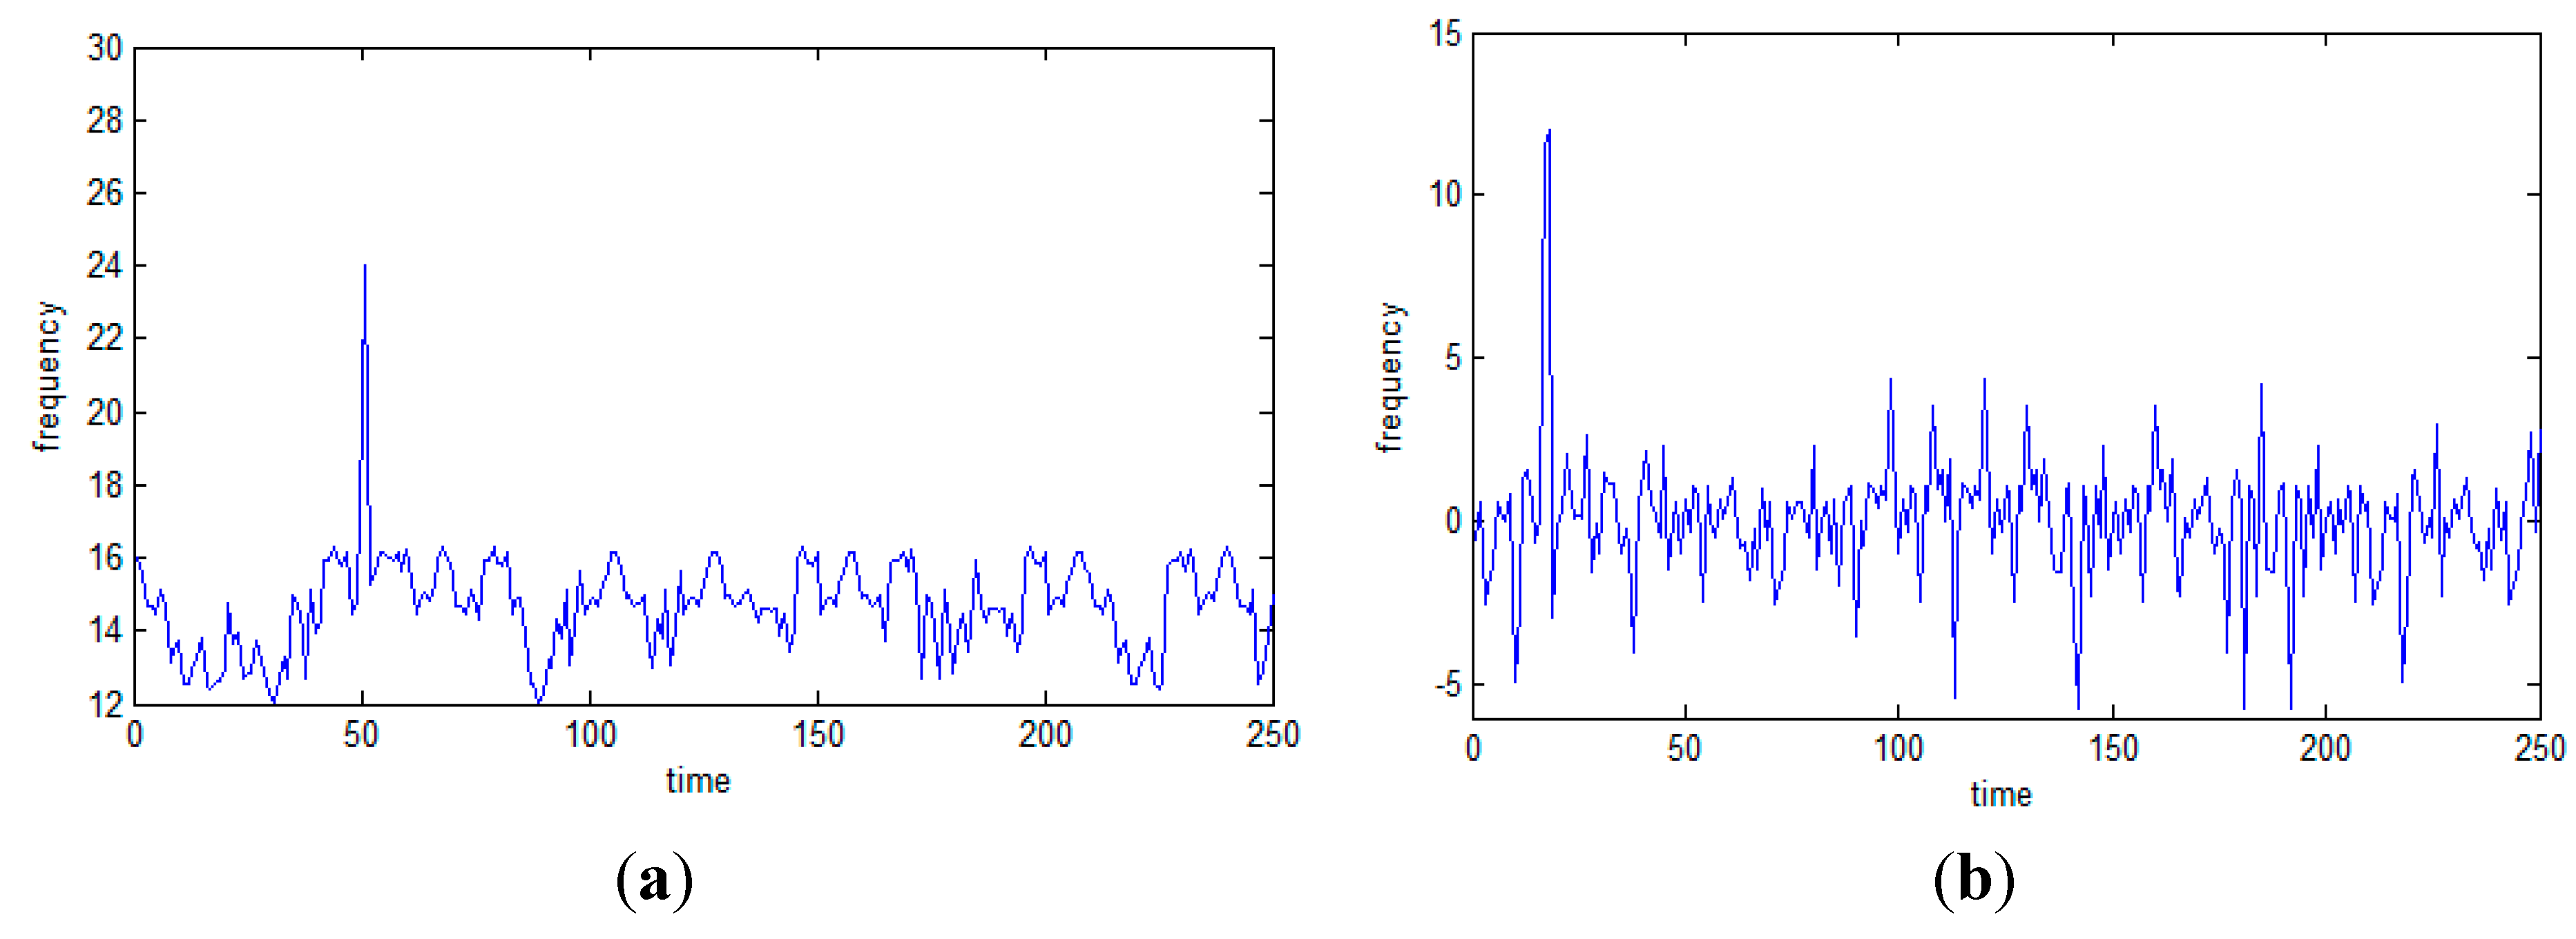
where denotes the system outputs. The noise is uniformly and arbitrary ranged from . Note that 1000 samples are employed for the simulation of the model. By using DWT, decomposition of the data is done into wavelet coefficients on three different resolution levels by utilizing the haar wavelet function. Simulation of a defect is done at the level pertaining to the approximation coefficients about the variable , as well as at the level of the detail coefficients considering the variable at scale 2; see Figure 3 and Figure 4.

Figure 3.
Fault simulation of approximation coefficient at scale 3 of .
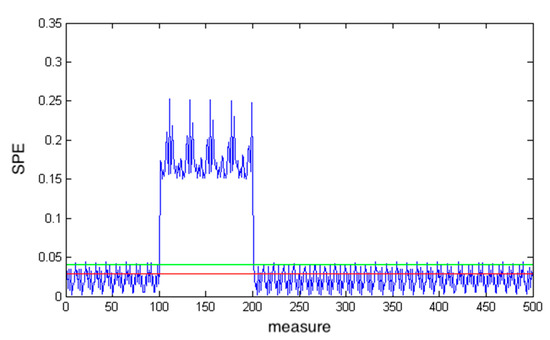
Figure 4.
Fault simulation of detail coefficient at scale 3 of .
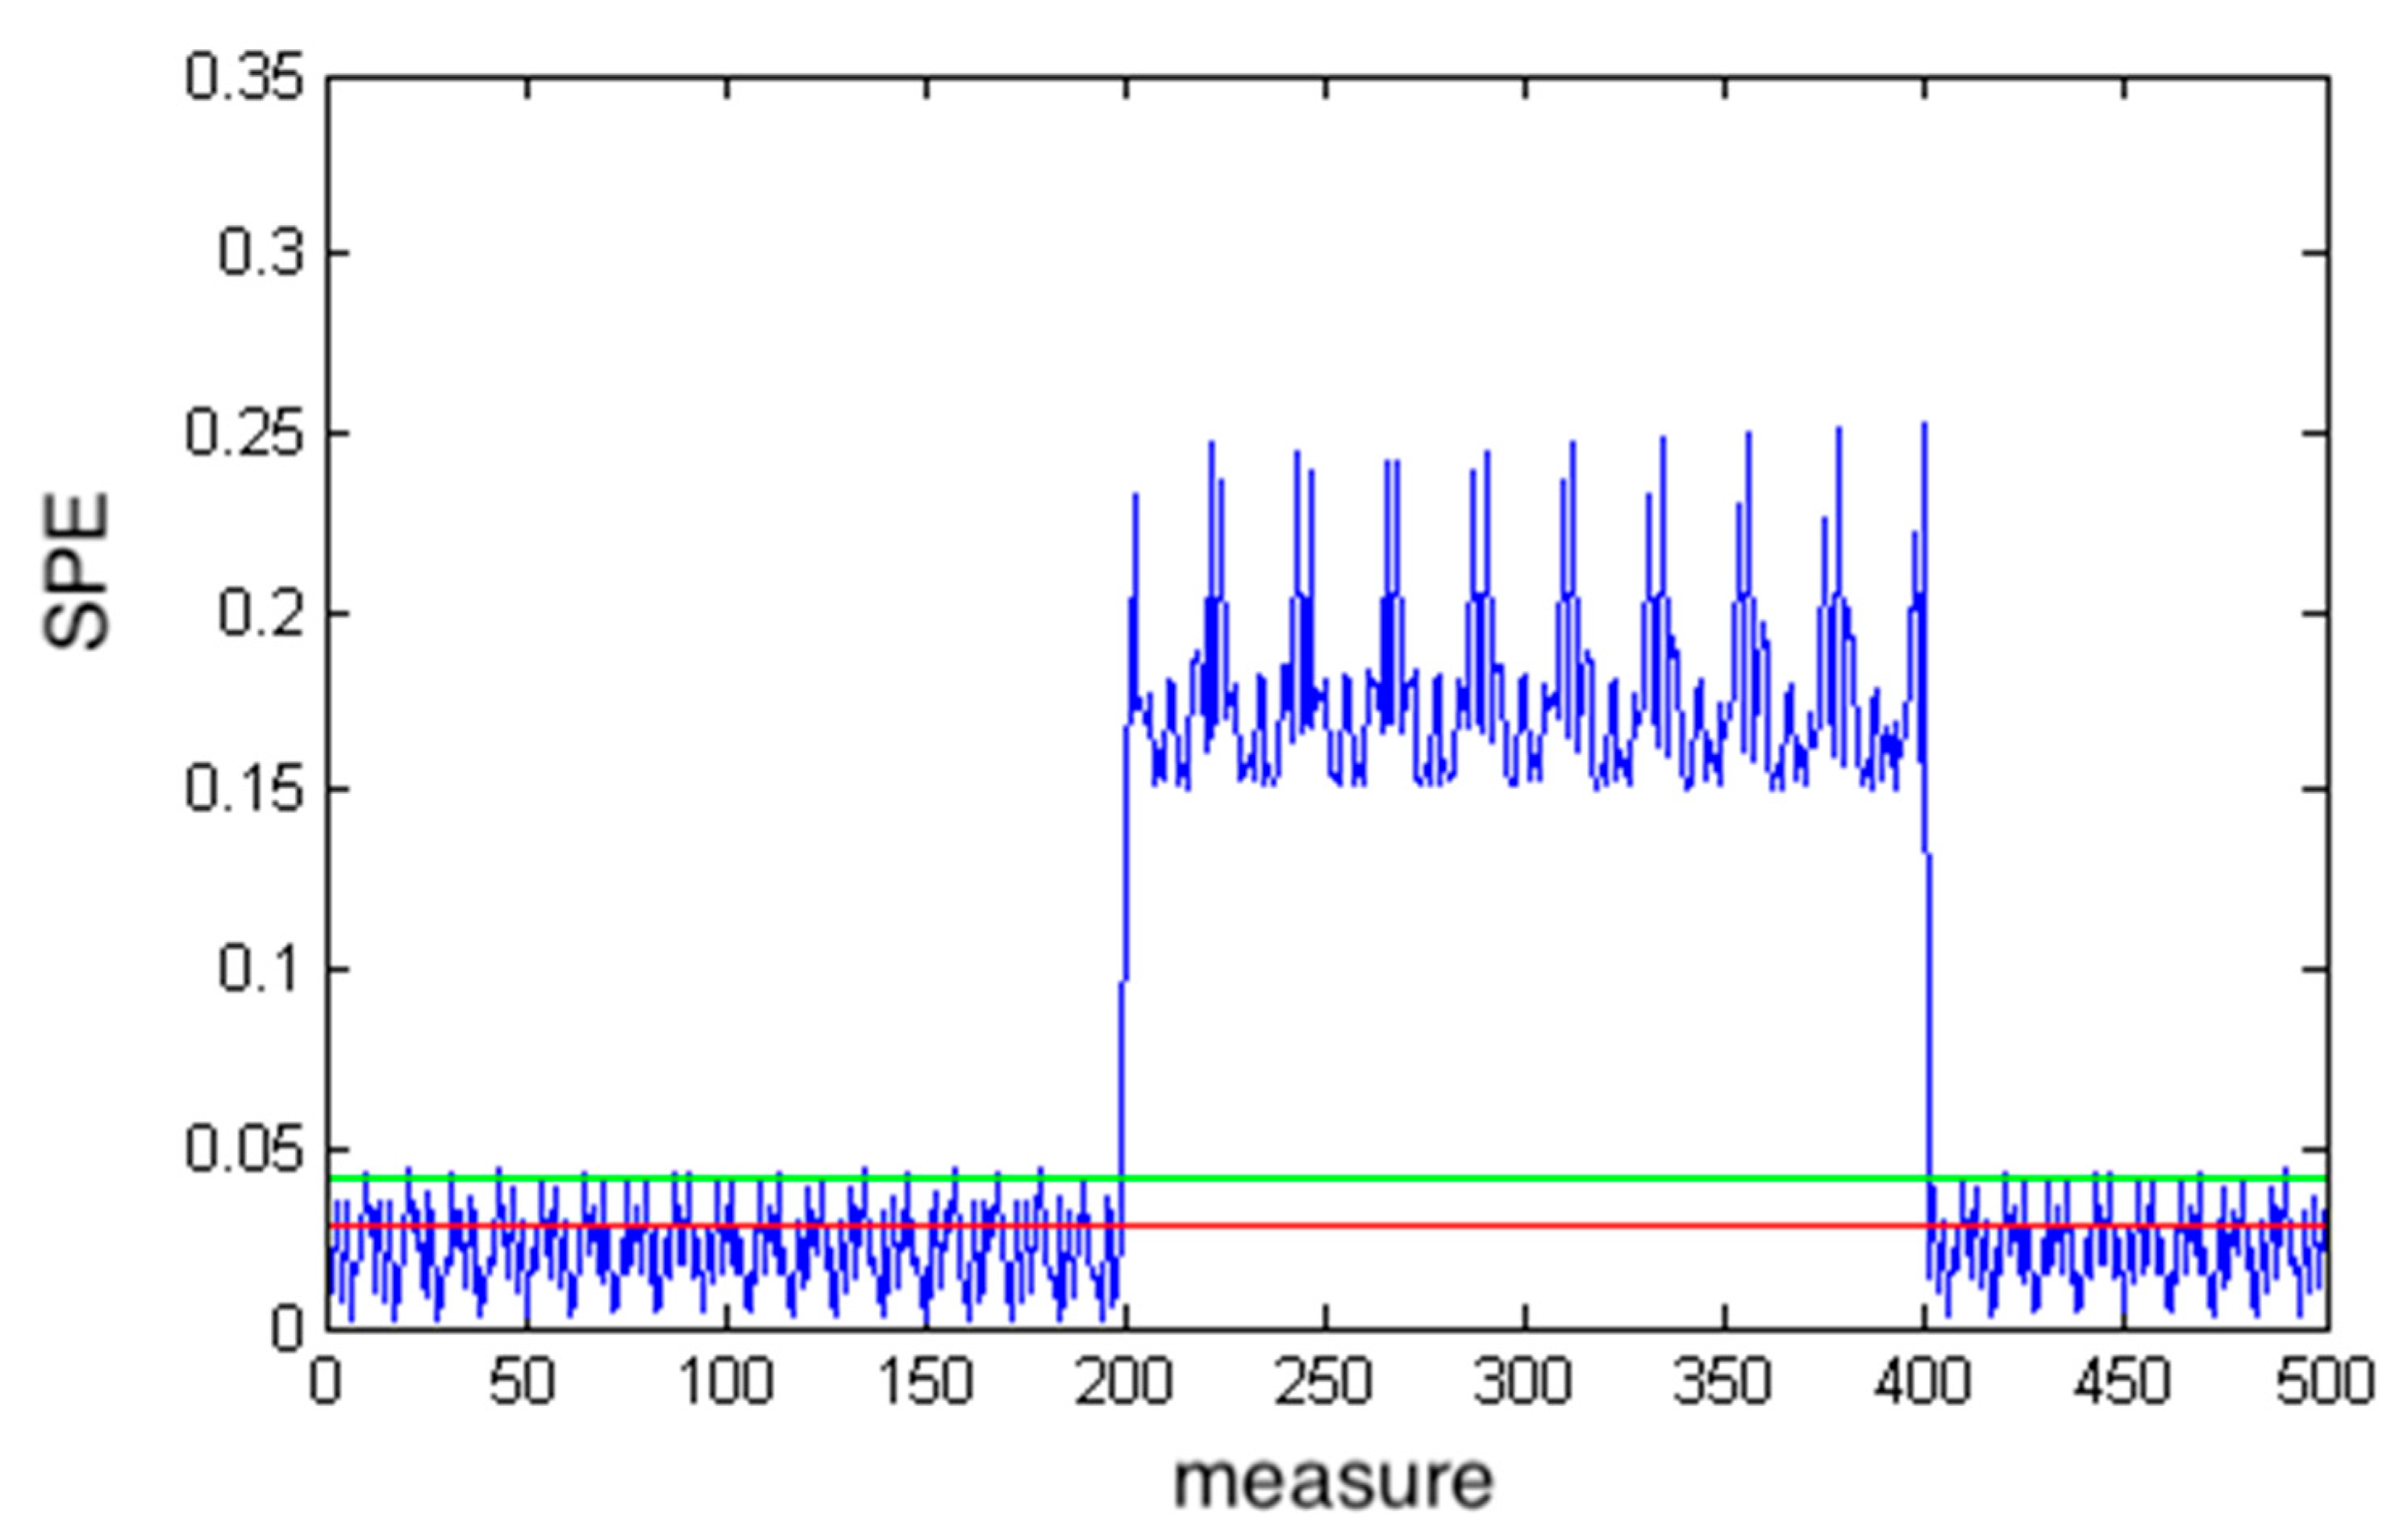
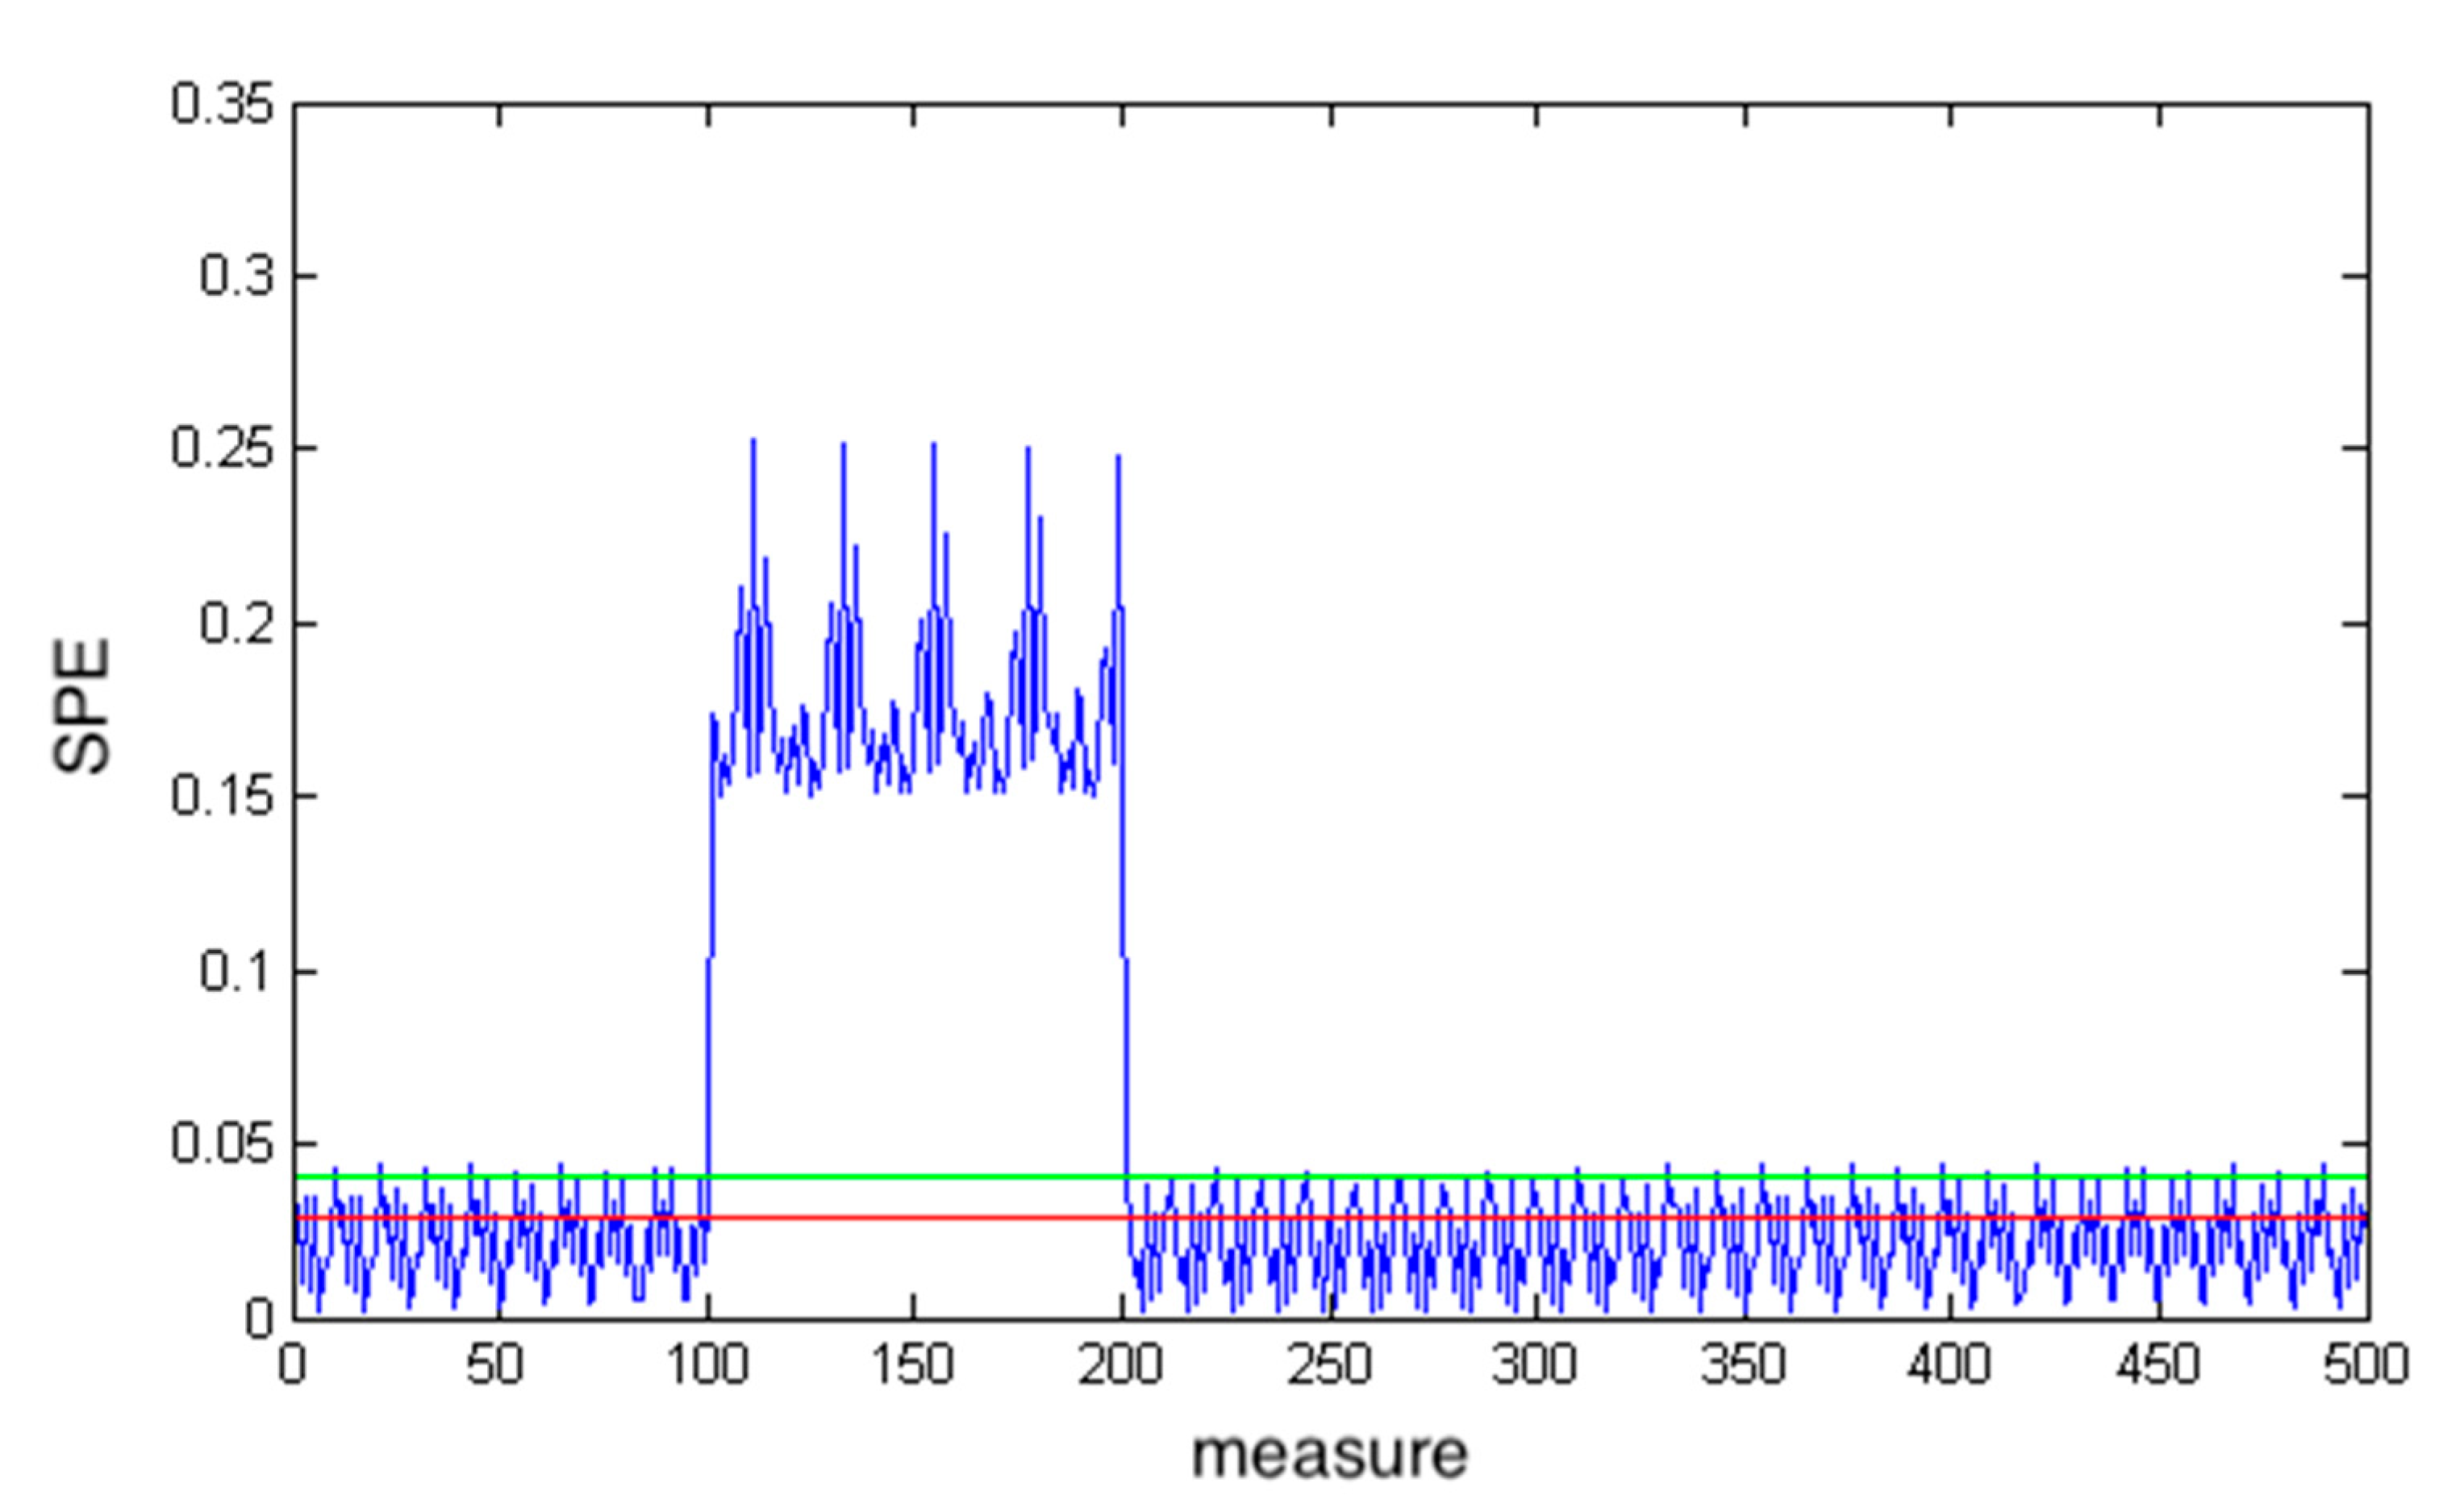
The reconstruction of the data is done via the inverse of DWT as follows. At this stage, we compare the traditional PCA (Figure 5), neural PCA (Figure 6), and put forward an approach (Figure 7) for determining their performance regarding defect detection in time-frequency scales.
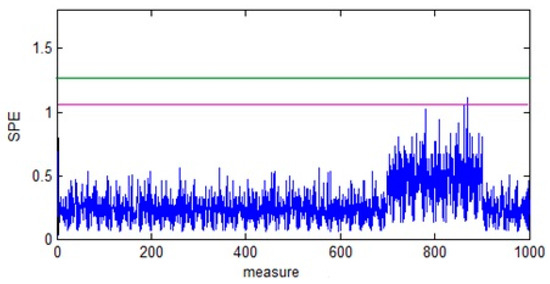
Figure 5.
SPE fault detection of reconstructed data using the traditional PCA.
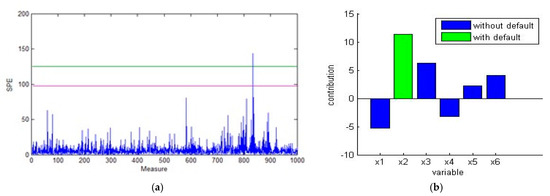
Figure 6.
SPE fault detection (a) and isolation (b) of reconstructed data using the neural PCA.
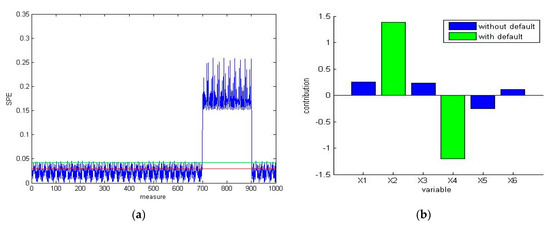
Figure 7.
SPE fault detection (a) and isolation (b) of reconstructed data using the multiway kernel PCA.
By interpreting the fault detection results by the SPE shown in Figure 5, Figure 6 and Figure 7, we note the following:
- -
- The traditional PCA does not detect fault at the time-frequency scales.
- -
- The neural PCA slightly assesses the stimulated defect, that is, the defect is identified only at the variable .
- -
- The proposed method identifies the stimulated defects at the level of wavelet coefficients, that is, the defect is identified in variables and .
In summary, according to the simulation example, we proved the performance of the multiscale kernel PCA approach in FDI at time-frequency scales as compared to traditional and neural PCA-based approaches. In the sequel, we validate the developed approach on a photovoltaic process, and a comparative study with the above-mentioned monitoring approaches is provided.
4. Experimental Results
4.1. Power Voltage System Parameters
Figure 8 presents the block diagram of a photovoltaic system. This system is composed by a photovoltaic generator, direct current (DC) reducing the converter, and a DC pump motor [34].
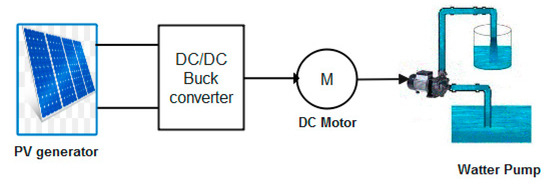
Figure 8.
Photovoltaic system configuration.
In a 20SIM environment, the power voltage (PV) system was simulated. The employed numerical parameters are listed in Table 2.
Table 2.
Photovoltaic system parameters.
4.2. Power Voltage System Data Matrix
Consider the variables:
- -
- : motor current.
- -
- : the angular speed.
- -
- : converter output voltage.
- -
- : photovoltaic system output.
The PV system data matrix is described as:
with being the observation time for every parameter. In our case, this is equal to microseconds. To better evaluate our monitoring algorithm, we stimulate a fault at variable .
4.3. Power Voltage System Monitoring Using the Developed Approach
Our developed methodology is presented in the following step-by-step algorithm using a MATLAB code:
- -
- Step 1: Use the DWT (mother wavelet:db5).
- -
- Step 2: Apply the kernel PCA algorithm to wavelet coefficients.
- -
- Step 3: Utilize the SPE for fault detection.
- -
- Step 4: Reconstruct data matrix using only defected coefficients.
- -
- Step 5: Employ the kernel PCA into a new matrix.
- -
- Step 6: Detect faults considering the SPE.
- -
- Step 7: Assess fault isolation by computing contributions.
4.4. Results
After applying the algorithm presented in Section 4.3 to a PV system, we obtain the following results:
- (i)
- The data matrix —see expression given in (21)—is decomposed to wavelet coefficients using the DWT (with the haar wavelet).
- (ii)
- To better evaluate our monitoring algorithm, we stimulate a fault at variable . Figure 9 presents the wavelet coefficients of the defected variable.
 Figure 9. Fault stimulating at wavelet scale 4 of variable for (a) coefficients of approximation and (b) coefficients of details.
 - (iii)
- The data matrix is then reconstructed using a defected scale (scale 4).
- (iv)
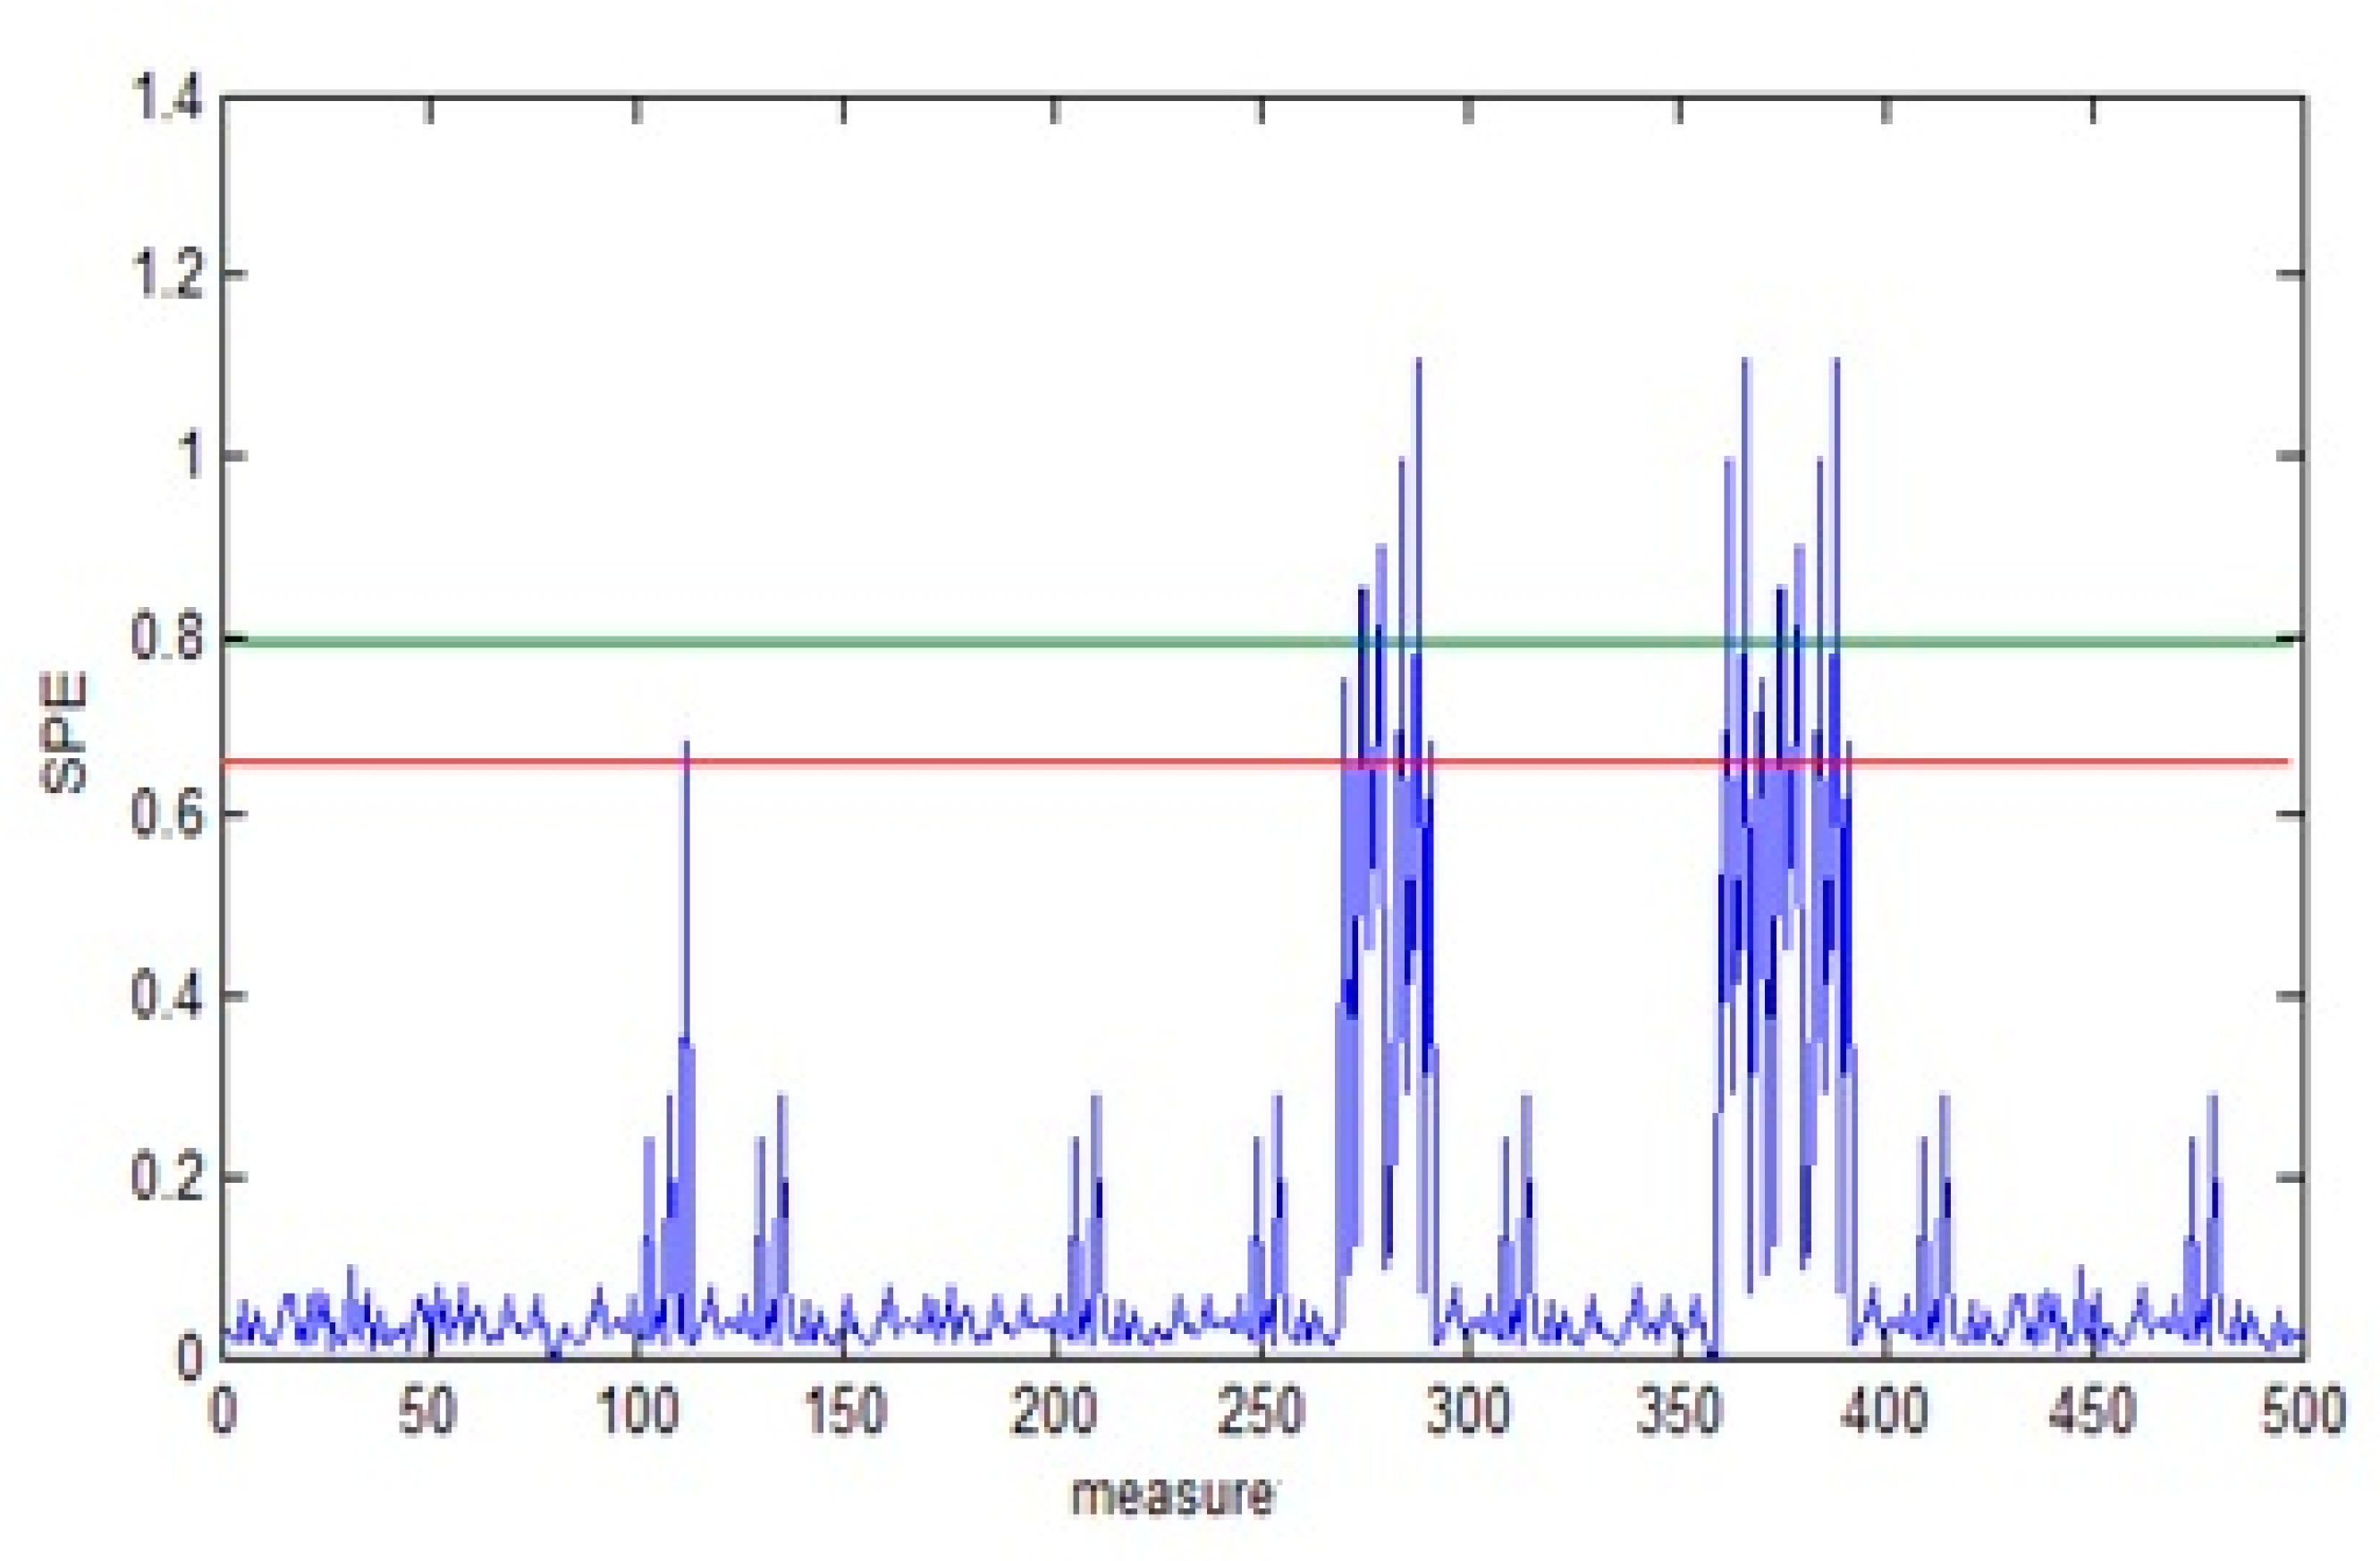
- We apply the SPE for fault detection to the reconstructed matrix as shown in Figure 10. Note that there is an exceeding of limits which proves the existence of defects.
 Figure 10. Fault detection and isolation using the proposed approach.
 - (v)
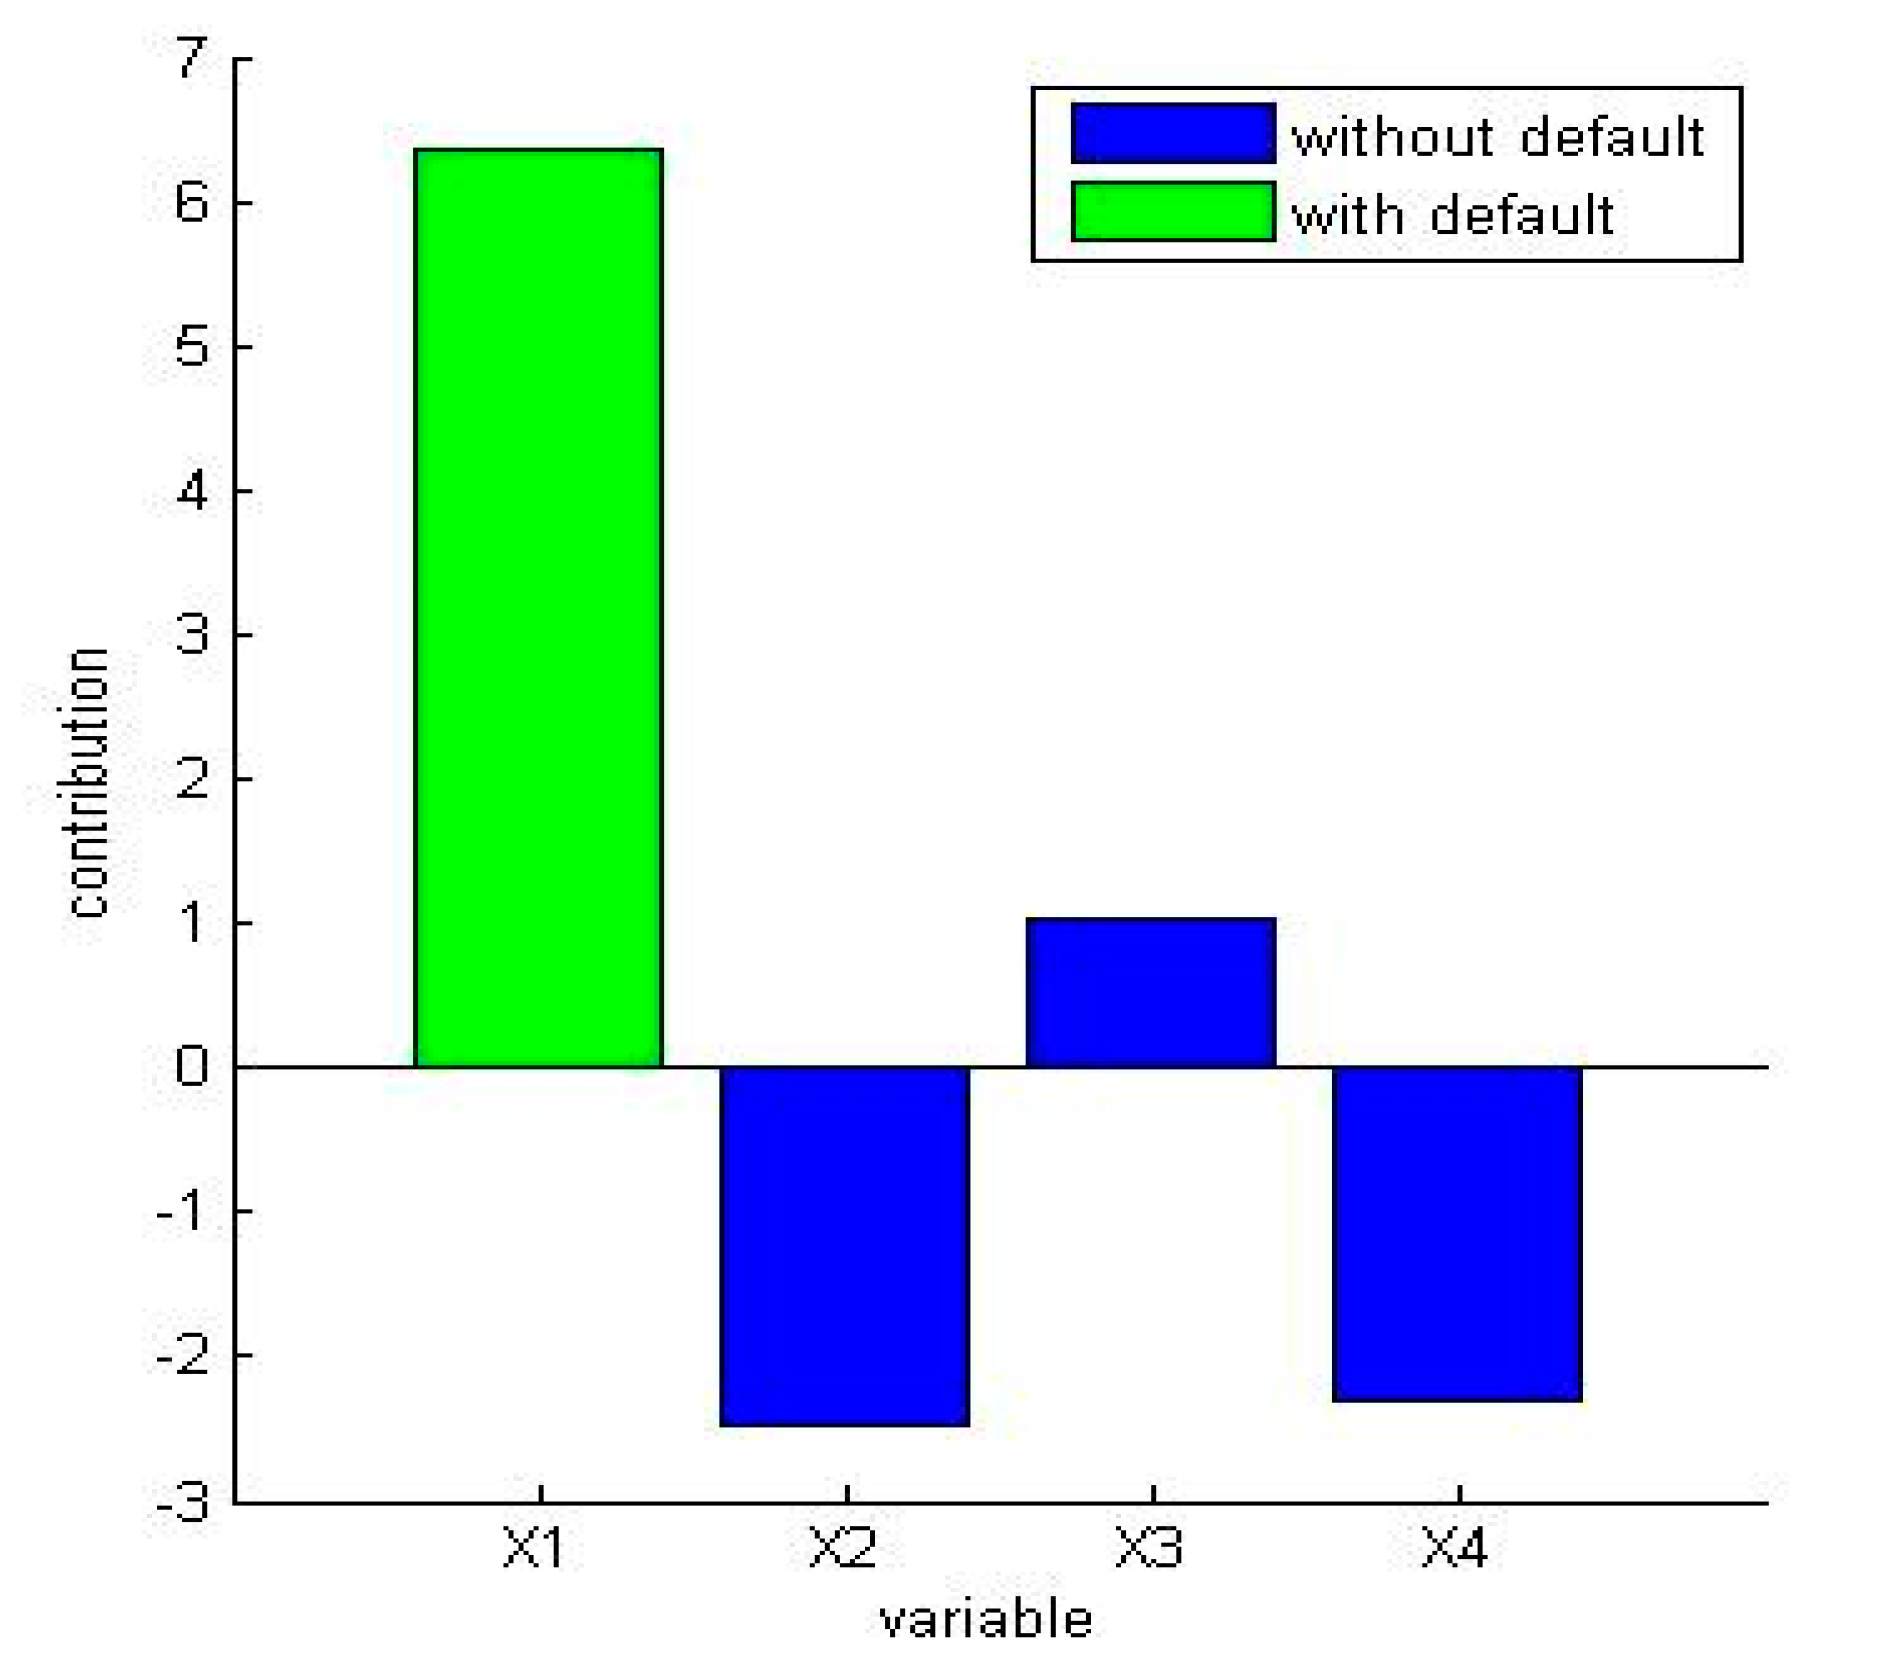
- For identifying the location of the defect, we calculate the contribution of different variables of the data matrix. From Figure 11, we observe that the highest contribution corresponds to the variable (current motor). As a result, this variable is the origin of the defect.
 Figure 11. Fault isolation using the proposed approach.
4.5. Comparative Analysis with Other Monitoring Methods
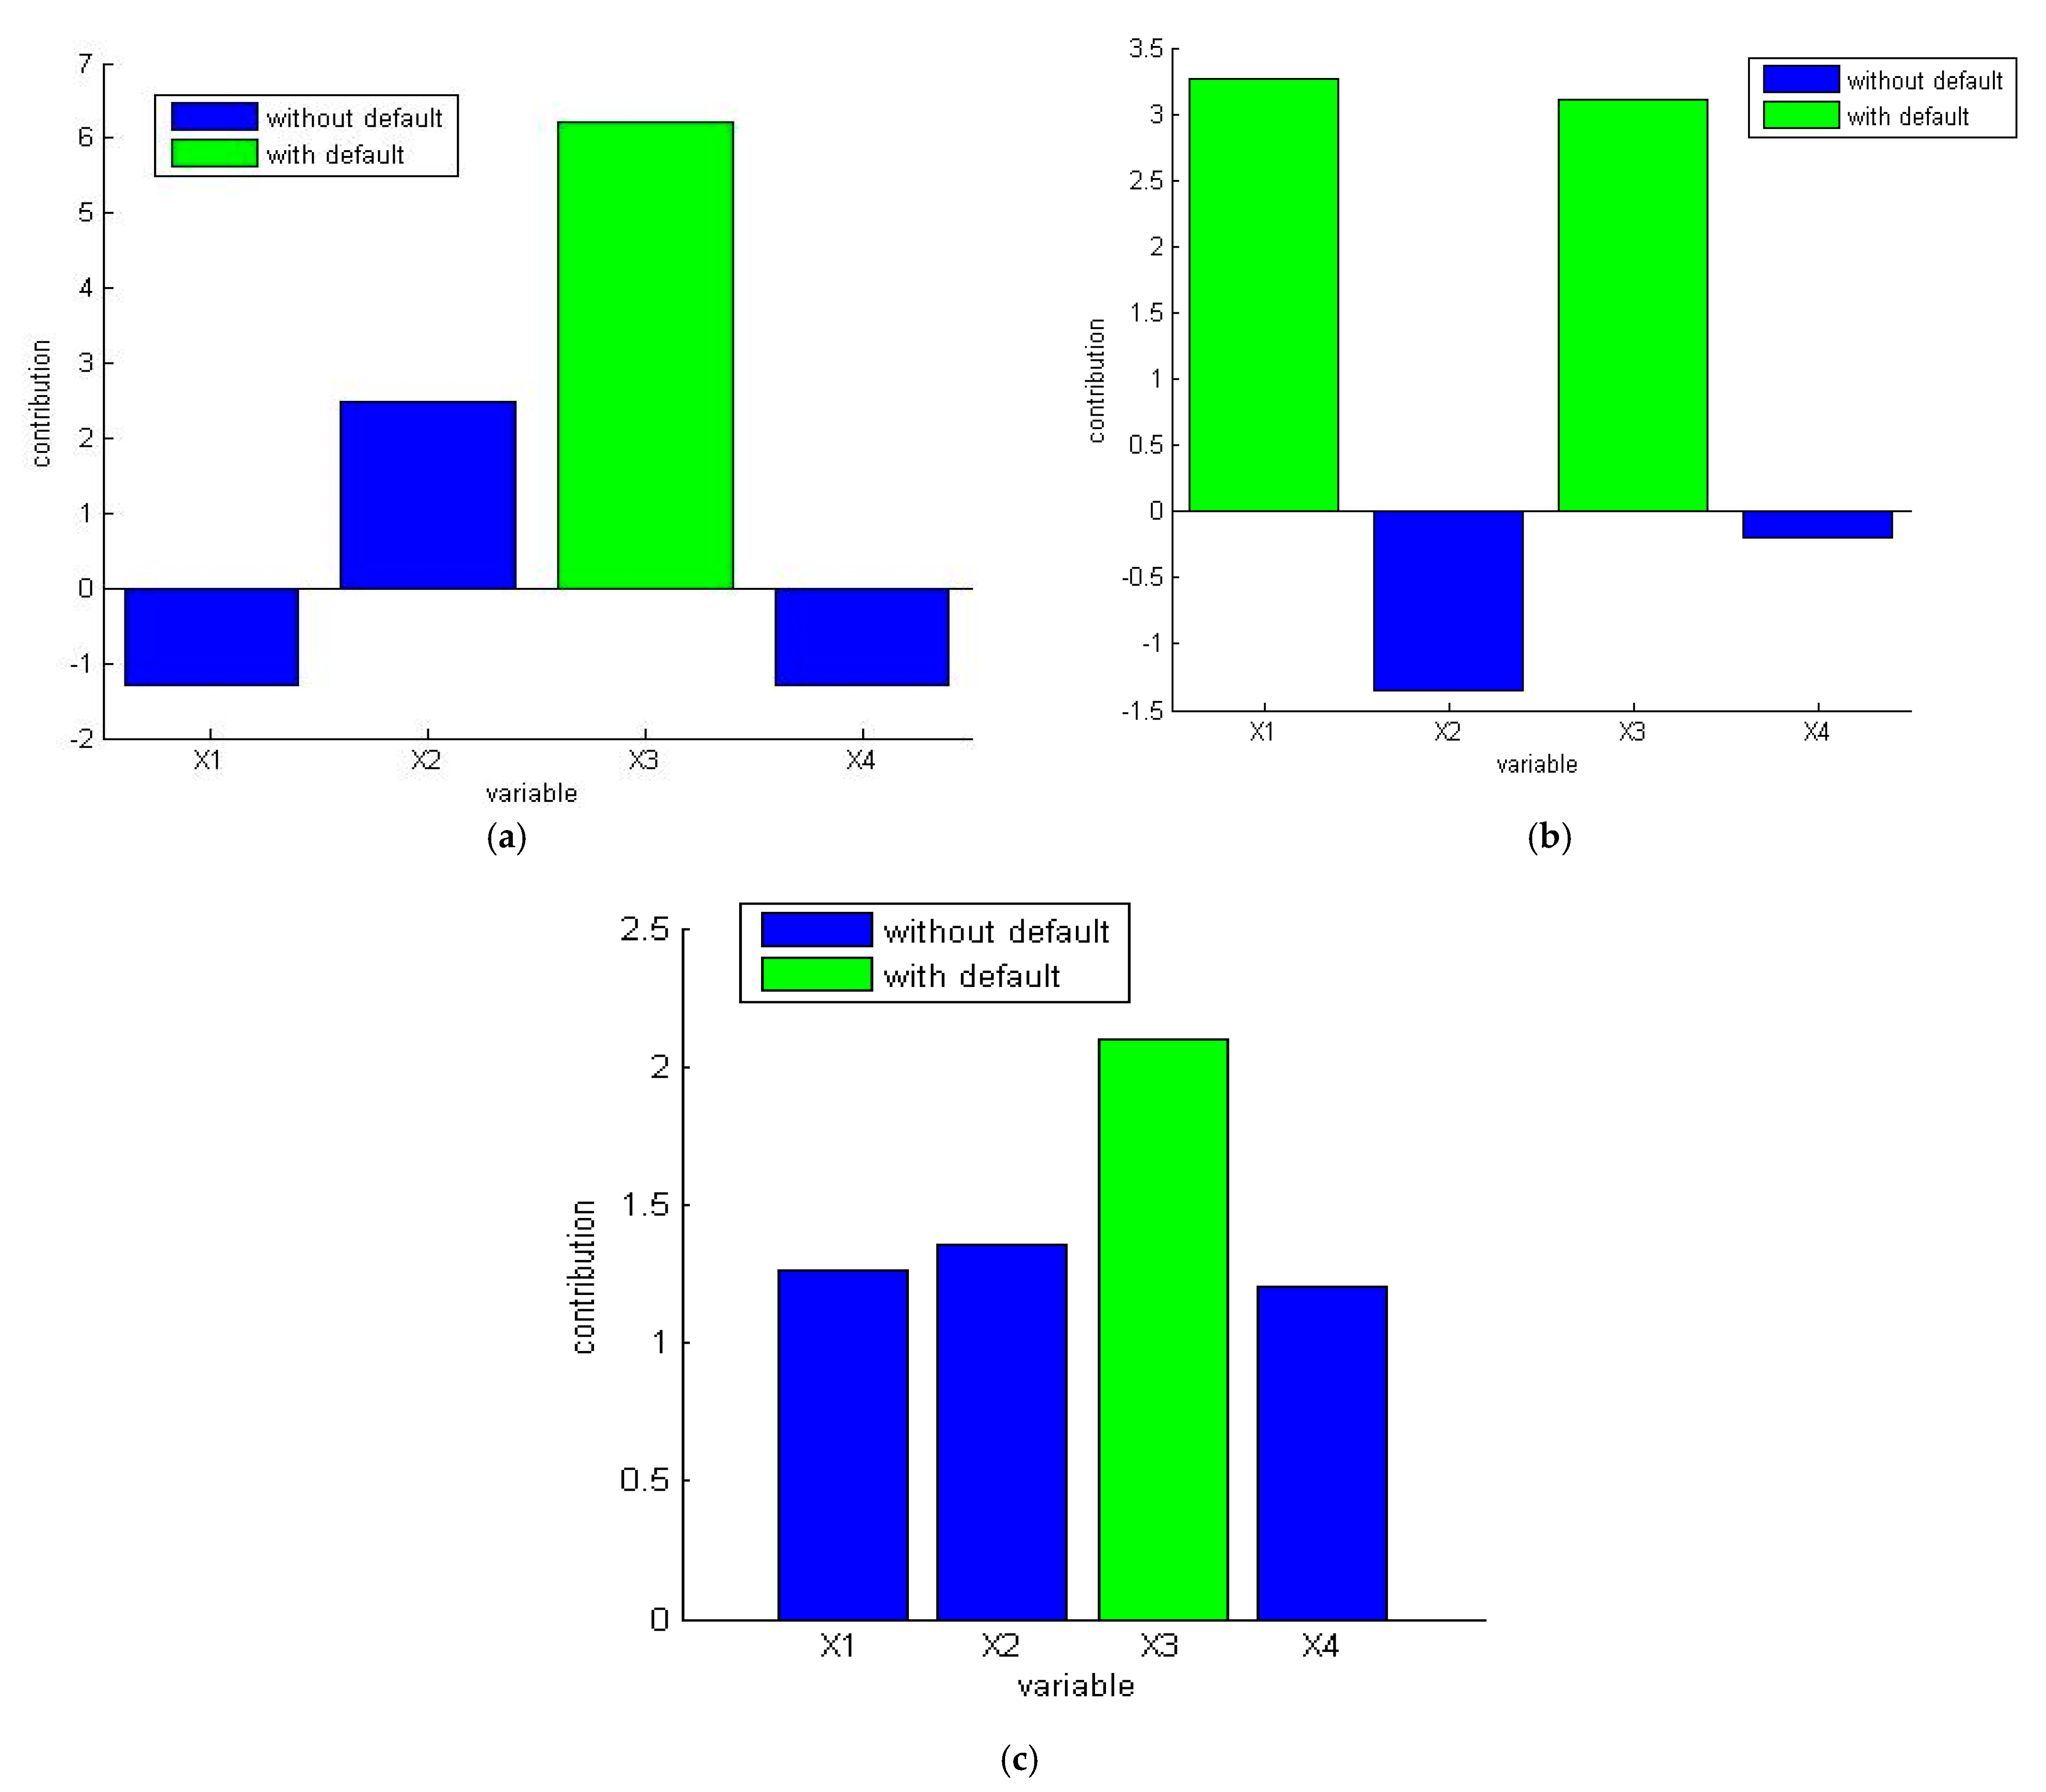
Now, we conduct a comparative analysis with other machine learning methods, such as monoscale kernel PCA, neural PCA, and traditional PCA to a FDI of the simulated defect (in the variable at scale 4 of wavelet coefficient). Fault isolation is established by calculating contributions, where the highest contribution shows the defected variables in the system. The result of simulation of these methods are presented in Figure 12a–c. It describes the fault isolation by calculating the contributions on terms of the SPE.

Figure 12.
Fault isolation using (a) monoscale kernel PCA, (b) neural PCA, and (c) traditional PCA.
The monoscale kernel PCA presented in Figure 12a provides a false detection at the variable . This method is based on the same principle of the developed approach, but it does not have the property of multiscale monitoring. The failure of this method in detecting the default is hence clear, as shown in Figure 12a.
A second method which introduces a neural network for determining the number principal components [33] is then applied. Figure 12b shows two defected variables and , which have approximately the same SPE contributions. This proves the limits of this method in fault isolation.
Then, we test the traditional PCA. This method is not efficient in nonlinear process monitoring because it cannot analyze the nonlinearity of the data matrix; see Figure 12c.
5. Conclusions, Limitations, and Future Research
In this study, we have addressed the problem of fault detection and isolation for monitoring nonlinear processes. Our study is based on two fundamental pillars: (i) multi-scale analysis and (ii) machine learning tools. In the literature, several works have used techniques based on machine learning, which are in fact data science tools for multivariate data. In this work, we have used the kernel principal component analysis, which has proven its good performance in the analysis of fault detection and isolation for industrial systems. The developed approach allowed us to present faults’ multi-scale analysis in a nonlinear process.
We have implemented the discrete wavelet analysis as well as the kernel principal component analysis. Our approach was applied to a photovoltaic system with the help of a data matrix that included four variables and 500 simulations. After data decomposition into discrete wavelet coefficients, we have simulated a few problems at wavelet coefficients pertaining to a variable. Then, the kernel principal component analysis was employed to identify that fault accurately. A comparative study with neural-based principal component analysis has shown the efficiency of the proposed method. In summary, this method is helpful to apply deep analysis of fault detection as well as isolation regarding nonlinear processes. Its ability to detect low amplitude faults versus other monitoring methods is beneficial in identifying various scales of wavelet coefficients. As a fault detection and isolation method, the kernel principal component analysis has proved its capability of reducing the system characteristic dimension, while preserving the physical related information. It is a mathematical modeling tool, which is straightforward in terms of process features. The kernel principal component analysis offers better performance with an important number of variables and observations (there is no fixed dimension of the data matrix a priori). In its actual form, the developed algorithm is dedicated for offline process operation with a running time 0.5 to 1.5 s. With some modification, it is possible to include online system capabilities for the designed algorithm, which will be considered for future work. However, the identification of faults for isolation purposes can sometimes be limited and does not lead to efficient results. More precisely, in the case where two or more variables have very comparable contributions, it can be difficult to identify the faulty variable. Then, it is possible to investigate other more relevant methods of defect isolation, as techniques based on residual reconstruction.
More ideas for future research are related to other types of techniques. For example, using disjoint and functional principal component analysis can be considered [38,39,40]. Moreover, deep and convolutional neural networks, which are neural networks with multiple hidden layers, have shown interesting results in many applications, such as image recognition. It would be very useful to create a detailed database in terms of simple and combined defects in order to train the above-mentioned networks in defect isolation and detection methods.
Author Contributions
Conceptualization, H.C., S.C. and H.J.; methodology, H.C., S.C. and V.L.; software, S.B.A. and H.C.; validation, V.L. and H.J.; formal analysis, H.C., S.B.A., H.J. and V.L.; investigation, S.C., H.C. and V.L.; resources, S.B.A. and H.J.; data curation, H.C. and H.J.; writing—original draft preparation, H.C. and H.J.; writing—review and editing, V.L. and H.J.; visualization, H.C. and S.C.; supervision, V.L., S.B.A. and H.J.; project administration H.J. and S.B.A.; funding acquisition, H.J. All authors have read and agreed to the published version of the manuscript.
Funding
The research of V.L. was partially funded by FONDECYT, project grant number 1200525 from the National Agency for Research and Development (ANID) of the Chilean government under the Ministry of Science and Technology, Knowledge and Innovation.
Institutional Review Board Statement
Not applicable.
Informed Consent Statement
Not applicable.
Data Availability Statement
The data are contained within the article.
Conflicts of Interest
The authors declare no conflict of interest.
References
- Nguyen, T.H.; Nguyen, T.L.; Sidorov, D.N.; Dreglea, A. Robust approach to detect gas bubbles through images analysis. Intell. Decis. Technol. 2020, 14, 153–158. [Google Scholar] [CrossRef]
- Aykroyd, R.G.; Leiva, V.; Ruggeri, F. Recent developments of control charts, identification of big data sources and future trends of current research. Technol. Forecast. Soc. Chang. 2019, 144, 221–232. [Google Scholar] [CrossRef]
- Bustos, N.; Tello, M.; Droppelmann, G.; Garcia, N.; Feijoo, F.; Leiva, V. Machine learning techniques as an efficient alternative diagnostic tool for COVID-19 cases. Signa Vitae 2022, 18, 23–33. [Google Scholar]
- Ma, L.; Zhang, Y.; Leiva, V.; Liu, S.; Ma, T. A new clustering algorithm based on a radar scanning strategy with applications to machine learning data. Expert Syst. Appl. 2022, 191, 116143. [Google Scholar] [CrossRef]
- Mahdi, E.; Leiva, V.; Mara’Beh, S.; Martin-Barreiro, C. A new approach to predicting cryptocurrency returns based on the gold prices with support vector machines during the COVID-19 pandemic using sensor-related data. Sensors 2021, 21, 6319. [Google Scholar] [CrossRef]
- Nor, A.K.M.; Pedapati, S.R.; Muhammad, M.; Leiva, V. Overview of explainable artificial intelligence for prognostic and health management of industrial assets based on preferred reporting items for systematic reviews and meta-analyses. Sensors 2021, 21, 8020. [Google Scholar] [CrossRef] [PubMed]
- Nor, A.K.M.; Pedapati, S.R.; Muhammad, M.; Leiva, V. Abnormality detection and failure prediction using explainable Bayesian deep learning: Methodology and case study with industrial data. Mathematics 2022, 10, 554. [Google Scholar] [CrossRef]
- Palacios, C.A.; Reyes-Suarez, J.A.; Bearzotti, L.A.; Leiva, V.; Marchant, C. Knowledge discovery for higher education student retention based on data mining: Machine learning algorithms and case study in Chile. Entropy 2021, 23, 485. [Google Scholar] [CrossRef] [PubMed]
- Iqbal, R.; Maniak, T.; Doctor, F.; Karyotis, C. Fault detection and isolation in industrial processes using deep learning approaches. IEEE Trans. Ind. Inform. 2019, 15, 3077–3084. [Google Scholar] [CrossRef]
- Fazai, R.; Ben Abdellafou, K.; Said, M.; Taouali, O. Online fault detection and isolation of an AIR quality monitoring network based on machine learning and metaheuristic methods. Int. J. Adv. Manuf. Technol. 2018, 99, 2789–2802. [Google Scholar] [CrossRef]
- Hamadache, M.; Lee, D. Principal component analysis based signal to noise ratio improvement for inchoate faulty signals: Application to ball bearing fault detection. Int. J. Control Autom. Syst. 2017, 15, 506–517. [Google Scholar] [CrossRef]
- Harkat, M.F.; Djelel, S.; Doghmane, N.; Benouaret, M. Sensor fault detection, isolation and reconstruction using nonlinear principal component analysis. Int. J. Autom. Comput. 2007, 4, 149–155. [Google Scholar] [CrossRef]
- Wang, G.; Luo, H.; Peng, K. Quality-related fault detection using linear and nonlinear principal component regression. J. Frankl. Inst. 2016, 353, 2159–2177. [Google Scholar] [CrossRef]
- Said, M.; Fazai, R.; Abdellafou, K.B.; Taouali, O. Decentralized fault detection and isolation using bond graph and PCA methods. Int. J. Adv. Manuf. Technol. 2018, 99, 517–529. [Google Scholar] [CrossRef]
- Cherry, G.A.; Qin, S.J. Multiblock principal component analysis based on a combined index for semiconductor fault detection and diagnosis. IEEE Trans. Semicond. Manuf. 2006, 19, 159–172. [Google Scholar] [CrossRef]
- Sheriff, M.Z.; Mansouri, M.; Karim, M.N.; Nounou, H.; Nounou, M. Fault detection using multiscale PCA-based moving window GLRT. J. Process. Control 2017, 54, 47–64. [Google Scholar] [CrossRef]
- Zhang, Y.; Ma, C. Fault diagnosis of nonlinear processes using multiscale kPCA and multiscale kPLS. Chem. Eng. Sci. 2011, 66, 64–72. [Google Scholar] [CrossRef]
- Yellapu, V.S.; Vajpayee, V.; Tiwari, A.P. Online fault detection and isolation in advanced heavy water reactor using multiscale principal component analysis. IEEE Trans. Nucl. Sci. 2019, 66, 1790–1803. [Google Scholar] [CrossRef]
- He, Q.H.; He, X.Y.; Zhu, J.X. Fault detection of excavator’s hydraulic system based on dynamic principal component analysis. J. Cent. South Univ. Technol. 2008, 15, 700–705. [Google Scholar] [CrossRef]
- Luo, R.; Misra, M.; Himmelblau, D.M. Sensor fault detection via multiscale analysis and dynamic PCA. Ind. Eng. Chem. Res. 1999, 38, 1489–1495. [Google Scholar] [CrossRef]
- Molloy, M.; Martin, E.B. Application of multiway principal component analysis for identification of process improvements in pharmaceutical manufacture. IFAC Proc. 2013, 46, 283–288. [Google Scholar] [CrossRef] [Green Version]
- Yao, Y.; Bao, J.; Skyllas-Kazacos, M.; Welch, B.J.; Akhmetov, S. Fault detection and diagnosis in hall heroult cells based on individual anode current measurements using dynamic kernel PCA. Metall. Mater. Trans. B 2018, 49, 2077–2088. [Google Scholar] [CrossRef]
- Jiang, Q.; Yan, X.; Lv, Z.; Guo, M. Fault detection in nonlinear chemical processes based on kernel entropy component analysis and angular structure. Korean J. Chem. Eng. 2013, 30, 1181–1186. [Google Scholar] [CrossRef]
- Nguyen, V.H.; Golinval, J.C. Fault detection based on kernel principal component analysis. Eng. Struct. 2010, 32, 3683–3691. [Google Scholar] [CrossRef]
- Mansouri, M.; Nounou, M.; Nounou, H.; Karim, N. Kernel PCA-based GLRT for nonlinear fault detection of chemical processes. J. Loss Prev. Process Ind. 2016, 40, 334–347. [Google Scholar] [CrossRef]
- Navi, M.; Davoodi, M.; Meskin, N. Sensor fault detection and isolation of an autonomous underwater vehicle using partial kernel pca. In Proceedings of the 2015 IEEE Conference on Prognostics and Health Management, Beijing, China, 21–23 October 2015; pp. 1–9. [Google Scholar]
- Bakshi, B.R. Multiscale PCA with application to multivariate statistical process monitoring. AIChE J. 1998, 44, 1596–1610. [Google Scholar] [CrossRef]
- Popli, R.; Kansal, I.; Garg, A.; Goyal, N.; Garg, K. Classification and recognition of online hand-written alphabets using machine learning methods. IOP Conf. Ser. Mater. Sci. Eng. 2021, 1022, 012111. [Google Scholar] [CrossRef]
- Popli, R.; Sethi, M.; Kansal, I.; Garg, A.; Goyal, N. Machine learning based security solutions in MANETs: State of the art approaches. J. Phys. Conf. Ser. 2021, 1950, 012070. [Google Scholar] [CrossRef]
- Jeong, M.K.; Lu, J.C.; Huo, X.; Vidakovic, B.; Chen, D. Wavelet-based data reduction techniques for process fault detection. Technometrics 2006, 48, 27–28. [Google Scholar] [CrossRef] [Green Version]
- Jeong, M.K.; Chen, D.; Lu, J.C. Thresholded scalogram and its applications in process fault detection. Appl. Stoch. Models Bus. Ind. 2003, 19, 231–244. [Google Scholar] [CrossRef]
- Lee, D.S.; Park, J.M.; Vanrolleghem, P.A. Adaptive multiscale principal component analysis for on-line monitoring of a sequencing batch reactor. J. Biotechnol. 2005, 116, 195–210. [Google Scholar] [CrossRef] [PubMed]
- Nomikos, P.; MacGregor, J.F. Monitoring batch processes using multiway principal component analysis. AIChE J. 1994, 40, 1361–1375. [Google Scholar] [CrossRef]
- Wang, W.; McFadden, P. Application of wavelets to gearbox vibration signals for fault detection. J. Sound Vib. 1996, 192, 927–939. [Google Scholar] [CrossRef]
- Charfeddine, S.; Jerbi, H. A Benchmarking analysis of analytical and advanced nonlinear tracking control techniques. J. Eng. Res. 2021, 9, 250–267. [Google Scholar] [CrossRef]
- Charfeddine, S.; Boudjemline, A.; Ben Aoun, S.; Jerbi, H.; Kchaou, M.; Alshammari, O.; Elleuch, Z.; Abbassi, R. Design of a fuzzy optimization control structure for nonlinear systems: A disturbance-rejection method. Appl. Sci. 2021, 11, 2612. [Google Scholar] [CrossRef]
- Chaouch, H.; Charfedine, S.; Ouni, K.; Jerbi, H.; Nabli, L. Intelligent supervision approach based on multilayer neural PCA and nonlinear gain scheduling. Neural Comput. Appl. 2019, 31, 1153–1163. [Google Scholar] [CrossRef]
- Martin-Barreiro, C.; Ramirez-Figueroa, J.A.; Nieto, A.B.; Leiva, V.; Martin-Casado, A.; Galindo-Villardón, M.P. A new algorithm for computing disjoint orthogonal components in the three-way Tucker model. Mathematics 2021, 9, 203. [Google Scholar] [CrossRef]
- Martin-Barreiro, C.; Ramirez-Figueroa, J.A.; Cabezas, X.; Leiva, V.; Galindo-Villardón, M.P. Disjoint and functional principal component analysis for infected cases and deaths due to COVID-19 in South American countries with sensor-related data. Sensors 2021, 21, 4094. [Google Scholar] [CrossRef]
- Martin-Barreiro, C.; Ramirez-Figueroa, J.A.; Nieto, A.B.; Leiva, V.; Galindo-Villardón, M.P. A new principal component analysis by particle swarm optimization with an environmental application for data science. Stoch. Environ. Res. Risk Assess. 2021, 35, 1969–1984. [Google Scholar]


Publisher’s Note: MDPI stays neutral with regard to jurisdictional claims in published maps and institutional affiliations. |
© 2022 by the authors. Licensee MDPI, Basel, Switzerland. This article is an open access article distributed under the terms and conditions of the Creative Commons Attribution (CC BY) license (https://creativecommons.org/licenses/by/4.0/).