Abstract
This paper presents a machine learning model to predict the effect of Al2O3 nanoparticle content on the coefficient of thermal expansion in Cu-Al2O3 nanocomposites prepared using an in situ chemical technique. The model developed is a modification of Long Short-Term Memory (LSTM) using dwarf mongoose optimization (DMO), which mimics the behavior of DMO to find its food for predicting the behavior of the composite. The swarm of DMO consists of three groups, namely the alpha group, scouts, and babysitters. Each group has its own behavior to capture the food. The preparation of the nanocomposite was performed using aluminum nitrate that was added to a solution containing scattered copper nitrate. After that, the powders of CuO and Al2O3 were obtained, and the leftover liquid was removed using thermal treatment at 850 °C for 1 h. The powders were consolidated using compaction and sintering processes. The impact of Al2O3 contents on the thermal properties of the Cu-Al2O3 nanocomposite was investigated. The results showed that the Thermal Expansion Coefficient (TEC) decreases with increasing Al2O3 content due to the increased precipitation of Al2O3 nanoparticles at the grain boundaries of the Cu matrix. Moreover, the good interfacial bonding between Al2O3 and the Cu may participate in this decrease in TEC. The proposed machine learning model was able to predict the TEC of all the produced composites with different Al2O3 content and was tested at different temperatures with very good accuracy, reaching 99%.
Keywords:
metal matrix nanocomposites; thermal properties; artificial neural network; dwarf mongoose optimization (DMO); long short-term memory (LSTM) MSC:
70
1. Introduction
Metal matrix nanocomposites are a new class of material with a high chance of success in many applications due to outstanding composite properties such as good mechanical strength and better creep resistance at elevated temperatures [1,2,3]. A combination of the metal matrix with nano-sized ceramic reinforcement has been characterized as a well-accepted description of metal matrix composites [4,5]. Copper and its alloys are used in applications where good wear resistance and high thermal and electrical conductivity are required, such as electrical connectors, sliding contacts, and integrated circuit sealing materials [6,7,8,9,10]. However, the highest coefficient of friction, low wear resistance, and strength reduced its application in heavy-duty applications.
To tackle this problem, research has been carried out to manufacture copper-based composites with high electrical and thermal conductivity, while retaining good strength, hardness, and wear behavior at elevated temperatures. Ceramic particles dispersion-strengthened copper, on the other hand, can maintain its strength at high temperatures [11,12]. Copper matrix composites with oxide dispersion strengthening (ODS) have better electrical and thermal conductivity, as well as improved yield strength and wear resistance. Even when heated to temperatures near the melting point of the metal matrix, the oxides rarely dissolve, and dispersion strengthening of composites can be sustained [13].
The researchers tried to tackle these problems by immersing ceramic particles in the Cu-matrix to improve thermal properties, such as adding Al2O3 [14,15], SiC [16], Graphene [17,18,19], ZrO2 [20,21,22,23], and WC [24,25] to it to provide a new material with a combination of metal and ceramic properties. A nanocomposite can improve mechanical, optical, magnetic, and thermal properties, making it useful in industries such as aerospace, automotive, electronics, sensors, catalysts, marine, chemical, biomaterials, and energy storage and conversion. The hardness or microhardness, wear, and corrosion resistance of Ni-Al2O3, Cu-Al2O3 [26,27,28,29], and Ni-TiO2 [30] metal matrix composites (MMCs) are found to be superior to the bare substrate. Hardness increased as the space between particles shrank, preventing dislocation movement and allowing more nanoparticles to be incorporated.
Powder metallurgy is one of the best techniques to manufacture metal matrix nanocomposites due to its low cost [31,32,33,34]. Despite this important advantage for the industry, the low dispersion of the reinforcement phase in the matrix limits its applicability. Researchers have recently employed in situ chemical processes to manufacture nanocomposite materials by employing the casting process to mix the nanoparticle reinforcement directly with the melted matrix [35,36,37,38]. They discovered that using this procedure improved the characteristics because there was no considerable agglomeration and effective distribution of nanoparticles occurred in the melt. Sadoun et al. [39] explored how alumina-coated silver particles affected the electrochemical performance and corrosion resistance of Cu-Al2O3 nanocomposites made via powder metallurgy. According to their findings, the relative density fell as the amount of Al2O3 rose, and the corrosion rate decreased until 9% Al2O3 reinforcement but increased thereafter. Rodrigues et al. [40] manufactured a Cu-Al2O3/graphene nanocomposite using a milling process for electromechanical applications. They reported that electrical and thermal stability was achieved after 4 h of milling. Additionally, the wear and mechanical properties of the produced composite were improved compared to unreinforced metal.
Owing to the advantages of artificial intelligence in providing solutions for very complex problems regardless of the availability of labs and the cost, it was deployed to predict the coefficient of thermal expansion of Cu-Al2O3 nanocomposites [41,42,43,44]. We trained the newly developed Long Short-Term Memory (LSTM) using experimental data obtained from abrasive wear tests to predict the response of these nanocomposites with different Al2O3 content with good accuracy.
In this work, thermal expansion and thermal conductivity are the most important properties of Cu and its composite and allow applications in many thermal and electrical fields. Here, we investigate the effect of Al2O3 nanoparticles on the thermal properties of Cu-based nanocomposites. We deployed an in situ chemical method to manufacture Cu-Al2O3 nanocomposites with different Al2O3 content. The microstructure and thermal properties of the produced nanocomposites were characterized. Moreover, we developed Long Short-Term Memory (LSTM) to predict the coefficient of thermal expansion of the produced nanocomposites. This modification of LSTM depends on using a new meta-heuristic technique, named dwarf mongoose optimization (DMO) [45], which is used to determine the parameters of LSTM to find the best configuration. The main motivation behind using DMO is its ability to balance the exploration and exploitation during the search process of the feasible region and optimal solution. In addition, it has been applied to different global and engineering optimization problems. According to the obtained results, DMO established its efficiency in solving problems better than competitive algorithms.
The proposed algorithm was trained using 70% of the experimental results obtained from composites with different Al2O3 content tested at different temperatures, while the other 30% of the data were used to test it. The development of these composites with optimum thermal expansion combined with good mechanical and wear properties will increase their applicability in thermal applications such as heat sinks.
2. Machine Learning Models
In this section, we present the basic concepts of Long Short-term Memory, Dwarf Mongoose Optimization (DMO), and the proposed model.
2.1. Long Short-Term Memory
Long Short-term Memory (LSTM) [1] is a gradient-based recurrent neural network architecture that solves typical recurrent neural networks’ vanishing gradient problems. Long-term dependencies in texts are a problem that develops during the training phase of a conventional RNN when backpropagation through the time gradient descent tends to evaporate, or in rare situations, explode exponentially.
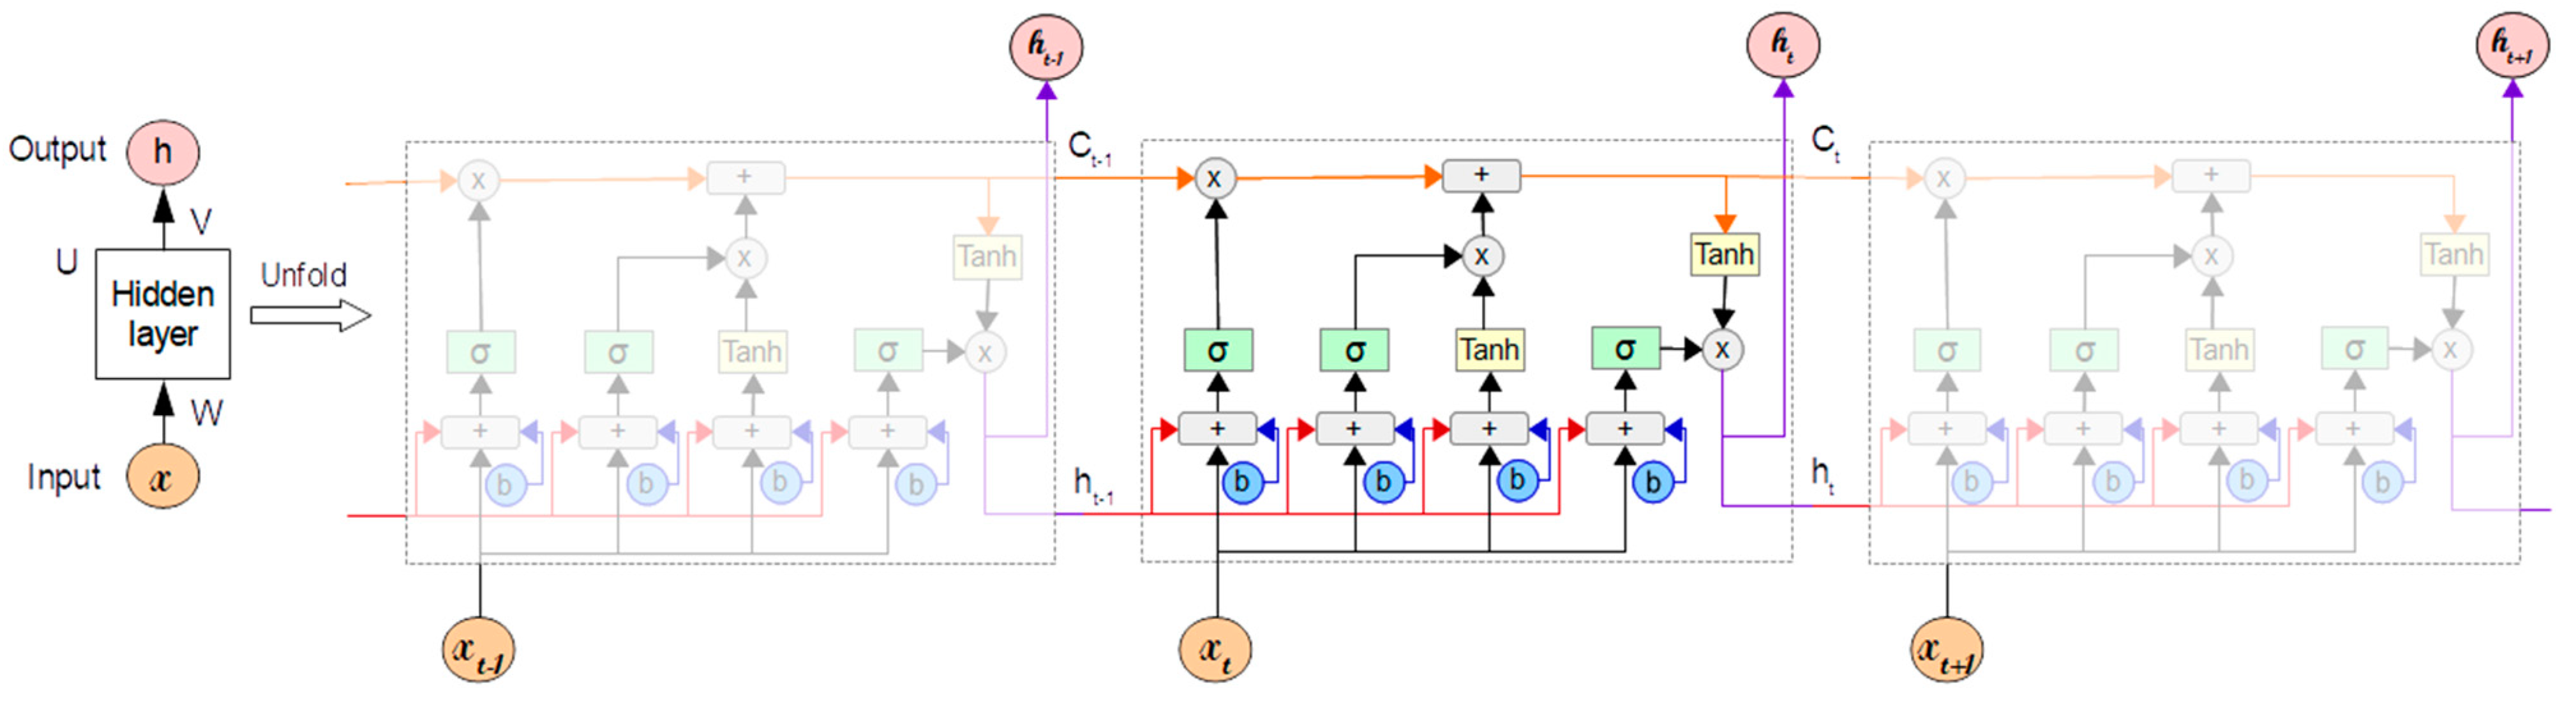
Because of its architecture, as illustrated in Figure 1, LSTM is able to properly manage long-term dependencies in the text. This architecture allows it to store information for long periods of time, which is something that the normal RNN struggles with. The LSTM network is made up of a series of recurrently connected memory cells that use the idea of gating, which is a technique that adds or removes information to control the cell state of each individual memory cell [2]. Each LSTM is made up of three gates: Input, forget, and output. Each gate is made up of a sigmoid neural network layer and a pointwise multiplication operation.
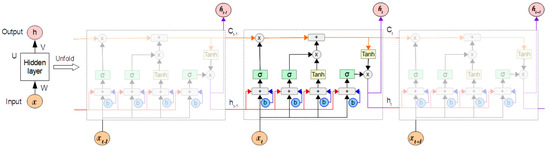
Figure 1.
Long Short-Term Memory neural network structure.
Using X as the input vector at time and as the number of LSTM cells in the forward pass, the input from the current state and the hidden state of the previous cell is first passed to the forget gate, as shown in Figure 1, to determine whether to store the information with an output of 1 or discard it with an output of 0 (Equation (1)). The fundamental purpose of forget gates is to decide whether or not to forget the knowledge. The sigmoid activation function output (σ) of the sum of the bias () and the product between the weights () and the inputs (, ), which comprises the input from the previous state () and the current input (), is the forget value (), which is between zero and one.
The next step is to use the update of the cell state () using the following equation
where represents the output of the tanh function, which uses , , , and , and this formulated as
In Equation (2), refers to the output of the sigmoid layer defined as:
Thereafter, the sigmoid activation output () is computed using Equation (5) and depends on the current input (), previous state (), weights (), and bias ().
The next process is to update the hidden state () using Equation (6).
2.2. Dwarf Mongoose Optimization Algorithm
In this section, the mathematical model of Dwarf Mongoose Optimization (DMO) is introduced [45]. This algorithm simulates the behavior of the dwarf mongoose when finding its food. In general, DMO begins by setting the initial value for a set of solutions using the following formula:
where is a random number generated from [0,1]. and are the limits of the search domain. The swarm of DMO consists of three groups, namely the alpha group, scouts, and babysitters. Each group has its own behavior to capture the food, and the details of these groups are given as follows:
2.2.1. Alpha Group
The fitness of each solution is computed once the population has been initiated. Equation (8) calculates the likelihood value for each population fitness, and the alpha female () is chosen based on this probability.
corresponds to the number of mongooses in the alpha group. The number of babysitters is denoted by bs. Peep is the vocalisation of the dominant female that keeps the family on track.
Each mongoose sleeps in the first sleeping mound, which is set to . The DMO employs the expression in Equation (4) to generate a candidate food position.
The sleeping mound is provided in Equation (10) after each repetition, where is a uniformly distributed random value [–1,1].
Equation (11) contains the average value of the sleeping mound.
Once the babysitting exchange criterion is met, the algorithm advances to the scouting phase, where the next food source or sleeping mound is considered.
2.2.2. Scout Group
Because mongooses are known to not return to past sleeping mounds, the scouts look for the next sleeping mound, ensuring exploration. For our model, scouting and foraging are performed at the same time, as explained in [36]. This movement is modeled after a successful or unsuccessful search for a new sleeping mound. In other words, the migration of the mongooses is contingent on their total performance. The reasoning for this is that if the family forages far enough, they will come to a new sleeping mound. The scout mongoose is represented by Equation (12).
where exemplifies an arbitrary number in the range , where the parameter that regulates the mongoose group’s collective-volitive movement is decreased linearly as the iterations progress. where the mongoose’s movement to the new sleeping mound is determined by this vector.
2.2.3. Babysitters Group
Babysitters are usually inferior group members that stay with the young and are cycled on a regular basis to allow the alpha female (mother) to lead the rest of the group on daily foraging expeditions. She usually comes back to milk the young in the afternoon and evening. The number of babysitters is proportional to the size of the population; they influence the algorithm by reducing the total population size based on the percentage set. By lowering the population size by the percentage of babysitters, we may replicate this group. The scouting and food source information previously held by the family members replacing them is reset using the babysitter exchange parameter. The babysitters’ fitness weight is set to zero, ensuring that the alpha group’s average weight is reduced in the next iteration, obstructing group movement and intensifying exploitation. Algorithm A1 contains the pseudocode for the suggested algorithm (see Appendix A).
2.3. Proposed Model
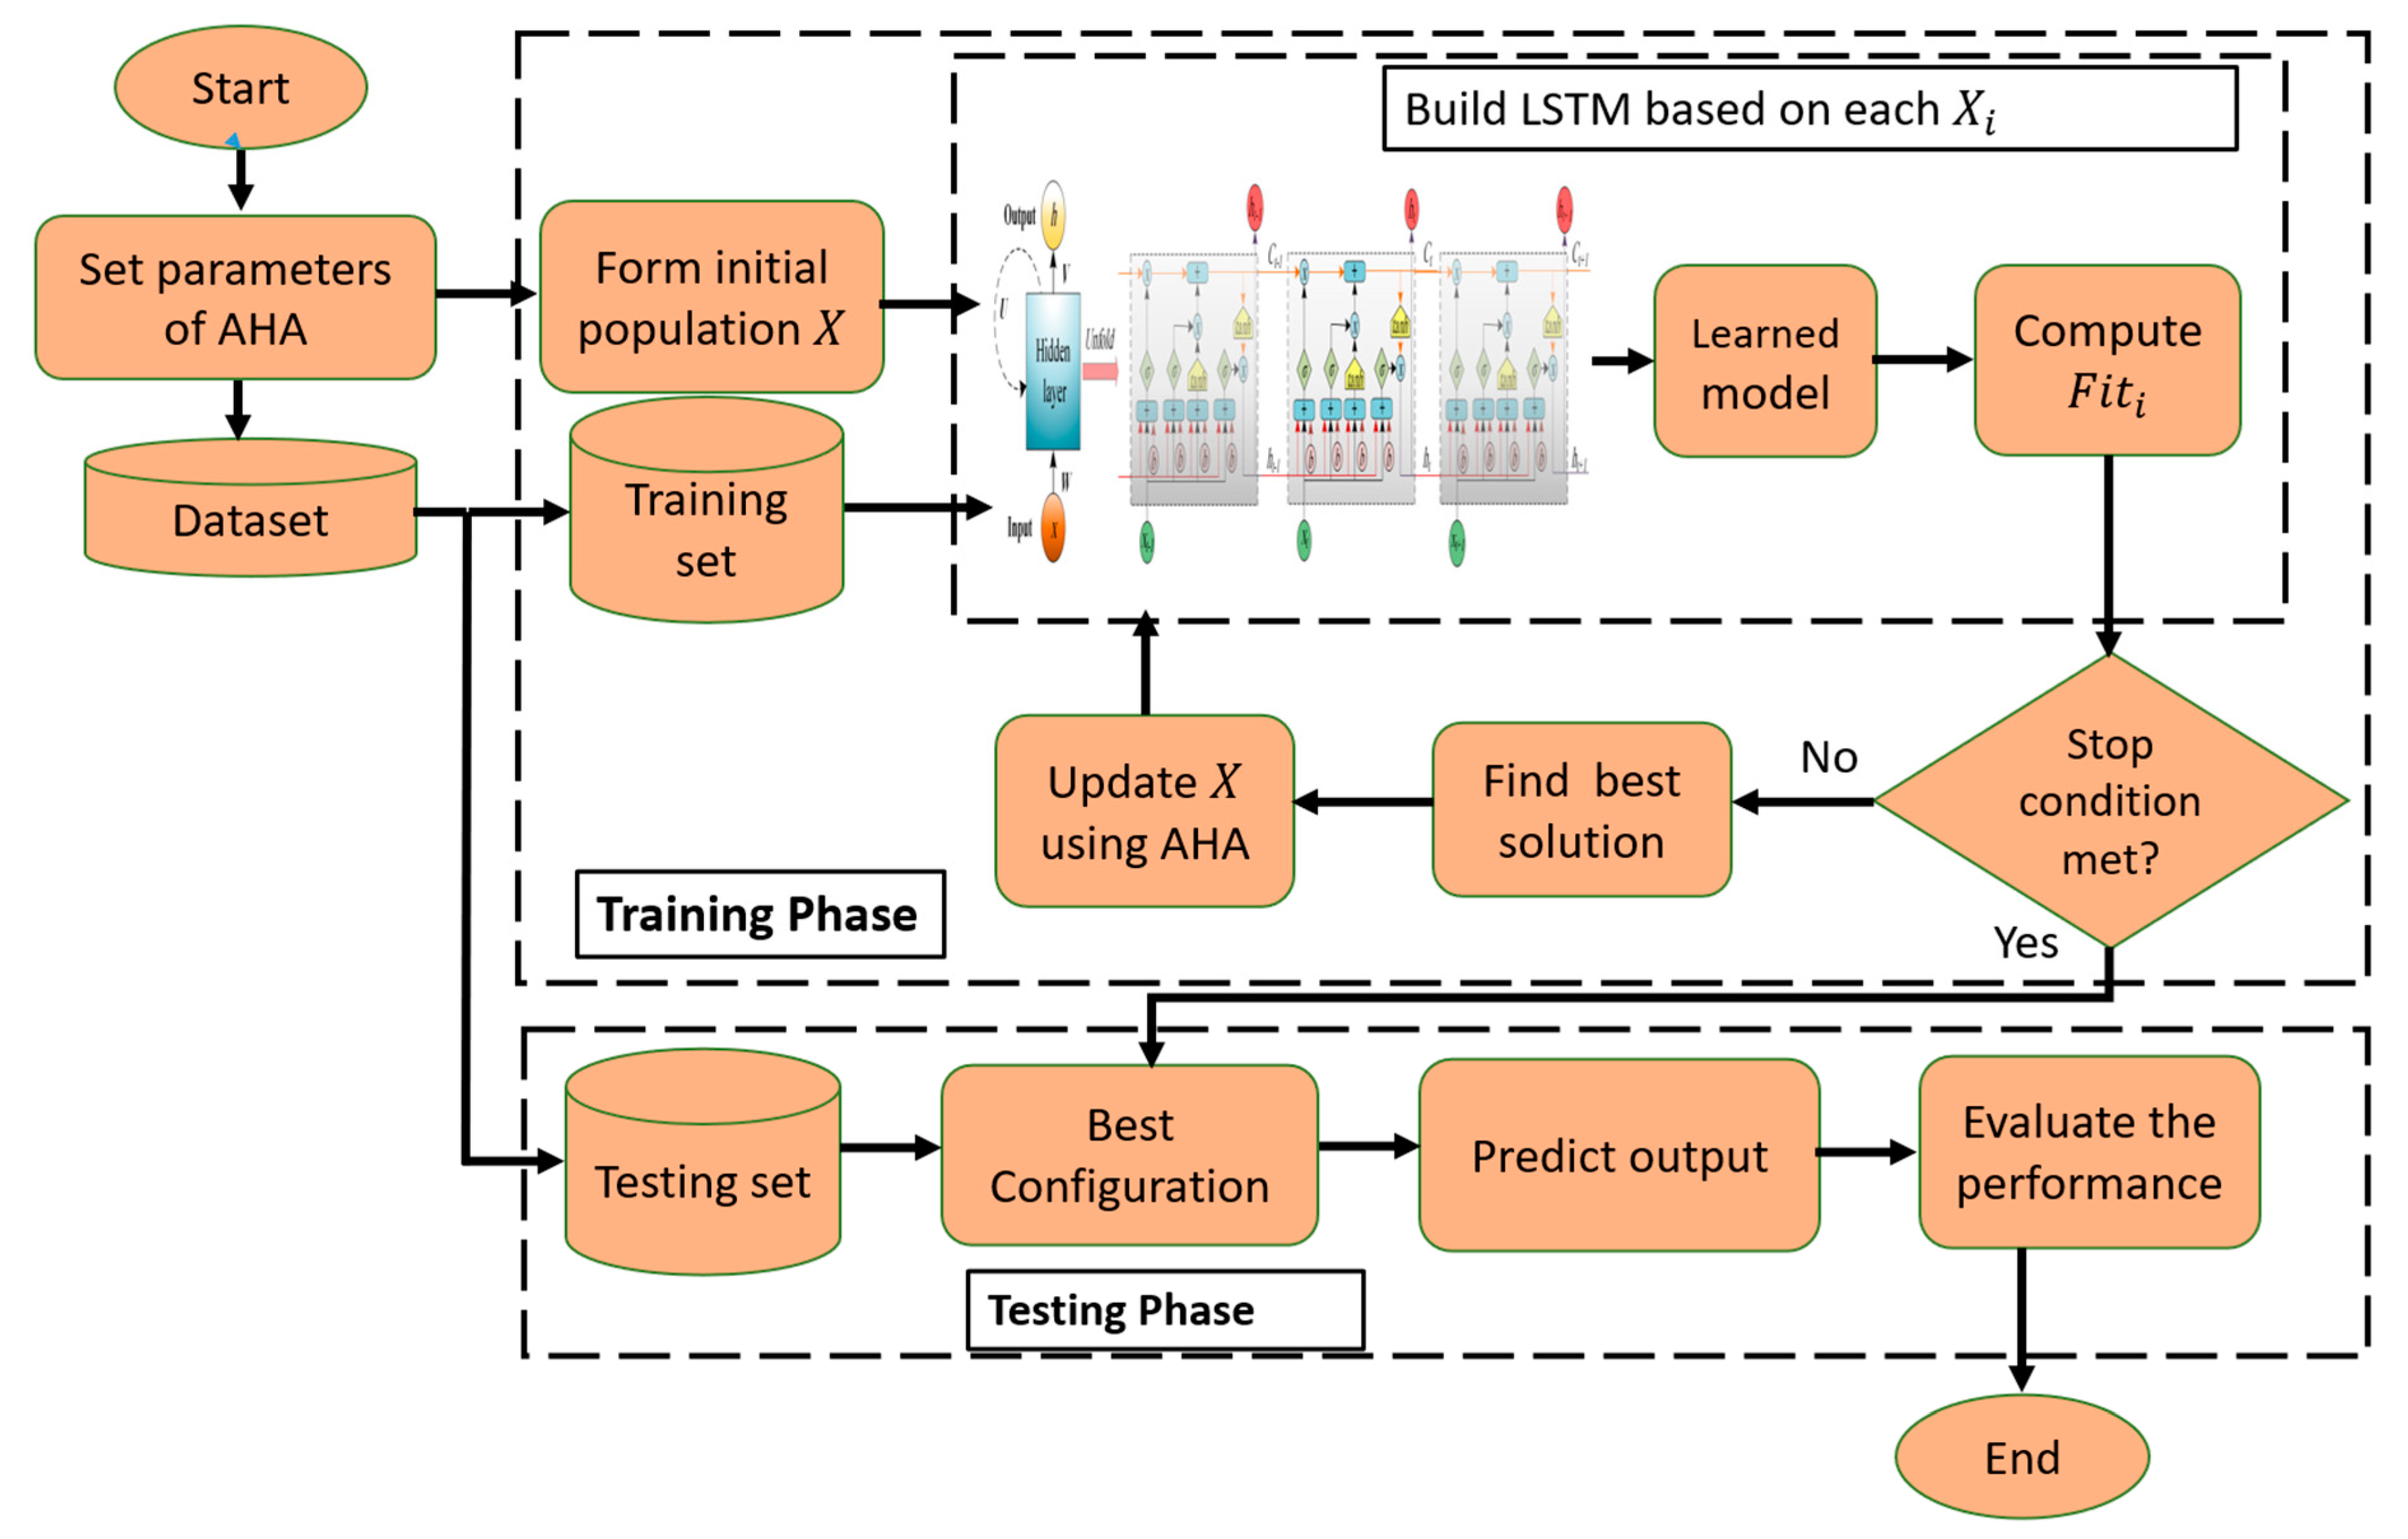
The steps of the prediction thermal model are given in Figure 2. In general, the presented model, named LSTM-DMO, depends on using the behavior of the DMO algorithm to determine the parameters of the LSTM network.
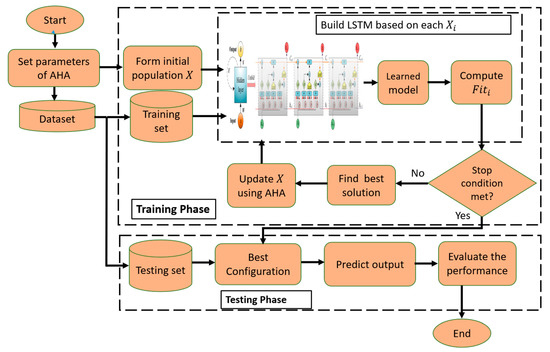
Figure 2.
Structure of LSTM-DMO model.
The first step in LSTM-DMO is to form the initial solutions, which represent the value of each parameter of LSTM using the following equation:
In Equation (13), and represent the boundaries of each parameter of LSTM, whereas refers to the number of parameters in . We set since there are five parameters that need to be determined, which include Max Epochs (, the optimization method (), the Minimum Batch Size (), the Learn Rate Drop Factor (), and the number of Hidden Units (). In addition, represents the stochastic gradient descent with momentum (SGDM), RMSProp, and Adam optimizer, respectively. 20,200], , , and . For clarity, let , which means that RMSProp is used as the optimization algorithm with , , , . From this example, it can be observed that the DMO algorithm is modified to deal with mixed values (i.e., integral and decimal), and this is not included in the original implementation of DMO.
The next step is to use the following formula as an objective function to assess the performance of output obtained using the training set, representing 70% of input data, and the current parameters of LSTM .
where is the number of cases of the training set with the target . Thereafter, the best solution is determined, and we use the operators of DMO to update other solutions as in the Equations. This updating stage is conducted until reaching the stop conditions, then returning the best solution. Using the testing set, which represents 30% of the input data, we evaluate the performance of the obtained best solution using performance metrics.
2.4. Prediction of Thermal Expansion Using the Improved LSTM Model
To validate the performance of LSTM-DMO as a prediction model, we use a set of performance metrics including the root mean square error (RMSE), mean absolute error (MAE), and coefficient of determination R2. The definition of these metrics is formulated as:
In Equations (15)–(17), represent the number of testing/training samples, the observed value, the predicted value, the average of observed values, and the average of predicted values, respectively.
3. Experiments
The in situ chemical process was used to synthesize Cu-Al2O3 nanocomposite powder from water-soluble copper Cu(NO3)2·H2O and aluminum nitrates Al(NO3)3·9H2O. The in situ chemical process comprises several steps as Cu(NO3)2·3H2O and Al(NO3)3·9H2O were dissolved in water using a magnetic stirrer at 70 °C for 30 min. The salt concentrations were chosen to produce a Cu-Al2O3 nanocomposite system with 2.5, 7.5, and 12.5 wt.% Al2O3. Then, to obtain nitrate salt powder precursor particles, dry spraying was performed with a sprayer at 180 °C. Copper oxide (CuO) and aluminum oxide (Al2O3) phases were obtained via oxidation of the powder at 850 °C for 1 h in an air atmosphere. Finally, reduction of the powders in hydrogen for 30 min at 500 °C. The reactor was then cooled in a high-purity argon environment to prevent oxidation, with copper oxide reduced to its metallic state and Al2O3 remaining as the scattered ceramic phase.
To consolidate the samples, powders were placed inside a steel die and then cold-pressed at a pressure of 700 MPa. Finally, sintering of the compacted samples was performed for 2 h in hydrogen gas at a temperature of 900 °C. The crystal structure and the phase composition of the used powders and the fabricated nanocomposites were identified by X-ray diffraction (XRD) with the model D8 Kristalloflex. We used a Field Emission Scanning Electron Microscope (FE-SEM; QUANTAFEG250) with energy dispersive X-ray (EDX) spectrometers attached to characterize the morphological changes in the powder and consolidated samples. EDX analysis was performed to examine the composition of the fabricated nanocomposites. According to MPIF standards 42, 1998, and using distilled water, the Archimedes method was used to evaluate the densities of the produced samples. The electrical conductivity of the nanocomposites was measured using PHYWE SYSTEME GMBH 37070 Gottingen, Germany. Based on the results of the electrical conductivity, values of the thermal conductivity were determined by the Wiedemann–Franz equation [46].
where is the thermal conductivity (W/mK), σ is the electrical conductivity Ω·m−1, T is the absolute temperature in degrees Kelvin (293 K), and L is the Lorentz number = 2.44 × 10⁻⁸ W·Ω·k−2. A digital indicator and electrical furnace were used to measure the coefficient of thermal expansion (CTE). A temperature range between 50 °C and 600 °C was applied with equal heating and cooling rates, 3 °K/min, in an argon atmosphere.
4. Results and Discussion
4.1. Structural and Thermal Properties
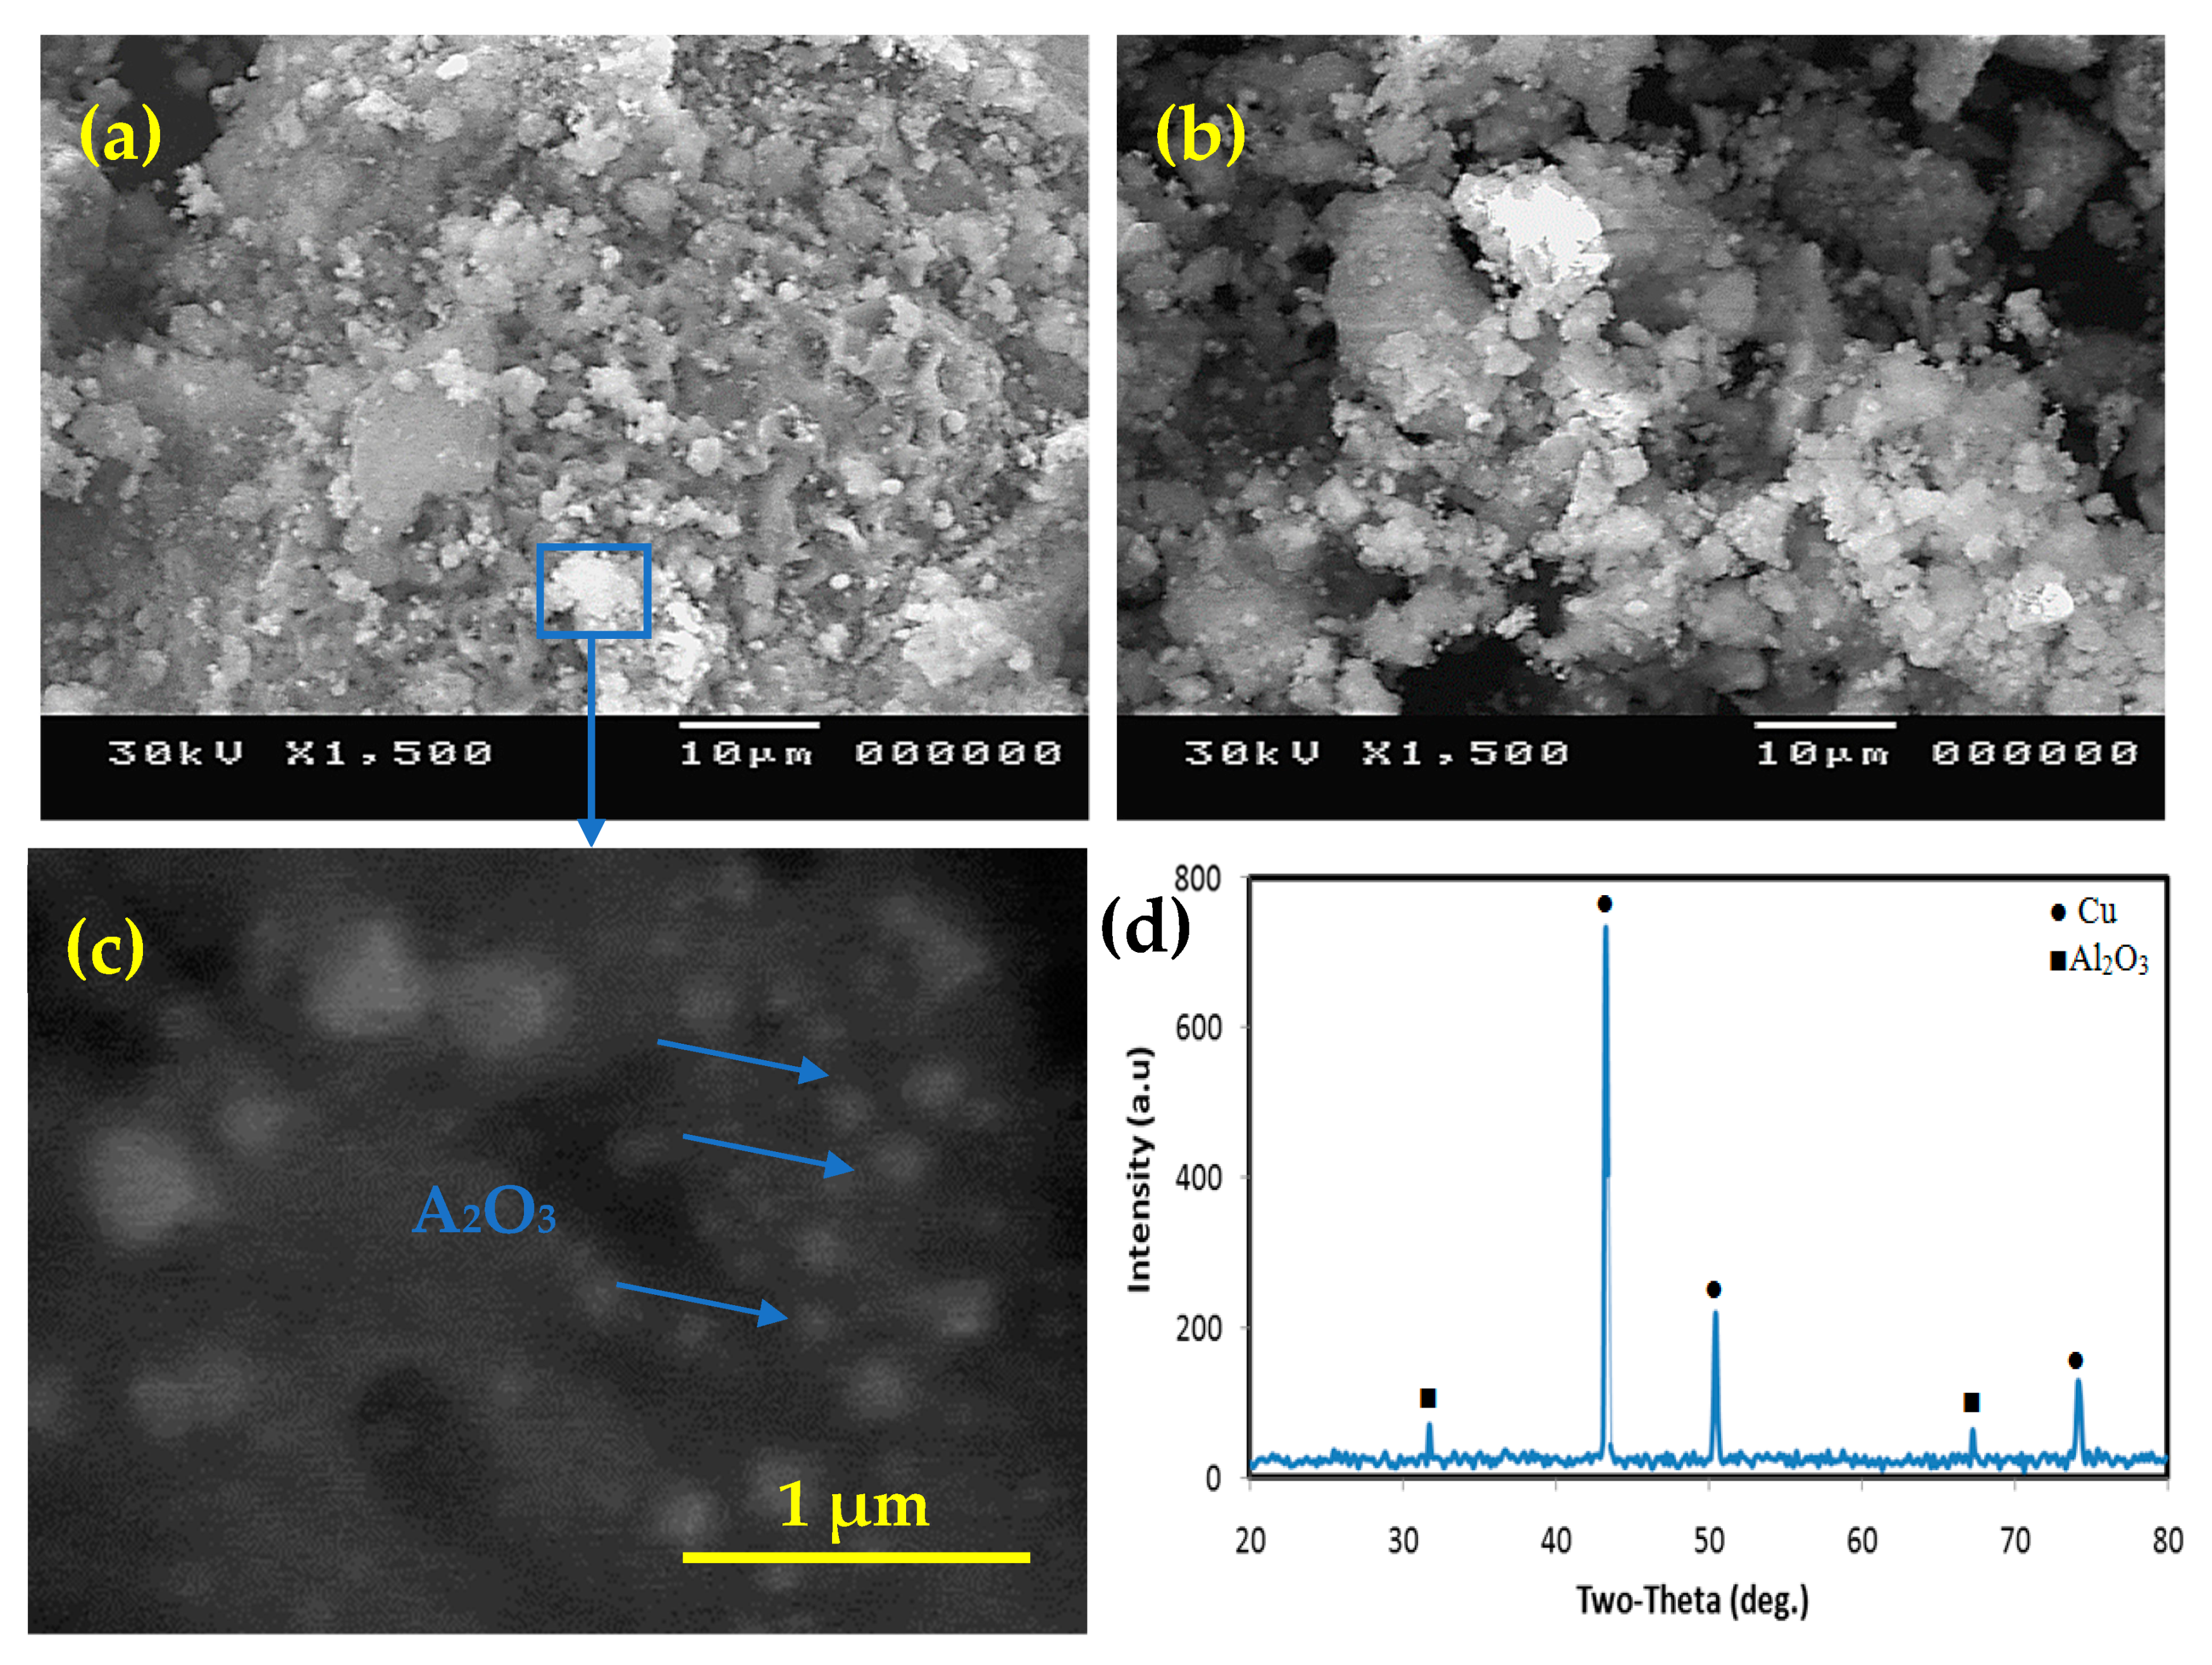
Figure 3 shows the morphology of the produced powders with different Al2O3 contents after deoxidization. As seen in Figure 3a, the particles cluster together to form large particle groups with an average particle size of less than 200 nm. The generated particles’ roughly spherical shape improves wettability throughout the phases [47,48,49,50,51]. The microstructure of solidified composites is influenced by the formation of reinforcing particles. Figure 3c depicts high magnification of the same composite, demonstrating that the particle size after the chemical procedure is nanoscale. The XRD examination of the nanocomposite powder in Figure 3d shows the presence of Cu and Al2O3 exclusively, with no other components accumulating throughout the chemical process. This provides proof of the manufacturing process’ authenticity as well as the composition of the materials produced.

Figure 3.
SEM micrograph of the nanocomposite powders; (a) Cu-2.5%Al2O3, (b) Cu-12.5%Al2O3, (c) enlarged image of the rectangular area marked in (a,d) XRD of Cu-12.5%Al2O3.
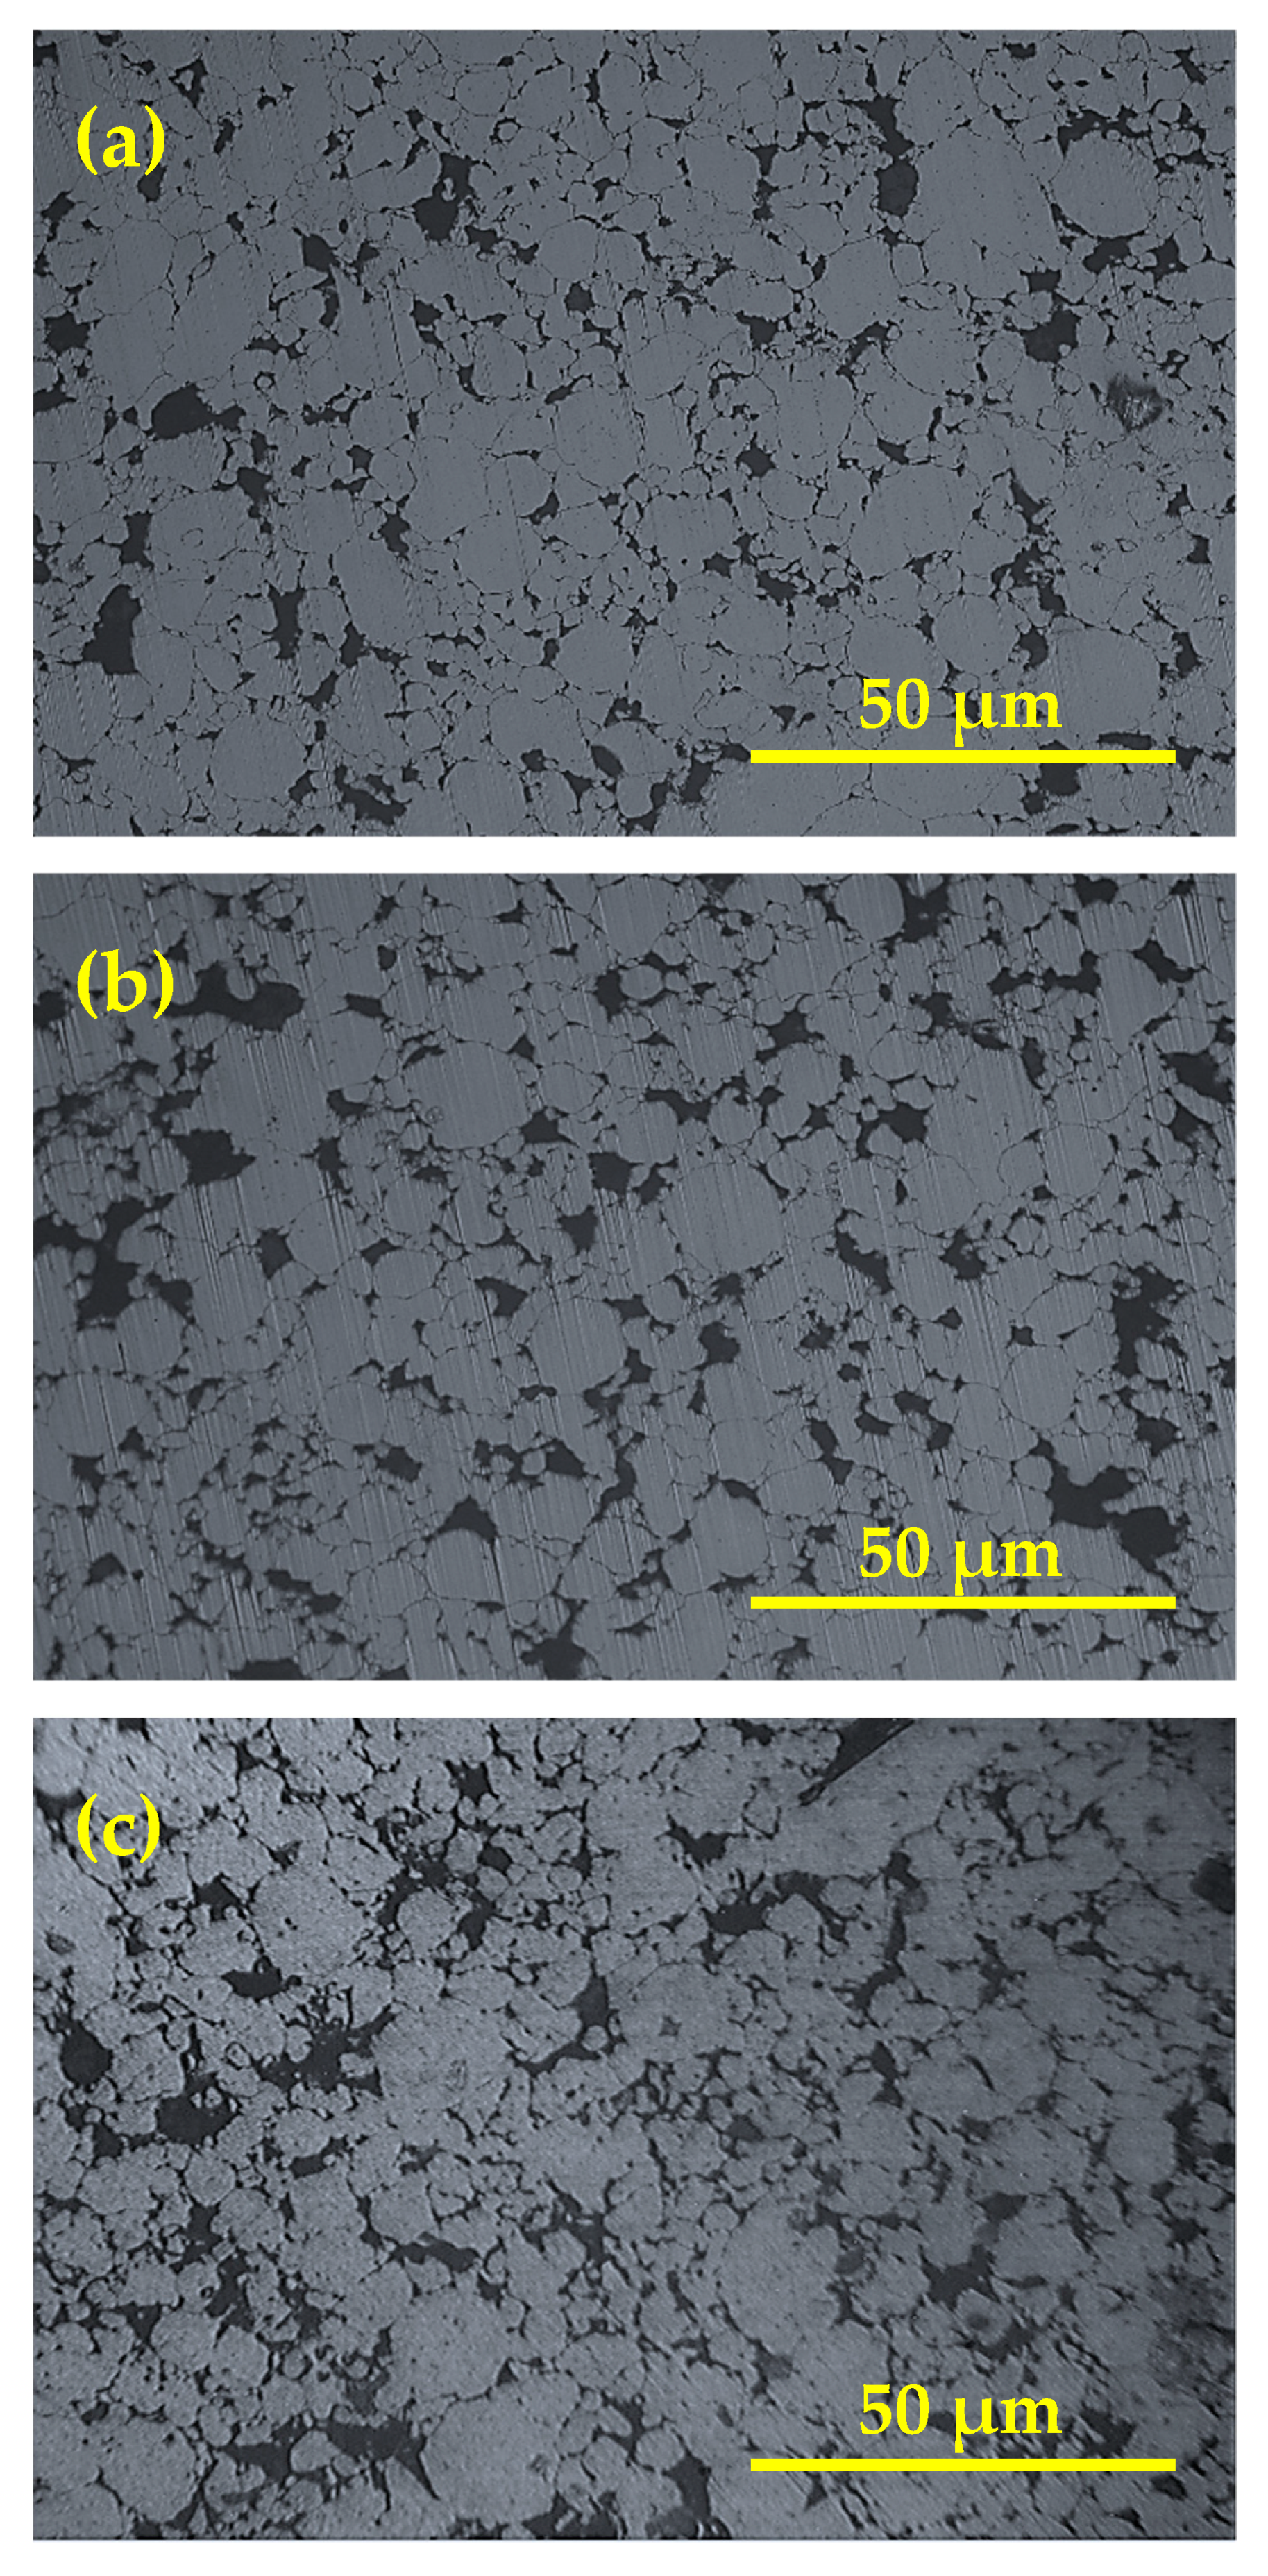
Figure 4 shows the morphology of the consolidated Cu-Al2O3 nanocomposite with different Al2O3 content. The figures generally reflect the good distribution of Al2O3 in all samples. The particle and grain sizes of Cu and Al2O3 are very small, reaching 100 nm, which makes the grain boundary relatively small around each grain. The presence of grain refinement in the samples is in accordance with the formation of voids as shown in Figure 4. This entrapped air is difficult to extract during sintering due to the good bond between Al2O3, resulting in a larger void content. Moreover, the large mismatch between the surface energy of Cu and Al2O3 particulates helps in the generation of voids at the interface between Al2O3 and Cu. However, this can be a mechanism of void generation. This can only contribute to the micro void formation, which will be clarified in the next subsection. Furthermore, some Al2O3 nanoparticles lay at grain boundaries, increasing the size of the grain boundary and improving its properties. The presence of Al2O3 at grain boundaries decreases the capacity of grains to re-weld during sintering, resulting in welded grains of a large size, similar to pure metal behavior. As a result, the presence of Al2O3 nanoparticles reinforces the grains by penetrating the grains’ lamellar structure and laying at the grain borders. The distribution of reinforcement in the matrix is another key element that influences the characteristics of nanocomposites.
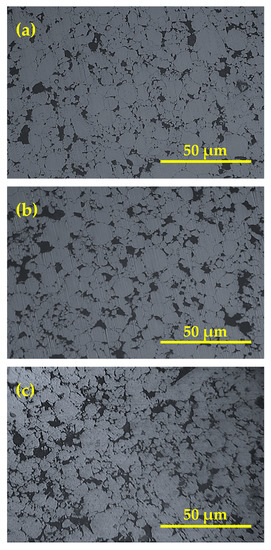
Figure 4.
Microstructure of Cu-Al2O3 nanocomposites; (a) Cu-2.5%Al2O3, (b) Cu-7.5%Al2O3, (c) Cu-12.5%Al2O3.
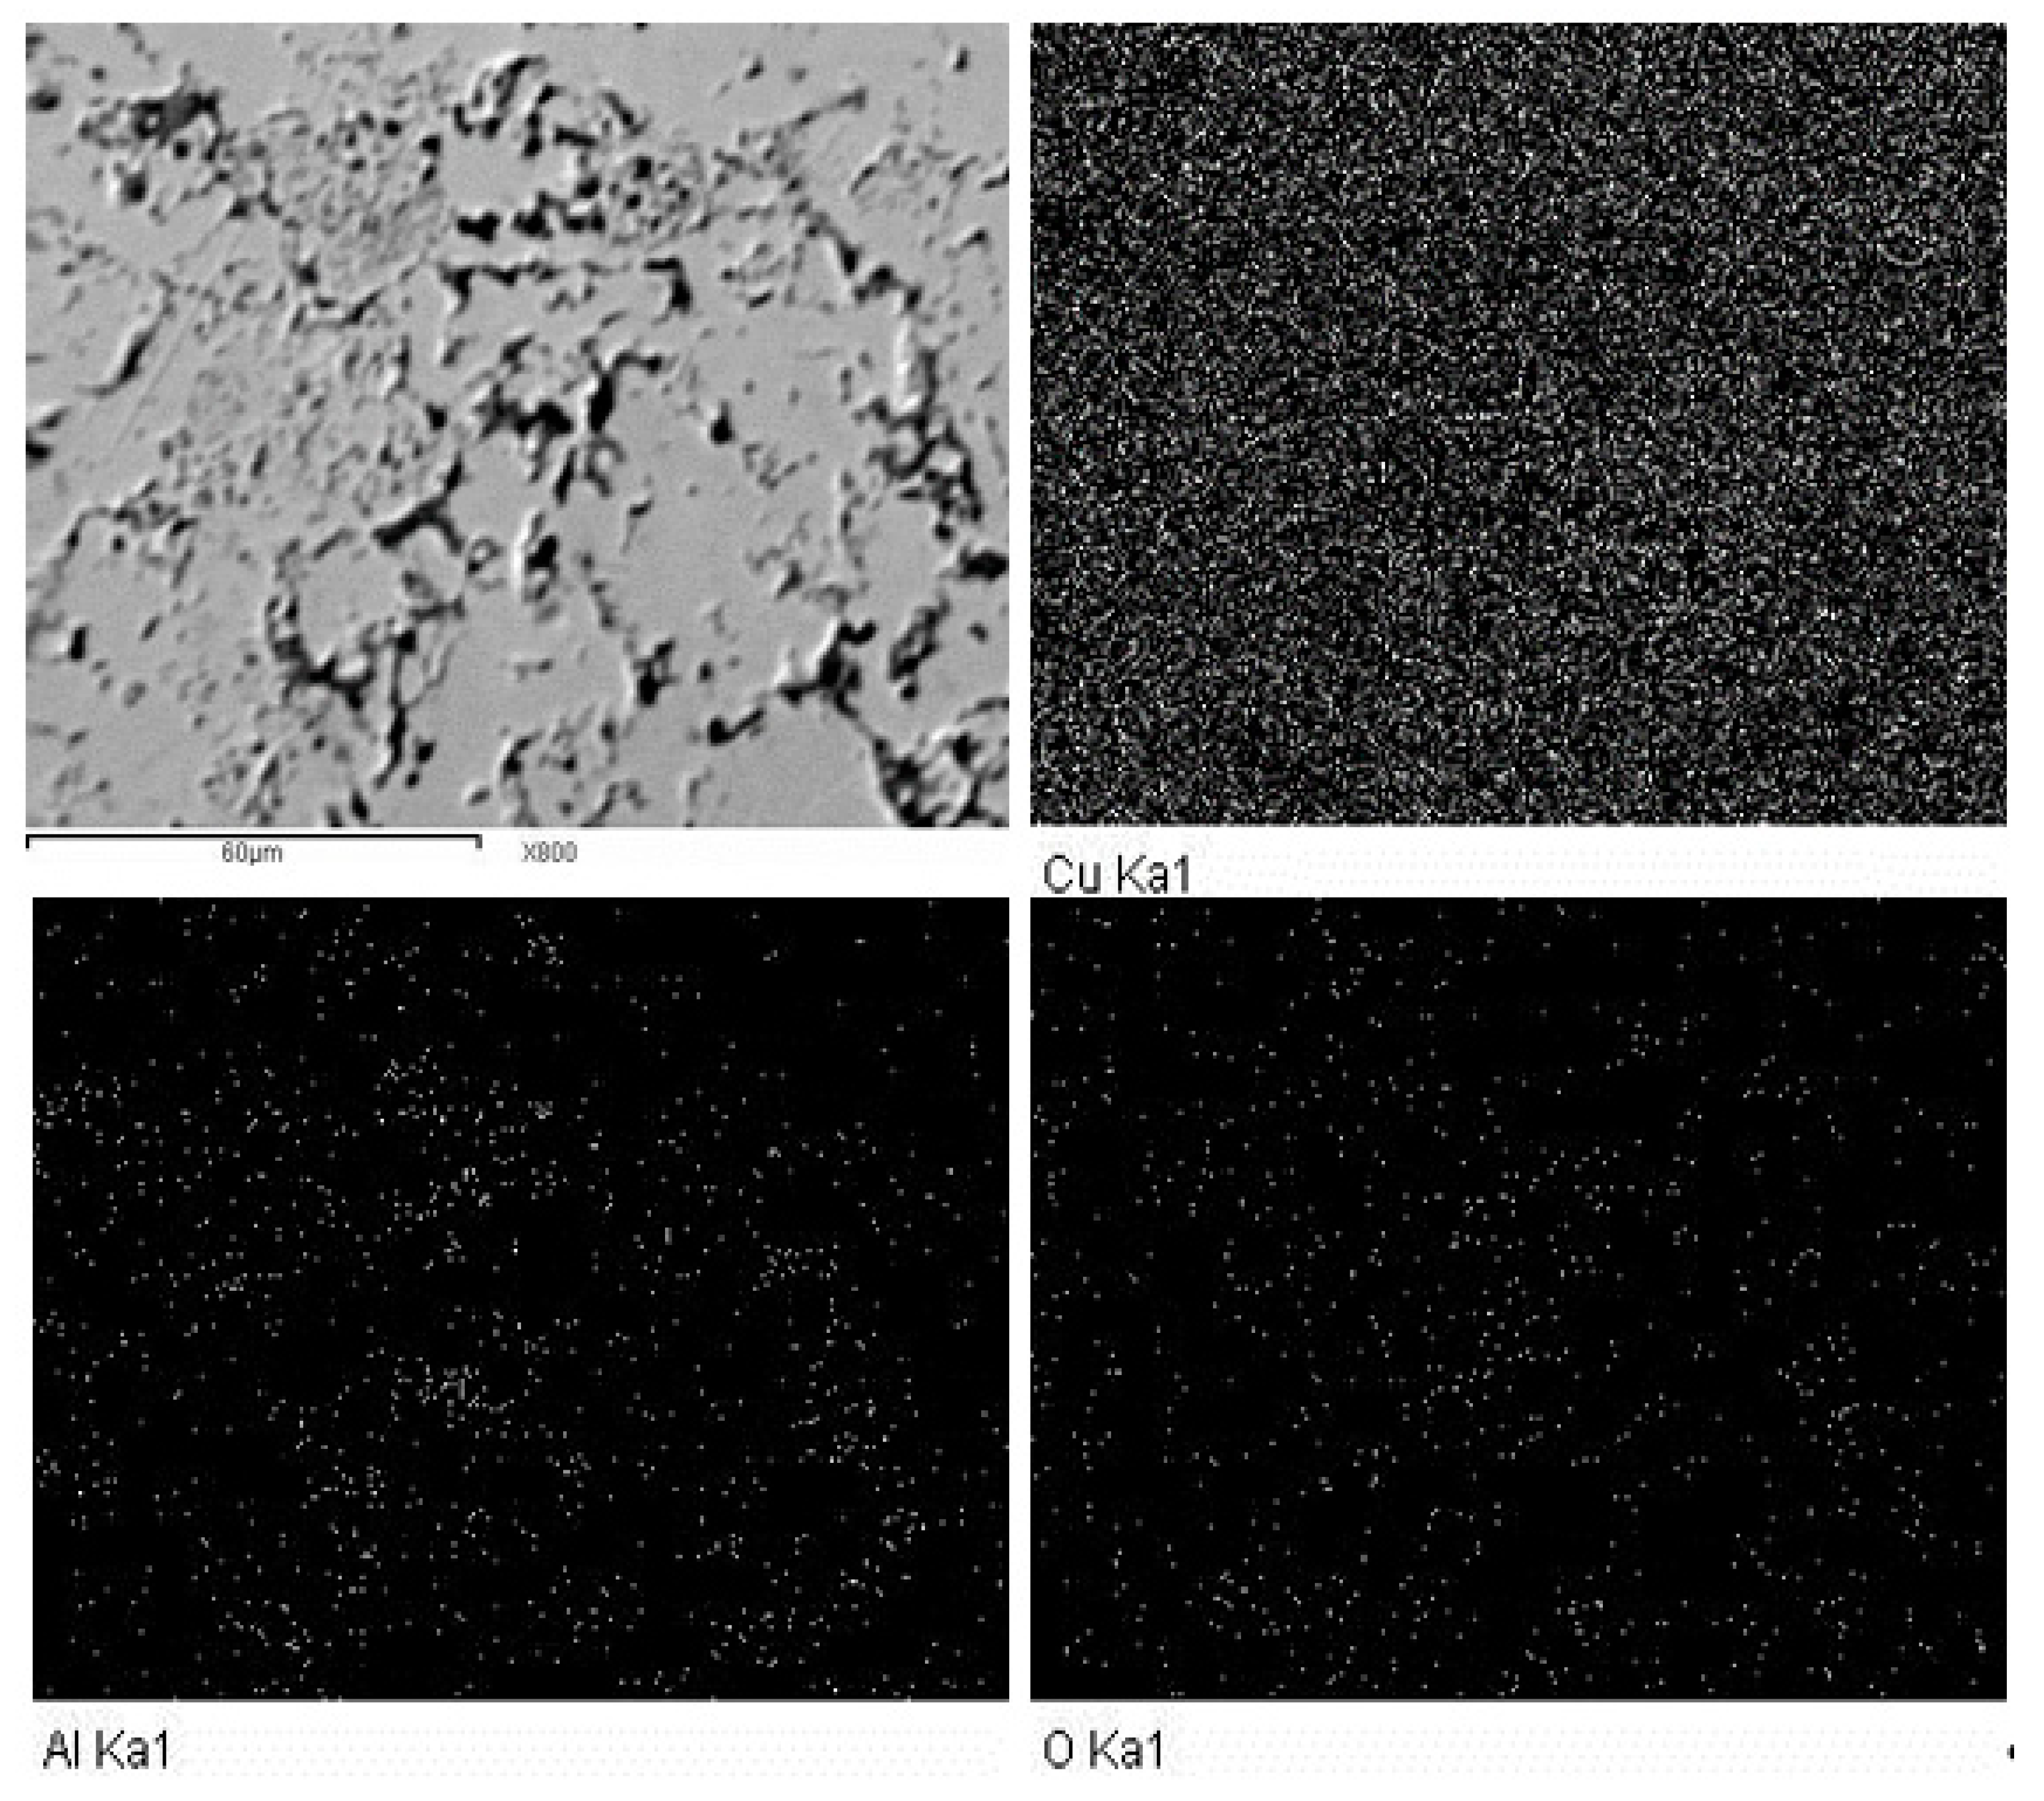
Figure 5 shows the mapping analysis of the Cu-12.5%Al2O3 nanocomposite with the elemental analysis of each component. The figure reflects the good distribution of the reinforcing phases in this composite with the complete absence of agglomeration at the nanoscale. The elemental analysis demonstrates that the sample’s composition is devoid of impurities, with Cu, Al, and O being the only elements discovered in the sample.

Figure 5.
Mapping and EDS analysis of Cu-12.5%Al2O3 nanocomposite.
Figure 6 shows the relative density measurements of the Cu-Al2O3 nanocomposite after the fabrication process. The density of the nanocomposite is decreased by increasing the content of the Al2O3 from 94.6 for the sample containing 0.0% Al2O3 to 88.2 for the sample containing 12.5% Al2O3. It is well known that reinforcing the matrix with light materials leads to a decrease in the density of the matrix [52,53]. Increasing the ceramic reinforcement percentage, especially that in the nano-size, increases the chance of producing agglomeration that, in turn, leads to a decrease in the density of the matrix.
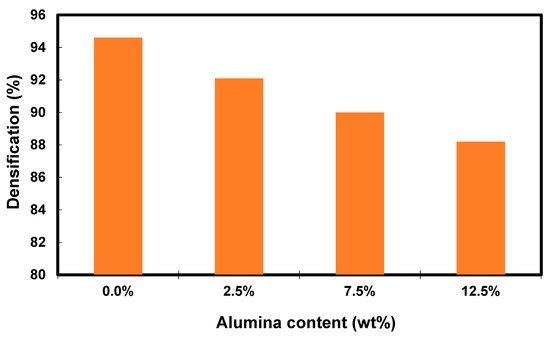
Figure 6.
Bar graph of densification of Cu-Al2O3 nanocomposites as a function of Al2O3 content.
Figure 7 simulates the electrical resistivity of the Cu-Al2O3 nanocomposites. The electrical resistivity is proportional to Al2O3 addition up to 12.5%, which was observed. As the figure illustrates, the electrical resistivity increases from 2.32 × 10⁻⁸ to 6.78 10−8 Ω. m for nanocomposites with 0% and 12.5 wt.% Al2O3, respectively. Increasing the electrical resistivity of the Cu-Al2O3 nanocomposites by increasing the amount of the Al2O3 up to 12.5 wt.% Al2O3 is attributed to more than one reason. The first reason is the homogeneous distribution of the Al2O3 inside the matrix, as shown in Figure 4. The second reason is the good adhesion between the Al2O3 and the matrix. Finally, it is related to the remarkable electrical properties of Al2O3. Furthermore, the higher porosity content caused by the presence of Al2O3 nanoparticles obstructs the free electron movement, increasing the nanocomposite’s resistivity over the Cu matrix [54,55].
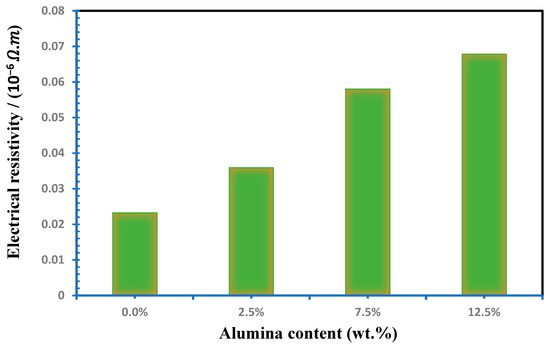
Figure 7.
Influence of Al2O3 contents on electrical resistivity of Cu-Al2O3 nanocomposites.
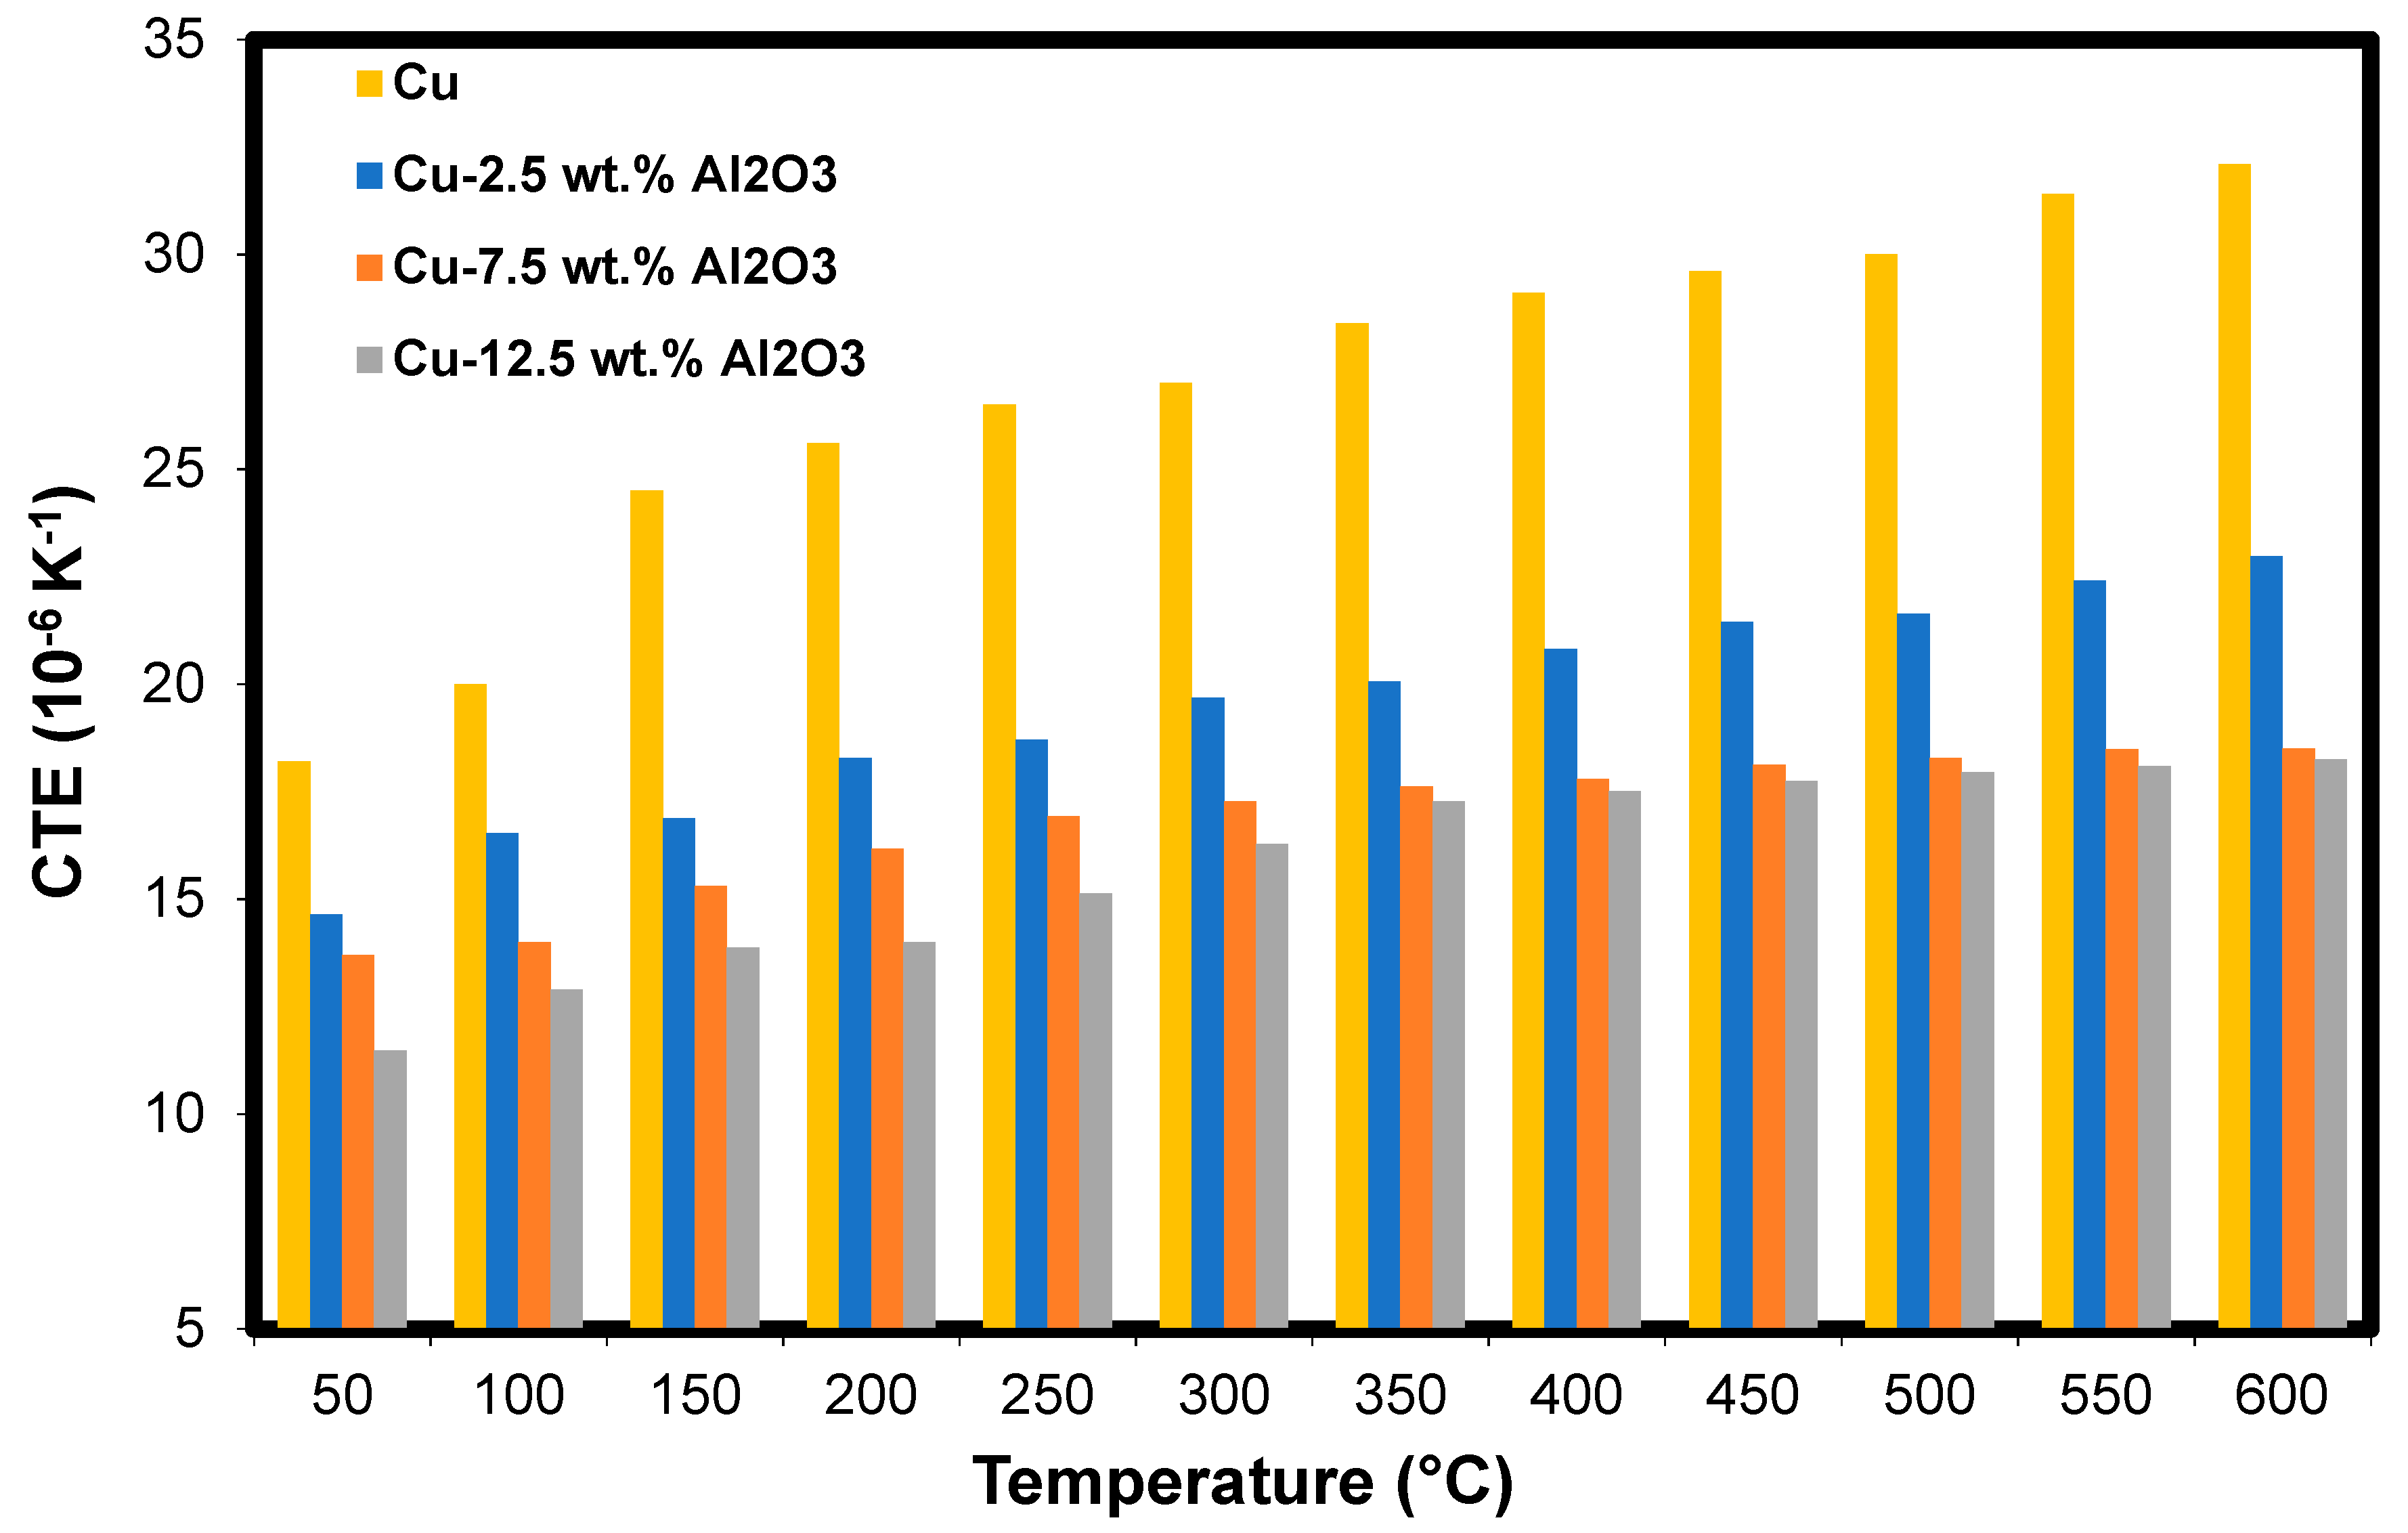
Figure 8 shows the thermal expansion coefficient (TEC) of the Cu-Al2O3 nanocomposites, with its different content of Al2O3, as a function of temperature. It is observed that for the different composites considered, the TEC increases as the temperature increases. This is because, as the temperature increases, the bonds between Cu particles were weakened and consequently allowed the grains to deform. This increase is due to the stronger oscillation of atomic bonds at higher temperatures and the asymmetric nature of the bond potential curves. Moreover, the internal thermal stresses increase with increasing temperature until reaching the material yield strength, which leads to plastic deformation of the samples [56]. This deformation occurred due to free-electron excitation during the temperature change. At high temperatures, this excitation is incapable of motivating the free electrons to move to higher paths. Therefore, these electrons remain in their original paths, which results in a similar effect on the TEC values.

Figure 8.
The coefficient of thermal expansion of the Cu-Al2O3 nanocomposites as a function of temperature.
In addition, Figure 8 shows the decrease in the TEC with the increasing Al2O3 content at the same temperature. This decrease is due to the existence of Al2O3 nanoparticles at the grain boundaries of the Cu matrix. Further, the good interfacial bonding between the Al2O3 and the Cu may participate in this decrease in TEC. Another reason for the decrease in TEC is the heat-induced thermal stresses of Cu-Al2O3 nanocomposites. As the temperature increases, tensile stresses increase in Al2O3 whilst the Cu particles are subjected to compression stress due to the difference in their own thermal expansion coefficients [56].
4.2. Prediction of Coefficient of Thermal Expansion
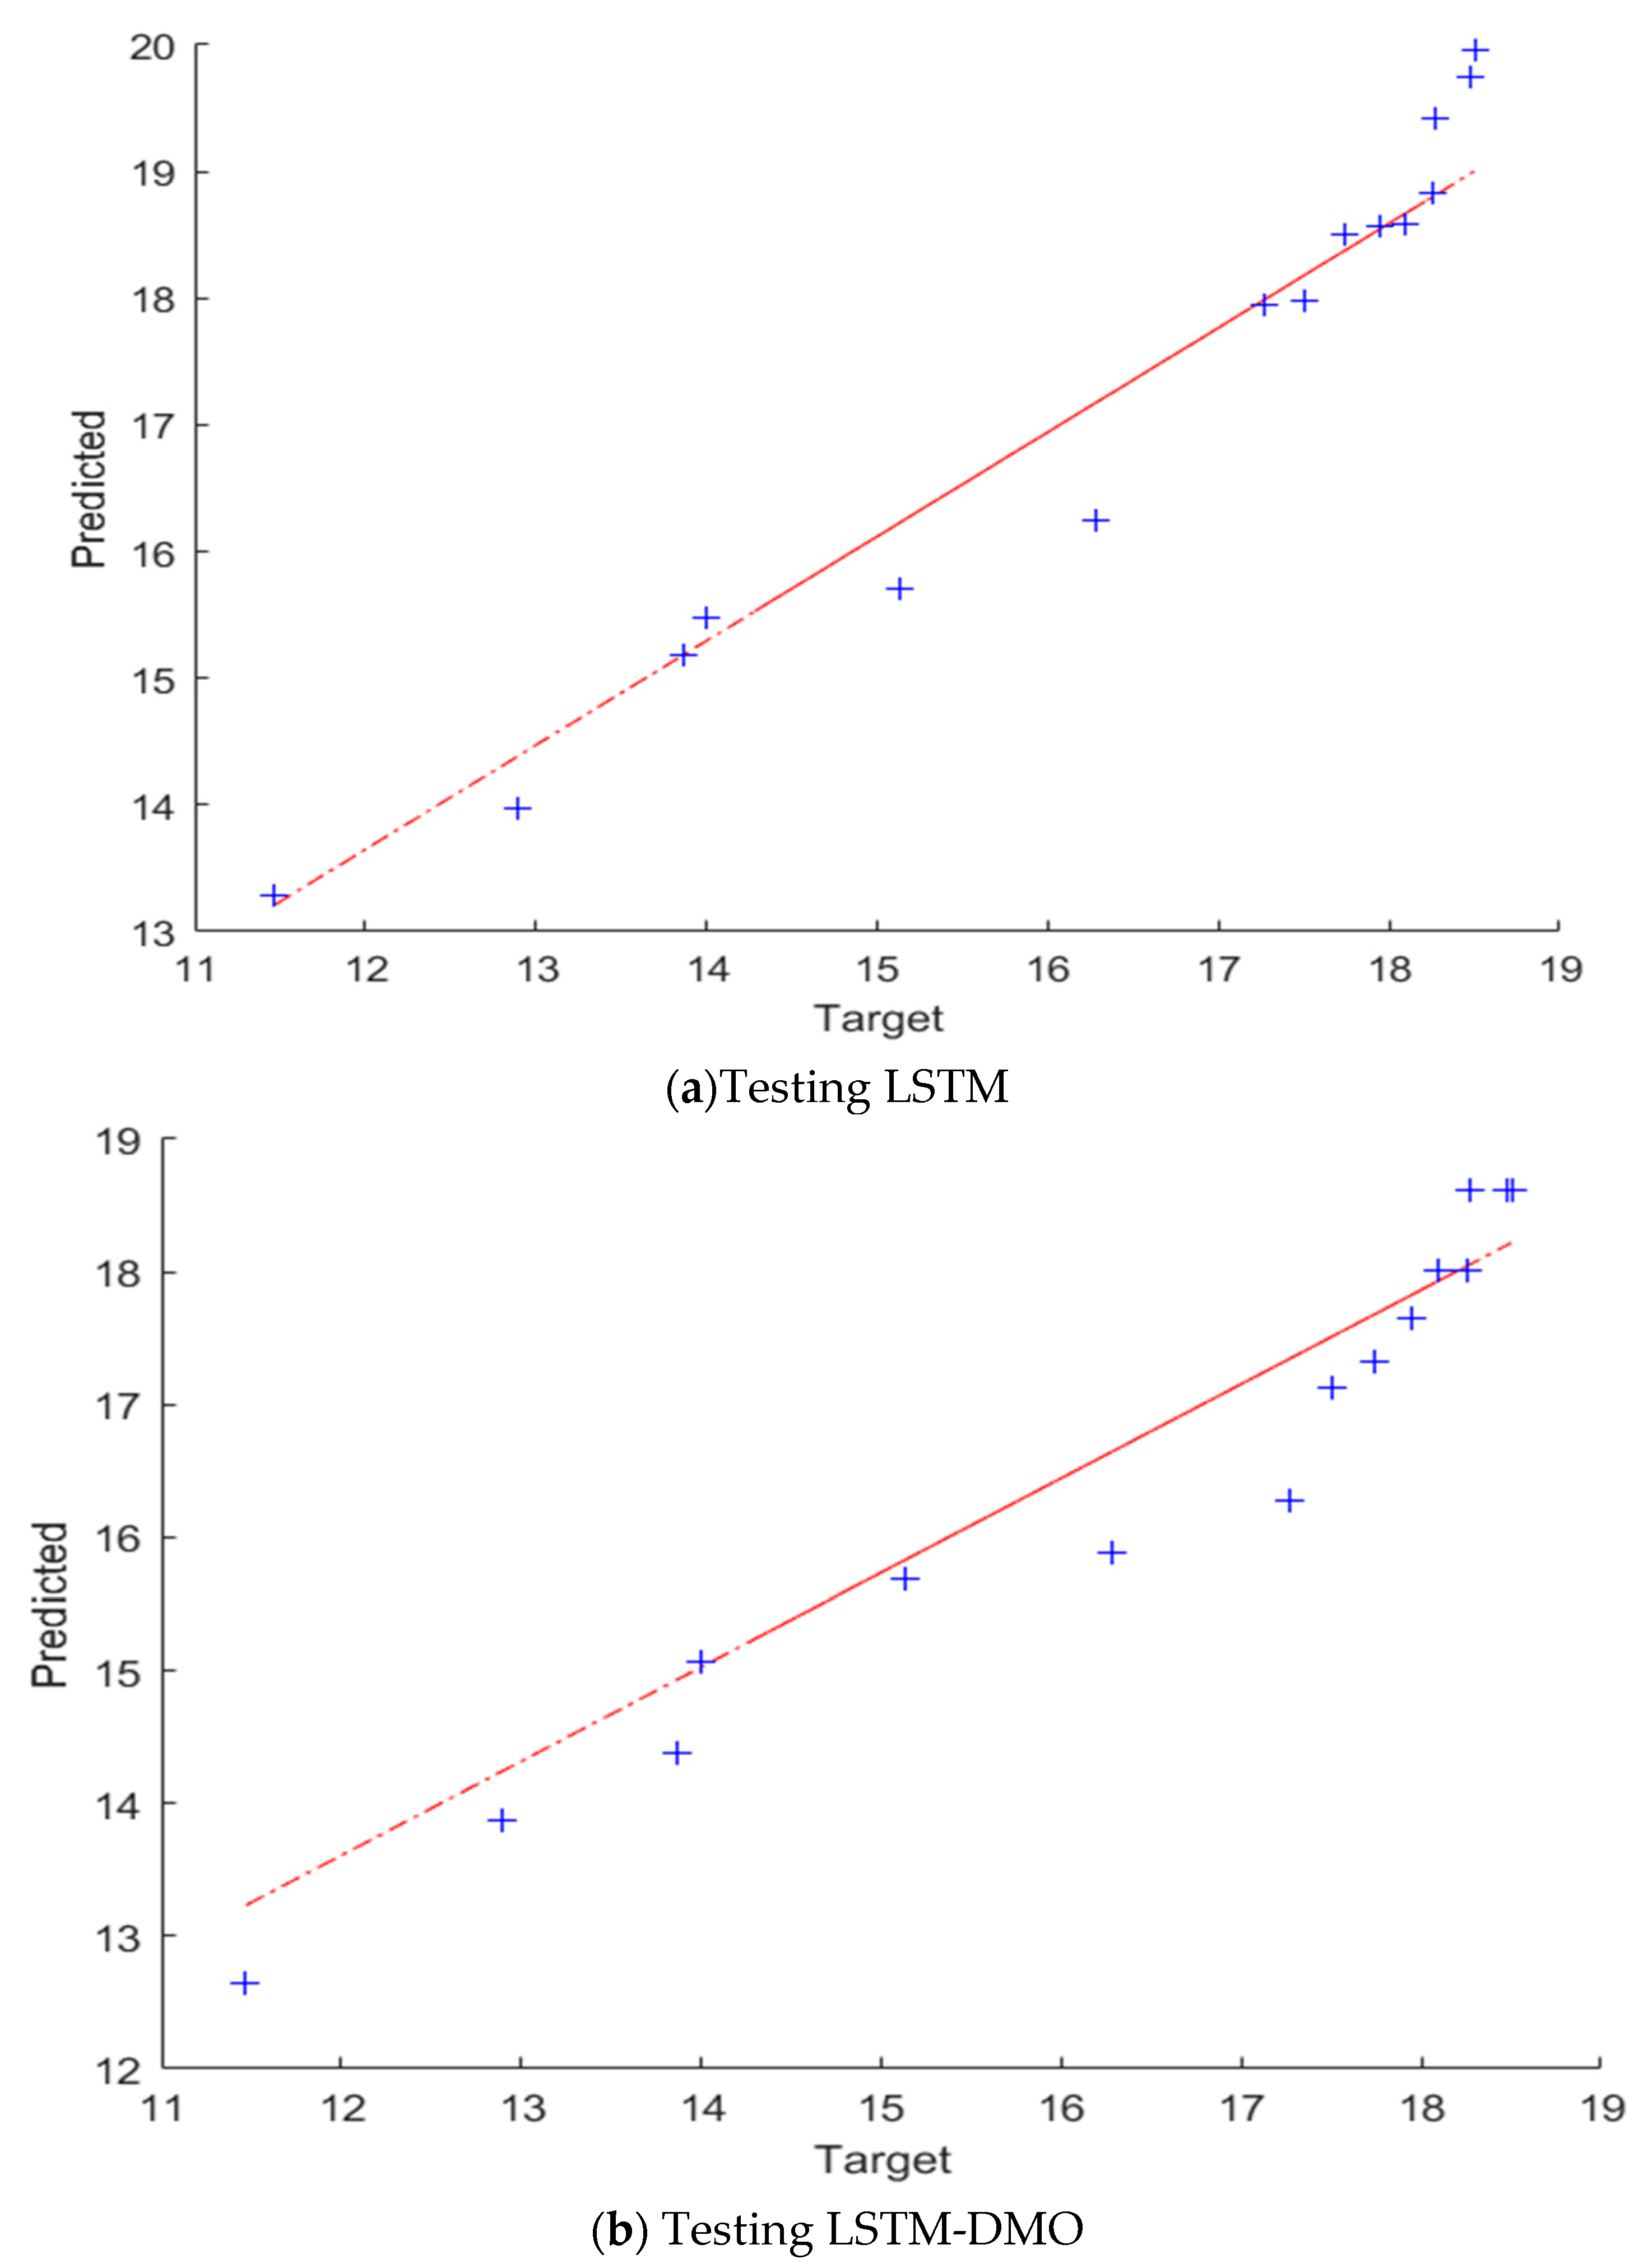
A comparison between the presented LSTM-DMO and the traditional LSTM is given in Table 1 and Figure 9. It can be noted from these results that the performance of LSTM-DMO is better than the traditional LSTM in both training and testing. For example, the R2 of LSTM-DMO is better than LSTM with a difference of approximately 6% in the case of the testing set, whereas the RMSE of LSTM is higher than LSTM-DMO with nearly 0.0955 and 3.0220 in training and testing stages, respectively. In the case of MAE, LSTM has a higher value than LSTM-DMO with nearly 0.0303 and 2.5280 in training and testing stages, respectively. For further analysis of the results, we use QQ plots to describe the correlation between the output and its predicted value, as shown in Figure 9. From this figure, we can observe that the developed LSTM-DMO is fitter than LSTM since the data are allocated around the straight line during the testing set.

Table 1.
Results of LSTM-DMO and LSTM models.
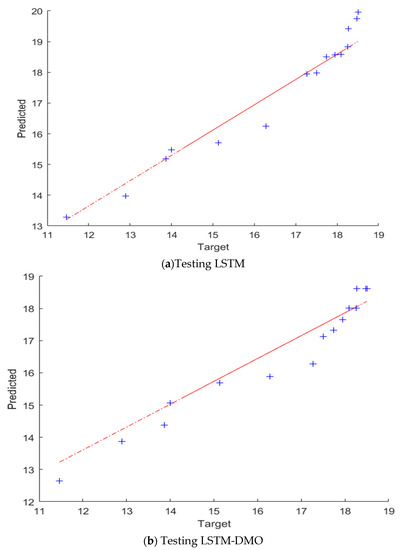
Figure 9.
The QQ plots of the TEC and its prediction using LSTM, and LSTM–DMO. The predicted and target values refer to the model prediction and the experimental results of the coefficient of thermal expansion of Cu-Al2O3 nanocomposites.
In addition, Table 2 illustrates the influence of changing the parameters of DMO on the performance of prediction. We assess two parameters, namely the Babysitter Exchange Parameter (L) and Peep, and we use three different values for each of them, and one parameter is changed the second one is fixed. In the case of changing the value of L, it can be noted that increasing the value of L from 0.6 to 0.9 at a fixed peep of 2 leads to enhancing the results of the testing set but with only a slight difference. In contrast, the performance of LSTM-DMO is slightly decreased when changing the value of L from 0.6 to 0.3. Moreover, when changing peep from 2 to 4 with a fixed L = 0.6, it can be seen that the performance is increased, but upon decreasing the value of peep from 2 to 1, the prediction performance is slightly decreased.
Table 2.
Influence of changing the parameters of DMO.
From the above discussion, one can note the strong ability of the developed LSTM-DMO to improve the prediction of thermal expansion of Cu-Al2O3 nanocomposites. This results from the use of DMO, which has the ability to balance exploration and exploitation, which leads to determining the optimal parameters of LSTM. With these advantages, it has been noted that the main limitation of the proposed model is that it requires more CPU time to find the optimal solution (parameter of LSTM). In contrast, the traditional LSTM requires the shortest CPU time since it depends on one configuration of the parameters. For example, if we assumed LSTM requires K (second) during the prediction process, the developed method requires K (second) × No. (solutions) × No. (iterations).
5. Conclusions
An enhanced machine learning model based on a long short-term memory algorithm was developed in this work to predict the coefficient of thermal expansion of Cu-Al2O3 nanocomposites with different Al2O3 content and was tested at different temperatures. An in situ chemical reaction method was used to produce Cu-Al2O3 nanocomposites with good Al2O3 nanoparticle dispersion. The produced samples were tested to characterize their microstructure, electrical, and thermal properties. The results showed decreases in the TEC with an increasing Al2O3 content at the same temperature. This decrease is due to the existence of Al2O3 nanoparticles at the grain boundaries of the Cu matrix. Further, the good interfacial bonding between Al2O3 and Cu may participate in this decrease in TEC. Another reason behind the decrease in the TEC is the heat-induced thermal stresses of Cu-Al2O3 nanocomposites.
The developed machine learning model was based on the modification of the long short-term memory algorithm by Dwarf Mongoose Optimization. The results showed that the model was able to predict the TEC of all the produced composites with different Al2O3 content, tested at different temperatures. The accuracy of the proposed model was checked using R2 and RMSE, which reflect more than 99% accuracy of the proposed model.
Author Contributions
A.M.S., project administration, funding acquisition, data curation; I.R.N., software, validation, formal analysis, investigation; G.S.A., formal analysis, investigation; A.W., software, visualization, data curation, review and editing; M.A.E., conceptualization, methodology, formal analysis. All authors have read and agreed to the published version of the manuscript.
Funding
The authors extend their appreciation to the Deputyship for Research & Innovation, Ministry of Education in Saudi Arabia for funding this research work through the project number (IFPRC-015-135-2020) and King Abdulaziz University, DSR, Jeddah, Saudi Arabia.
Institutional Review Board Statement
Not applicable.
Informed Consent Statement
Not applicable.
Data Availability Statement
Not applicable.
Conflicts of Interest
The authors declare no conflict of interest.
Appendix A
| Algorithm A1 |
| Set the parameters of the algorithm: |
| Generate |
| For iter=1: max_iter |
| Compute the fitness of the mongoose |
| Set time counter |
| Determine the alpha using Equation (8) |
| obtain a candidate food position utilizing Equation (9) |
| Estimate new fitness of |
| Estimate sleeping mound using Equation (10) |
| Calculate the sleeping mound average value obtained using Equation (11). |
| Compute the movement vector using |
| Exchange babysitters , and set |
| Set bs position (Equation (7)) and compute fitness |
| Simulate the scout mongoose next position based on Equation (12). |
| Modernize best solution so far |
| End For |
| Return best solution |
| End |
References
- Casati, R.; Vedani, M. Metal Matrix Composites Reinforced by Nano-Particles—A Review. Metals 2014, 4, 65–83. [Google Scholar] [CrossRef]
- Kannan, C.; Ramanujam, R. Comparative study on the mechanical and microstructural characterization of AA 7075 nano and hybrid nanocomposites produced by stir and squeeze casting. J. Adv. Res. 2017, 8, 309–319. [Google Scholar] [CrossRef] [PubMed]
- Karabacak, A.H.; Çanakçı, A.; Erdemir, F.; Özkaya, S.; Çelebi, M. Effect of different reinforcement on the microstructure and mechanical properties of AA2024-based metal matrix nanocomposites. Int. J. Mater. Res. 2020, 111, 416–423. [Google Scholar] [CrossRef]
- Sadoun, A.M.; Najjar, I.M.R.; Abd-Elwahed, M.S.; Meselhy, A. Experimental study on properties of Al–Al2O3 nanocomposite hybridized by graphene nanosheets. J. Mater. Res. Technol. 2020, 9, 1470814717. [Google Scholar] [CrossRef]
- Varol, T.; Canakci, A. Microstructure, electrical conductivity and hardness of multilayer graphene/Copper nanocomposites synthesized by flake powder metallurgy. Met. Mater. Int. 2015, 21, 704–712. [Google Scholar] [CrossRef]
- Samal, C.; Parihar, J.; Chaira, D. The effect of milling and sintering techniques on mechanical properties of Cu–graphite metal matrix composite prepared by powder metallurgy route. J. Alloys Compd. 2013, 569, 95–101. [Google Scholar] [CrossRef]
- Abu-Oqail, A.; Ghanim, M.; El-Sheikh, M.; El-Nikhaily, A. Effects of processing parameters of tungsten–copper composites. Int. J. Refract. Met. Hard Mater. 2012, 35, 207–212. [Google Scholar] [CrossRef]
- Vettivel, S.; Selvakumar, N.; Leema, N.; Lenin, A. Electrical resistivity, wear map and modeling of extruded tungsten reinforced copper composite. J. Mater. Des. 2014, 56, 791–806. [Google Scholar] [CrossRef]
- Fathy, A.; Elkady, O.; Abu-Oqail, A. Synthesis and characterization of Cu-ZrO2 nanocomposite produced by thermochemical process. J. Alloys Compd. 2017, 719, 411–419. [Google Scholar] [CrossRef]
- Fathy, A.; Wagih, A.; Abu-Oqail, A. Effect of ZrO2 content on properties of Cu-ZrO2 nanocomposites synthesized by optimized high energy ball milling. J. Ceram. Int. 2019, 45, 2319–2329. [Google Scholar] [CrossRef]
- Zhang, X.; Lin, C.; Cui, S.; Li, Z. Characteristics of Nano-alumina Particles Dispersion Strengthened Copper Fabricated by Reaction Synthesis. Rare Met. Mater. Eng. 2016, 45, 893–896. [Google Scholar] [CrossRef]
- Tjong, S.; Lau, K. Tribological behaviour of SiC particle-reinforced copper matrix composites. Mater. Lett. 2000, 43, 274–280. [Google Scholar] [CrossRef]
- Guobin, L.; Jibing, S.; Quanmei, G.; Ru, W. Fabrication of the nanometer Al2O3/Cu composite by internal oxidation. J. Mater. Process. Technol. 2005, 170, 336–340. [Google Scholar] [CrossRef]
- Megahed, M.; Fathy, A.; Morsy, D.; Shehata, F. Mechanical Performance of glass/epoxy composites enhanced by micro-and nanosized aluminum particles. J. Ind. Text. 2019, 51, 68–92. [Google Scholar] [CrossRef]
- Sadoun, A.M.; Fathy, A. Experimental study on tribological properties of Cu–Al2O3 nanocomposite hybridized by graphene nanoplatelets. Ceram. Int. 2019, 45, 24784–24792. [Google Scholar] [CrossRef]
- Melaibari, A.; Fathy, A.; Mansouri, M.; Eltaher, M.A. Experimental and numerical investigation on strengthening mechanisms of nanostructured Al-SiC composites. J. Alloys Compd. 2019, 774, 1123–1132. [Google Scholar] [CrossRef]
- Sadoun, A.M.; Mohammed, M.M.; Fathy, A.; El-Kady, O.A. Effect of Al2O3 addition on hardness and wear behavior of Cu–Al2O3 electro-less coated Ag nanocomposite. J. Mater. Res. Technol. 2020, 9, 5024–5033. [Google Scholar] [CrossRef]
- Zhang, D.; Zhan, Z. Preparation of graphene nanoplatelets-copper composites by a modified semi-powder method and their mechanical properties. J. Alloys Compd. 2016, 658, 663–671. [Google Scholar] [CrossRef]
- Chu, K.; Jia, C. Enhanced strength in bulk graphene-copper composites. Phys. Status Solidi A 2014, 211, 184–190. [Google Scholar] [CrossRef]
- Fathy, A.; Elkady, O.; Abu-Oqail, A. Microstructure, mechanical and wear properties of Cu–ZrO2 nanocomposites. Mater. Sci. Technol. 2017, 33, 2138–2146. [Google Scholar] [CrossRef]
- Abd-Elwahed, M.S.; Ibrahim, A.F.; Reda, M.M. Effects of ZrO2 nanoparticle content on microstructure and wear behavior of titanium matrix composite. J. Mater. Res. Technol. 2020, 9, 8528–8534. [Google Scholar] [CrossRef]
- Abu-Oqail, A.A.; Wagih, A.; Fathy, O.; Elkady, A.; Kabeel, M. Effect of high energy ball milling on strengthening of Cu-ZrO2 nanocomposites. Ceram. Int. 2019, 45, 5866–5875. [Google Scholar] [CrossRef]
- Fathy, A. Investigation on microstructure and properties of Cu-ZrO2 nanocomposites synthesized by in situ processing. Mater. Lett. 2018, 213, 95–99. [Google Scholar] [CrossRef]
- Goli, P.; Ning, H.; Li, X.; Lu, C.Y.; Novoselov, K.S. Balandin, thermal properties of graphene-copper-graphene heterogeneous films. Nano Lett. 2014, 14, 1497–1503. [Google Scholar] [CrossRef]
- Wagih, A.; Abu-Oqail, A.; Fathy, A. Effect of GNPs content on thermal and mechanical properties of a novel hybrid Cu-Al2O3/GNPs coated Ag nanocomposite. Ceram. Int. 2019, 45, 1115–1124. [Google Scholar] [CrossRef]
- Allahkaram, S.R.; Golroh, S.; Mohammadalipour, M. Properties of Al2O3 nano-particle reinforced copper matrix composite coatings prepared by pulse and direct current electroplating. Mater. Des. 2011, 32, 4478–4484. [Google Scholar] [CrossRef]
- Tey, E.; Hashim, M.; Ismail, I. Characterization of Cu-Al2O3 and Ni-Al2O3 nanocomposites electrodeposited on copper substrate. Mater. Sci. Forum 2016, 846, 471–478. [Google Scholar] [CrossRef]
- Shehata, F.; Abdelhameed, M.; Fathy, A.; Elmahdy, M. Preparation and Characteristics of Cu-Al2O3 Nanocomposite. Open J. Met. 2011, 1, 25–33. [Google Scholar] [CrossRef] [Green Version]
- Lajevardi, S.; Shahrabi, T.; Szpunar, J. Synthesis of functionally graded nano Al2O3–Ni composite coating by pulse electrodeposition. Appl. Surf. Sci. 2013, 279, 180–188. [Google Scholar] [CrossRef]
- Ning, D.; Zhang, A.; Murtaza, M.; Wu, H. Effect of surfactants on the electrodeposition of Cu-TiO2 composite coatings prepared by jet electrodeposition. J. Alloys Compd. 2019, 777, 1245–1250. [Google Scholar] [CrossRef]
- Ďurišinová, K.; Ďurišin, J.; Orolínová, M. Al2O3-dispersion strengthened nanocrystalline copper. Powder Metall. Prog. 2006, 6, 75–80. [Google Scholar]
- Oh, S.-T.; Sekino, T.; Niihara, K. Effect of particle size distribution and mixing homogeneity on microstructure and strength of alumina/copper composites. Nanostruct. Mater. 1998, 10, 327–332. [Google Scholar] [CrossRef]
- Ritasalo, R.; Liua, X.; Söderberg, O.; Keski-Honkola, A.; Pitkänen, V.; Hannula, S.-P. The Microstructural Effects on the Mechanical and ThermalProperties of Pulsed Electric Current Sintered Cu-Al2O3 Composites. Procedia Eng. 2011, 10, 124–129. [Google Scholar] [CrossRef]
- Zhang, X.-H.; Li, X.-X.; Chen, H.; Li, T.-B.; Su, W.; Guo, S.-D. Investigation on microstructure and properties of Cu–Al2O3 composites fabricated by a novel in-situ reactive synthesis. Mater. Des. 2016, 92, 58–63. [Google Scholar] [CrossRef]
- Ramezanalizadeh, H. Fabrication and Characterization of an Al-Based Nanocomposite with High Specific Strength and Good Elongation Using Large Amount CMA Nanoparticles. J. Alloys Compd. 2020, 822, 153667. [Google Scholar] [CrossRef]
- Dhar, S.; Jena, A.; Patnaik, S.C.; Sahoo, S.K.; Tripathy, O. A Study on Microstructure and Mechanical Properties of Aluminium Matrix Composites with Micro-Sized Iron Fillers Produced by Powder Metallurgy Route. Mater. Today Proc. 2020, 33, 5617–5622. [Google Scholar] [CrossRef]
- Charan Nayak, K.; Kumar Pandey, A.; Date, P.P. Mechanical and Physical Characterization of Powder Metallurgy Based Aluminium Metal Matrix Hybrid Composite. Mater. Today Proc. 2020, 33, 5408–5413. [Google Scholar] [CrossRef]
- Saber, D.; Abd El-Aziz, K.; Fathy, A. Corrosion behavior of copper–alumina nanocomposites in different corrosive media. Int. J. Mech. Eng. 2016, 5, 1–10. [Google Scholar]
- Sadoun, A.M.; Mohammed, M.M.; Elsayed, E.M.; Meselhy, A.F.; El-Kady, O.A. Effect of nano Al2O3 coated Ag addition on the corrosion resistance and electrochemical behavior of Cu-Al2O3 nanocomposites. J. Mater. Res. Technol. 2020, 9, 4485–4493. [Google Scholar] [CrossRef]
- Rodrigues, I.; Guedes, M.; Ferro, A. Processing of Copper-Graphite-Alumina Powders by High-Energy Milling. In Proceedings of the PM2014 World Congress, 2014 World Conference on Powder Metallurgy, Orlando, FL, USA, 18–22 May 2014. [Google Scholar]
- Khatir, S.; Boutchicha, D.; Le Thanh, C.; Tran-Ngoc, H.; Nguyen, T.; Wahab, M.A. Improved ANN technique combined with Jaya algorithm for crack identification in plates using XIGA and experimental analysis. Theor. Appl. Fract. Mech. 2020, 107, 102554. [Google Scholar] [CrossRef]
- Zenzen, R.; Khatir, S.; Belaidi, I.; Le Thanh, C.; Wahab, M.A. A modified transmissibility indicator and Artificial Neural Network for damage identification and quantification in laminated composite structures. Compos. Struct. 2020, 248, 112497. [Google Scholar] [CrossRef]
- Wang, S.; Wang, H.; Zhou, Y.; Liu, J.; Dai, P.; Du, X.; Wahab, M.A. Automatic laser profile recognition and fast tracking for structured light measurement using deep learning and template matching. Measurement 2021, 169, 108362. [Google Scholar] [CrossRef]
- Fathy, A.; Megahed, A.A. Prediction of abrasive wear rate of in situ Cu–Al2O3 nanocomposite using artificial neural networks. Int. J. Adv. Manuf. Technol. 2012, 62, 953–963. [Google Scholar] [CrossRef]
- Raymond, S. Physics for Scientists and Engineers with Modern Physics, 3rd ed.; Saunders College Publishing: Forth Worth, TX, USA, 1983. [Google Scholar]
- Najjar, I.; Sadoun, A.; Alsoruji, G.S.; Elaziz, M.A.; Wagih, A. Predicting the mechanical properties of Cu–Al2O3 nanocomposites using machine learning and finite element simulation of indentation experiments. Ceram. Int. 2021, 48, 7748–7758. [Google Scholar] [CrossRef]
- Torabi, H.; Arghavanian, R. Investigations on the corrosion resistance and microhardness of Cu–10Sn/SiC composite manufactured by powder metallurgy process. J. Alloys Compd. 2019, 806, 99–105. [Google Scholar] [CrossRef]
- Abd-Elwahed, M.S.; Meselhy, A.F. Experimental investigation on the mechanical, structural and thermal properties of Cu–ZrO2 nanocomposites hybridized by graphene nanoplatelets. Ceram. Int. 2020, 46, 9198–9206. [Google Scholar] [CrossRef]
- Eltaher, M.; Wagih, A.; Melaibari, A.; Fathy, A.; Lubineau, G. Effect of Al2O3 particles on mechanical and tribological properties of Al–Mg dual-matrix nanocomposites. Ceram. Int. 2020, 46, 5779–5787. [Google Scholar] [CrossRef]
- Barakat, W.; Wagih, A.; Elkady, O.A.; Abuoqail, A.; Fathy, A.; El-Nikhaily, A. Effect of Al2O3 nanoparticles content and compaction temperature on properties of Al–Al2O3 coated Cu nanocomposites. Compos. Part B Eng. 2019, 175, 107140. [Google Scholar] [CrossRef]
- Shehata, F.; Fathy, A.; Abdelhameed, M.; Moustafa, S. Fabrication of copper–alumina nanocomposites by mechano-chemical routes. J. Alloys Compd. 2009, 476, 300–305. [Google Scholar] [CrossRef]
- Mohamed, A.; Mohammed, M.M.; Ibrahim, A.F.; El-Kady, O.A. Effect of nano Al2O3 coated Ag reinforced Cu matrix nanocomposites on mechanical and tribological behavior synthesis by P/M technique. J. Compos. Mater. 2020, 54, 4921–4928. [Google Scholar] [CrossRef]
- Wagih, A.; Fathy, A.; Sebaey, T.A. Experimental investigation on the compressibility of Al/Al2O3 nanocomposites. Int. J. Mater. Prod. Technol. 2016, 52, 312–332. [Google Scholar] [CrossRef]
- El-wazery, M.; El-Desouy, A.R.; Hameda, O.A.; Fathy, A.; Mansour, N.A. Electrical and mechanical performance of zirconia-nickel functionally graded materials. Int. J. Eng. 2013, 26, 375–382. [Google Scholar] [CrossRef]
- Hsieh, C.; Tuan, W. Thermal expansion behavior of a model ceramic–metal composite. Mater. Sci. Eng. A 2007, 460–461, 453–458. [Google Scholar] [CrossRef]
- Weber, L.; Tavangar, R. On the influence of active element content on the thermal conductivity and thermal expansion of Cu–X (X = Cr, B) diamond composites. Scr. Mater. 2007, 57, 988–991. [Google Scholar] [CrossRef]


Publisher’s Note: MDPI stays neutral with regard to jurisdictional claims in published maps and institutional affiliations. |
© 2022 by the authors. Licensee MDPI, Basel, Switzerland. This article is an open access article distributed under the terms and conditions of the Creative Commons Attribution (CC BY) license (https://creativecommons.org/licenses/by/4.0/).