Article

Determining Objective Characteristics of MCDM Methods under Uncertainty: An Exploration Study with Financial Data

1
Faculty of Applied Sciences, Necmettin Erbakan University, Konya 42140, Turkey
2
Department of Logistics, University of Defence in Belgrade, 11000 Belgrade, Serbia
*
Author to whom correspondence should be addressed.
Mathematics 2022, 10(7), 1115; https://doi.org/10.3390/math10071115
Submission received: 7 March 2022 / Revised: 24 March 2022 / Accepted: 29 March 2022 / Published: 31 March 2022
(This article belongs to the Section Mathematics and Computer Science)

Abstract

:
A major difficulty in comparing and even choosing MCDM methods is the uncertainty of information about the consistent and unique characteristics of the results produced. The objective information content of the final scores produced by MCDM methods and their relevance to real life can give us an important idea about them. In this study, first of all, seven MCDM methods with different methodologies were applied to evaluate companies’ financial performance. Then, the obtained MCDM scores were compared using two different objective verification mechanisms. The first validation criterion is the relationship of a MCDM method to real-life rankings (share price). The second criterion is the standard deviation (SD) technique used to discover the objective information content of MCDM final scores. According to the results of this study, PROMETHEE and FUCA definitely outperform other methods in terms of both SD values and strength of correlation with reference real-life rankings. Also, FUCA is methodologically simpler than other methods. However, it produced nearly identical results as the sophisticated PROMETHEE method.

1. Introduction

Multi-Criteria Decision Making (MCDM) methods are based on the principle of proposing the best alternative solution among the alternatives under certain criteria, so they have recently been used more widely. MCDM methods have been applied in many specific fields to solve certain selection and ranking problems, such as finance [1], information technology [2], civil engineering and management [3], design and development [4], renewable energy [5], human resources management [6] and medical diagnosis [7]. Although many researchers focus on the development of new MCDM methods or modification the existing ones, relatively limited attention has been paid to the selecting the best method for a valid decision issue [8]. Essentially, many MCDM methods are used in divergent decision making procedures, but the specific application area and recommendations for choosing the most appropriate method for a particular issue have not been fully revealed. Therefore, it is required to create a framework for how to choose the most appropriate method when handling decision making problems [9]. There are many different methods that can be recommended among more than 100 MCDM methods. It is surely a difficult task to find out the most appropriate one. Therefore, it is necessary to go through a detailed examination and comparison of MCDM methods. Some methods are more appropriate under certain conditions and scenarios. On the other hand, there is no single method that can deal with all problems [10].
The capability and capacity of MCDM methods are often associated with the computational process or their methodology. At this point, it is unclear how and on what basis the methods will be selected based on these methodological capabilities. The search for an objective sign or clue regarding the comparability and selection of MCDM methods is still valid. Here, any indication of a stable and consistent character, tendency, or capacity for MCDM methods can provide crucial insight. Within the scope of MCDM, each of methods has its own performance capacity and characteristics. The main issue is to select the best and appropriate alternative among MCDM methods. It is necessary to provide a framework to deal with such selection problems [11]. Although various suggestions and frameworks have been provided to compare and select appropriate MCDM methods, there is still no universal agreement in this issue. The fact that the methods produce similar ranking results causes them to be perceived as equivalent of each other, so this opinion results in a random selection of a MCDM method. There are some reasons such as being new or popular method, computational ease and software support, but this these reasons can be counted as the subjective or arbitrary factors in the selection procedure of an MCDM method. Instead of this kind of subjectivity, it is necessary to develop some objective selection criteria or framework for comparing MCDM methods. At this point, we evaluate that the information content of MCDM scores and their success in capturing real life can produce stable and consistent results.
The main application purpose of the study is to measure companies’ financial performance on the basis of MCDM methods. Firstly, MCDM methods were compared regarding their capacity to produce a relationship with the real life example (share price). Secondly, another comparison will be made by determining the characteristics, capacity or information content of the MCDM final scores through SD. Thus, the performance of MCDM methods was evaluated with two-sided criteria from both real life and theory. In other words, we evaluate that if the two criteria we propose confirm each other, the hidden objective character of the MCDM methods can be revealed. This is because the performance of a method, which is consistently and dominantly superior cannot be a coincidence. Making a sustainable decision under uncertainty has a lot to do with discovering sustainable criteria for MCDM comparison. Discovering sustainable criteria that will enable objective comparison of MCDM methods under uncertainty also facilitates appropriate and quality decisions. Measuring the performance of alternatives is surely essential, but it is also reasonable to measure the performance of MCDM methods first, if possible. In this sense, it can be said that the reference real-life relationship and Standard Deviation (SD) dual verification mechanism proposed in this study provide convenience and additional dimensions to measure MCDM performance. To support our claim, we tested our approach through evaluation of the financial performance (FP) of 24 companies, because financial capacity is very important for organizations to follow their mission and succeed aims, and it is an important indicator of the organization’s overall performance [12]. These 24 companies have the highest market value in Borsa Istanbul (BIST/Stock Exchange Istanbul), in 10 quarters between 2019 and 2021 in Turkey. Thus, in this study, the final scores of MCDM methods were compared by using the proposed dual validation criteria, and it was revealed which MCDM method performs better for decision-makers. The main purpose here is to justify an objective comparison by exploring sustainable criteria. No study has been found in the literature showing this approach (dual validation) with such clarity before.

2. Literature Review

Considering the aim of this study, we firstly examined classical evaluations in the literature in terms of selecting an appropriate MCDM measurement and determining its capacity, which often results in uncertainty. Secondly, we suggested to use correlation of share price and the FP of the company, which is a real life example, against this uncertainty and deadlock. This is a special case and its use for evaluation of MCDM capability is essential. Therefore, the literature on the measurement of FP, its relationship with stock return and the interpretation of this relationship in terms of MCDM performance was reviewed. Thirdly, we also evaluated the importance and different uses of the SD, which is the other criterion we propose to reveal the information content of MCDM methods, in the MCDM literature.

2.1. Objective Characteristics of MCDM Methods

It is difficult to reach a direct and objective determination about the unique characters of MCDM methods. On the other hand, different methodological views based on input regarding the choosing the best MCDM method in the literature actually indirectly indicate the capacity or character of MCDM methods. In other words, there is no direct solution and consensus on this issue in the existing literature, which focuses more on the input-based computation process. In fact, the issue of selection is a problematic area. Because, if MCDM methods are chosen with MCDM methods, it leads to a “paradoxical” insolubility. Therefore, it is doubtful whether there is an objective answer to this debate in terms of methodologists with a classically focused approach [13].
Choosing the best MCDM method is a challenge and the ideas recommended as solutions might include personal opinions since there is literally no objective verification mechanism. Our preference to select among different methods might be depended on the problem solution, decision makers’ values or other personal factors [14]. This is because it is a difficult decision especially for inexperienced researchers who are hesitant to make a reliable choice among different MCDM methods to find the most appropriate and reliable one. MCDM selection is a complex process that includes defining the decision problem, decision maker and MCDM solution procedure. Essentially, decision-makers require an accurate guidance with careful technical details to select an appropriate MCDM method. At this point, expert systems suggest an appropriate MCDM method to the decision maker according to the answers given to some questions about the properties that identify the problem of decision, decision maker and solution technique that are discussed earlier [15]. In summary, the literature emphasizes that MCDM selection is often not an easy task due to the lack of an objective verification mechanism.
MCDM capacity and character can be discussed with a different and realistic approach. In this sense, MCDM methods’ capabilities that represent real-life scenarios have become more vital than ever [16]. Accordingly, MCDM methods should not be evaluated only with their potential capabilities. Their success in capturing or modeling real-life should also be evaluated. In other words, not only the steps of the MCDM processing procedure but also the relevance degree of these results to real-life ranking is important in the method selection. For instance, the relationship between the FP and the share price obtained by MCDM is a financial example [17].
In addition, the formal information content of the final scores produced by MCDM methods can give an idea about the objective and original characteristics of these methods. SDs of the ranking scores produced by different MCDM methods can be considered as a comparison criterion. Moreover, normalized MCDM scores can be compared via SD. For criterion weighting, “objective weighting methods” are normally recommended. However, they can also be recommended in the evaluation of normalized MCDM scores. For example, Zaidan et al. (2017) used the Standard Deviation (SD) method in their study. Considering the final scores produced by MCDM techniques, they emphasized that the highest SD belongs to TOPSIS and the lowest SD value belongs to WSM [18]. In this study, for the first time, it will be tried to explore the special character or capacity of MCDM methods with a dual mechanism by adding the power of relationship with real life example of share price and SD. And this rational approach can provide us essential and objective information about the sustainable characteristics tendencies of the methods.

2.2. Correlation between Reference Ranking and MCDM Rankings as a Benchmark Measure

MCDM methods are widely adopted and used for companies and in many applied science fields to summarize changing (occasionally contradicting) dimensions of performance with a single outcome score [19]. In the literature, there are many studies that have conducted financial performance (FP) research (in search of accurate measurement) for periods with different MCDM and weighting methods. For example, Wang (2014) analyzed the FP of three container shipping companies in Taiwan by using fuzzy as a MCDM technique [20]. In his study, 21 ratios were used as decision criteria and 5 periods were discussed. The evaluation of the FPs of the companies was made by using the fuzzy TOPSIS method, and the companies were ranked from best to worst according to FP. As another example, Pineda et al. (2018) used a model for performance evaluation of 12 airlines in the United States (USA) [21]. They divided 11 sub-criteria into 4 main groups, and used the following MCDM methods: DRSA, DEMATEL, DANP and VIKOR. In fact, the studies in the literature are similar and they show us that many MCDM methods are used in performance measurement. In these studies, MCDM, weighting methods, normalization techniques, data type (exact or fuzzy type data), preference function, threshold value may change, but the main common goal (an appropriate FP measurement, whose verification is debatable) remains the same [22,23,24,25]. There are numerous MCDM based FP measurement studies in the literature and their history spans more than 20 years. In this sense, we find it more useful to summarize the common results of these studies, especially after the 2000s [26]:
  • FP measurement is one of the most studied topics in finance.
  • The number of studies using MCDM methods is constantly increasing.
  • TOPSIS stands out as the most widely adopted MCDM method.
  • Profitability and risk-based financial criteria are preferred more in these studies.
  • In FP studies, we do not come across a directly objective procedure or recommendation for choosing a better MCDM method.
The relationship between the share price and FP of companies that is calculated by MCDM methods as a reference can provide us unique and natural solutions for selecting appropriate MCDM method. One of the best examples for this is the “price” element, which develops simultaneously with the FP of a company. The parallel relationship of these dynamic systems developing in two different universes to a certain extent can be a natural solution area for the determination of MCDM capacities. When the MCDM studies on stock returns and FP measurement are examined, there are very few studies that can use the results obtained after finding a significant relationship between these two variables in comparison of different MCDM methods. For instance, Yaakob and Gegov (2016) argues that a significant and comparable relationship is valid between actual stock returns and MCDM results [27]. In another study, Baydaş and Elma (2021) examined 131 companies that are registered in the BIST manufacturing index for 20 different periods by using TOPSIS, WSA and PROMETHEE methods [17]. They found that there are sustainable, strong and significant relationships between FP rankings and the stock returns that were created by the mentioned MCDM methods. Among these methods, they claim that PROMETHEE has been a dominantly more successful method in analyzing FP regarding the results it produces. Similarly, Baydaş and Eren (2021) determined that TOPSIS produces stronger relationships with real-life stock returns compared to the SAW method in their analysis of over 25 manufacturing metal goods companies in the stock market for 5 different periods [28]. What is remarkable in such studies is not the investment aspect of the stock return, but the emphasis on the methodological problem-solving aspect (reference). FP, which is measured with different MCDM methods, is evaluated over the capacity to relate to share price change, which is a dynamic example from real life. Interestingly, the fact that some methods capture the actual price change more strongly gives us information about the objective capacities of MCDM methods that have been hidden for years.

2.3. Exploring the Information Content of the Final Scores of MCDMs via Standard Deviation (SD)

Evaluation of normalized MCDM scores using the standard deviation method has rarely been used in the literature. Zaidan et al. (2017) partially used the standard deviation (SD) method for MCDM comparison [18]. However, there is no other example of this in the previous studies. Comparing original performances of MCDM methods that are used for financial performance measurement is considered an interesting and difficult subject. Considering that MCDM methods produce different scores, it would not be correct to directly compare them over raw scores. To justify a reasonable comparison, the final ranking scores of the MCDM methods should be normalized. Normalized score should be used to ensure comparability of final scores of MCDM techniques [18].
Essentially, the category of objective assessment methods is based on the use of information about the criteria and their interactions in the decision matrix. In this sense, Diakoulaki et al. (1995) proposed SD approach in order to measure the contrast intensity and thereby derive the objective weights of the criteria, because this approach determines target weights based on the SDs of the criteria values [19]. Essentially, there is an acceptance, which is believed or assumed for objective weight estimation methods. The larger the difference between the values of the items in the column, the more valuable the information contained in the criterion (indicator) for these methods. In other words, the weight of a criterion becomes higher as a direct proportionate to the information content [29]. In fact, it is also possible that methods such as SD could be used to discover the information content of the final scores of MCDMs. That means there is no formal and rational obstacle to the calculation of the SDs of the MCDM final scores. Therefore, after the MCDM final scores are normalized, their SDs can be calculated and evaluated in the comparison. This situation can be an objective alternative solution to the subjective approaches or selection techniques for the decision makers in selecting the most appropriate MCDM method.
In this study, it is clearly demonstrated that the SD approach can reveal the information content of the final scores of MCDM methods. In this direction, instead of dealing with the methodology that is the input of MCDM methods, we focus directly on the results they produce. We make an alternative evaluation based on data analytics results. This evaluation is especially appropriate for the approach of decision analytics, as a popular topic recently. Decision analytics can be regarded as a field that uses technological tools and quantitative techniques to extract meaning from data, and then overcome problems and make informed decisions. Tavana (2021) uses decision analytics in evaluating historical data with other data to answer why something happens; in using the findings to determine what will happen; and finally in answering the question of what should be done using the results [30]. Similarly, in our study, we investigate if the rankings produced by different MCDM methods have particular patterns by using historical company data. This is in line with the decision analytics approach. Thus, instead of discussing the input based methodological calculation process in a classical way, we propose to evaluate the performance of the results produced by the methodologies with objective criteria in the context of data analytics.

3. Research Methodology

This study, we basically have similar classical aim as in other MCDM based FP studies: We evaluate companies’ FP performance by using different MCDM methods. In the literature, studies show that each financial ratio (criterion) provides different information as it expresses a different aim. However, using a single ratio does not make it easy to reach an overall assessment of company’s performance. This is why, MCDM methods are often used in inter-company comparisons, because they are able to show modern businesses’ multidimensional character. MCDM methods are very helpful to reveal changing aims of different companies within a single performance system [19]. In this sense, we analyzed the FP rankings that are created over 6 financial ratios with MCDM methods, primarily based on the equal weighting technique in this study. We then compared these rankings to stock price rankings (which is considered a reference in companies). Thus, the MCDM model that produce a meaningful and strong relationship with share price is recommended as the most appropriate model for financial decision makers. Table 1 shows the MCDM capacity and characteristics determination, performance criteria and MCDM methods that we included in our study.

3.1. Performance Dimensions

The main purpose of this study is to measure the MCDM-based financial performance (FP) of companies within the framework of certain criteria. Moreover, it is to research and develop an improved MCDM measurement framework to best achieve this goal. The preferred criteria are based on risk, profitability, or value. These are ROE, ROA, MVA margin, MVA spread, Altman-Z and MV/BV indicators. All criteria are growth and benefit oriented. Explanatory information about these representative dimensions is given below.

3.1.1. Return on Equity (ROE)

As one of the most famous ratios, ROE was used in evaluating FPs of companies. This ratio brings both net profit and equity. Therefore, company executives gains an important view about efficiency of their equity capital, while investors gain information about how much profit they make from their investments. ROE is defined as the ratio of net profit to equity [31] (p. 119).

3.1.2. Return on Assets (ROA)

ROA is a classic choice for measurement in financial research. The difference from ROE is that ROA reflects indebtedness to the ratio. This ratio has long been used in analyzing the financial status and companies’ performances. It is also a practical ratio that shows the degree of efficient use of assets [31] (p. 119).

3.1.3. Market Value Added Margin (MVA Margin)

MVA is a very important indicator since the most important goal of modern businesses is to maximize market value along with profit. MVA shows the discrepancy between a company’s market value and the capital that is invested. This indicator is used as a benchmarking tool to compare companies in terms of value production over a given period. The MVA margin is defined as the MVA level created by sales, and it measures the efficiency of sales [32] (p. 306).

3.1.4. Market Value Added Spread (MVA Spread)

MVA represents value creation when market value exceeds the capital invested by investors in the company. The ratio of MVA to invested capital is defined as MVA spread [32] (p. 306). In studies measuring financial performance, this ratio is used as a benchmarking tool to evaluate how companies increase their value and how they do this in terms of efficiency over their investment capital.

3.1.5. Altman-Z Score

The estimation (bankruptcy) and diagnosis of company’s distance from financial failure is vital for users of financial information (e.g., investors, partners, creditors, shareholders and suppliers). To meet this critical need, a model was created to estimate financial distress and failure in Altman’s study (1968) [33]. The model that has still been successfully used, is not only used to predict bankruptcy risk, but this classic criterion is also used to evaluate success, risk and stock selection of companies in financial performance applications. According to Carton (2004), Δ Altman-Z Score is the metric that best correlates with stock returns [34] (p. 281). Similar to ROE, ROA or ROS ratios, the change of Altman-Z score according to the base period can reveal the current success of the company. On the other hand, this indicator can also measure the future risk of the company, similar to the current ratio. Moreover, the capabilities of the Altman-Z indicator are greater than this. It is one of the few indicators that simultaneously provides a meaningful relationship with the stock return.
The Altman-Z score is an excellent multi directional financial indicator. As it is desired to grow, it is a benefit-oriented indicator like the other indicators mentioned above. Unlike most previous studies that focus on measuring financial performance by MCDM methods, this study recommends adding this indicator in MCDM studies, because it measures risk and uncertainty, although the current ratio, cash ratio and liquidity ratio are the first ones as the simplest and well-known ratios that come to mind in measuring risk. It is known that these ratios also measure risk. However, users need to be careful when using them in MCDM procedures, because these ratios requires ideal value (2, 1, and 0.2 respectively). This is because they are not “benefit-based, cost-based” ratios. Therefore, they need to be converted, which is not an easy task. Different problems await the user, even if the ideal values are converted to benefit/cost. Firstly, as an example, a current ratio below 1.0 is a very serious risk for a company, while a current ratio above 3.0 is certainly not an equally great risk. And it is not clear to what extent there is a small risk. As a result, it can be said that indicators like current ratio requiring ideal value are frequently misused in MCDM.

3.1.6. Market to Book Ratio

It is a popular indicator that is defined as the ratio of a firm’s market value to its equity. It has a similar purpose to MVA [32] (p. 118). A lower ratio means that investors value the company’s stock less than the company’s value. Also, a larger ratio indicates that the company is highly valued. If the demand for company shares increases, this will positively affect this ratio upwards. It is a commonly used ratio. Table 2 shows financial ratios, formulas and references.

3.2. MCDM Methods

For more than a quarter of a century, the MCDM-based financial performance literature has included measurement and evaluation-based analyzes to achieve better rankings [26]. Of course, it would be a good approach to explore the hidden capabilities of all MCDM methods for a better measurement. In this sense, evaluating the final scores of MCDM methods with some objective criteria might give us a good idea. In this study, seven popular MCDM methods were compared in order to make a more understandable and comprehensive comparative evaluation: PROMETHEE, TOPSIS, MOORA, COPRAS, CODAS, SAW and FUCA.
We selected these methods to provide a new approach among MCDM methods that are used in the field of FP, and to provide comparative evaluation results. PROMETHEE is the most popular MCDM method among outranking approaches. SAW, on the other hand, is a simple, weight-based sum method closest to daily life use. TOPSIS is obviously the most popular method used in FP studies [26]. On the other hand, CODAS, MOORA, COPRAS methods are used in this study, because they are also popular methods recently. They are comparable MCDM methods that can work with clear data, produce the final ranking results and also give the decision maker the initiative in determining the weighting coefficient. As discussed in the previous parts of the study, the “input methodology” of MCDM methods was given more importance in the comparison of MCDM methods in the literature. These are undoubtedly important in the development, comparison and even selection of MCDM methods. However, the final scores, which are the outputs of the MCDM methods, are also important. For example, as suggested in this study, the relationship of outputs with real life and objective information content can be considered as criteria for measurement and comparison of MCDM capability.
In this study, the analysis results of our unique approach reveal which of the MCDM methods has more capacity to capture real life and the level of information content.
In this section, introductory information about MCDM methods is given. In addition, the methodological calculation details of the methods mentioned below are presented in Appendix A (Table A1, Table A2 and Table A3) as the last part of the study.

3.2.1. Preference Ranking Organization Method for Enrichment Evaluation (PROMETHEE II)

The same purpose of the PROMETHEE II method, as in other MCDM methods, consists of ranking a certain number of alternatives and suggesting the best one. This method was firstly introduced to solve MCDM issues in 1982. It is an influential model ranking the examined best and worst alternatives according to the determined criteria. PROMETHEE I can perform partial ranking, while the more commonly used PROMETHEE II can perform general ranking. The method makes pairwise comparison for each criterion, and then it applies maximization or minimization for the results depending on the benefit or cost structure of the target. The general preference (usual) function version of PROMETHEE is frequently used because it is functional, and it does not require a threshold value from the user [35] (p. 199). The PROMETHEE methodology proposes to use one of the alternative preference functions. PROMETHEE’s preference function used to identify deviations between alternatives for each criterion. Step 2 is a relative stage where the decision maker makes a choice. The remaining steps, on the other hand, have a static procedure. In this step 2, the choice of preference function is an arbitrary step in which it depends on the criterion property and the preferences of the decision makers. In this study, the general preference function was used. Mostly, decision makers use this preference function when they do not attach much importance to the differences between criterion values [36].

3.2.2. Simple Additive Weighting (SAW)

In the SAW method, after the first decision matrix is normalized, each criterion column is multiplied by its weight coefficients. Finally, among the results obtained by adding the weighted values, the alternative with the highest value is the best solution [37].
Even the superiority of a well-known powerful and sophisticated method such as PROMETHEE over a relatively simple method such as SAW is debatable over many alternative frameworks proposed by previous studies. Conclusions will be drawn about the real and latent capacity of the methods used in this study in certain respects. In this study, conclusions about the actual capacities of these methods were reached.

3.2.3. Faire Un Choix Adéquat (FUCA)

FUCA is depended on ranking the alternatives for each criterion. The first row has the best value (1), while the last row (m) is assigned the worst value. Then, the weighted sum of the values for each solution point is calculated and the solution with the smallest total value is the best chosen solution [38,39]. The most important advantage of this method, which is relatively new and less known in the literature, is that it is simple and easy to calculate. It is interesting that FUCA produces results very close to PROMETHEE-2, considering that the general preference function is used [40].

3.2.4. Complex Proportional Assessment (COPRAS)

The COPRAS method was firstly proposed by Zavadskas and Kaklauskas (1996) develops non-dominant solutions regarding significance and utility [41]. Thus, alternatives are ranked and evaluated step by step.

3.2.5. Combinative Distance-Based Assessment (CODAS)

This method is based on the determination of each given criterion value by the Euclidean and taxicab distances from the negative ideal solution, which is the worst value. The CODAS method primarily uses the Euclidean distance. If two solutions are far from comparable (for example, they are similar) according to the Euclidean distance, the taxicab distance is used as an alternative measure. For this, the threshold parameter (τ = 0.02) is used to decide the degree of closeness of the Euclidean distances [37,42].

3.2.6. Multi-Objective Optimization on the Basis of Ratio Analysis (MOORA)

The popular method of recent times, MOORA, was firstly recommended by Brauers and Zavadskas (2006) [43]. In fact, it has similar aspects with the COPRAS method. But MOORA uses the vector for the first decision matrix instead of the sum normalization. Also, this method differs from COPRAS by using performance score rather than relative importance [37].

3.2.7. TOPSIS (Technique for Order of Preference by Similarity to Ideal Solution)

It is the most preferred method in MCDM-based financial performance studies. According to the TOPSIS method, the best alternative is the combination solution closest to the positive ideal solution (PIS) and farthest from the negative ideal solution (NIS) [44]. It is a method that differs in aspects such as caring for ideal values, using Euclidean distance and vector normalization.

3.3. MCDM Benchmarks

Below is descriptive information about the criteria we use to compare MCDM methods.

3.3.1. Spearman Rho Coefficient

The similarity ratio of specific scores produced by MCDM methods is an interesting discovery. At this point, the Spearman rho correlation coefficient can help us. Spearman’s rank correlation coefficient, which is a non-parametric technique, expresses the statistical relationship between two rank sequences. Calculation of Spearman Rho coefficient is as follows [45]:
r s = 1 6     d i 2   n   ( n 2   1 )
Here r s represents Spearman’s Rho, while d i represents the difference in binary rankings. And n represents the number of states in the formula.
In this study, it is our ultimate goal to compare various MCDM methods. In this respect, the relationship between MCDM-based FP and stock return (SR) rankings of companies was determined by Spearman rank correlation. Past studies have shown that some methods capture this relationship better and some other methods at a lower level (mentioned in the literature section). And in the study we test it with different constraints.

3.3.2. Standard Deviation (SD) Method

The SD method determines target weights regarding the standard deviations of the targets [19]. First, a normalized matrix is created depending on the benefit and cost targets. Then, SDs are calculated for each objective. Finally, weights are determined for each period depending on the calculated SDs [38] (see Table 3). This weighting method is mostly applied to solve complex and unclear problems in MCDM studies [46].

4. Application

This section explains the data set and the experimental process in detail. Next, we present the findings, results and discussion. And finally, we evaluate the conclusions of the application.

4.1. Data Set and Experimental Process

Following the main purpose of the study, we measured the FP (financial performance) of most traded 24 companies (banks are excluded) which have the highest market value in the BIST-30 index, in Turkey, by MCDM methods. These companies were chosen as decision alternatives, and 6 different performance types were chosen as decision criteria. The period of the study con-sists of a total of 10 quarters between 2019 and 2021: 2019/06 (Q1), 2019/09 (Q2), 2019/12 (Q3), 2020/03 (Q4), 2020/06 (Q5), 2020/09 (Q6), 2020/12 (Q7), 2021/03 (Q8), 2021/06 (Q9), 2021/09 (Q10). FPs of the companies were calculated separately for each quarter base period. First of all, the FPs of the companies were calculated by using seven MCDM methods for each period. After that, the FP MCDM scores of the companies were compared both in terms of correlation coefficient with Stock Return (SR), namely percentage change in price, and SD (Standard deviation). Thus, objective findings were revealed regarding the capacity, tendency, character or importance of each MCDM method for each period. These findings showed that we can compare MCDM methods depending on the highest performance success for decision makers who want to evaluate the performance of companies under certain criteria and constraints. We would also like to point out that the FINNET commercial data software is used to obtain companies’ FP performance indicators and share price data. Figure 1 displays the diagram of the study.
The experimental process of this study is as follows:
Step 1: Data Matrix Preparation
First of all, the obtained performance values are placed in the decision matrix in order to calculate the MCDMs. Here, six different ratios are considered as a measure of FP. The decision matrix is formed with these initial data obtained during the calculation of the MCDM results.
Step 2: Weighting Calculation Procedure
Since the equal weighting method was preferred, it was applied to all criteria. This study, it is mainly aimed to compare MCDM methods objectively. In the MCDM procedure, the selection of the weighting procedure (such as normalization, threshold value, preference function selection) is a separate issue in itself. And this is not the subject of this study. In this study, we emphasize that our focus is the MCDM comparison, by choosing the equal weighting method, which is a non-judgmental technique.
Step 3: MCDM Calculation Procedure
Microsoft Excel program was used to execute MCDM process steps. In this study, a total of 70 different MCDM rankings were produced for 10 base periods by using seven different MCDM scores belonging to 24 companies. In other words, 70 different MCDM scores were calculated for a company (this number is 1680 for all companies). This shows that the study is quite comprehensive. Thus, according to alternative MCDM results, we can make more reliable and valid judgments for 10 base periods compared to one period.
Step 4: Evaluation of MCDM Ranking Results
To understand which of the MCDM rankings produce superior results, we evaluated Spearman Correlation (RHO). Secondly, we suggested SD analysis with a structured procedure similar to objective weighting techniques. This process was done in the Excel program.
Step 5: Evaluation of Analysis Results as Superiority and Comparison Functions in MCDM Methods.
MCDM methods were compared according to RHO and SD analyzes and average performance values of sequences produced by MCDMs. As a result of separate calculations for both criteria, we suggested that the method with the best averages might be more important or appropriate.
Considering the fact that an MCDM model is primarily designed to represent reality [16], it is appropriate to base the share price of companies as a reference. In addition, MCDM methods come into play as a decision support element in a decision-making problem where there is uncertainty. In this context, the formal information content of MCDMs calculated by SD can be suggested as a criterion for the hierarchical ranking of MCDMs.

4.2. Findings and Results

There are over a hundred MCDM methods, and they all claim to offer the best solution. However, today there is still no consensus on the selection of the best MCDM method. These methods obviously have different computational procedures and they produce different sorting results in most cases. This makes us think that they can produce a unique distribution or have a different character, far from a coincidence. In this study, exploratory research of the specific capacity of MCDM methods was revealed. The SD objective procedure helped us in determining the specific characteristics of MCDM scores. Secondly, the RHO coefficient level, which expresses the FP-SR (stock return or percentage change in share price) correlation, was suggested as another confirmatory criterion. The results of this recommendation are shown in the tables below.
Table 4 shows the MCDM methods preferred in this study and the references based on the calculation stages. In this study, first of all, the performance criteria values, which are displayed in Table 5, were used to evaluate companies’ financial performances. An example initial decision matrix is shown below. This decision matrix contains raw data that has not yet been normalized.
We analyzed a period of 10 quarters in total. We clearly discovered that PROMETHEE II and FUCA were predominantly better for both benchmarks (SD and Rho), which is displayedin the following tables and figures. Table 6 below shows the specific final scores produced by the 7 MCDM methods examined in the study for the 2021/09 quarter selected as the sample base period. Table 6 shows that the scores produced by some MCDM methods are in the range of 0–1, some in the range of −1–0, and some have a high positive-negative distribution. This may give us a clue about the characteristics of MCDM methods. In this sense, the standard deviation of the normalized score value of the MCDM scores in question will give us an idea about their determinant aspects. It is clear that the technique used in the calculation steps has an effect on the distribution of the final scores of the MCDM methods. Whether a method is subject to the Outranking or value/utility school, the type of normalization used, the preference function, or the threshold value affects the distribution of results differently. In addition, some methods such as TOPSIS care about ideal values (PIS-NIS), and this distance-based approach also directly affects the results and score distribution.
In this study, we primarily use the SD criterion to compare seven MCDM methods. The final and specific scores produced by the MCDM methods have been normalized to justify comparison. In the next step, the SD value of the scores of each MCDM method was obtained. And the final findings are displayed in 
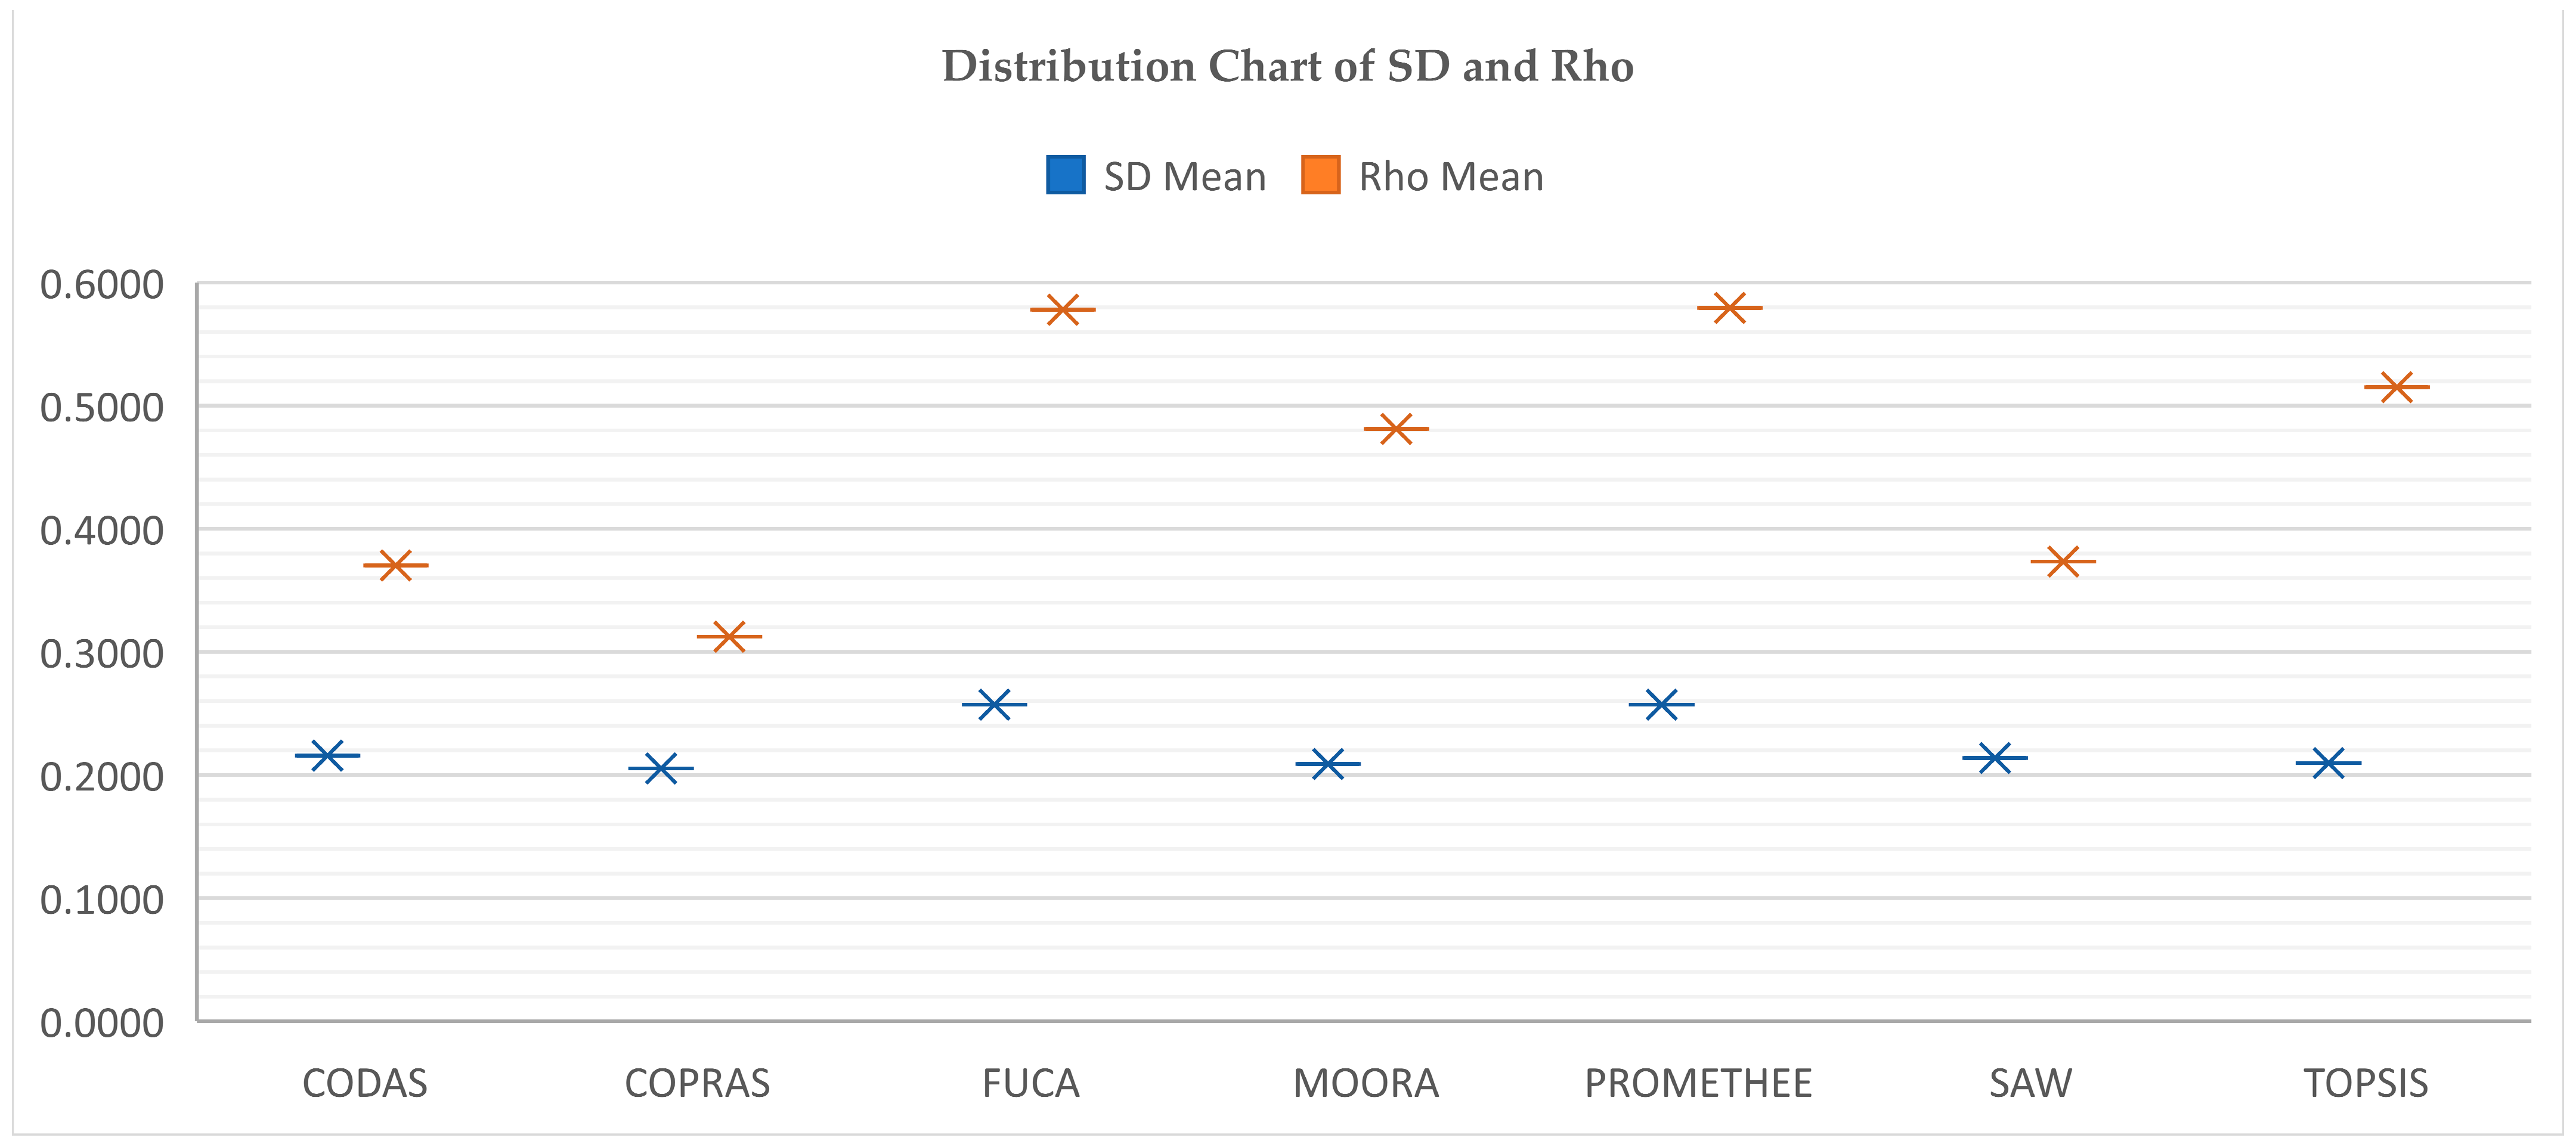
Table 7. Dominantly, PROMETHEE II and FUCA methods produced the highest SD values compared to other MCDM methods. The 10-quartile SD averages are: FUCA 0.257096854; PROMETHEE 0.257061822; CODAS 0.21565885; SAW 0.213692925; TOPSIS 0.209506837; MOORA 0.208981241; COPRAS 0.205142873. FUCA and PROMETHEE-2 methods produced the highest mean SD value at almost the same level. It is seen that COPRAS is in the last place in terms of mean SD value. So FUCA and PROMETHEE are stable while producing high SD value and COPRAS producing low SD value.
Table 8 shows the comparative rankings of the MCDM methods depending on SD values. It can be said that PROMETHEE-2 and FUCA methods produced almost the same results. Table 8 can be interpreted as follows: These two methods achieved a clear advantage over other MCDM methods by achieving 9 first places in 10 cases in terms of SD value. Although PROMETHEE&FUCA and COPRAS were uniquely stable in their success positions, it can be said that CODAS, SAW, TOPSIS and MOORA methods showed less stable performance among themselves in an intermediate gray zone, similar to each other.
In this study, we use the Rho criterion as a secondary validation criterion to compare seven MCDM methods. The final and specific scores produced by these methods were calculated as the Spearman correlation (Rho) with stock returns to justify the comparison. That is, the Rho value of the scores of each MCDM method was obtained for each base period. And the final findings are shown in Table 9. Compared to other MCDM methods, PROMETHEE II and FUCA methods predominantly produced the highest Rho values. The correlation coefficient produced by MCDM methods (10-quartile means) with return on stock was PROMETHEE 0.5796, FUCA 0.5781; TOPSIS 0.515; MOORA 0.4811; SAW 0.3734; CODAS 0.3701; COPRAS is 0.3122. PROMETHEE and FUCA methods produced the highest mean Rho values at almost the same level as the SD benchmark. Likewise, the COPRAS method has the lowest Rho’s, as in the case of SD criterion. Other MCDM methods similarly maintained their positions in the same gray area. But their positions among themselves differ from the previous situation (especially for CODAS).
Table 10 shows the comparative rankings of the MCDM methods depending on the Rho values. It can be said that PROMETHEE-2 and FUCA methods produce very similar results. The results points out that these two methods achieved a clear advantage over other MCDM methods by winning 7 times out of 10 cases. Although PROMETHEE&FUCA and COPRAS were uniquely stable in their success positions, it can be said that CODAS, SAW, TOPSIS, and MOORA methods showed less stable performance among themselves in an intermediate gray zone, similar to each other.
Table 11 may be helpful to further clarify the picture. Both SD and Rho benchmarks are shown here. Accordingly, it is understood that the large number of MCDM methods that are used in the study is beneficial. If the PROMETHEE, FUCA and COPRAS methods were not present in this study, it would obviously be difficult to evaluate the results. Because the performance of these methods is either too high or too low. Other methods, CODAS, MOORA, TOPSIS and SAW, showed relatively different performances for the two proposed comparison methods. This actually gives an idea of why the SD benchmark was rarely used before. The reason for this is that the results produced by these methods are very close to each other. Thus, this would be a difficult road for researchers looking for consistency in comparison.
Figure 2 below is the Performance Radar Graph of MCDMs based on SD benchmark. Here it can be better seen that the PROMETHEE&FUCA duo produces a predominantly higher SD.
Figure 3 Below is the performance radar graph of the MCDMs based on the Rho benchmark. It can be better seen here that the PROMETHEE&FUCA duo often produces a higher Rho.
It can be seen from the scatter plot (Figure 4) below that the PROMETHEE&FUCA pair usually produces higher Rho and SD.
Results in the tables show that PROMETHEE II and FUCA methods are more appropriate methods for financial performance measurement compared to other five methods. These two methods produced a common performance, so we can assume them as equivalent of each other. They produced a higher correlation with the stock market price, which is a real-life example. Moreover, the distribution of their final scores corresponds to a wider range. And that means they produce a higher SD value. In other words, since the amount of objective information of PROMETHEE-2 and FUCA is higher, it can be said that they are more important methods compared to others.
As it is clearly seen in the figures above, it is clear that the scores produced by PROMETHEE and FUCA methods give better results than other MCDM methods. Thus, in this case, there is very strong evidence that MCDM methods produce a characteristic sequence. In other words, MCDM methods can show a unique and consistent tendency. SD values and average values of RHO coefficients based on the relationship between share price and FP for the 10 quarters between 2019 and 2021 show remarkable and unique results. Accordingly, the SD score results show that PROMETHEE and FUCA produce more valuable information content compared to other methods. In addition, these results provide conclusive evidence that they better capture real life.
According to Zaidan et al. (2017), a SD value close to zero indicates that the data value is closer to the cluster mean [18]. A higher SD value means that the data is spread over a wider range of values. Thus, a MCDM with a higher SD has better ranking scores in essentially comparing alternatives. Because there is a more comprehensive and wider distribution, this allows an easier comparison between alternatives. On the other hand, the scores of the method with a low SD value are closer to the mean. This proximity reduces the tolerance to allow comparison between alternatives. The situation is somewhat similar to the difference between return on stocks and return on interest. The first is risky, has a wide distribution, but its returns are higher. The risk and dispersion of the latter are zero, and the return is usually small and stable. Thus, in general, it can be said that the SD value is a criterion for “value” or “significance”, as seen in many real-life examples.
Moreover, perhaps most importantly, these results show that MCDM methods have unique characteristics in terms of SD. Indeed, in the context of SD, the results show that both MCDM methods have certain objective tendencies, patterns, or capacities over the 10 quarters, consistently. In other words, the fact that MCDM methods consistently and often have higher or lower SD capacity for a given problem also facilitates the comparability of the methods. It can even be said that one side may be superior to the comparison in a way, if only the SD tendency of MCDM methods is based.
As a matter of fact, it can even be argued that a MCDM method is superior among other MCDM methods, borrowing the idea or theory underlying objective weighting methods. Because according to the SD weighting approach, a column with a higher SD value is considered more important because it has a higher information content [19].
The above results contain quite satisfactory and consistent information about the MCDM comparison. On the other hand, it should be taken into account that normalization types can affect SD results. In future studies, it may also be recommended to calculate SD scores for different types of normalization.

4.3. Discussion

As it is known, as a hypothetical approach, the methods used in the objective estimation of the importance of rankings (for example, SD as a statistical technique) are based on an assumption in terms of information content determination. Accordingly, for objective weight estimation methods, the larger the difference between the values of the items in the column, the more valuable the information contained in the criterion (indicator). In other words, the weight of a criterion is higher in direct proportion to the information content [30]. In fact, formally, the SD approach can be used to discover the information content of the final scores produced by MCDM methods [18], this approach is more clearly and boldly demonstrated in this study. No study has been found in the literature showing this approach with such clarity before. Although there is no rational obstacle in calculating the SDs of the normalized final scores of the MCDM methods, there might surely be some reservations for interpreting the results. In this study, the SDs of the methods were calculated first and then interpreted as an evaluation element in the comparison of MCDM scores. This innovative and adapted approach can be an easy, reassuring and objective alternative for decision makers who are struggling with the difficulties and uncertainties in choosing an appropriate MCDM method, an old and chronic problem that we discuss in this study.
In fact, comparing the characteristic performances of MCDM methods is an interesting and difficult subject. Considering that MCDM methods produce different scores, it would not be correct to directly compare them over raw scores. Normalized score should be used to ensure comparability of final scores of MCDM techniques [18]. SD has rarely been used to evaluate normalized MCDM scores. On the other hand, Zaidan et al. (2017) partially used the SD method for MCDM comparison. However, we do not find another example of this in the literature [18]. In this study, one more step was taken and it was clearly shown that the information content of MCDM methods can be measured according to the SD value and some valuable tendency, pattern or capacity signs can be captured with these measurement results.
In this study, we adopted another objective criterion confirming the real life SD criterion to provide highly consistent, characteristic and distinctive results. There are some studies that have recently tried this new approach and achieved positive results. These studies, which measure financial performance on the basis of MCDM, indicate that there is a natural and special MCDM evaluation solution in this field [17,28]. Accordingly, we benefit from satisfactory and significant correlations between share price and MCDM-based financial performance rankings. In this study, we observed that some MCDM methods such as PROMETHEE&FUCA provide these correlations to a higher degree. In other words, it has been clearly seen that some MCDM methods better capture or model real-life situations. Thus, we strengthened our argument by using these two objective mechanisms at the same time, which confirm each other, for the first time, to reveal the hidden capacities of MCDM methods.
The findings and results of our study open a new door to interesting and original discussions. We list them as follows:
  • Unconventionally, the SD procedure was used in this study for MCDM outputs (ranking results) rather than inputs (criteria). Normally, when criteria are used for weighting purposes, different criteria may be more important in different base periods. That means the weights are often changing. In this study, the SD that we used in the comparison of MCDM information contents provided very consistent results. The comparative performance success of MCDM methods in base periods is the same. In other words, PROMETHEE&FUCA clearly outperformed the other methods in terms of both SD and Rho criteria.
  • In order to solve problem scenarios and limitations of the study, we can compare information contents of MCDM methods. And this again reveals the greater capacity and the importance of the PROMETHEE&FUCA methods. Although the other methods has score levels close to PROMETHEE&FUCA as a characteristic tendency, it still maintains its place even in sensitive measures.
  • Our results show that PROMETHEE&FUCA might be more efficient than other methods. It is also noteworthy that PROMETHEE&FUCA can also work without normalization, similar to some outranking methods.
  • The most important finding of this study is the strong evidence about the scores of the methods having objective characteristics. In other words, a MCDM data as a set contains patterns that indicate certain capacity, and this means originality and superiority. Thus, the selection of a more appropriate and efficient MCDM method was discussed and some solutions were proposed with objective criteria in this study.
  • Random selection of any MCDM method may affect the decision to be taken. In this study, FP measurement was made. Comparing and measuring FP can be a good decision support system element for companies’ financial information users. For example, with this refined information, company owners can learn their success positions accurately compared to their competitors. Lenders can extend loans to companies that are able to pay their debts. Stock investors can use FP information regarding fundamental analysis in choosing the best stock.
Table 12 below lists the companies with the best FP according to the PROMETHEE&FUCA and other methods. Accordingly, when a random method is chosen, a different “best” alternative can be chosen. This will influence the strategic decisions made by decision makers. In other words, based on the findings in this study, we can say that the random choosing the best MCDM method may adversely affect the decisions. We discuss the automatic determination of a MCDM method based on real life and higher information content criteria. In the table below, it is clearly seen that the best performing companies have changed in some quarters according to MCDM methods.
The explanations we have listed below are what the study aims or does not aim; or sets clear boundaries about what it measures and what it does not:
  • Since the choice of preference function belongs to the decision maker, we used the commonly used usual type preference function for PROMETHEE II. This type of function is the only preference function that does not impose the “threshold value” on the decision maker. Thus, we minimized the subjective intervention authority of the decision maker, which is an important factor in comparability. According to the results of the study, PROMETHEE II that was calculated with the usual type preference function was more successful.
  • Other methods and PROMETHEE&FUCA are based on completely different principles (the schools of utility/value and outranking), and it is true that PROMETHEE is a much more sophisticated approach. On the other hand, since SAW has a simpler methodology, it can be argued that these results may not actually be normal or surprising anyway. By comparing an additional MCDM method, namely FUCA, and presenting it in the table below, we justify that this is a prejudice and underestimating claim. FUCA method comes first among the methods that have the simplest methodology among more than 100 methods. In this study, we compared the results of the more complex PROMETHEE II with the simpler FUCA method. According to the results obtained, although these methods have different methodologies and complexity, interestingly, they produced close to above 99% similar results. In other words, they produced almost the same performance according to both SD and rho criteria. These results show that methodological complexity cannot be a direct criterion for comparing the final scores of MCDM methods. In fact, this shows that what is valuable can sometimes be simple (see Table 13 and Table 14).
  • With these benchmarks, it is hard to claim which of the methods is the absolute better fit. But the findings from the study do contain some interesting and valuable indications of tendencies, patterns or capacities regarding SD and rho criteria. It is worth emphasizing that this study is not about methodological “inputs” but rather the “outputs”, which are the final results of MCDM methods. With the decision analytics approach, objective and consistent information about the performance of the result scores of MCDM methods was discovered through the historical data of the companies. For example, although the PROMETHEE II method is a sophisticated method, the information that it provides is the same ranking result as the FUCA method, which is one of the simplest methods. Understanding this with methodological formulas is a relatively difficult task, and no previous study in the literature was able to identify this finding.
  • The relationship between stock returns and MCDM results has been emphasized in few studies in the literature [17,28]. These studies states that this relationship changes according to MCDM methods. This was confirmed this study with PROMETHEE II/FUCA and other methods in this study. In addition, there are certain constraints in the studies on the type of financial performance measurement, such as the period, number of firms, country, sector and criteria, and this approach has been confirmed by changing these. Therefore, this is important if the same or different methods confirm the model in question even though the constraints have changed. In addition, this study showed that this proposed approach yielded predominantly parallel results with the SD criterion. Thus, for the first time, a dual authentication mechanism was tested and verified in this study.
  • The purpose of this study has nothing to do with “portfolio selection”, although the concepts of “return on shares”, which refers to price changes, are frequently mentioned in this article. However, this should be understood as evaluating the correlation between a MCDM type and stock return in terms of MCDM capacity. There is no choice recommendation regarding investing in a stock. Here, an alternative solution proposal has been proposed based on the findings obtained by data analytics to a methodological deadlock regarding MCDM comparison.
  • Basically, if the normalized score array of an MCDM method shows a higher standard deviation, it is of course difficult to assume that one method is absolutely better than the other. However, if the results consistently indicate higher values for some MCDM methods, at least for this problem scenario, we consider it appropriate to discuss whether this may be considered a tendency, capacity or a sign of conformity.
The design of this research was carried out by Zaidan et al. (2017)’s SD approach and Baydaş et al. (2022)’s Rho approach. In other words, this research further enhanced the context by using a dual verification mechanism. In addition, in parallel with the findings of Baydaş et al. (2022), PROMETHEE and FUCA were the most successful methods in this study. On the other hand, it was observed that some MCDM methods produced higher SD, similar to the approach in the study of Zaidan et al. (2017).

5. Conclusions

In the past, input-based rather than output-based methodological approaches have been proposed to compare MCDM methods. In this study, there is an effort to support and develop objective suggestions based on output. In general, Spearman rank correlation was used for output-based MCDM comparisons. On the other hand, Spearman results showed a high level of similarity between different MCDM methods. Although many decision makers cannot objectively explain why they prefer a MCDM method, they emphasize that they prefer a method suitable for the structure of the problem. Since each MCDM method claims to suggest the best alternative, it implicitly implies that it is actually the best method. Of course, it is normal for MCDM methods with different processing procedures to yield different results. These different results may have certain unique implications for MCDM methods. In this context, our study has tried to discover whether MCDM methods have certain patterns or characteristic tendencies according to the results they produce, with a dual verification mechanism.
Many previous studies have addressed developing the potential of MCDM inputs and this is the correct approach to some extent. The input capabilities and capacities of MCDMs are of course important, but we must emphasize that the results they produce are also important. In other words, MCDM methods should be compared not only with their methodology but also with their scores. In this direction, the originality of the final scores and the distributions they produce should also be examined. Therefore, unlike traditional approaches, MCDM outputs were used instead of inputs in this study and their SD level and their ability to relate to real life were evaluated. Our study compared 7 MCDM methods in this direction. And the findings show that PROMETHEE&FUCA produced higher performance value in base periods (10 quarters). The SD value of the FP scores obtained with PROMETHEE&FUCA in the base periods is higher. Also, PROMETHEE&FUCA has a predominantly higher correlation with share price. Therefore, it can be said that PROMETHEE&FUCA is more successful in terms of both the amount of information it contains and the level of capturing real life. In the context of these results, it is difficult to argue that one MCDM method is definitely better than another, and this may be a hasty assessment. We recommend testing this approach with many more MCDM methods for different decision problem scenarios to see the bigger picture.
Basically, this study, in which the financial performances of companies are calculated on the basis of MCDM, at the first stage, like other studies, calculates MCDM scores in order to find and recommend the most suitable alternative or ranking. In the next stage, unlike other studies, intense efforts were made to reveal the hidden abilities of MCDM methods in a result-oriented manner. Thus, in this study, a sustainable pairwise comparison mechanism (SD and Rho) was discovered and it was demonstrated that an objective MCDM comparison is possible. We recommend that decision makers and future researchers use these two confirmatory criteria to compare MCDM methods. In this respect, we think that our study has a high potential to contribute to the literature.

5.1. Limitations of This Study

It should not be forgotten that the restrictive parameters such as alternative, criteria, time, preference function, normalization type, weight coefficient, MCDM type related to the company used in this study directly affect the results.

5.2. Suggestions to Researchers

Among the MCDM methods (as in this study), if there are methods such as PROMETHEE or FUCA that give good results stably and those that perform at a lower level such as COPRAS, the comparison results become more pronounced. In the constraints of this study, methods such as TOPSIS, SAW, CODAS, and MOORA with average performance in the gray area produced results close to each other. But SD and Rho findings may not overlap. So in a comparison scenario with only these methods, the results would be confusing (without PROMETHEE, FUCA, or COPRAS). We suggest that very good and very poor performing MCDM methods should be included in the procedure and this is essential for clarifying results. Finally, there are more than 100 MCDM methods, among which there are more talented and successful ones. We suggest the authors explore them in terms of SD and Rho.

Author Contributions

Conceptualization, M.B. and D.P.; Formal analysis, M.B.; Methodology, M.B.; Validation, M.B. and D.P. All authors have read and agreed to the published version of the manuscript.

Funding

This research received no external funding.

Institutional Review Board Statement

Not applicable.

Informed Consent Statement

Not applicable.

Data Availability Statement

Not applicable.

Conflicts of Interest

The authors declare no conflict of interest

Appendix A

Table A1. Methodological Stages of PROMETHEE-2, TOPSIS and CODAS.
St.PROMETHEE-2TOPSISCODAS
1Designate the deviances as regards to the binary comparisons:
d j ( a , b ) = g j ( a ) g j ( b )
Creating a normalized decision matrix:
F i j = f i j i = 1 m f i j 2
Construct the normalized (max norm.) objective matrix:
F i j = f i j f j +   f o r   a   m a x i m i z a t i o n ,
w h e r e   f j + = M a x i m f i j
F i j = f j f i j   f o r   a   m i n i m i z a t i o n ,
w h e r e   f j = M i n i m f i j
2Computation of the preference function:
P j ( a , b ) = F j [ d j ( a , b ) ]                     j = 1 ,   ,   k
Obtaining the weighted normalized matrix:
v i j = F i j × w j
Construct weighted normalized objective matrix by multiplying each column with its weight, wj:
v i j = F i j × w j               i { 1 , 2 , , m } ;   j { 1 , 2 , , n }
3Computation of a preference index:
  a ,   b   A ,             π ( a , b ) = j = 1 k P j ( a , b ) w j
Finding positive (A+) and negative (A) ideal solutions:
A + = { ( M a x i ( v i j ) j J ) , ( M i n i ( v i j ) j J ) i 1 ,   2 ,   ,   m } = { v 1 + , v 2 + , v 3 + , , v j + ,   ,   v n + }
A = { ( M i n i ( v i j ) j J ) , ( M a x i ( v i j ) j J ) i 1 ,   2 ,   ,   m } = { v 1 , v 2 , v 3 , , v j ,   ,   v n }
Determine   the   negative - ideal   solution ,   A , by finding the worst value of each objective, which is the smallest value within the respective column of the objective matrix.
A = { ( M i n i ( v i j ) | i     1 ,   2 ,   ,   m }
= { v 1 ,   v 2 ,   v 3 ,   ,   v j ,   ,   v n }
4Computation of positive and negative outranking flows:
ϕ + ( a ) = 1 n 1 x A π ( a , x )
ϕ ( a ) = 1 n 1 x A π ( x , a )
Computing the positive and negative ideals’ distance values:
S i + = j = 1 n ( v i j v j + ) 2                 i = 1 ,   2 ,   3 ,   ,   m S i = j = 1 n ( v i j v j ) 2                 i = 1 ,   2 ,   3 ,   ,   m
Calculate the Euclidean and Taxicab distances between each solution and the negative-ideal solution:
E i = j = 1 n ( v i j v j ) 2     i = 1 , 2 , 3 , , m T i = j = 1 n | v i j v j |     i = 1 , 2 , 3 , , m
5Computation of the complete ranking:
ϕ ( a ) = ϕ + ( a ) ϕ ( a )
Computing relative proximity to ideal solution:
C i = S i S i + S i +
Construct the relative assessment matrix, as follows:
h i k = ( E i E k ) + ψ ( E i E k ) × ( T i T k )   i , k { 1 , 2 , , m } Here ,   ψ ( x ) = 1   if   | x |   τ     and = 0   if   | x | < τ   .
Recall τ = 0.02 is the threshold parameter to decide the degree of closeness of Euclidean distances. Calculate the assessment score of each solution
H i = k = 1 m h i k       i = 1 , 2 , 3 , , m
The   non - dominated   solution   having   the   largest   H i is the recommended solution.
Table A2. Methodological Stages of MOORA, COPRAS and SAW.
St.MOORACOPRASSAW
1Construct normalized objective matrix applying vector normalization:
F i j = f i j k = 1 m f k j 2
i { 1 , 2 , , m } ;
j { 1 , 2 , , n }
Construct normalized objective matrix:
F i j = f i j k = 1 m f k j
i { 1 , 2 , , m } ;   j { 1 , 2 , , n }
Construct the normalized objective matrix:
F i j = f i j f j +   f o r   a   m a x i m i z a t i o n ,
w h e r e   f j + = M a x i m f i j
F i j = f j f i j   f o r   a   m i n i m i z a t i o n ,
w h e r e   f j = M i n i m f i j
2Construct weighted normalized objective matrix:
v i j = F i j × w j
i { 1 , 2 , , m } ;
j { 1 , 2 , , n }
Construct weighted normalized objective matrix:
v i j = F i j × w j
i { 1 , 2 , , m } ;   j { 1 , 2 , , n }
Construct the weighted normalized objective matrix:
v i j = F i j × w j
3Calculate the performance scores for each solution:
P i = j = 1 g v i j j = g + 1 n v i j i { 1 , 2 , , m }
For each solution, calculate the sums of weighted normalized values for both benefit and cost objectives:
S i + = j = 1 g v i j
i { 1 , 2 , , m }
S i = j = g + 1 n v i j
i { 1 , 2 , , m }
Find the score of each optimal solution: A i = j = 1 n v i j
4 Determine the relative importance of each solution: Q i = { S i + + i = 1 m S i S i i = 1 m 1 S i   f o r   b o t h   b e n e f i t   a n d   c o s t S i +                 f o r   o n l y   b e n e f i t i = 1 m S i S i i = 1 m 1 S i                   f o r   o n l y   c o s t Find   the   largest   A i
Table A3. Methodological Stages of Std. Dev. Method and FUCA.
St.Std. Dev. MethodFUCA
1Normalizing ranking scores:
f o r   b e n e f i t   o b j e c t i v e
F i j = f i j m i n i m f i j m a x i m f i j m i n i m f i j
f o r   c o s t   o b j e c t i v e
F i j = m a x i m f i j f i j m a x i m f i j m i n i m f i j
For each of the objectives, rank 1 is assigned to the best value, and rank m is assigned to the worst value.
2Calculate the standard deviation of values of each ranking:
σ j = i = 1 m ( F i j F j ¯ ) 2 m
j { 1 , 2 , , n }
A weighted summation for each optimal solution i is computed:
v i = j = 1 n ( r i j × w j )

References

  1. Yalçın, N.; Bayrakdaroglu, A.; Kahraman, C. Application of fuzzy multi-criteria decision making methods for financial performance evaluation of Turkish manufacturing industries. Expert Syst. Appl. 2012, 39, 350–364. [Google Scholar] [CrossRef]
  2. Kou, G.; Peng, Y.; Wang, G. Evaluation of clustering algorithms for financial risk analysis using MCDM methods. Inf. Sci. 2014, 275, 1–12. [Google Scholar] [CrossRef]
  3. Hsieh, T.Y.; Lu, S.T.; Tzeng, G.H. Fuzzy MCDM approach for planning and design tenders selection in public office buildings. Int. J. Proj. Manag. 2004, 22, 573–584. [Google Scholar] [CrossRef]
  4. Mousavi-Nasab, S.H.; Sotoudeh-Anvari, A. A comprehensive MCDM-based approach using TOPSIS, COPRAS and DEA as an auxiliary tool for material selection problems. Mater. Des. 2017, 121, 237–253. [Google Scholar] [CrossRef]
  5. Lee, H.C.; Chang, C.T. Comparative analysis of MCDM methods for ranking renewable energy sources in Taiwan. Renew. Sustain. Energy Rev. 2018, 92, 883–896. [Google Scholar] [CrossRef]
  6. Dursun, M.; Karsak, E.E. A fuzzy MCDM approach for personnel selection. Expert Syst. Appl. 2010, 37, 4324–4330. [Google Scholar] [CrossRef]
  7. Molla, M.U.; Giri, B.C.; Biswas, P. Extended PROMETHEE method with Pythagorean fuzzy sets for medical diagnosis problems. Soft Comput. 2021, 25, 4503–4512. [Google Scholar] [CrossRef]
  8. Wątróbski, J.; Jankowski, J.; Ziemba, P.; Karczmarczyk, A.; Zioło, M. Generalised framework for multi-criteria method selection. Omega 2019, 86, 107–124. [Google Scholar] [CrossRef]
  9. Guarini, M.R.; Battisti, F.; Chiovitti, A. A methodology for the selection of multi-criteria decision analysis methods in real estate and land management processes. Sustainability 2018, 10, 507. [Google Scholar] [CrossRef] [Green Version]
  10. Danesh, D.; Ryan, M.J.; Abbasi, A. A Systematic Comparison of Multi-criteria Decision Making Methods for the Improvement of Project Portfolio Management in Complex Organisations. Int. J. Manag. Decis. Mak. 2017, 16, 1. [Google Scholar] [CrossRef]
  11. Kashid, U.S.; Kashid, D.; Mehta, S.N. A Review of Mathematical Multi-Criteria Decision Models with A case study. In Proceedings of the International Conference on Efficacy of Software Tools for Mathematical Modeling (ICESTMM’19), University of Mumbai, New Brunswick, NJ, USA, 18–19 April 2019. [Google Scholar]
  12. Ayhan, E. An Empirical Study for the Financial Situation of Youth CSOs in TRB1 Region of Turkey. Bingöl. Univ. J. Econ. Adm. Sci. 2019, 3, 39–72. [Google Scholar]
  13. Triantaphyllou, E. Multi Criteria Decision Making Methods: A Comparative Study; Kluwer Academic Publishers: London, UK, 2000. [Google Scholar]
  14. Ozernoy, V.M. Choosing The “Best” Multiple Critera Decision-Making Method. INFOR Inf. Syst. Oper. Res. 1992, 30, 159–171. [Google Scholar] [CrossRef]
  15. Eldrandaly, K.; Hadi, A.; Nabil Abdelaziz, A. An Expert System for Choosing the Suitable MCDM Method for Solving a Spatial Decision Problem. In Proceedings of the 9th International Conference on Production Engineering, Design and Control, Alexandria, Egypt, 10–12 February 2009. [Google Scholar]
  16. Munier, N. Economic growth and sustainable development: Could multicriteria analysis be used to solve this dichotomy? Environ. Dev. Sustain. 2006, 8, 425–443. [Google Scholar] [CrossRef]
  17. Baydaş, M.; Elma, O.E. An objective criteria proposal for the comparison of MCDM and weighting methods in financial performance measurement: An application in Borsa Istanbul. Decis. Mak. Appl. Manag. Eng. 2021, 4, 257–279. [Google Scholar] [CrossRef]
  18. Zaidan, B.B.; Zaidan, A.A.; Abdul Karim, H.; Ahmad, N.N. A new approach based on multi-dimensional evaluation and benchmarking for data hiding techniques. Int. J. Inf. Technol. Decis. Mak. 2017, 1–42. [Google Scholar] [CrossRef]
  19. Diakoulaki, D.; Mavrotas, G.; Papayannakis, L. Determining objective weights in multiple criteria problems: The critic method. Comput. Oper. Res. 1995, 22, 763–770. [Google Scholar] [CrossRef]
  20. Wang, Y.J. The evaluation of financial performance for Taiwan containershipping companies by fuzzy TOPSIS. Appl. Soft Comput. 2014, 22, 28–35. [Google Scholar] [CrossRef]
  21. Pineda, P.J.G.; Liou, J.J.; Hsu, C.C.; Chuang, Y.C. An integrated MCDM model for improving airline operational and financial performance. J. Air Transp. Manag. 2018, 68, 103–117. [Google Scholar] [CrossRef]
  22. Feng, C.M.; Wang, R.T. Performance evaluation for airlines including the consideration of financial ratios. J. Air Transp. Manag. 2000, 6, 133–142. [Google Scholar] [CrossRef]
  23. Yükçü, S.; Atağan, G. TOPSIS yöntemine göre performans değerleme. Muhasebe Finans. Derg. 2010, 45, 28–35. [Google Scholar]
  24. Shen, K.Y.; Tzeng, G.H. Combining DRSA decision-rules with FCA-based DANP evaluation for financial performance improvements. Technol. Econ. Dev. Econ. 2016, 22, 685–714. [Google Scholar] [CrossRef] [Green Version]
  25. Ban, A.I.; Ban, O.I.; Bogdan, V.; Popa, D.C.S.; Tuse, D. Performance evaluation model of Romanian manufacturing listed companies by fuzzy AHP and TOPSIS. Technol. Econ. Dev. Econ. 2020, 26, 808–836. [Google Scholar] [CrossRef]
  26. De Almeida-Filho, A.T.; De Lima Silva, D.F.; Ferreira, L. Financial modelling with multiple criteria decision making: A systematic literatüre review. J. Oper. Res. Soc. 2020, 72, 2161–2179. [Google Scholar] [CrossRef]
  27. Yaakob, A.M.; Gegov, A. Interactive TOPSIS based group decision making methodology using Z-Numbers. Int. J. Comput. Intell. Syst. 2016, 9, 311–324. [Google Scholar] [CrossRef] [Green Version]
  28. Baydaş, M.; Eren, T. Finansal Performans Ölçümünde ÇKKV Yöntem Seçimi Problemine Objektif Bir Yaklaşım: Borsa İstanbul’da Bir Uygulama. Eskişehir Osman. Üniversitesi İktisadi İdari Bilimler Derg. 2021, 16, 664–687. Available online: https://dergipark.org.tr/tr/pub/oguiibf/issue/65252/947593 (accessed on 1 February 2022). [CrossRef]
  29. Mukhametzyanov, I. Specific character of objective methods for determining weights of criteria in MCDM problems: Entropy, CRITIC and SD. Decis. Mak. Appl. Manag. Eng. 2021, 4, 76–105. [Google Scholar] [CrossRef]
  30. Tavana, M. Decision analytics in the world of big data and colorful choices. Decis. Anal. J. 2021, 1, 100002. [Google Scholar] [CrossRef]
  31. Brigham, E.F.; Houston, J.F. Fundamentals of Financial Management, 15th ed.; Cengage Learning: Belmont, CA, USA, 2019. [Google Scholar]
  32. Stewart, B. Best-Practice EVA: The Definitive Guide to Measuring and Maximizing Shareholder Value; John Wiley & Sons, Inc.: New York, NY, USA, 2013. [Google Scholar]
  33. Altman, E.I. Financial ratios, discriminant analysis and the prediction of corporate bankruptcy. J. Financ. 1968, 23, 589–609. [Google Scholar] [CrossRef]
  34. Carton, R.B. Measuring Organizational Performance: An Exploratory Study. Ph.D. Thesis, University of Georgia, Athens, GA, USA, 2004. [Google Scholar]
  35. Behzadian, M.; Kazemzadeh, R.B.; Albadvi, A.; Aghdasi, M. PROMETHEE: A comprehensive literature review on methodologies and applications. Eur. J. Oper. Res. 2010, 200, 198–215. [Google Scholar] [CrossRef]
  36. Abdullah, L.; Chan, W.; Afshari, A. Application of PROMETHEE method for green supplier selection: A comparative result based on preference functions. J. Ind. Eng. Int. 2019, 15, 271–285. [Google Scholar] [CrossRef] [Green Version]
  37. Wang, Z.; Parhi, S.S.; Rangaiah, G.P.; Jana, A.K. Analysis of Weighting and Selection Methods for Pareto-Optimal Solutions of Multiobjective Optimization in Chemical Engineering Applications. Ind. Eng. Chem. Res. 2020, 59, 14850–14867. [Google Scholar] [CrossRef]
  38. Wang, Z.; Rangaiah, G.P. Application and analysis of methods for selecting an optimal solution from the Pareto-optimal front obtained by multiobjective optimization. Ind. Eng. Chem. Res. 2017, 56, 560–574. [Google Scholar] [CrossRef]
  39. Fernando, M.M.L.; Escobedo, J.L.P.; Azzaro-Pantel, C.; Pibouleau, L.; Domenech, S.; Aguilar-Lasserre, A. Selecting The Best Portfolio Alternative from A Hybrid Multiobjective GA-MCDM Approach for New Product Development in the Pharmaceutical Industry. In Proceedings of the 2011 IEEE Symposium on Computational Intelligence in Multicriteria Decision-Making (MDCM), Paris, France, 11–15 April 2011; pp. 159–166. [Google Scholar]
  40. Baydaş, M.; Elma, O.E.; Pamucar, D. Exploring the Specific Capacity of Different Multi Criteria Decision Making Approaches under Uncertainty using Data from Financial Markets. Expert Syst. Appl. 2022, 197, 116755. [Google Scholar] [CrossRef]
  41. Zavadskas, E.; Kaklauskas, A. Determination of an Efficient Contractor by Using the New Method of Multicriteria Assessment. In ternational Symposium for “The Organization and Management of Construction”. In Shaping Theory and Practice; St. Edmudsbury Press: Suffolk, UK, 1996; pp. 94–104. [Google Scholar]
  42. Ghorabaee, M.K.; Zavadskas, E.K.; Turskis, Z.; Antucheviciene, J. A new combinative distance-based assessment (codas) method for multi-criteria decision-making. Econ. Comput. Econ. Cybern. Stud. Res. 2016, 50, 25–44. [Google Scholar]
  43. Brauers, W.K.; Zavadskas, E.K. The MOORA method and its application to privatization in a transition economy. Control Cybern. 2006, 35, 445–469. [Google Scholar]
  44. Hwang, C.L.; Yoon, K. Methods for multiple attribute decision making. In Multiple Attribute Decision Making; Springer: Berlin, Germany, 1981; pp. 58–191. [Google Scholar]
  45. Sałabun, W.; Urbaniak, K. A new coefficient of rankings similarity in decision-making problems. In International Conference on Computational Science; Springer: Cham, Switzerland, 2020; pp. 632–645. [Google Scholar]
  46. Xu, Y.J.; Da, Q.L. Standard and mean deviation methods for linguistic group decision making and their applications. Expert Syst. Appl. 2010, 37, 5905–5912. [Google Scholar] [CrossRef]
Figure 1. The Diagram of the Experimental Process.
Mathematics 10 01115 g001
Figure 2. Radar Graph of Performance of MCDMs Based on SD benchmark.
Mathematics 10 01115 g002
Figure 3. Radar Graph of Performance of MCDMs Based on Rho benchmark.
Mathematics 10 01115 g003
Figure 4. Distribution Plot of Rho and SD Data.
Mathematics 10 01115 g004
Table 1. MCDM Comparison Criteria, MCDM Methods, Performance Dimensions in This Study.
MCDM Objective Comparison CriteriaMCDM MethodsPerformance Dimensions
Standard Deviation (SD), Correlation with Share Price (Rho)PROMETHEE, FUCA, TOPSIS, SAW, CODAS, COPRAS, MOORAAltman-Z Score, ROE, ROA, MVA Margin, MVA Spread, Market-to-Book
Table 2. Financial Criteria, Calculation and References.
IndicatorsFormulasReferences
MVA SpreadMVA/Invested Capital[31]
MVA MarginMVA/Sales[31]
Market to BookMarket Value/Book Value[31]
ROENet Income/Common Equity[30]
ROANet Income/Total Assets[30]
ALTMAN-Z Score1.2 (Working Capital/Total Assets) + 1.4 (Retained Earnings/Total Assets) + 3.3 (EBIT/Total Assets) + 0.6 (Market Value of Equity/Book Value of Total Liabilities) + 1.0 (Sales/Assets)[33]
Share Return(Base Period Stock Price − Prior Period Stock Price)/Prior Period Stock Price[34]
Table 3. Stages of Standard Deviation (SD) Model [38].
StepsSD Calculation Process
firstNormalizing ranking scores:
for   benefit
F i j = f ij min i m f ij max i m f ij min i m f ij
for   cost
F i j = max i m f ij f ij max i m f ij min i m f ij
secondCalculate the standard deviation of each ranking:
σ j = i = 1 m ( F ij F j ¯ ) 2 m
j { 1 , 2 , , n }
Table 4. MCDM Methods Preferred in This Study And References Based on Their Calculation.
MCDM MethodsReferences
PROMETHEE II[36]
COPRAS[38,41]
FUCA[39]
MOORA[43]
SAW[38]
TOPSIS[44]
CODAS[37,42]
Table 5. Decision Matrix used for the MCDM Methods (2021/09K).
ALTMAN Z SCOREROEROAMVA MarginMVA SpreadMV/BV
ARCLK0.53840.04290.01140.45270.91861.0610
ASELS1.07780.02520.01761.68701.04731.0169
BIMAS0.76570.08770.0296−0.2519−0.5148−0.7222
DOHOL0.47250.01170.00770.51200.13900.1409
EKGYO0.20860.02050.01151.52380.15540.1332
EREGL1.57970.08160.05661.03020.83350.8386
FROTO0.63400.11910.01940.11422.62022.7019
GUBRF0.68950.02010.00200.48593.38295.5225
KCHOL0.14410.06320.00870.86270.32600.4473
KOZAA1.68930.04150.03841.32920.24090.5204
KOZAL3.52840.04690.04350.86930.47580.4718
KRDMD1.06780.08870.04580.75031.27271.2068
PETKM1.00190.11530.06880.38700.62330.5011
PGSUS0.25680.14960.01615.43181.12780.4980
SAHOL0.06660.05260.00744.59450.22860.2269
SASA1.61200.16700.04131.32935.95346.3814
SISE0.75110.04530.02451.37040.72620.7294
TAVHL0.22840.05780.01849.87590.56340.3756
TCELL0.44620.05690.02390.46380.35150.3107
THYAO0.30750.10940.02612.44650.64580.3048
TKFEN0.45290.05690.02350.40160.45060.4508
TTKOM0.52460.09590.03970.63100.82010.4315
TUPRS0.66100.06590.01150.22951.40301.2395
VESTL0.17200.04000.00690.06590.07780.0892
Table 6. Final Score Results Produced by MCDM Methods (for the 2021/09).
CODASCOPRASMOORATOPSISPRO-2SAWFUCA
ARCLK−3.3800.0280.0920.182−0.1010.15713.667
ASELS−2.1360.0390.1260.2330.2170.20310.000
BIMAS−2.5860.0140.0680.168−0.3040.15816.000
DOHOL−6.4380.0120.0410.099−0.6230.06919.667
EKGYO−5.6980.0160.0530.121−0.5000.09218.333
EREGL3.5910.0540.1940.3220.4780.3567.000
FROTO3.2330.0600.1970.3520.2750.3429.333
GUBRF3.1700.0710.2070.426−0.0290.30512.833
KCHOL−4.3070.0190.0670.140−0.3480.12616.500
KOZAA0.2100.0410.1460.2630.1300.25711.000
KOZAL4.2640.0580.2100.3820.2170.35910.000
KRDMD2.6600.0510.1810.3000.5220.3306.500
PETKM4.4510.0490.1850.3160.2750.3669.333
PGSUS3.3030.0580.1920.3450.2610.3379.500
SAHOL−2.6840.0320.1000.235−0.4200.16317.333
SASA15.5280.1330.4230.6170.8120.6993.167
SISE−2.1960.0340.1160.2040.1740.20310.500
TAVHL2.9640.0640.1970.404−0.0430.30513.000
TCELL−3.1460.0230.0840.157−0.2750.16215.667
THYAO0.1660.0390.1360.2410.1160.25411.167
TKFEN−3.0350.0240.0880.163−0.2170.16615.000
TTKOM0.4550.0370.1350.2370.1300.26211.000
TUPRS−2.0260.0350.1160.2230.1090.20011.167
VESTL−6.3620.0090.0340.087−0.8550.07022.333
Table 7. SD Values of Firms’ MCDM based Financial Performance Scores (Green means the method is successful, gray means the method is mediocre, and blue means the method is unsuccessful).
Q10Q9Q8Q7Q6Q5Q4Q3Q2Q1
FUCA0.22810.24170.25230.26890.27290.29300.23100.23740.27070.2749
PROMETHEE0.22780.24170.25230.26890.27290.29300.23100.23740.27060.2749
CODAS0.21400.19550.21850.23150.24080.20320.21880.22100.23180.1816
SAW0.20960.19520.22420.23030.23970.20020.21690.21370.22710.1802
TOPSIS0.22630.19880.17800.19690.23010.18840.18700.25600.22190.2118
MOORA0.20710.20550.18900.20100.23610.19430.18950.23790.22280.2066
COPRAS0.20740.17880.21870.18290.25140.18690.18420.21280.21280.2156
Table 8. Performance Ranking of MCDM Methods according to SD.
Q10Q9Q8Q7Q6Q5Q4Q3Q2Q1
FUCA1121222312
PROMETHEE2212111421
CODAS4553433536
SAW5634544647
TOPSIS3476766164
MOORA7365655255
COPRAS6747377773
Table 9. Spearman’s Rho Coefficient between MCDM-based Financial Performance Scores and Real-Life Stock Returns (Green means the method is successful, gray means the method is mediocre, and blue means the method is unsuccessful).
Q10Q9Q8Q7Q6Q5Q4Q3Q2Q1
PROMETHEE0.6230.5430.6310.5230.8160.3940.6310.6440.4280.563
FUCA0.6110.540.6190.520.8130.40.6310.6590.4260.562
TOPSIS0.4540.6820.5120.5230.610.2910.6690.4220.6030.384
MOORA0.4820.5630.4170.4080.6310.3380.5760.4680.4840.444
SAW0.480.6230.2370.3020.5990.2810.2510.1930.4930.275
CODAS0.4270.7040.2710.2790.5940.1870.2430.1290.5790.288
COPRAS0.5090.290.2250.4710.7540.316−0.7140.570.5870.114
Table 10. Performance Ranking of MCDM Methods according to Spearman’s Rho.
Q10Q9Q8Q7Q6Q5Q4Q3Q2Q1
PROMETHEE1511123261
FUCA2623212172
TOPSIS6232551514
MOORA4445434453
COPRAS3774347327
SAW5366665646
CODAS7157776735
Table 11. Both SD and Rho Benchmark Findings.
SD MeanRank Rho MeanRank
FUCA0.2570971PROMETHEE0.57961
PROMETHEE0.2570622FUCA0.57812
CODAS0.2156593TOPSIS0.5153
SAW0.2136934MOORA0.48114
TOPSIS0.2095075SAW0.37345
MOORA0.2089816CODAS0.37016
COPRAS0.2051437COPRAS0.31227
Table 12. Top Performers by PROMETHEE&FUCA and COPRAS in the 10th Quarter (2019–2021).
QuartersPROMETHEE&FUCA
(Most Suitable)
COPRAS
1. QuarterSASASASA
2. QuarterTUPRSFROTO
3. QuarterSASAGUBRF
4. QuarterKRDMDGUBRF
5. QuarterASELSGUBRF
6. QuarterKCHOLGUBRF
7. QuarterGUBRFPGSUS
8. QuarterFROTOGUBRF
9. QuarterKOZALKOZAL
10. QuarterBIMASKOZAL
Table 13. Comparison Results for Significance Levels of PROMETHEE II and FUCA by SD Values in 10-Quarters (2019–2021).
QuartersPROMETHEEFUCA
2021/090.2277910.228084
2021/060.2417430.241742
2021/030.2522920.252292
2020/120.2689350.268935
2020/090.2729330.272933
2020/060.2930160.293015
2020/030.2310370.231036
2019/120.2373630.237362
2019/090.2705960.270652
2019/060.2749130.274912
Table 14. MCDM Comparison Results by Spearman Rho Coefficient between FP and SR in 10-Quarters (2019–2021).
2021/092021/062021/032020/122020/092020/062020/032019/122019/092019/06
F (PROMETHEE)0.6230.5430.6310.5230.8160.3940.6310.6440.4280.563
p-Value0.0010.0060.0010.0090.0000.0560.0010.0010.0370.004
Final Rank (FUCA)0.6110.540.6190.520.8130.40.6310.6590.4260.562
p-Value0.0020.0060.0010.0090.0000.0530.0010.0000.0380.004
Publisher’s Note: MDPI stays neutral with regard to jurisdictional claims in published maps and institutional affiliations.

