Article

Developing a Deep Neural Network with Fuzzy Wavelets and Integrating an Inline PSO to Predict Energy Consumption Patterns in Urban Buildings

1
Department of Industrial Engineering, Urmia University of Technology, Urmia 5716693188, Iran
2
School of Architecture Urban Planning Construction Engineering, Polytechnic University of Milan, 29121 Piacenza, Italy
3
Department of Architecture, Ahvaz Branch, Islamic Azad University, Ahvaz 6134937333, Iran
4
Department of Construction Engineering and Management, Pars University, Tehran 1413915361, Iran
5
Management Science Research Group, Faculty of Ocean Engineering Technology and Informatics, Universiti Malaysia Terengganu, Kuala Nerus 21030, Terengganu, Malaysia
6
Department of Electrical Engineering, Dolatabad Branch, Islamic Azad University, Isfahan 8341875185, Iran
*
Author to whom correspondence should be addressed.
Mathematics 2022, 10(8), 1270; https://doi.org/10.3390/math10081270
Submission received: 17 February 2022 / Revised: 6 March 2022 / Accepted: 21 March 2022 / Published: 11 April 2022
(This article belongs to the Special Issue Mathematical Methods in Energy Economy)

Abstract

:
Energy has been one of the most important topics of political and social discussion in recent decades. A significant proportion of the country’s revenues is derived from energy resources, making it one of the most important and strategic macro policy and sustainable development areas. Energy demand modeling is one of the essential strategies for better managing the energy sector and developing appropriate policies to increase productivity. With the increasing global demand for energy, it is necessary to develop intelligent forecasting methods and algorithms. Different economic and non-economic indicators can be used to estimate the energy demand, including linear and non-linear statistical methods, mathematics, and simulation models. This non-linear relationship between these indicators and energy demand has led researchers to search for intelligent solutions, such as artificial neural networks for non-linear modeling and prediction. The purpose of this study was to use a deep neural network with fuzzy wavelets to predict energy demand in Iran. For the training of the presented components, a hybrid training method incorporating both an inline PSO and a gradient-based algorithm is presented. The provided technique predicts energy consumption in Tehran, Mashhad, Ahvaz, and Urmia from 2010 to 2021. This study shows that the presented method provides high-performance prediction at a lower level of complexity.

1. Introduction

The residential construction industry represents one of the world’s largest energy consumers, and it is economically and environmentally vital. As energy consumption increases, so do emissions, which are widely recognized as the primary cause of climate change and its consequences. As a result of these concerns, governments and international organizations have been increasing efforts to balance energy production and consumption with environmental concerns [1]. In order to ensure long-term energy security, the energy–demand balance should consider not only how to generate energy, but also how to increase performance. If the systems are under-estimated, they may not be able to meet the comfort needs of the inhabitants [2]. The energy consumption of a building is determined by its thermal condition and the behavior of its occupants. Assessing and quantifying occupant behavior is a more challenging task than evaluating the exterior and thermal condition of a building. Researchers have studied this issue for many years. According to research, the estimation of occupants’ energy consumption can be performed by identifying their patterns of behavior (occupation status, number of occupants, placement of occupants, action taken by occupants) [3]. Accordingly, this study explores a novel method of assessing building energy consumption by identifying and quantifying inhabitant activity in terms of time usage data.
In order to meet the growing global energy demand, advanced forecasting methodologies are required. Economic and non-economic variables are used to estimate energy demand, which can be determined using linear and non-linear analysis tools, arithmetic, and modeling techniques [4]. The non-linearity of these variables and energy consumption has led to the creation of intelligent solutions, such as evolutionary computation, fuzzy models, neural networks, and convolutional neural networks for non-linear analysis and simulation. Modeling energy usage is typically based on the previous usage. Financial, social, and environmental factors influence energy consumption. Currently, data processing is an area of interest for a number of researchers, which has led them to focus on the issue of power generation. Simulation is beneficial and efficient in some areas of policy development. It is, therefore, impossible to achieve energy security without a thorough understanding of historical and current energy use, as well as possible future demands. Developing models and projections of energy consumption is essential for legislators and other groups involved in the development of countries [5]. It is possible that consumption ignorance can lead to power shortages, which can have catastrophic effects on economies and societies. An overestimate of energy consumption can result in excess capacity, leading to financial waste. Consequently, to avoid making incorrect decisions, it is preferable to use models that provide more precise predictions of energy consumption. Additionally, it is preferable to employ a predictive model to handle non-linear energy usage data. Based on prior studies, multiple regression is the most common method of forecasting energy consumption. Nonetheless, for potential users, such as energy scientists, the meta-heuristic method is more appealing and meaningful since it enables more reliable energy utilization, regardless of the time savings [6]. Additionally, this technique offers fast computation, cheap efficiency, and ease of use for those with less technical knowledge. Due to this, using artificial neural networks (ANNs) for analysis and simulation is an objective that has been pursued throughout the past decade [7]. As a result, ANNs offer a number of advantages, including faster processing times, shorter development times, and superior estimation capabilities. Artificial intelligence is particularly effective for preempting unclear situations. There are no mathematical formulas or background knowledge for the inputs and outcomes. By using electricity, financial, capital, and geographic data, this study aims to estimate and anticipate power consumption in Iran. Due to the complexity of architectural power generation, ANNs are an effective tool for non-linear evaluation.
ANNs are composed of layers of discrete units called “neurons”. In a typical network, each neuron in one layer is connected to all neurons in subsequent layers [8,9]. The ‘weights’ are the connections between neurons. Using a neural network, these weights are assigned appropriate quantitative values. This can be accomplished through the use of training data, which involves feeding the network a collection of real data. As a result of these possible combinations, the network learns and adjusts its weights accordingly. ANNs are capable of learning from past experiences. A conventional, feedforward neural network is employed in this investigation. In a feedforward system, data travel only in one direction, forward, from the layers of neurons to the output neurons, passing through any hidden neurons (if any).
The collection of resident activity data is essential for assessing the effects of usage on building energy performance. Simulation-based research was conducted in order to achieve this goal [10,11,12]. Carlucci et al. (2016) [13] examined the resource efficiency of a residential structure in Shanghai using stochastically generated occupancy patterns. Based on the analysis, the energy performance unpredictability was as high as 10% due to the unpredictability of occupancy patterns. According to the research, this inconsistency was also more noticeable in high-performance buildings than in poorly insulated structures. Motuziene and Vilutiene (2013) [14] analyzed the residential sector in Lithuania and found that the number of inhabitants, the age of the inhabitants, and their behavior all affected energy use for heating, illumination, and air flow. As a result of evaluating various occupation characteristics, the energy usage of the building varied from 13% to 30%. In terms of forecasting time series, numerical and analytical approaches proved very useful. Nevertheless, they are not without certain disadvantages, such as the fact that the consequence form of the study variables may not be well described if the methodologies are not properly understood. In addition, outdated data can lead to biased estimates of pattern parameters. Additionally, although most time series patterns are linear, they cannot describe non-linear processes. In recent years, artificial intelligence models were widely used as a non-linear approximation method to solve the difficulties described above. Consequently, the objective of this study is to model the characteristics that influence energy consumption in residential buildings by using statistical and econometric methods and then to investigate and forecast internal energy consumption. Based on the previous years, 2010–2021, and the energy in Tehran, Ahvaz, Mashhad, and Urmia, optimization methods were employed. By comparing the anticipated, supra-innovative approaches, the most accurate and reliable method of estimating power consumption in the nation’s regions may be found.
The paper is organized as follows: (1) the Introduction that describes the main problem, highlights the contribution, and demonstrates the novelty of the method, (2) the Literature Review that provides information about recent research regarding both method and problem, (3) the Methods and Materials section that provides an overview of the approach characteristics and introduction to presented strategies, (4) the Results and Discussion sections that provide results of the prediction using the provided method, and (5) the Conclusion section that concludes the presentation with a look at the overall results and future directions.

2. Literature Review

Reduced energy consumption has been proven to be one of the most cost-effective ways to improve energy conservation. Often, efficiency improvements can be achieved by using less energy to accomplish the same tasks or achieve the same objectives. Matar (2016) [15] discussed the impact of improving home energy efficiency on power consumption patterns in Saudi Arabia. The improvement in the energy efficiency of air conditioners from 7 to 11 would result in a reduction of 225,000 tons of oil used in power generation each day. In contrast, increasing the insulation level from 27 to 64 percent would save 158,000 barrels of oil per day. The study of Al-Tamimi (2017) [16] examined the policy initiatives to improve energy efficiency in Saudi Arabian buildings and concluded that steps must be taken to embrace energy-efficient technology in the construction industry. An extensive investigation of the effects of various energy-conservation techniques on residential energy consumption in the Kingdom of Saudi Arabia was performed, including changes to exterior and interior walls, window designs, shading, exterior surface color, flow velocity, and thermal crossings [17]. Jiang et al. (2021) [18] examined a broadband cancellation technique for adaptive co-site interference cancellation systems. As a consequence, the simulations and tests support the theoretical analysis validity and efficacy. Li et al. (2021) [19] describe the impact of natural and social environmental elements on building energy usage. Findings indicate that multidisciplinary interactive research that utilizes dual viewpoints of natural and social contexts is likely to generate new ideas. Researchers have recently focused on adoptive neuro-fuzzy inference systems (ANFIS), which combine fuzzy if–then rules into a neural-network-like structure [20]. The first-order Takagi–Sugeno system, which was extensively used in increasing energy prediction research, forms the structure of the ANFIS utilized in this study. Dong et al. (2021) [21] developed a classification-based, ensemble-learning approach for energy-use prediction. In their study, hourly weather data from a weather station were used, along with energy usage information from a New York office building. To begin, a decision tree was used to mine energy usage trends and categorize data into appropriate groups. The ensemble-learning approach was then applied to each pattern to create energy consumption projections. It was demonstrated that the recommended method was both reliable and effective. Furthermore, this method was able to obtain adequate results with a minimal dataset, which is beneficial for applications that forecast energy consumption. To estimate building energy use, Somu et al (2021) [22] developed a k-CNN-LSTM, which uses electricity gathered at specified intervals. The summary of the research shows in Table 1.
The k-CNN-LSTM utilizes k-means clustering to determine the energy usage template and convolutional neural networks (CNN) to retrieve advanced structures with non-linear connections that affect energy consumption. A long-short-term memory (LSTM) artificial neural network can be used to represent temporal features in time series analysis. It should be noted that the precise energy usage prediction produced by k-CNN-LSTM is an excellent deep-learning model for issues of energy usage forecasting due to its ability to understand spatial and temporal relationships within the datasets.
Li et al. (2021) [35] proposed a unique transfer learning approach for detecting cross-scene pavement discomfort. Zhang et al. (2021) [36] proposed friction-based isolation solutions for masonry buildings. Findings show that a reduction of 45 to 56 percent was observed in absolute growth, depending on the kind of ground motion. This reduction was mainly caused by the isolated building’s top roof level. Wang et al. (2021) [37] suggested a technique for electrical substation fault diagnostics based on a rough set-based bio-inspired fault model. The suggested solution outperforms existing options in experiments conducted on genuine 110 kV and 750 kV substations. Popoola et al. (2021) [23] presented a method for controlling maximum demand based on the ranking of end-use appliances and event identification. The appliance that was selected by the customer was one of the most valuable components of the approach since it allowed inhabitants to adjust their load power to meet their demands at any time, regardless of whether generation capacity management was active or not. Findings indicated that peak usage and energy demand can be reduced by 3% to 20%, with energy savings of 14.05% for the time-of-use periods and energy efficiency. These provide a new, cost-saving relationship between energy consumption and load consumers, which offers a fresh perspective on load forecasting. Wang et al. (2021) [38] proposed a weighted corrective fuzzy reasoning spiking neural P system for fault identification in variable-topology power systems. In Mokhtari and Jahangir’s study (2021) [25], the objective was to determine the best occupant distribution that resulted in the lowest number of sick people and the least energy consumption. A university building in Tehran was selected as a case study due to its versatility in implementing various occupant distribution patterns. Using the objective functions of electricity consumption and COVID-19-contaminated persons, the NSGA-II method was used to solve this multi-objective optimization problem. In the study, it was found that an ideal population distribution could reduce the number of sick people by up to 56% while simultaneously reducing energy consumption by 32%. Additionally, virtual learning helped colleges reduce the number of illnesses and energy consumption. The above table summarizes research in the field of building energy pattern prediction.

3. Materials and Methods

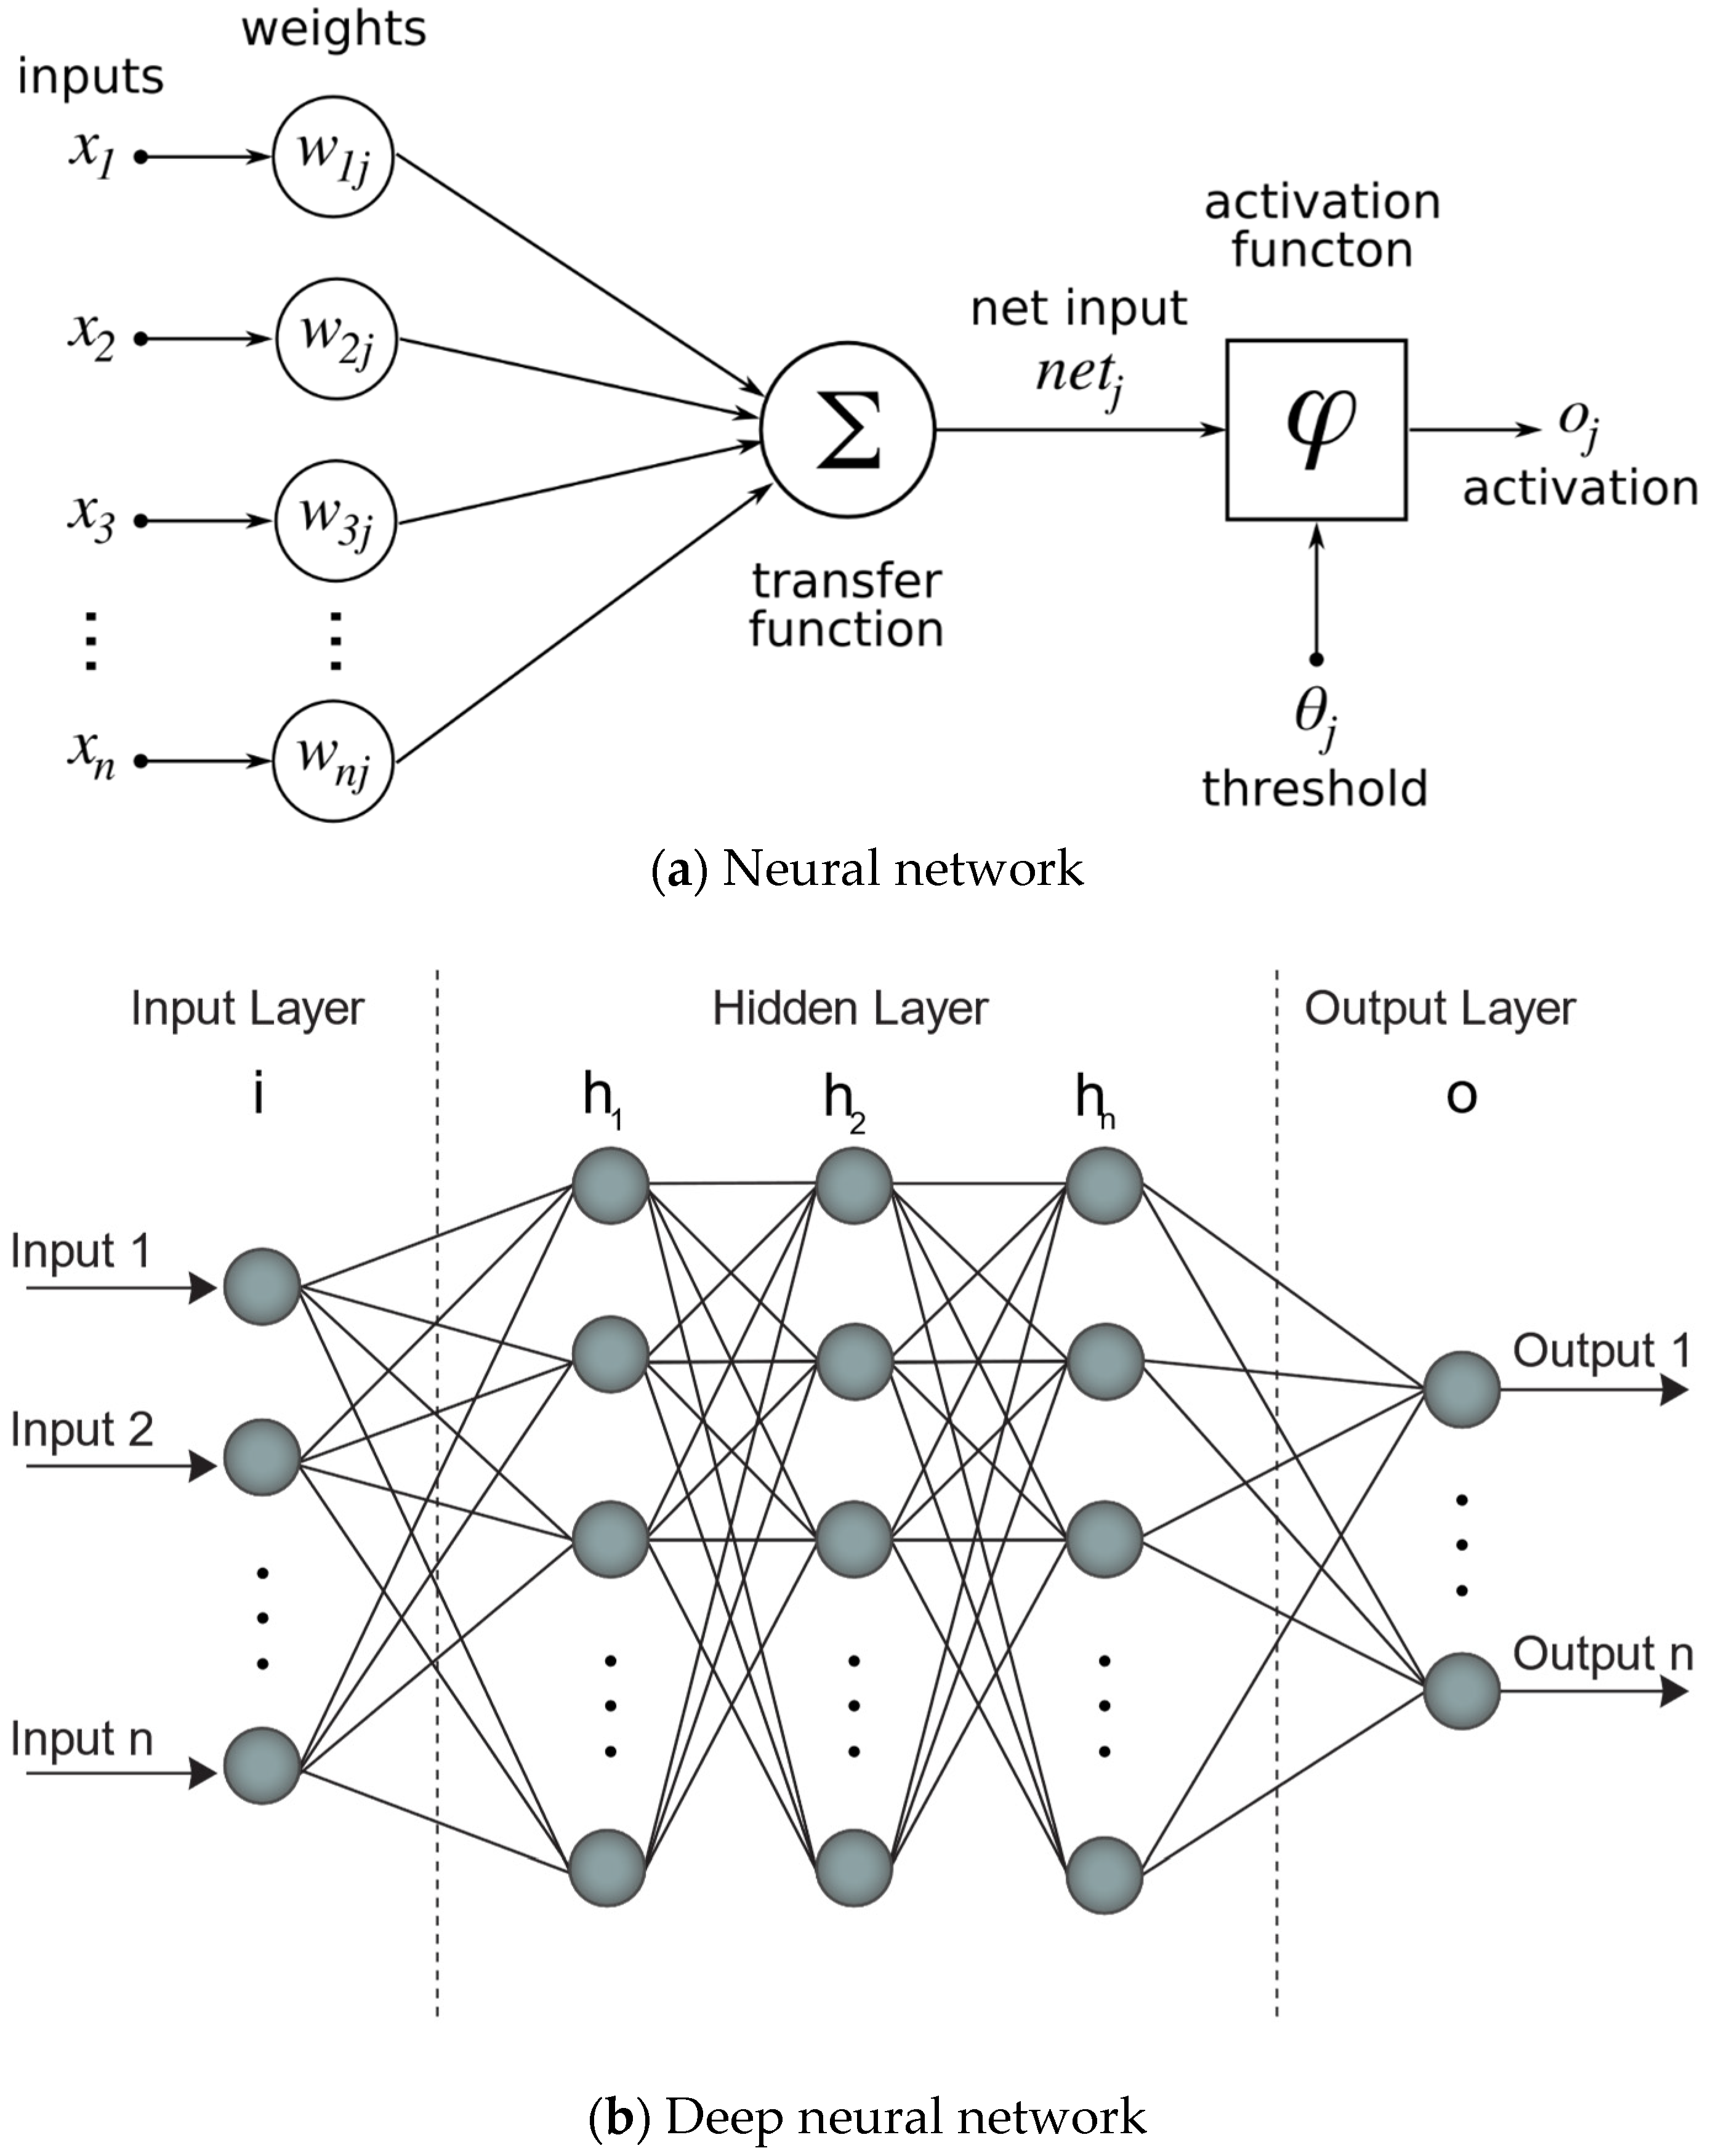
3.1. Deep Neural Network

In this article, we explore the challenge of understanding a notion learned by a deep neural network (DNN). A DNN is a group of neurons that is organized in layers. Each layer receives input from the preceding layer’s neurons, and each layer performs a specific function. The network’s neurons create a complex, non-linear mapping from input to output. A loss feedforward algorithm is used to adjust the weights of each neuron in order to learn this translation from the input. Figure 1 illustrates an example of a neural network [39].
A neuron in the upper portion represents the concept of an artificial neural network. In addition to being conceptual (i.e., we cannot see them), the DNN’s process by which it creates is generally comprehensible.

3.2. Fuzzy Logic

The fuzzy sets developed by Zadeh (1965) [40] led to the development of fuzzy logic. In a fuzzy set, the components are assigned a degree of membership, usually a number between 0 and 1. Fuzzy logic is achieved by assigning degrees of validity to arguments. The standard set of real numbers (degrees) is [0, 1], where 00 denotes “completely false”, 11 denotes “completely true”, and the remaining digits denote “partial truth”, i.e., transitional degrees of reality. It is common to use the term “fuzzy logic” in a broad sense to refer to a variety of conceptual frameworks and approaches that focus on the systematic management of some sort of degree [41]. The focus is on practical solutions that can tolerate suboptimality and imprecision, particularly in engineering situations (fuzzy control, fuzzy identification, fuzzy intelligence) [42]. As given in this item, fuzzy logic is defined in a restricted sense, formed as a branch of mathematics following Hájek et al. (2003) [43] landmark. In recent years, this concept has been referred to as “fuzzy mathematical logic” [44]. It examines logic through a realistic representation of partial truth in the spirit of traditional, formal logic.
TSK fuzzy frameworks were used to characterize the DNFW based on various fuzzy rules. Each fuzzy system was composed of multiple wavelet transforms, each with a configurable interpretation, and dilation variables were used as the outcome. In a TSK fuzzy model, each input is divided into fuzzy regions, and each fuzzy region is assigned a degree of membership in the IF section. A fixed or linear function of inputs is implemented in the THEN section of the rules. According to Wang (1996) [45], the IF–THEN requirements are the following:
R k : IF   x 1   is   A k 1 . AND   x n   is   A k n THEN   y k = a k 0 + a k 1 x 1 + + a k n x n ,
where R k is the kth rule of fuzzification, and x j and A k j are fuzzy features and fuzzy sets. The membership functions of fuzzy of A k j , normally distributed, are as follows:
μ k j ( x j ) = exp ( ( x j c k j σ k j ) 2 )
Additionally, c k j illustrates the central points, and σ k j shows the standard deviation of membership function related to k. The results of the TSK fuzzy method with M rules are as follows:
y = k = 1 M y k j = 1 n μ k j ( x j ) k = 1 M j = 1 n μ k j ( x j )

3.3. Wavelet Transformation

A wavelet algorithm is an essential technique frequently used in signal processing. Through it, specific patterns can be deduced from large amounts of data. Modeling tasks are required to solve the prediction problem using time series and neural networks. As a generic predictor, neural networks have limited ability to estimate significant non-linearities. Wavelets can display functions and reveal their local features simultaneously in the time–frequency domain. As a result of these features, it is easier to train neural networks to accurately model very non-linear signals. A wavelet is defined as follows:
ψ a , b = | a | 1 / 2 ψ ( x b a ) , ( a , b R , a 0 )
where ψ ( x ) L 2 ( R ) is wavelet function based on the following mathematical equation:
C ψ = 0 + | ψ ˆ ( ω ) | 2 ω d ω < + ,
where ψ ^ ( ω ) is the Fourier transform of ψ ( x ) . Multi-dimensional wavelets must be defined in order to simulate multivariable processes. Multi-dimensional wavelets are defined as follows in this paper:
Ψ i ( x ) = j = 1 n ψ ( x j b i j a i j ) , i = 1 , 2 , , N ,
where x = ( x 1 , x 2 , , x n ) T is independent data, b i = ( b i j ) is translation, and a i = ( a i j ) is dilation data. In addition, the output layer y = ( y 1 , y 2 , , y q ) T is calculated as follows:
y m = i = 1 N w m i Ψ i + y ¯ m , m = 1 , 2 , , q ,
where w = ( w m i ) and y ¯ = ( y ¯ 1 , y ¯ 2 , , y ¯ q ) are the weights matrix and the bias, and N is the neuron number in the hidden layer. Wavelet and neural network structures are combined in the following equation to predict features.

3.4. Deep Neural Network Based on Fuzzy Wavelet
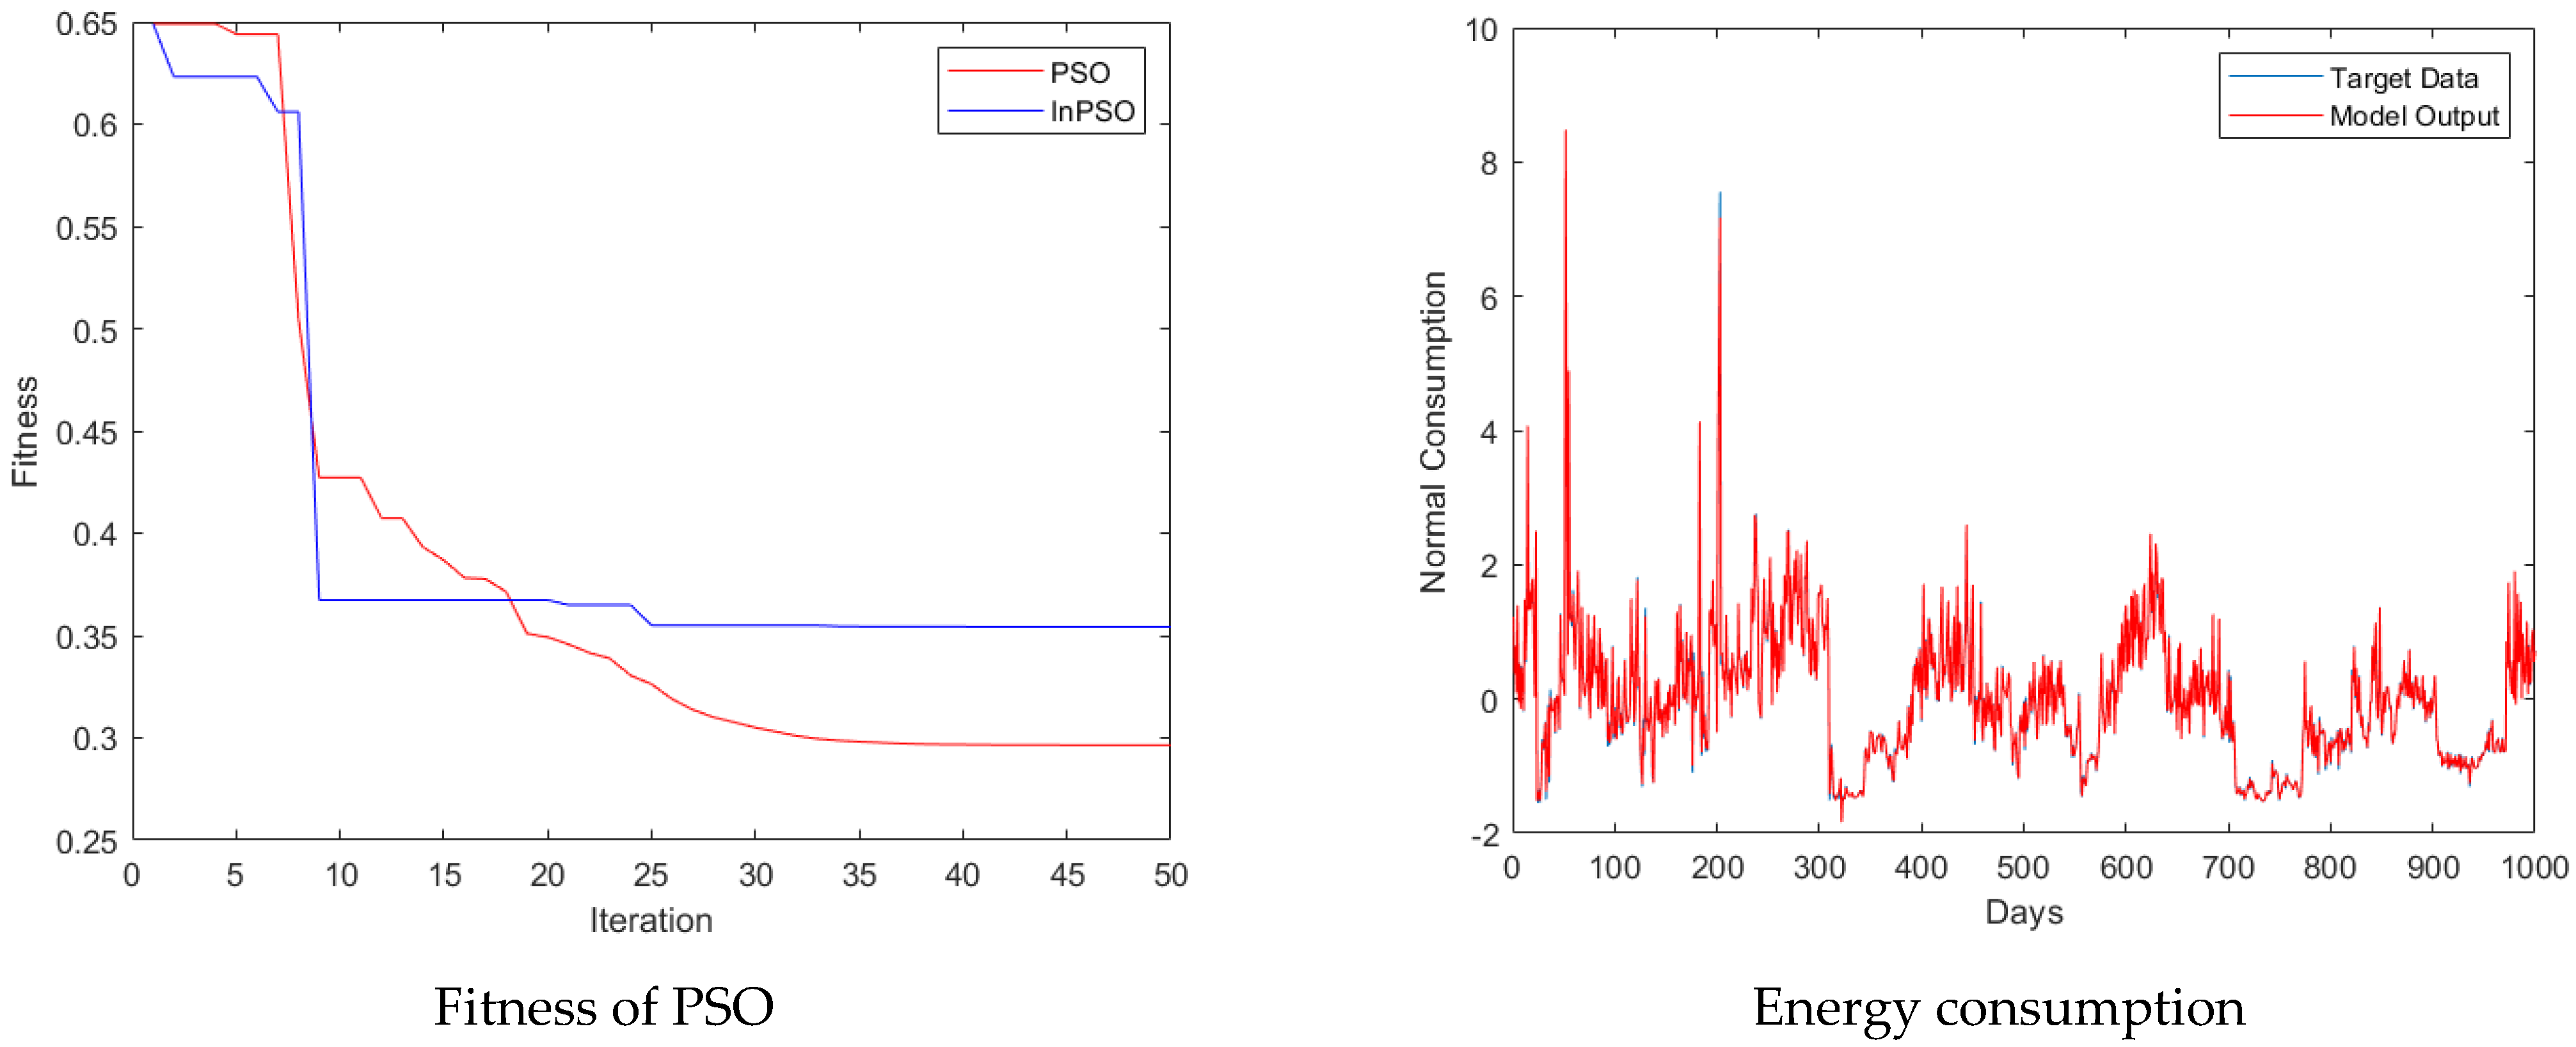
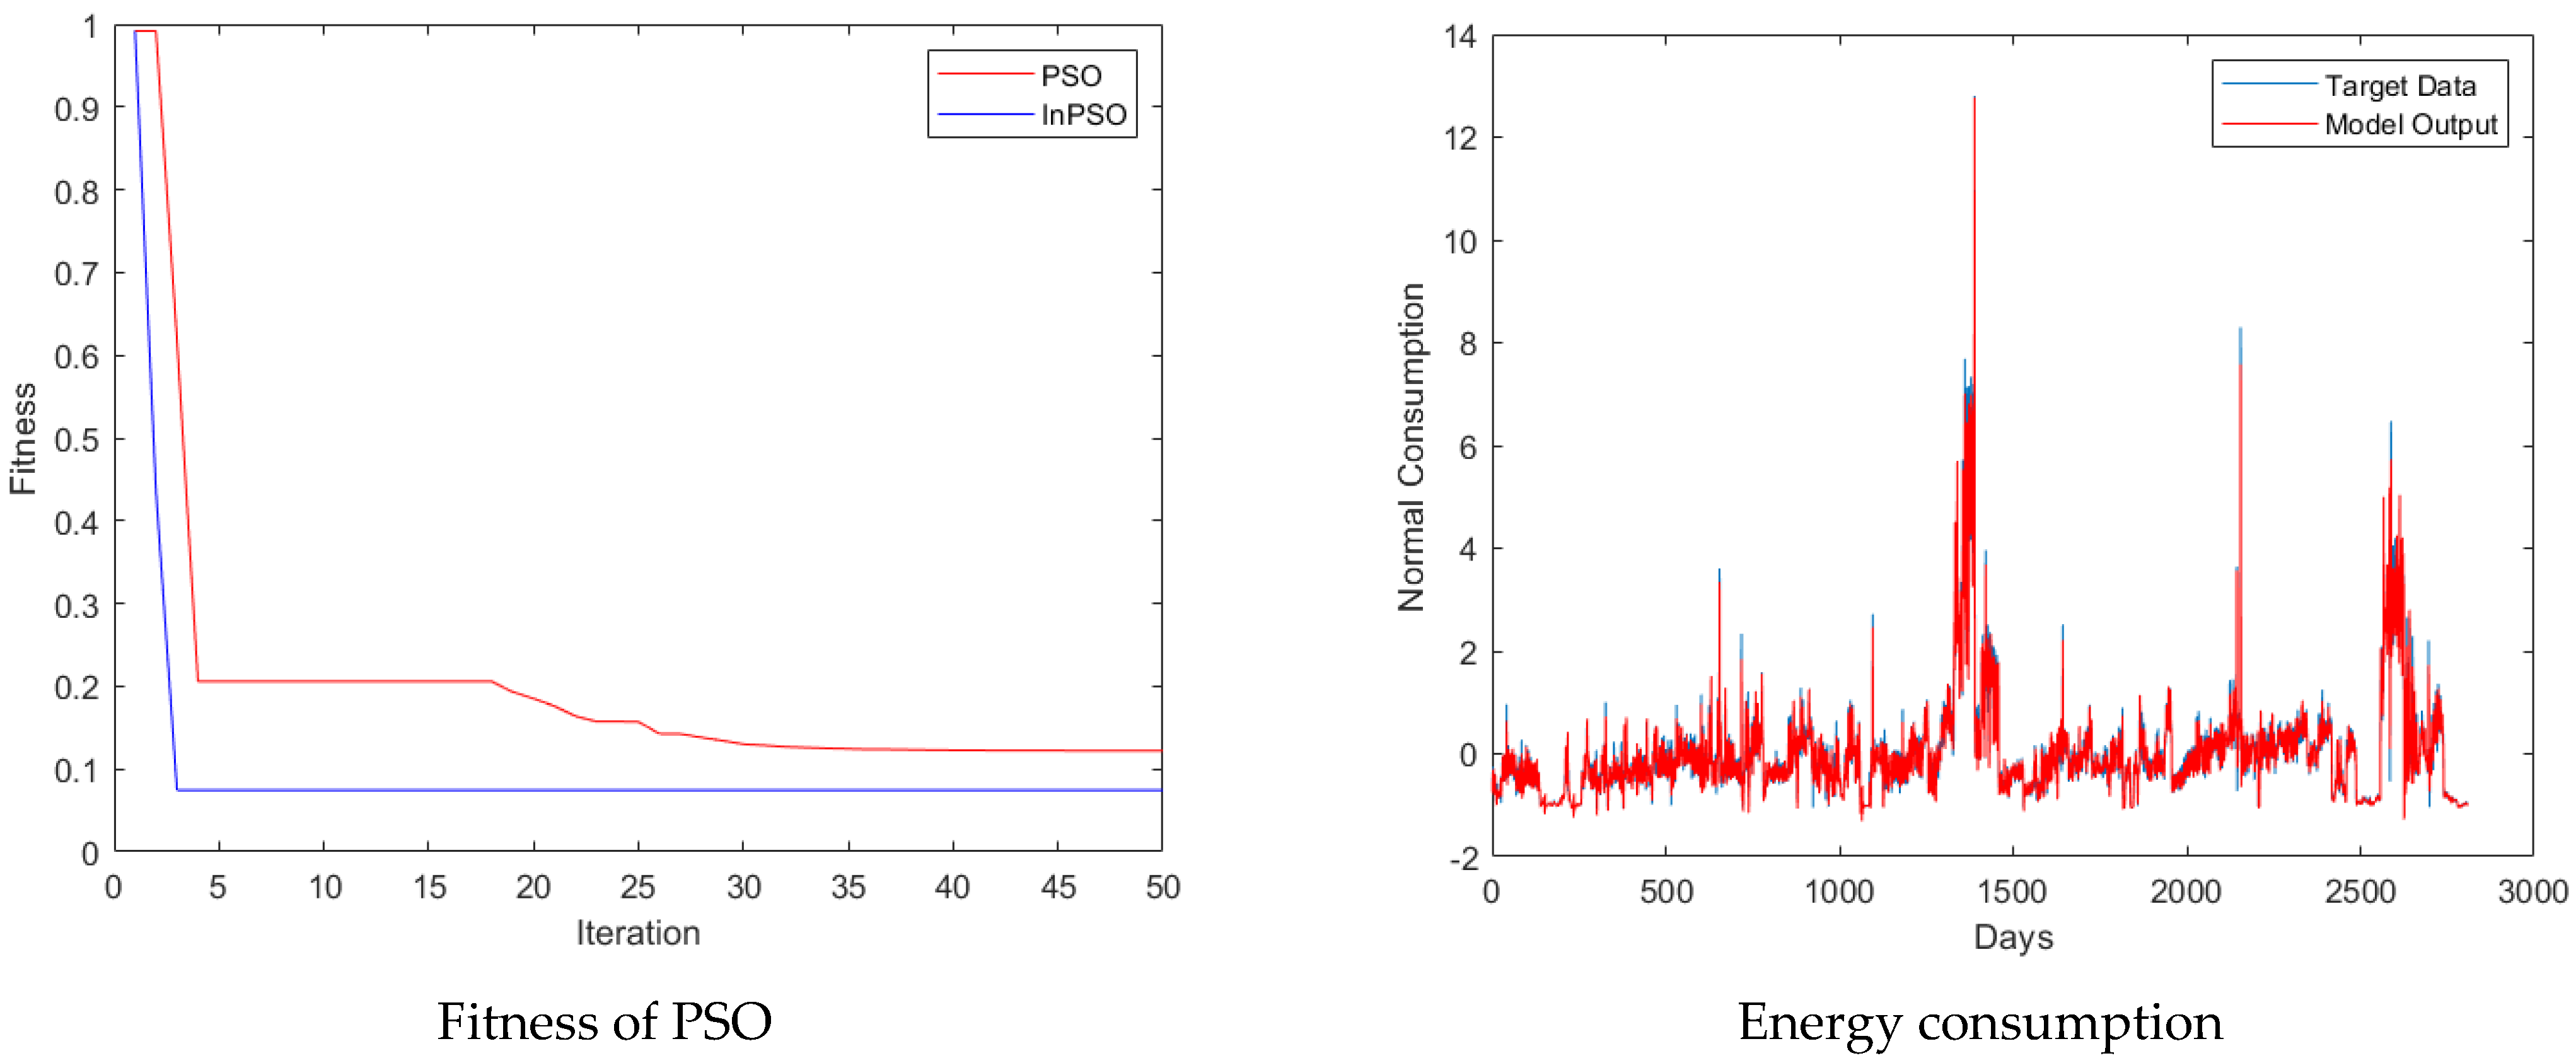
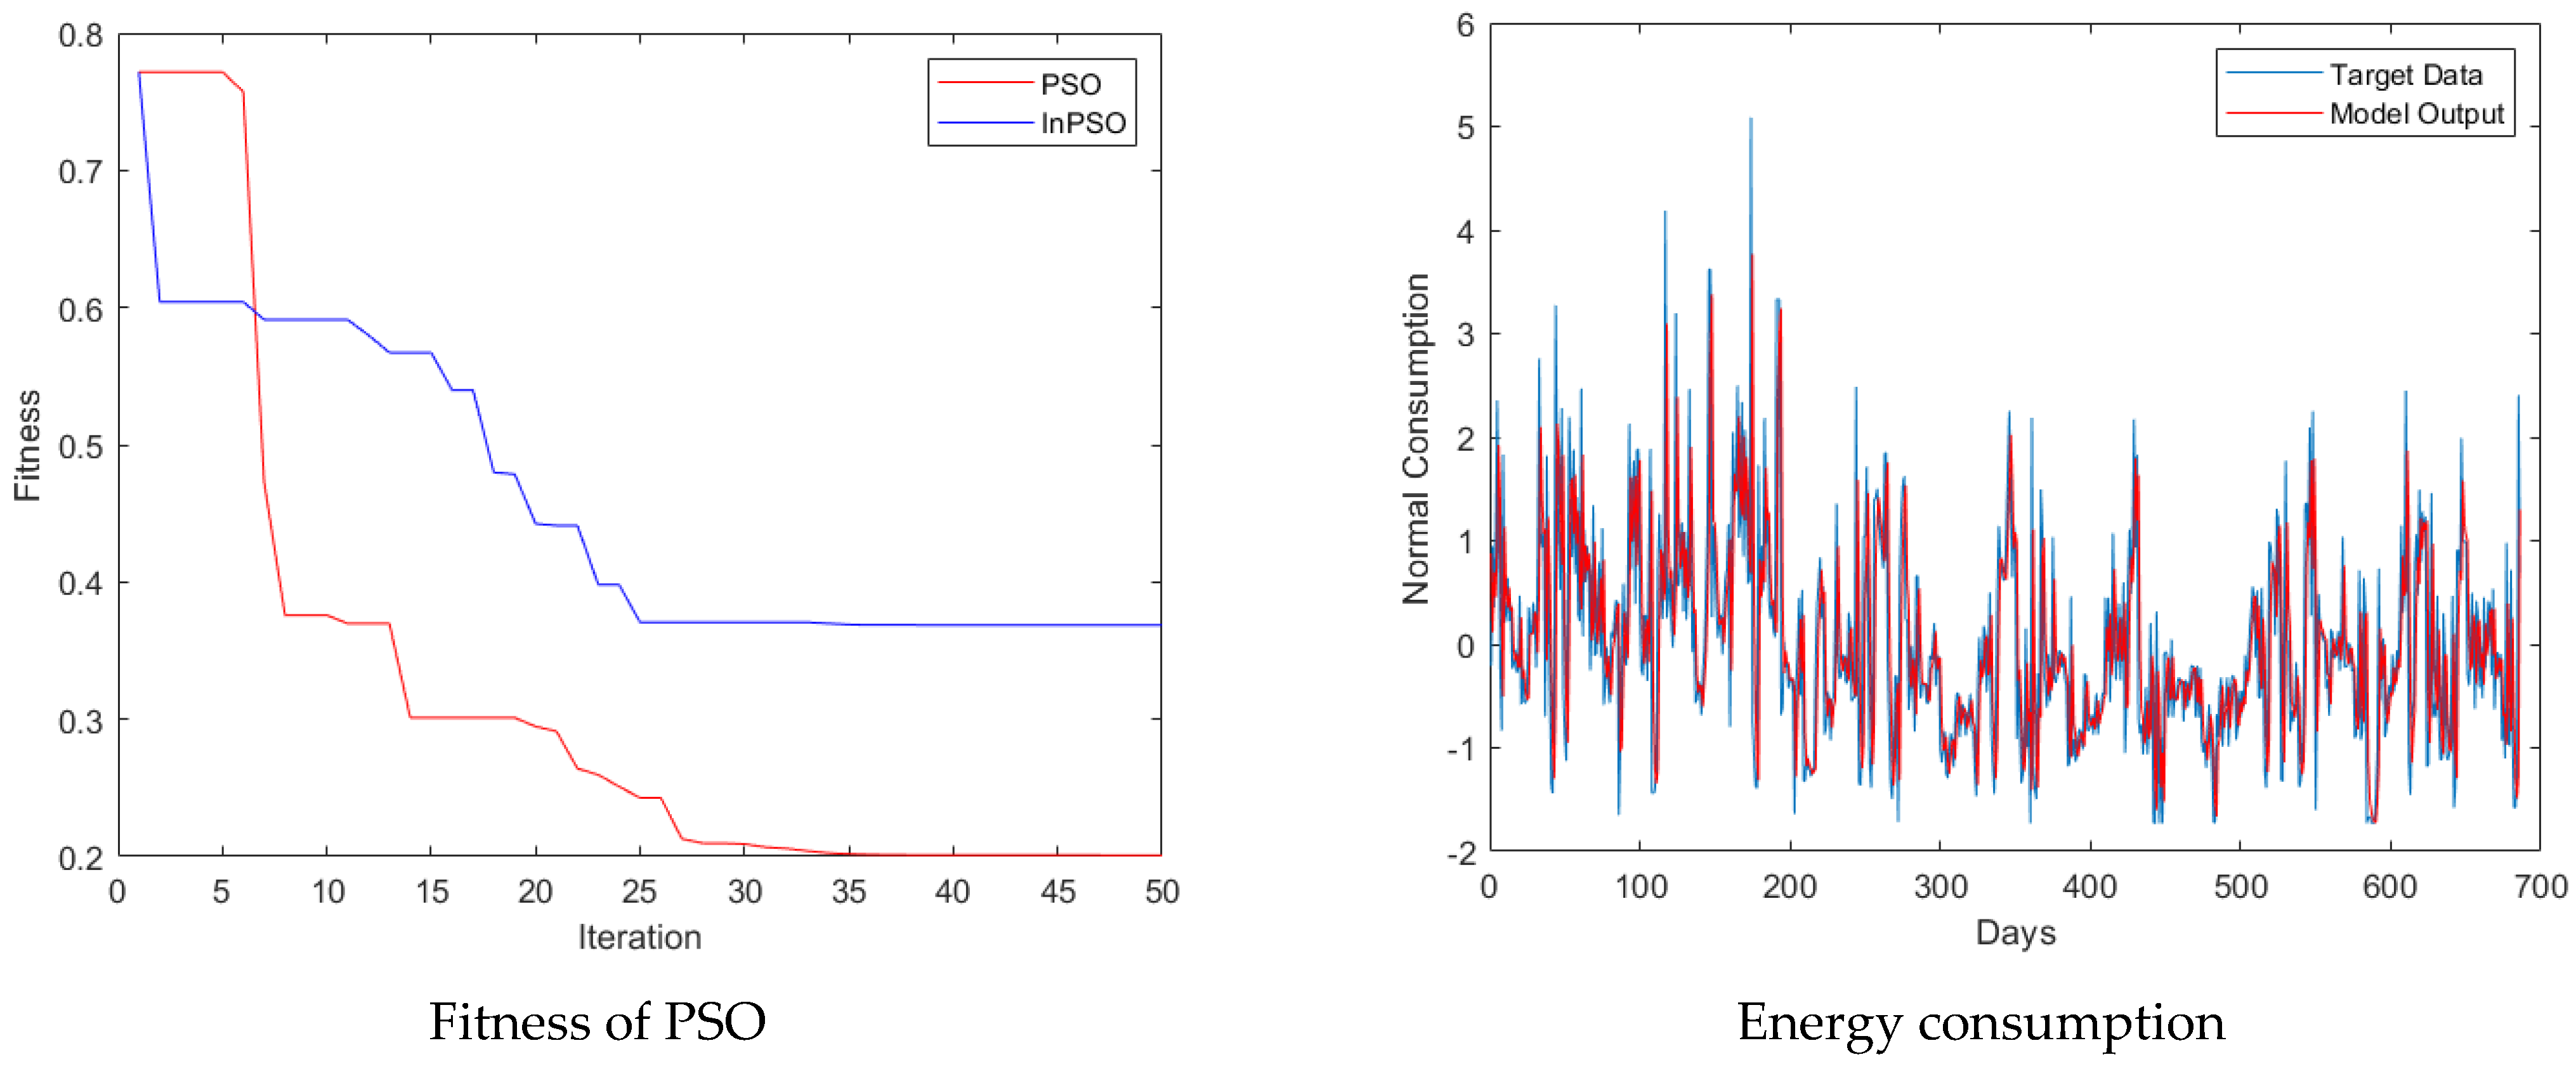
The fuzzy DNFW’s rules had the general structure:
R k : IF   x 1   is   A k 1   AND   x n   is   A k n THEN   Y k = i = 1 N k w i k Ψ i k + y ¯ k  
where x 1 , x 2 , , x n is an independent feature, Y 1 , Y 2 , , Y M is the dependent feature, and A k j is the kth fuzzy set with normal membership, as in Equation (9). Several WNNs with N k wavelet activation functions were used in the end sections of the rules. Layer 1 represented the input feature, and layer 2 represented the first hidden layer of the presented combination. Based on Equation (2), the second layer was the output of the fuzzy membership function.
Ψ i k = j = 1 n ψ i j k = j = 1 n ψ ( x j b i j k a i j k )
In the hidden layer, w i k and   y ¯ k were the matrix of weights and the bias. The translations from a single value x j to fuzzy set A k j   with level μ k j ( x j ) were performed by the fuzzified neuron. Each node in layer 3 provided a fuzzy rule. The extracted features were calculated using the AND operator.
Y k = O k ( 4 ) = i = 1 N k w i k Ψ i k + y ¯ k .
Layers 5 and 7 discussed defuzzification inferences. The output data of layer 3 were multiplied by layer 4. Therefore, two neurons in layer 6 were responsible for summing the output signals of layers five and three. The output neuron of layer 7 generated the quotient, which indicated the proportion of each WNN to the ultimate DNFW’s output. Figure 2 illustrates the structure of the DNFW method.
O k ( 5 ) = O k ( 3 ) · O k ( 4 ) = O k · Y k .
O 1 ( 6 ) = k = 1 M O k ( 5 ) , O 2 ( 6 ) = k = 1 M O k ( 3 )
y = O ( 7 ) = O 1 ( 6 ) O 2 ( 6 ) = k = 1 M O k Y k k = 1 M O k
Gradient descent was used to train the DNFW after variable calibration using inline PSO. The gradient of the goal variable was changed in reverse of Θ = ( c k j , σ k j , b i j k , a i j k , w i k , y ¯ k ) , the setpoints being:
E ( Θ , x , y ) = 1 2 ( y f ) 2 ,
Θ ( t + 1 ) = Θ ( t ) + Δ Θ , Δ Θ = ( γ c E c k j , γ σ E σ k j , γ b E b i j k , γ a E a i j k , γ w E w i k , γ y ¯ E y ¯ k ) ,

4. Results

Among the variables used in this study was the energy consumption in the home sector of the country’s cities as a dependent variable, which consists of the total per capita energy consumption per year, the real per capita cost of energy in millions of rials, the real price of energy for each year in each city, the population of each city, the building area, the average cooling degree day (CDD) and the heating degree day (HDD) of each city, and the number of days of energy consumption based on the calculation from the beginning of each year of consumption. Data on energy consumption and prices were obtained from the country’s energy balance, and population statistics, per capita income, average building area, and several houses were obtained from the national statistical agency. For the average data on CDD and HDD of each city, data from the Meteorological Center of the country were consulted. On the basis of the share of each of the aforementioned energy sources in the country’s domestic energy consumption, a weighted average of their real prices was calculated annually. The real per capita income of each city was also calculated by dividing the gross domestic product in terms of millions (rials), without taking into account the value added by the oil industry, by the population of the city. It was also necessary to calculate the variables needed for heating and cooling as follows:
C D D = ( T T 2 ) T 2 = 21 C
H D D = ( T 2 T ) T 1 = 18 C
The analysis results are presented in this section of the paper using the DNFW approach. Many scientists have developed a DNFW formulation framework that accounts for neural networks’ ability to directly compute, fuzzy logic’s ability to eliminate uncertainties, and wavelet transform’s superiority in assessing local features. An arbitrary non-linearity can be estimated using a fuzzy wavelet network [46]. Each network rule consists of a single-scale wavelet that corresponds to a sub-wavelet neural network.
A dynamic time-delay DNFW model was employed for non-parametric structure identification using the NARX moving average with external input in [47]. The DNFW identified and regulated dynamic plants [48]. In the subsequent component of each DNFW rule, there was a wavelet function, and multivariate wavelet functions were the cumulative form. As a result of this research, each fuzzy rule was related to a WNN, which is composed of multiple wavelets with configurable translation and dilation factors in the DNFW. We used a hybrid learning method to optimize the DNFW by minimizing the trial-and-error approach and the influence of free parameters. As a first step, this paper used an inline-PSO approach to determining a suitable starting value for modifiable parameters. Inline PSOs converge more quickly than basic PSOs. It was more appropriate to update the flow velocity and location based on the form-learning-based gradient-descent approach that follows. Moreover, in the DNFW, the gradient-descent method was used to modify the parameters. In order to achieve a more acceptable mode of learning, it was necessary to keep training and testing indicators throughout.
The benefits of using a hybrid learning algorithm are obvious. The procedure provides a more stable procedure for beginners than one optimizer (PSO or GDA), which is more vulnerable to training random variables. Moreover, according to some research, the particles may exhibit “similarity” phenomena during the PSO, slowing convergence. In conjunction with stochastic gradient descent, the training process can be sped up. In our study, each WNN had two rules (M = 2) and two wavelet neurons (Nk = 2, K = 1, 2). Therefore, N = 30 variables could be changed. We used mixed learning to train the DNFW. The inline PSO and essential PSO optimization results are presented in Figure 3, Figure 4, Figure 5 and Figure 6, numbers 2, 3, 4, and 5. Current population values of 20 and 50 were set to a low value in order to save runtime and avoid overtraining the training signal, resulting in a limited testing signal search space, as shown in Figure 3, Figure 4, Figure 5 and Figure 6. Occasionally, inline-PSO resolution was faster than PSO resolution, reaching fitness values of 0.07, 0.35, 0.09, and 0.38. Figure 3, Figure 4, Figure 5 and Figure 6 illustrate the average electricity consumption in Ahvaz, Mashhad, Tehran, and Urmia, respectively. Using the findings and line plots of energy consumption, the model was adapted to the target data with greater accuracy (see Table 2).
In evaluating the training outcomes for the DNFW in Figure 7, it was apparent that the models’ correctness was almost 100% or no residual error. Based on the results of the study, the PSO method enhances model accuracy while reducing training time. Furthermore, it reduces the temporal complexity of the proposed model.

5. Discussion

A study of energy consumption in Iran indicates that, during the period 2010–2021, final energy consumption increased by almost two and a half times. Iran’s domestic sector consumes more energy than all other sectors combined. The increasing share of electricity in the domestic sector is a phenomenon that has been observed over the past two decades. In this regard, it is impossible to plan energy consumption without an accurate understanding of past and present energy consumption and possible future demand. The modeling and forecasting of energy consumption plays an important role for policymakers and related organizations in developing countries. An individual’s lack of awareness of their consumption can lead to power outages that threaten life and economic stability. Excess energy estimation may lead to unnecessary capacity, which means a waste of financial resources. Therefore, it is better to use models that estimate energy consumption more accurately to avoid costly errors. In addition, it is better to use models that can use non-linear energy consumption data in forecasting. Historically, regression analysis was regarded as the most popular technique for predicting energy consumption. Nevertheless, meta-heuristic algorithms are more attractive and necessary for potential users, such as energy engineers, since they allow for more stable energy applications, regardless of the time savings. The advantages of this approach are that it is fast, has a low cost of performance, and can be easily designed by operators with little technical expertise. As a result, using artificial neural networks to model and predict has become increasingly popular in recent years.
As a general rule, the most important issue when discussing energy consumption in the domestic sector is its dependence on energy prices. According to the data obtained from various cities regarding energy consumption, energy consumption is less elastic than the price of energy, which means that price policies cannot influence energy policies. The primary reasons for this are the absence of a suitable substitute for the energy carriers under study and the necessity of the product in the household consumption basket. Reducing energy consumption intensity requires a comprehensive policy package that includes multilateral solutions. Price liberalization alone may not be sufficient, given that energy prices have increased significantly over the years. It is, therefore, suggested that policymakers do the following: implement non-price policies, such as education, to improve energy use methods and change the pattern of consumption in order to reduce the intensity of energy consumption; promote the use of renewable wind and solar energy; implement tax incentives; generate energy from environmental waste; create cost-effective departments; and implement low-incentive incentive programs. Assigning financial and bank credits for energy conservation investments, requiring construction to comply with energy efficiency regulations, and requiring appliance manufacturers to install energy labels is also recommended.

6. Conclusions

The study describes a method for DNFW simulation, as well as a technique for doing so. As part of the architecture of the DNFW, TSK fuzzy set theory was coupled with a wavelet neural network, which generates a fuzzy distribution of the input vector into wavelet-based sub-bands. For the training of DNFW’s component, we presented a hybrid training method that combines an inline PSO with a gradient-based algorithm. By modifying factors after each assessment and incorporating all vectors, the inline-PSO method found the optimal solution, which corresponds to the gradient-descent method’s adjustment strategy and results in a more rapid convergence process. A DNFW technique was used to predict power consumption for Tehran, Mashhad, Ahvaz, and Urmia between 2010 and 2021. Despite having fewer rules and lower model complexity, the DNFW outperformed other models in all simulations. This study provides evidence that household energy consumption in the cities of the country follows a spatial pattern; the location of the data to be studied indicates that the location is conducive to energy consumption. The location influences energy consumption in part. As an example, electricity consumption in the southern cities of Iran is affected by their location. One cannot expect a reduction in electricity consumption during peak hours in these cities. In these cities, pricing policies will perform much worse than in other cities. This means that policymakers have to formulate their policy packages based on the locations of the cities, meaning they require several different packages. Based on the results, it appears that the average consumption of energy in Iran’s domestic market has an upward slope with a low slope. One of the projects was in the development sector. The direction of sustainable development is to use new energy sources instead of fossil fuels, so the government can help by implementing appropriate programs, especially in the area of energy subsidy policies. In addition to increasing the level of mechanization, energy should also be utilized in the most efficient manner.

Author Contributions

Formal analysis, methodology, software and writing—original draft preparation, M.A.; validation, and investigation M.S. and M.N.; investigation, and resources, H.N.; funding acquisition and project administration, L.A.; data curation and writing—review and editing, B.A. All authors have read and agreed to the published version of the manuscript.

Funding

This study was supported by Research Management Office, Universiti Malaysia Terengganu, and Fundamental Research Grant Scheme, Ministry of Higher Education, Malaysia with vote number FRGS/1/2018/STG06/UMT/01/1.

Institutional Review Board Statement

Not applicable.

Informed Consent Statement

Not applicable.

Data Availability Statement

Data is available and can be provided over the emails querying directly to the author ([email protected]).

Conflicts of Interest

The authors declare no conflict of interest.

Nomenclature

Abbreviations
ANNArtificial Neural Network
ANFISAdoptive Neuro-Fuzzy Inference Systems
CDDCooling Degree Day
CNNConvolutional Neural Network
DNFWDeep Neural Network Based on Fuzzy Wavelet
DNNDeep Neural Network
HDDHeating Degree Day
LSTMLong-Short-Term Memory
NARXNon-Linear Autoregressive Network with Exogenous Inputs
NSGANon-Dominated Sorting Genetic Algorithm
PSOParticle Swarm Optimization
RMSERoot Mean Square Error
RNNRecurrent Neural Network
WNNWavelet Neural Network
Notations
A k j   Fuzzy Set of kth Role for j-th Feature
c k j Central Points of Membership Function k-th Role for j-th Feature
w i j Weight of Neural Network i-the Input and j-th Neuron
h i i-th Hidden Layer
x i i-th Fuzzy Features
O k Output of k-th Layer
R k k-th Rule of Fuzzification
T Temperature
y Target Value of Prediction
σ k j Standard Deviation of Membership Function k-th Role for j-th Feature
ψ ( x ) Wavelet Function
μ k j Membership Function of k-th Role for j-th Feature
Θ Gradient of the Goal Variable

References

  1. Uzar, U. Political economy of renewable energy: Does institutional quality make a difference in renewable energy consumption? Renew. Energy 2020, 155, 591–603. [Google Scholar] [CrossRef]
  2. Akhmetshin, E.M.; Kopylov, S.I.; Lobova, S.V.; Panchenko, N.B.; Kostyleva, G. Specifics of the fuel and energy complex regulation: Seeking new opportunities for Russian and international aspects. Int. J. Energy Econ. Policy 2018, 8, 169. [Google Scholar]
  3. Azar, E.; O’Brien, W.; Carlucci, S.; Hong, T.; Sonta, A.; Kim, J.; Andargie, M.S.; Abuimara, T.; El Asmar, M.; Jain, R.K.; et al. Simulation-aided occupant-centric building design: A critical review of tools, methods, and applications. Energy Build. 2020, 224, 110292. [Google Scholar] [CrossRef]
  4. Magliocca, N.R. Agent-Based Modeling for Integrating Human Behavior into the Food–Energy–Water Nexus. Land 2020, 9, 519. [Google Scholar] [CrossRef]
  5. Sovacool, B.K.; Axsen, J.; Sorrell, S. Promoting novelty, rigor, and style in energy social science: Towards codes of practice for appropriate methods and research design. Energy Res. Soc. Sci. 2018, 45, 12–42. [Google Scholar] [CrossRef]
  6. Liu, T.; Tan, Z.; Xu, C.; Chen, H.; Li, Z. Study on deep reinforcement learning techniques for building energy consumption forecasting. Energy Build. 2020, 208, 109675. [Google Scholar] [CrossRef]
  7. Wang, B. Early warning method of marine products network marketing risk based on BP neural network algorithm. J. Coast. Res. 2020, 103, 177–181. [Google Scholar] [CrossRef]
  8. Akhter, M.N.; Mekhilef, S.; Mokhlis, H.; Shah, N.M. Review on forecasting of photovoltaic power generation based on machine learning and metaheuristic techniques. IET Renew. Power Gener. 2019, 13, 1009–1023. [Google Scholar] [CrossRef] [Green Version]
  9. Ahmadi, M. A computational approach to uncovering economic growth factors. Comput. Econ. 2021, 58, 1051–1076. [Google Scholar] [CrossRef]
  10. Feng, X.; Yan, D.; Hong, T. Simulation of occupancy in buildings. Energy Build. 2015, 87, 348–359. [Google Scholar] [CrossRef] [Green Version]
  11. Martinaitis, V.; Zavadskas, E.K.; Motuzienė, V.; Vilutienė, T. Importance of occupancy information when simulating energy demand of energy efficient house: A case study. Energy Build. 2015, 101, 64–75. [Google Scholar] [CrossRef]
  12. Sun, K.; Yan, D.; Hong, T.; Guo, S. Stochastic modeling of overtime occupancy and its application in building energy simulation and calibration. Build. Environ. 2014, 79, 1–12. [Google Scholar] [CrossRef] [Green Version]
  13. Carlucci, S.; Lobaccaro, G.; Li, Y.; Lucchino, E.C.; Ramaci, R. The effect of spatial and temporal randomness of stochastically generated occupancy schedules on the energy performance of a multiresidential building. Energy Build. 2016, 127, 279–300. [Google Scholar] [CrossRef]
  14. Motuziene, V.; Vilutiene, T. Modelling the effect of the domestic occupancy profiles on predicted energy demand of the energy efficient house. Procedia Eng. 2013, 57, 798–807. [Google Scholar] [CrossRef] [Green Version]
  15. Matar, W. Beyond the end-consumer: How would improvements in residential energy efficiency affect the power sector in Saudi Arabia? Energy Effic. 2016, 9, 771–790. [Google Scholar] [CrossRef] [Green Version]
  16. Al-Tamimi, N. A state-of-the-art review of the sustainability and energy efficiency of buildings in Saudi Arabia. Energy Effic. 2017, 10, 1129–1141. [Google Scholar] [CrossRef]
  17. Almushaikah, A.S.; Almasri, R.A. Evaluating the potential energy savings of residential buildings and utilizing solar energy in the middle region of Saudi Arabia–Case study. Energy Explor. Exploit. 2021, 39, 1457–1490. [Google Scholar] [CrossRef]
  18. Jiang, Y.; Xin, L. Broadband cancellation method in an adaptive co-site interference cancellation system. Int. J. Electron. 2021, 2021, 9953416. [Google Scholar] [CrossRef]
  19. Li, L.; Sun, W.; Hu, W.; Sun, Y. Impact of natural and social environmental factors on building energy consumption: Based on bibliometrics. J. Build. Eng. 2021, 37, 102136. [Google Scholar] [CrossRef]
  20. Varmaghani, A.; Nazar, A.M.; Ahmadi, M.; Sharifi, A.; Ghoushchi, S.J.; Pourasad, Y. DMTC: Optimize energy consumption in dynamic wireless sensor network based on fog computing and fuzzy multiple attribute decision-making. Wirel. Commun. Mob. Comput. 2021, 2021, 9953416. [Google Scholar] [CrossRef]
  21. Dong, Z.; Liu, J.; Liu, B.; Li, K.; Li, X. Hourly energy consumption prediction of an office building based on ensemble learning and energy consumption pattern classification. Energy Build. 2021, 241, 110929. [Google Scholar] [CrossRef]
  22. Somu, N.; MR, G.R.; Ramamritham, K. A deep learning framework for building energy consumption forecast. Renew. Sustain. Energy Rev. 2021, 137, 110591. [Google Scholar] [CrossRef]
  23. Popoola, O.; Chipango, M. Improved peak load management control technique for non-linear and dynamic residential energy consumption pattern. In Building Simulation; Tsinghua University Press: Beijing, China, 2021; Volume 13, pp. 195–208. [Google Scholar]
  24. Ali, S.B.M.; Hasanuzzaman, M.; Rahim, N.A.; Mamun, M.A.A.; Obaidellah, U.H. Analysis of energy consumption and potential energy savings of an institutional building in Malaysia. Alex. Eng. J. 2021, 60, 805–820. [Google Scholar]
  25. Mokhtari, R.; Jahangir, M.H. The effect of occupant distribution on energy consumption and COVID-19 infection in buildings: A case study of university building. Build. Environ. 2021, 190, 107561. [Google Scholar] [CrossRef] [PubMed]
  26. Barik, A.K.; Das, D.C.; Latif, A.; Hussain, S.M.; Ustun, T.S. Optimal voltage–frequency regulation in distributed sustainable energy-based hybrid microgrids with integrated resource planning. Energies 2021, 14, 2735. [Google Scholar] [CrossRef]
  27. Brandi, S.; Piscitelli, M.S.; Martellacci, M.; Capozzoli, A. Deep reinforcement learning to optimise indoor temperature control and heating energy consumption in buildings. Energy Build. 2020, 224, 110225. [Google Scholar] [CrossRef]
  28. Li, X.; Chen, S.; Li, H.; Lou, Y.; Li, J. Multi-dimensional analysis of air-conditioning energy use for energy-saving management in university teaching buildings. Build. Environ. 2020, 185, 107246. [Google Scholar] [CrossRef]
  29. Fahim, M.; Fraz, K.; Sillitti, A. TSI: Time series to imaging based model for detecting anomalous energy consumption in smart buildings. Inf. Sci. 2020, 523, 1–13. [Google Scholar] [CrossRef]
  30. Ashouri, M.; Fung, B.C.; Haghighat, F.; Yoshino, H. Systematic approach to provide building occupants with feedback to reduce energy consumption. Energy 2020, 194, 116813. [Google Scholar] [CrossRef]
  31. Irtija, N.; Sangoleye, F.; Tsiropoulou, E.E. Contract-theoretic demand response management in smart grid systems. IEEE Access 2020, 8, 184976–184987. [Google Scholar] [CrossRef]
  32. Wen, L.; Zhou, K.; Yang, S. Load demand forecasting of residential buildings using a deep learning model. Electr. Power Syst. Res. 2020, 179, 106073. [Google Scholar] [CrossRef]
  33. Von Korff, H.J. An Analysis of Energy Loads Using Machine Learning to Examine Zero Net Energy and All-Electric Communities That Have Solar and Energy Storage; Stanford University: Stanford, CA, USA, 2019. [Google Scholar]
  34. Li, C.; Ding, Z.; Yi, J.; Lv, Y.; Zhang, G. Deep belief network based hybrid model for building energy consumption prediction. Energies 2018, 11, 242. [Google Scholar] [CrossRef] [Green Version]
  35. Li, Y.; Che, P.; Liu, C.; Wu, D.; Du, Y. Cross-scene pavement distress detection by a novel transfer learning framework. Comput. -Aided Civ. Infrastruct. Eng. 2021, 36, 1398–1415. [Google Scholar] [CrossRef]
  36. Zhang, C.; Ali, A.; Sun, L. Investigation on low-cost friction-based isolation systems for masonry building structures: Experimental and numerical studies. Eng. Struct. 2021, 243, 112645. [Google Scholar] [CrossRef]
  37. Wang, T.; Liu, W.; Zhao, J.; Guo, X.; Terzija, V. A rough set-based bio-inspired fault diagnosis method for electrical substations. Int. J. Electr. Power Energy Syst. 2020, 119, 105961. [Google Scholar] [CrossRef]
  38. Wang, T.; Wei, X.; Wang, J.; Huang, T.; Peng, H.; Song, X.; Cabrera, L.V.; Perez-Jimenez, M.J. A weighted corrective fuzzy reasoning spiking neural P system for fault diagnosis in power systems with variable topologies. Eng. Appl. Artif. Intell. 2020, 92, 103680. [Google Scholar] [CrossRef]
  39. Liu, W.; Wang, Z.; Liu, X.; Zeng, N.; Liu, Y.; Alsaadi, F.E. A survey of deep neural network architectures and their applications. Neurocomputing 2017, 234, 11–26. [Google Scholar] [CrossRef]
  40. Zadeh, L.A. Fuzzy Sets. Inf. Control. 1965, 8, 338–353. [Google Scholar] [CrossRef] [Green Version]
  41. Nguyen, H.T.; Walker, C.; Walker, E.A. A First Course in Fuzzy Logic, 3rd ed.; CRC: Boca Raton, FL, USA; Chapman and Hall: London, UK, 2005. [Google Scholar]
  42. Ross, T.J. Fuzzy Logic with Engineering Applications, 4th ed.; Wiley: Hoboken, NJ, USA, 2016. [Google Scholar]
  43. Hajek, P.; Novák†, V. The Sorites Paradox and Fuzzy Logic. Int. J. Gen. Syst. 2003, 32, 373–383. [Google Scholar] [CrossRef]
  44. Cintula, P.; Christian, F.; Carles, N. (Eds.) Handbook of Mathematical Fuzzy Logic; Studies in Logic, Volume 58; College Publications: London, UK, 2015; Volume 3. [Google Scholar]
  45. Wang, L.X. A Course in Fuzzy Systems and Control; Prentice-Hall, Inc.: Hoboken, NJ, USA, 1996. [Google Scholar]
  46. Ho, D.W.; Zhang, P.A.; Xu, J. Fuzzy wavelet networks for function learning. IEEE Trans. Fuzzy Syst. 2001, 9, 200–211. [Google Scholar] [CrossRef]
  47. Adeli, H.; Jiang, X. Dynamic fuzzy wavelet neural network model for structural system identification. J. Struct. Eng. 2006, 132, 102–111. [Google Scholar] [CrossRef]
  48. Abiyev, R.H.; Kaynak, O. Fuzzy wavelet neural networks for identification and control of dynamic plants—A novel structure and a comparative study. IEEE Trans. Ind. Electron. 2008, 55, 3133–3140. [Google Scholar] [CrossRef]
Figure 1. Illustration of a neural network with a large number of interconnected neurons.
Mathematics 10 01270 g001
Figure 2. The DNFW method’s architecture.
Mathematics 10 01270 g002
Figure 3. Predictions based on DNFW for energy consumption in Ahvaz.
Mathematics 10 01270 g003
Figure 4. The results of the DNFW prediction for Mashhad’s energy consumption.
Mathematics 10 01270 g004
Figure 5. Predictions based on DNFW for energy consumption in Tehran.
Mathematics 10 01270 g005
Figure 6. Results of DNFW prediction based on energy consumption in Urmia.
Mathematics 10 01270 g006
Figure 7. RMSE value for each city’s energy consumption process.
Mathematics 10 01270 g007
Table 1. A summary of the research in the field of building energy pattern prediction.
AuthorObjectiveMethodResults
Popoola and Chipango (2021) [23]The residential building energy patternImproved peak-load management control techniqueIt was found that maximum use and energy consumption decreased significantly, ranging from 3% to 20%, for the time-of-use intervals, and at least 14.05% for the energy efficiency.
Ali et al. (2021) [24]The institutional building energy patternStatistical analysisInspection results confirmed the structure’s electricity bills, which ranged from 160 MWh to 250 MWh and RM 80 k to RM 120 k per month, on average.
Somu et al. (2021) [22]The four-storeyed building energy patternk-convolutional neural networks and long-short-term memoryIt was noted that the effective electricity consumption estimate produced by kCNN-LSTM is an excellent deep training algorithm for power consumption prediction issues due to its capacity to understand the spatio-temporal relationships in the energy data.
Dong et al. (2021) [21]Office building energy patternEnsemble learning based on SVR and ANNIt illustrated the viability and effectiveness of the suggested plan. Additionally, this method provided satisfactory results with minimal training data, which is beneficial for energy usage projection applications.
Mokhtari and Jahangir (2021) [25]University building energy patternNSGA-II algorithmAccording to the findings, an ideal demographic makeup can lower the number of sick persons by up to 56% while also reducing energy usage by 32%. Additionally, virtual training was an effective way for colleges to reduce the number of illnesses and energy usage.
Barik et al. (2021) [26]Electric regulation in hybrid smart gridQuasi-oppositional chaotic selfish-herd optimizationThe research examined the voltage, frequency, and tie-line power synchronization of the prototype solution under five severe scenarios of source and load fluctuations without adjusting the regulators. In addition, ten different potential configurations of modules in different microgrids were examined in order to determine the optimal combination. In summary, the results of this study indicate that implementing the suggested approach increases the effectiveness of distributed microgrids.
Brandi et al. (2020) [27]Office building energy patternDeep reinforcement learningIf the set of variables is appropriately specified, it should be possible to achieve a heating energy savings between 5 and 12% with improved interior temperature management and static and dynamic deployment. Lastly, the study showed that if input variables are not selected correctly, a dynamic deployment is necessary to achieve satisfactory results.
Li et al. (2020) [28]University building energy patternDecision tree, Adaboost, and RandomForestIn the case of intermediate usage hours, school scales must be considered. The AC set degree is a crucial control parameter for long-term AC operation. This study contributed to more realistic energy demand simulations and more efficient energy management in educational facilities.
Fahim et al. (2020) [29]Smart building energy patternOne-class support vector machine, Markov transition functionAn extensive public information database was used to test the proposed model. The results of the acquired studies were comparable and demonstrated the effectiveness of the TSI model in actual situations.
Ashouri et al. (2020) [30]Role of occupants in building energy consumptionStatistical analysisAs compared to previous state-of-the-art systems, the present system improved accuracy, adaptability, and realistic findings.
Irtija et al. (2020) [31]Energy demand managment in smart gridStandard convex optimization methodsOn the energy market, it was determined whether or not the prosumers are aware of their kinds, and the ideal contract was negotiated between parties who have competing interests. A power contract that meets ideal conditions includes both the quantity of power purchased by prosumers and the incentives provided by the electricity market. It was demonstrated that a contract-theoretic approach has both advantages and disadvantages.
Wen et al. (2020) [32]Forecasting of buildings’ energy demands in smart gridANN, LSTM, RNNIt appeared that the new model predicted aggregated and disaggregated energy demand for residential structures more precisely than existing approaches. In addition, the proposed deep-learning model was an excellent way to fill in any missing information based on historical data.
Von Korff (2019) [33]Energy-load analysis for zeo-net energyMachine-learning methodsBy measuring the net electrical consumption and output for each residence over the course of a year, the researchers provided a variety of typical energy demand profiles. The load profiles presented a number of ways in which solar power or energy storage could be beneficial to customers or grid operators. Additionally, several inefficiencies within the existing system were discussed, along with recommended solutions. As a result of utilizing machine learning to analyze the preliminary data collected from the first advanced energy communities, electric grid managers were better equipped to prepare for a large-scale deployment of solar power and energy storage systems.
Li et al. (2018) [34]Residential building energy patternDeep belief network and generalized radial basis function neural networkIt was shown how useful it is to include electricity behaviors. This method may be applied to other similar periodicity-based prediction problems, such as traffic flow prediction and power-usage prediction.
Table 2. Moran test for self-correlation in perturbation components of the electrical model.
Moran’s I StatisticMarginal Prob.MeanStandard Dev.
Tehran4.1860.00031.0782.592
Ahvaz98.4510.0000−0.1120.642
Mashhad2.3860.00260.6371.152
Urmia4.9820.00010.5421.236
Publisher’s Note: MDPI stays neutral with regard to jurisdictional claims in published maps and institutional affiliations.

