Article

Effect of Overburden Depth and Stress Anisotropy on a Ground Reaction Caused by Advancing Excavation of a Circular Tunnel

1
Department of Civil Engineering, Chung Hua University, Hsinchu 30012, Taiwan
2
Department of Civil Engineering, National Central University, Taoyuan City 32001, Taiwan
*
Author to whom correspondence should be addressed.
Mathematics 2023, 11(1), 243; https://doi.org/10.3390/math11010243
Submission received: 7 December 2022 / Revised: 25 December 2022 / Accepted: 27 December 2022 / Published: 3 January 2023

Abstract

:
The assumption of the Convergence–Confinement Method (CCM) is the analysis of the interaction behavior of the support and ground of a deep circular tunnel under an isotropic stress field. Aiming to improve this method, this paper proposes a discussion on the influence of the overburden depth and stress anisotropy. To consider the influence of the overburden effect, the ground reaction in different depths due to tunnel advancing excavation is investigated. Under anisotropic stress conditions, the analytical solutions of the stress/displacement in the plastic and elastic regions of this ground reaction can also be suitable for theoretical analysis in a consistent manner. The key factor in this study is the use of confinement loss, which can not only describe the simulation of tunnel advancing effects but also become a superimposed value of the incremental procedure. In addition, the calculation spreadsheets can be used to estimate and implement the theoretical analytical solutions into executable computational solutions. To check the validity of the analytical solution, finite element analysis is used to examine the distribution of stress/displacement around the tunnel, especially the distribution along the overburden pressure line in the circular tunnel cross-section. Comparing the analytical solution calculated by the incremental procedure with the result of the numerical analysis shows a consistent trend.

1. Introduction

The Convergence–Confinement Method (CCM) is a theoretically based and computational tool that can be applied to support design for underground excavations [1,2]. The method consists of three different curves: the Confinement Loss Curve (CLC), the Support Confining Curve (SCC), and the Ground Reaction Curve (GRC) [3,4]. The use of this theoretical approach is based on three important assumptions: (1) The problem is axisymmetric and solved in plane strain, (2) the cross-section of a deep tunnel is circular, (3) the initial stress state is isotropic and constant with overburden depth [5]. As the working face of the tunnel excavation advances, the surrounding rock stress of the tunnel is released; therefore, GRC is a ground reaction exhibited by an increase in radial displacement and a decrease in radial stress, which plays an important role in determining when to install supports and the stiffness of supports effect. The concept of the GRC was postulated as a major design component behind the New Austrian Tunneling Method (NATM) [6]. With continuous research and further improvement of practical application in tunnel support design, this analysis method has gradually become a useful and preliminary tool for the rational support design of tunnels [2,7]. Many studies have been developing this method and trying to explore possible mathematical models or empirical representations of GRC under different behavioral assumptions [8,9,10,11,12,13,14,15]. The assumptions of the above GRC studies are only applicable to tunnels excavated under an isotropic stress state [16,17,18,19,20].
The second most important curve for this method is the Support Confining Curve (SCC). The main point of this curve description is to prevent the continuous generation of displacement of the tunnel surrounding the ground by applying an increase in the support pressure at the intrados of the tunnel [21]. In addition, due to the timely installation of the support, the internal support pressure can withstand the radial convergence of the surrounding ground and reach an equilibrium state. Many studies on the SCC involve limitations of nonlinearity, time dependence, progressive hardening, and transient conditions of supports [22,23]. Under this assumption of various behaviors, several studies on the interaction solution of SCC and GRC in the final equilibrium state have been realized [24,25].
The third essential component of the method is the so-called longitudinal displacement profile (LDP) [12] or the confinement loss curve (CLC) [3,4]. The original purpose of the concept of confinement loss was to collect the convergence measurement data of the tunnel and find out the confinement loss curve by regression analysis, thereby simulating the effect of advancing excavation of the tunnel [1,2]. Many different views have been published regarding the definition and assumptions of confinement loss. For example, in implicit analysis, the confinement loss is assumed to be a coefficient that can simulate the plastic behavior due to tunnel excavation [26,27]. It has also been suggested that this coefficient is used to apply a portion of the restraint removal force, thereby simulating the excavation effect on the working face of the tunnel, and its value is between 0 and 1 [1,2,28,29]. The principle states that during advancing excavation at the face, the confinement loss increases, leading to a simultaneous decrease in radial stresses around the tunnel. In the explicit analysis, the confinement loss is considered as a key factor, an increment of the numerical analysis, which describes the important relationship between the release of support pressure at intrados of the tunnel and the effect of advancing excavation on the tunnel working face [3,4]. There are also studies with different assumptions regarding the effect of confinement losses around tunnels and the effect of constitutive models using finite difference procedures on improving the accuracy of the CCM analysis [30,31].
In the analysis of CCM that is usually employed in the preliminary design of tunnel support, based on the results of this series of studies, general engineers generally accept and use the assumption that deep circular tunnels are excavated under isotropic stress fields [32]. However, in reality, the in situ stress field is anisotropic and the stress ratio (ratio of horizontal stress to vertical stress) is not equal to 1. Therefore, a way to assume the in situ stress is a fundamental problem, and it is also an uncertainty in the simulation of the interaction between excavation and support of tunnel surrounding ground. The problems encountered in the case of the anisotropic stress field still need further theoretical research and practical verification. Up to now, there have still been many studies involving the interaction behavior between ground and support of tunnel excavation in an anisotropic stress field [33,34,35,36,37,38,39]. In addition, for the assumption of the initial stress state around the deep tunnel, whether it isotropic or anisotropic, the stress value around the tunnel will be the same from the center of the tunnel to infinity. This shows that there is no difference in the stress around the tunnel, and the stress value is the same everywhere in the vault, side wall, and invert of the tunnel. In other words, the initial stress of the tunnel surrounding rock has nothing to do with the overburden depth. However, the influencing factor of overburden depth plays an important role in the analysis of ground behavior in tunneling. Based on related studies on the initial isotropic stress state as a function of overburden depth, these studies suggest improvements regarding the ground reaction of CCM in circular tunnel excavations [40,41].
In the initial stage of the development of CCM theory, Panet (1995) [1] postulated the important hypothesis, that is, confinement loss. This influencing factor becomes an analytical concept of the link between the longitudinal profile and the cross-section of the tunnel. This concept can be used in numerical simulation to convert the effect of tunnel advancing excavation into the simulation of radial stress release of the observed section, so as to develop the connection results of two 2D sections into a simulated mechanical behavior of ground reaction caused by 3D tunnel excavation. Since then, many different theories concerning the implicit or explicit analysis have been proposed regarding the definition and assumptions of confinement loss [42,43]. Recently, many researchers proposed a new formula for calculating the longitudinal displacement profile or the confinement loss curve, which considers the effect of different constitutive models on the plastic radius [23,30,31]. In addition, regarding the discussion of the influencing parameters of the confinement loss, the effect of advancing excavation of the tunnel was studied by using the finite difference method to improve the correctness of the theoretical analysis of CCM [29,30]. A particular concept proposed by Panet [1,2] and Humbert et al. [29] is that confinement loss is a function of the longitudinal displacement profile. This mathematical scalar is not only used to apply a part of the constraint removal force around the tunnel in the cross-section, but also to simulate the effect of advancing excavation of the tunnel working face.
To further study the influence of the third term in the above assumptions, the initial anisotropic stress varies with the influence of the overburden depth. Therefore, this study specifically proposes assumptions about three different boundary conditions, which are independent of each other, to consider the influence of overburden depth on different initial anisotropic stresses of the far field. From a theoretical point of view, rigorous steps are taken to derive the analytical solution of the ground reaction induced by the advancing excavation of a circular tunnel under an anisotropic stress state, and the incremental procedure developed in this study is used to realize the computational solution of this analytical solution. The incremental procedure named Explicit Analysis Method (EAM) proposed in this paper includes two key points, using the value of the confinement loss as the incremental value of the incremental step and calculating the stress/displacement of the ground reaction under different initial stress states. This step-by-step approach can be a technique for visually interpreting the distribution of ground reaction in tunnel excavation. Another research focus of this paper is that the validity and usability of the incremental procedure developed for the analytical solution can be verified by employing numerical analysis, especially finite element analysis.
The purpose of this study is to fully and comprehensively discuss the influence of overburden depth and stress anisotropy on the ground reaction in the Convergence–Confinement Method, compare and verify the numerical analysis between EAM and FEM, and illustrate the stress/displacement distribution along the overburden pressure line to show the important influence of these two factors.

2. Coordinate Transformation and Description of Near and Far Stress Fields

2.1. Coordinate Transformation for Describing the Effect of Overburden Depth

The theory of the Convergence Confinement Method (CCM) is to assume that the initial stress is isotropic around the deep tunnel without considering the influence of the overburden depth; that is, the stress value around the tunnel is the same from the center of the tunnel to infinity. In other words, this means that the stress around the tunnel is the same on the roof, side wall, invert of the tunnel, and/or elsewhere. However, in practice, the stresses around the tunnel present different values with the depth of the overburden layer. Figure 1 shows the assumption of pressure around a circular tunnel in an isotropic/anisotropic stress field. On the left side of the figure, an assumption condition is proposed that the stress is constant with depth and isotropic (Ko = 1.0) in which the stress does not change with depth. On the right-hand side, the real situation of overburden pressure depends on the variation of depth in the initial anisotropic stress fields (Ko ≠ 1.0). It shows that the pressure changes depending on the depth.
Therefore, it can be observed that the stress distribution around the circular tunnel is significantly different and is indeed affected by the overburden depth. Thus, the initial vertical stress σv and horizontal stress σh can be obtained as
σ v = γ ( y ) ,
σ h = K o σ v ,
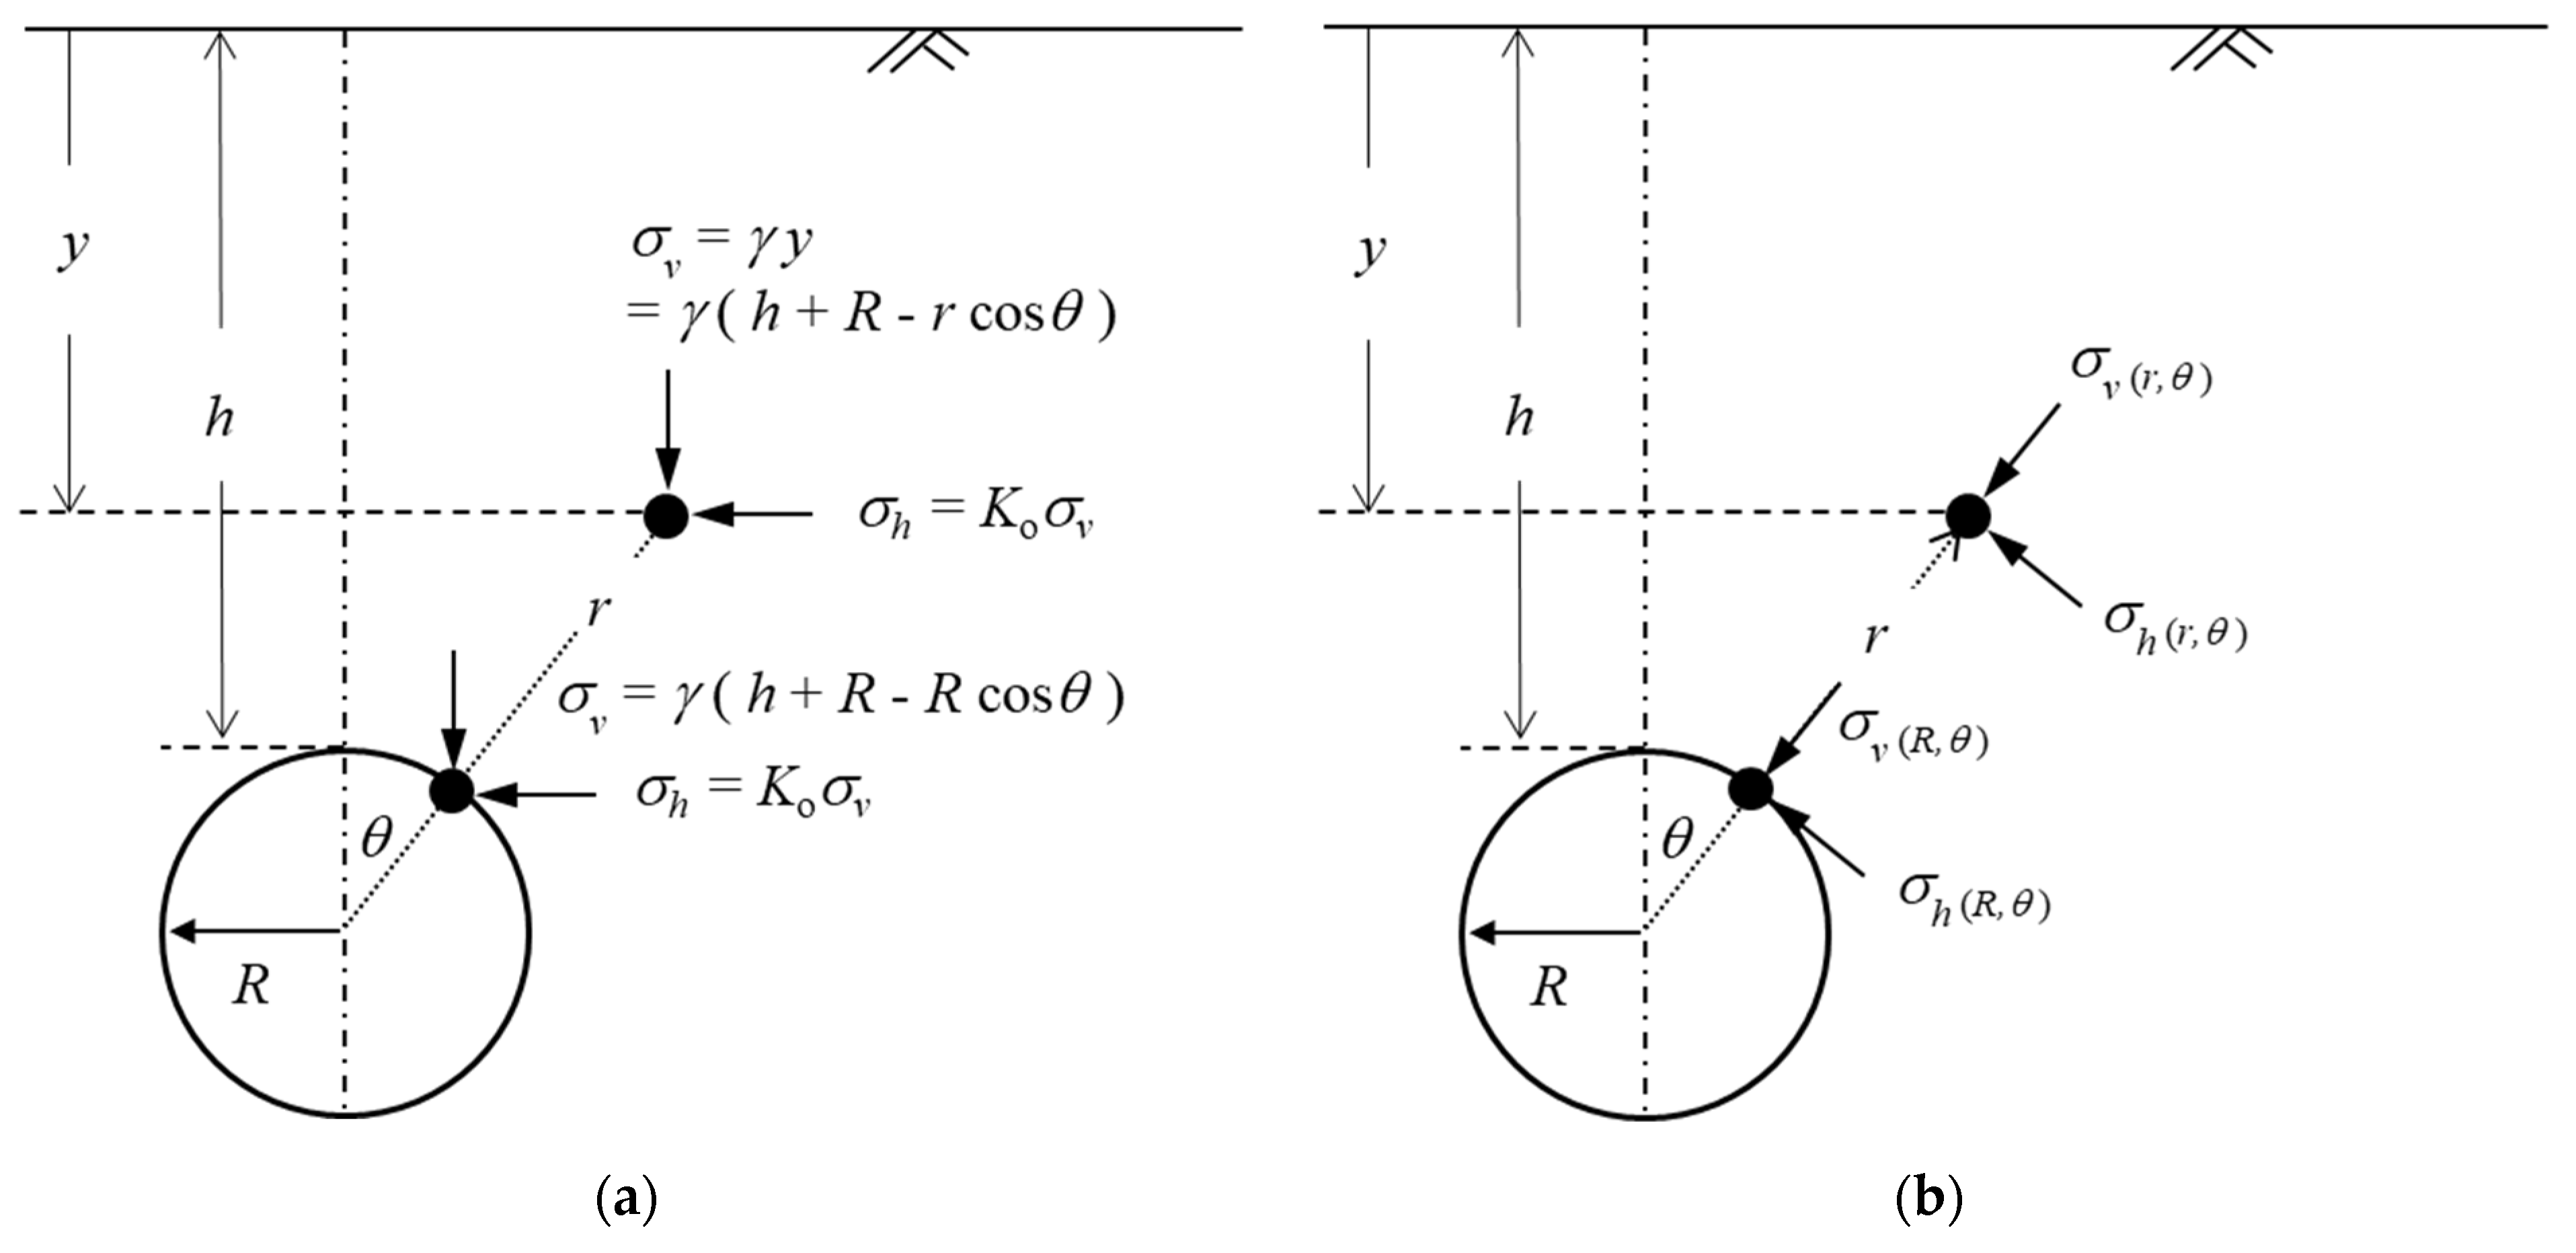
where σv and σh are the vertical and horizontal stresses, γ is a ground unit weight, Ko is the lateral stress ratio, and y represents the vertical coordinate value on the x-y two-dimensional plane, which is also the distance below the ground surface. As shown in Figure 2, through the conversion of the Cartesian coordinate system (x, y) to the polar coordinate system (r, θ), a new representation of the vertical stress at a certain position around the circular tunnel can be realized. Then, it can be expressed as the following:
{ σ v ( r , θ ) σ h ( r , θ ) } = [ cos θ sin θ sin θ cos θ ] { σ v σ h } ,
or can be represented by
σ v ( r , θ ) = γ ( y ) = γ ( h + R r cos θ ) ,
where σv(r,θ) and σh(r,θ) are the overburden pressure and the lateral pressure at a distance r from the geometric center of the tunnel, h is the distance from the crown of the tunnel to the surface of the ground, θ is the clockwise rotation angle, and R is the tunnel excavation radius. Under normal circumstances, it is often expressed as the stress at the intrados of the tunnel (r = R); then, the stress in the above formula can be rewritten as
σ v ( r = R , θ ) = σ v ( R , θ ) = γ ( h + R R cos θ ) = γ [ h + R ( 1 cos θ ) ] ,
where σv(R,θ) is the vertical stress at the intrados of the tunnel after a coordinate transformation. The change in this stress value depends on its polar coordinate (R, θ) position, such as the crown (0°), side wall (90°), invert (180°) of the tunnel, etc. Therefore, according to considerations from different angles, this study adopts a dimensionless method called a normalization procedure to express all stresses/displacements divided by this value.

2.2. Changes in Stress Gradient around the Tunnel

The variation of stresses/displacements in surrounding media due to the advancing excavation of the tunnel can be represented by the ground reaction curve (GRC). Therefore, this study proposes that the stress change around the tunnel can be interpreted by a concept of stress gradient that can completely describe the variation between the far-field stress and the near-field stress around the tunnel. In numerical analysis, the concept of increment is usually used, and the change in stress gradient can be expressed by the increment or decrement of stress. Therefore, in this study, the value of confinement loss is applied as the stress increment to simulate the stress change caused by tunnel excavation. This is an important procedure of calculation in the analysis of the Convergence Confinement Method [3,4]. The change in stress can be shown as follows.
(1)
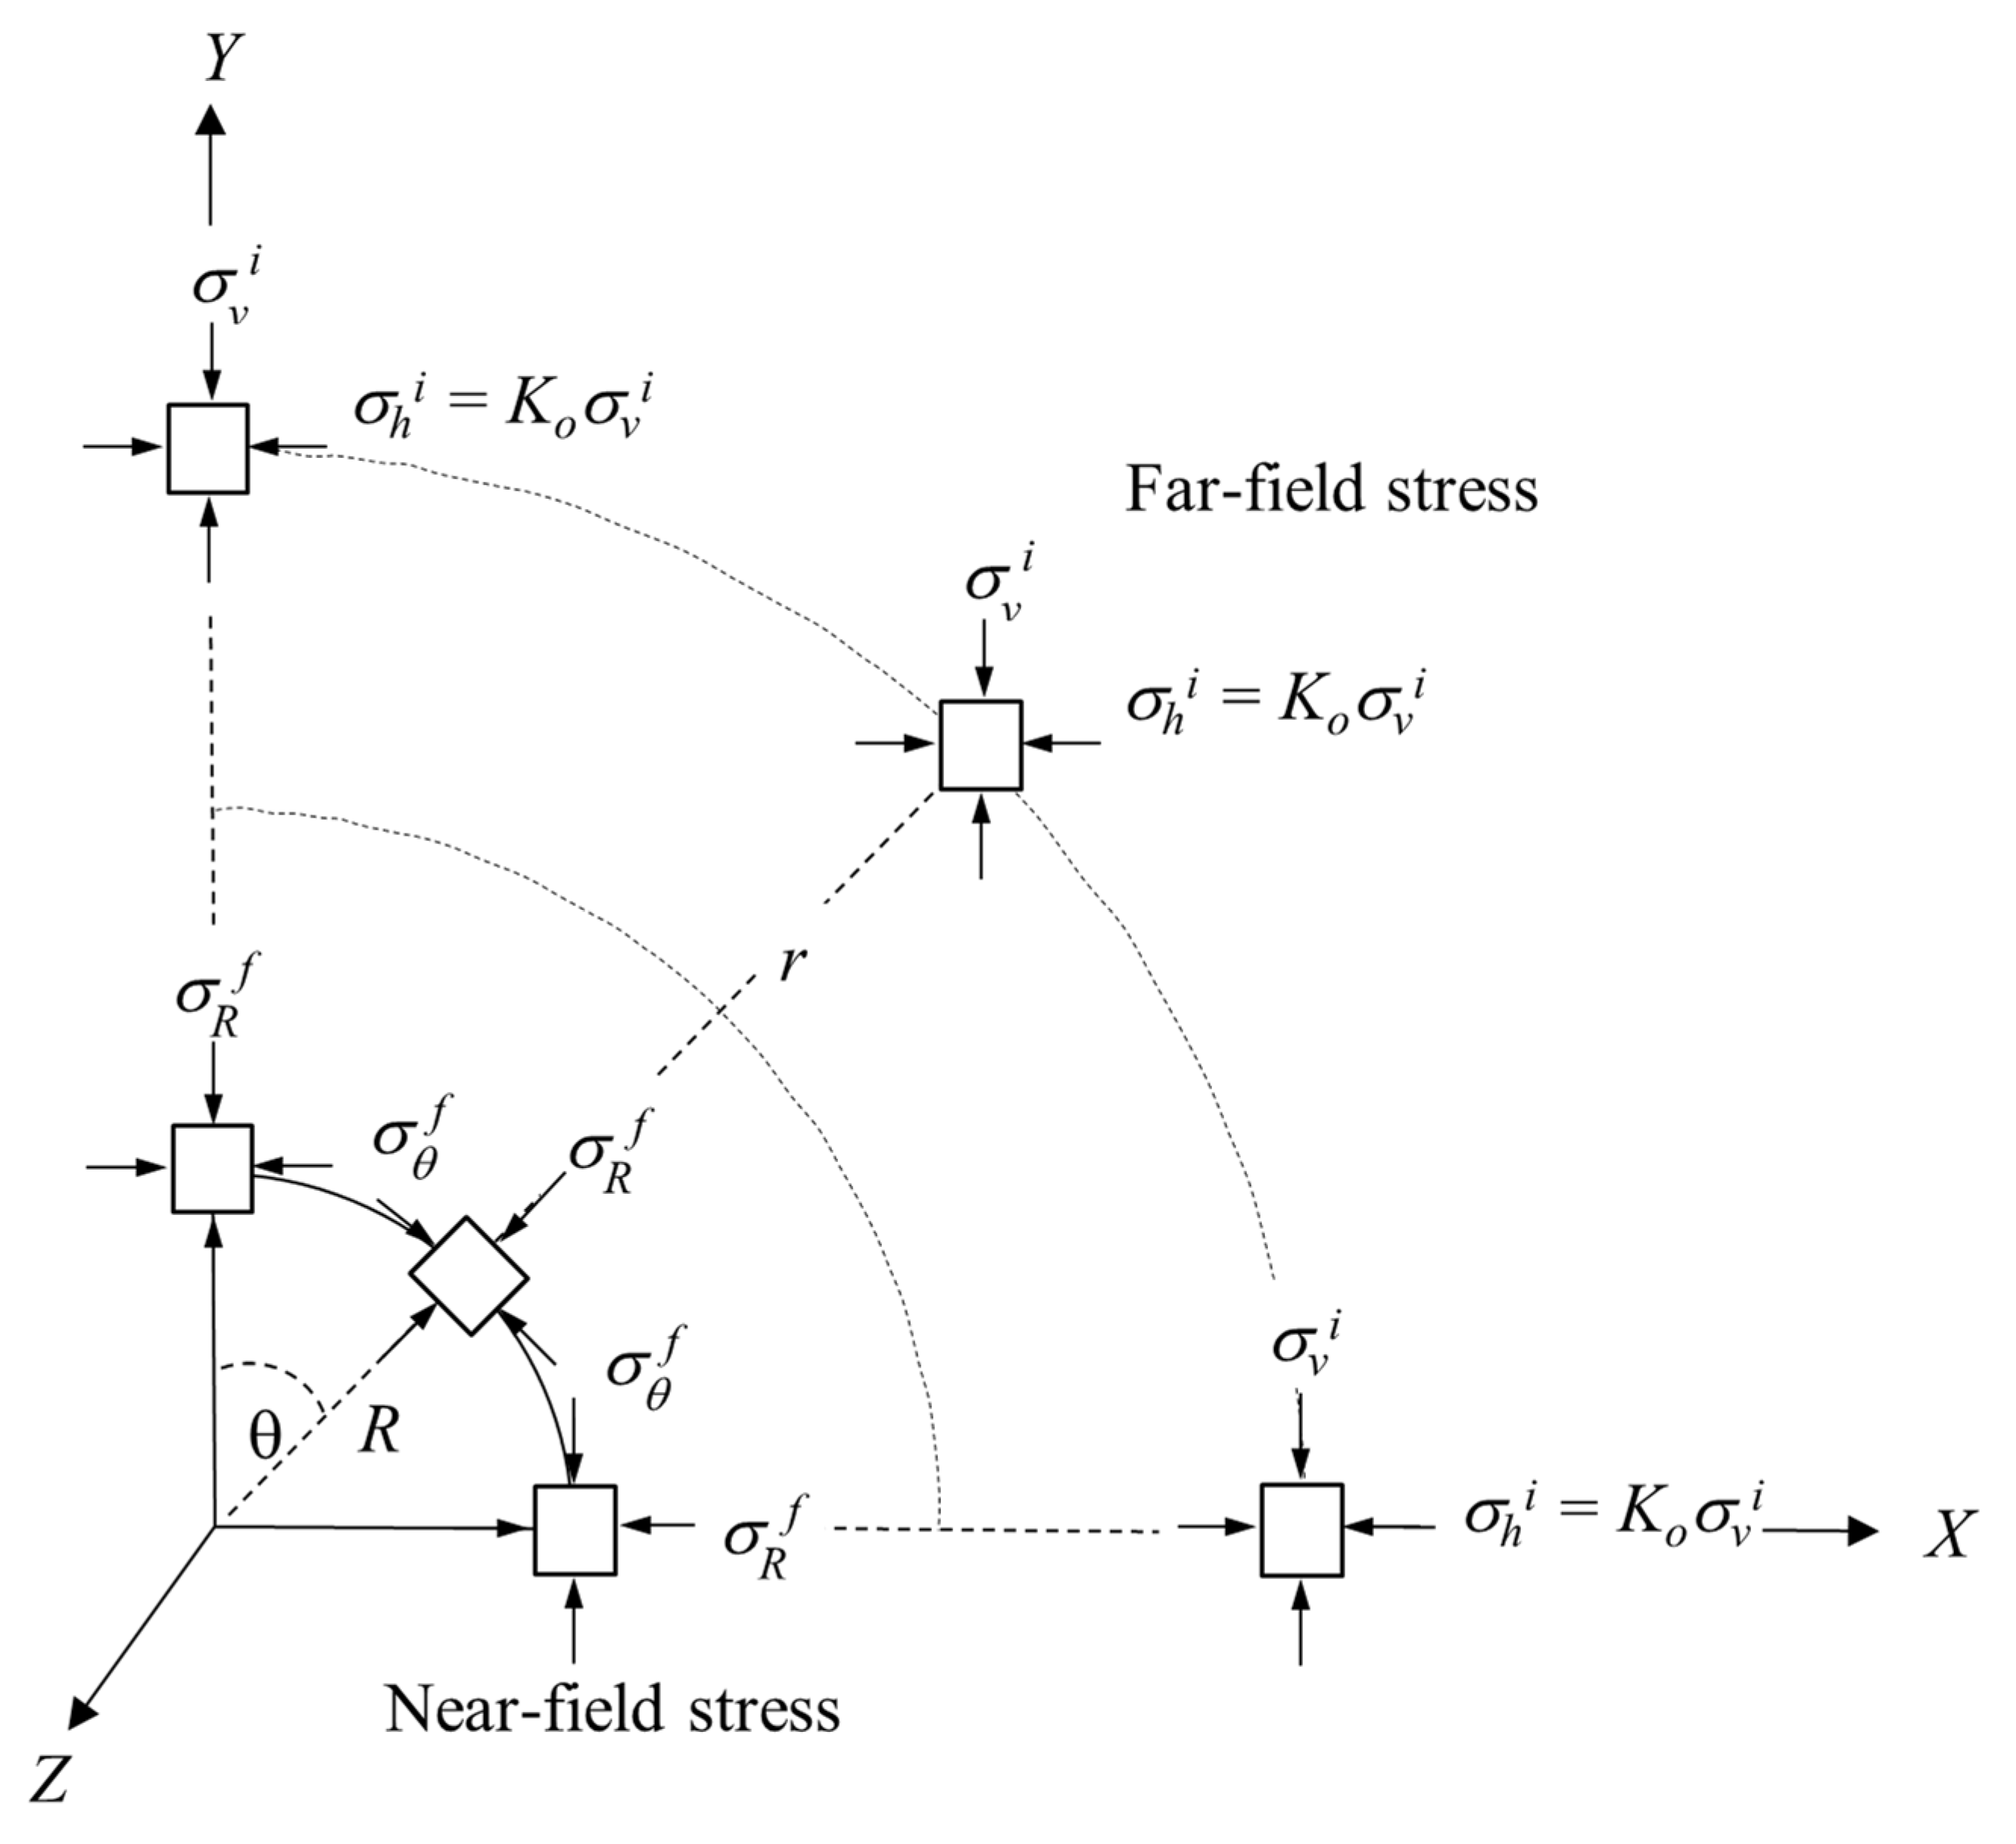
Initial in situ stresses in the far field (r → ∞): Before the tunnel is excavated, the stratum stress is in a state of static overburden stress. Therefore, the initial anisotropic stress in the formation can be shown in Figure 3, and its stress equation can be expressed as
σ r i = σ v 2 [ ( 1 + K o ) + ( 1 K o ) cos 2 θ ] ,
σ θ i = σ v 2 [ ( 1 + K o ) ( 1 K o ) cos 2 θ ] ,
where σ θ i and σ r i are the initial tangential stress and the initial radial stress, respectively.
(2)
Final stresses or the boundary stresses at the intrados of the tunnel in the near field (Rr < ∞): After the tunnel excavation is completed, the stress around the tunnel will change. This final stress can be obtained by Kirsch’s solution, and its stress equation can be expressed as
σ R f = σ v 2 [ ( 1 + K o ) ( 1 R 2 r 2 ) + ( 1 K o ) ( 1 4 R 2 r 2 + 3 R 4 r 4 ) cos 2 θ ] ,
σ θ f = σ v 2 [ ( 1 + K o ) ( 1 + R 2 r 2 ) ( 1 K o ) ( 1 + 3 R 4 r 4 ) cos 2 θ ] ,
where σ θ f and σ r f are the final tangential stress and the final radial tress around the tunnel proximity, respectively.
The stress field around the tunnel changes due to the advancing excavation of the tunnel. The stress gradient can be regarded as the difference between the near and far fields. Thus, the difference in the associated stresses can be expressed as
σ ¯ r = σ r f σ r i = σ v 2 [ ( 1 + K o ) ( 1 R 2 r 2 ) + ( 1 K o ) ( 1 4 R 2 r 2 + 3 R 4 r 4 ) cos 2 θ ] , σ v 2 [ ( 1 + K o ) + ( 1 K o ) cos 2 θ ]
σ ¯ θ = σ θ f σ θ i = σ v 2 [ ( 1 + K o ) ( 1 + R 2 r 2 ) ( 1 K o ) ( 1 + 3 R 4 r 4 ) cos 2 θ ] . σ v 2 [ ( 1 + K o ) ( 1 K o ) cos 2 θ ]
As mentioned above, the value of the confinement loss can be used as the increment of stress to simulate the stress change caused by tunnel advancing excavation, and the relevant increment of stress can be expressed as
Δ σ r = λ σ ¯ r = λ σ v 2 [ ( 1 + K o ) R 2 r 2 + ( 1 K o ) ( 4 R 2 r 2 3 R 4 r 4 ) cos 2 θ ] ,
Δ σ θ = λ σ ¯ θ = λ σ v 2 [ ( 1 + K o ) R 2 r 2 3 ( 1 K o ) R 4 r 4 cos 2 θ ] .
Therefore, the change in the stress field caused by the advancing excavation of the tunnel can be expressed as follows:
σ r = σ r i + Δ σ r ,
σ θ = σ θ i + Δ σ θ .
The radial stress can be obtained by substituting Equations (6) and (12) into Equation (14), and the tangential stress can be obtained by substituting Equations (7) and (13) into Equation (15). Thus, the new equations can be obtained as
σ r = σ v 2 [ ( 1 + K o ) + ( 1 K o ) cos 2 θ ] λ σ v 2 [ ( 1 + K o ) R 2 r 2 + ( 1 K o ) ( 4 R 2 r 2 3 R 4 r 4 ) cos 2 θ ] ,
σ θ = σ v 2 [ ( 1 + K o ) ( 1 K o ) cos 2 θ ] + λ σ v 2 [ ( 1 + K o ) R 2 r 2 3 ( 1 K o ) R 4 r 4 cos 2 θ ] .
Alternatively, the above equations can be normalized by the radial stress at intrados of the tunnel σ(R, θ), and substituted by k 1 = 1 + K o and k 2 = ( 1 K o ) cos 2 θ , thus
σ r σ v ( R , θ ) = σ v 2 σ v ( R , θ ) [ k 1 ( 1 λ R 2 r 2 ) + k 2 ( 1 λ ( 4 R 2 r 2 3 R 4 r 4 ) ) ] ,
σ θ σ v ( R , θ ) = σ v 2 σ v ( R , θ ) [ k 1 ( 1 + λ R 2 r 2 ) k 2 ( 1 + 3 λ R 4 r 4 ) ] .
To meet the requirements of the boundary conditions in the analysis of CCM, the above equations can be proved by the following explanation: (1) When the tunnel is not excavated yet (λ = 0), the stresses around the tunnel are the initial stresses regarding the effect of overburden depth, and (2) after the tunnel is completely excavated (λ = 1), the stresses around the tunnel in the final state are the same as those proposed by Kirsch.

3. Derivation of Stress/Displacement in the Elastic and Plastic Regions

3.1. Plastic Radius and Stresses in the Plastic Region

According to the research results of Panet (1995) [1] and Lee (2018) [26], the surrounding stresses after a disturbance of the tunnel excavation are a function of confinement loss at the elastic limit (λe), plastic radius (Rp), polar coordinates (r, θ), vertical stress (σv) and parameters of the rock mass that depend on the failure criterion used. Therefore, the radial and tangential stresses in the plastic region can be obtained as
σ r = σ v K p 1 { [ ( k 1 k 2 ) λ e k 2 ] ( r R p ) K p 1 σ c σ v } ,
σ θ = σ v K p 1 { [ ( k 1 k 2 ) λ e k 2 ] K p ( r R p ) K p 1 σ c σ v } ,
or by the representation of normalization form; then,
σ r σ v ( R , θ ) = σ v ( K p 1 ) σ v ( R , θ ) { [ ( k 1 k 2 ) λ e k 2 ] ( r R p ) K p 1 σ c σ v } ,
σ θ σ v ( R , θ ) = σ v ( K p 1 ) σ v ( R , θ ) { [ ( k 1 k 2 ) λ e k 2 ] K p ( r R p ) K p 1 σ c σ v } ,
where Kp is the coefficient of passive lateral pressure, and σc is the uniaxial compression strength (UCS) of the intact rock and can be obtained as
σ c = 2 c K p ,
K p = t a n 2 ( 45 + φ 2 ) ,
where φ and c are the internal friction angle and cohesion, respectively. Moreover, the plastic radius (Rp) and the confinement loss at the elastic limit (λe) can be obtained as
R p R = [ ( k 1 k 2 ) λ e k 2 1 2 [ ( K p + 1 ) k 1 + ( K p 3 ) k 2 ] λ e 1 2 ( K p 1 ) ( k 1 + k 2 ) λ k 2 ] 1 K p 1 ,
λ e = ( K p 1 ) k 1 + ( K p + 1 ) k 2 + 4 σ c σ v ( K p + 1 ) k 1 + ( K p 3 ) k 2 ,
where Rp is the plastic radius that is a function of the confinement loss at the elastic limit ( λ e ), meanwhile it is also a function of the vertical stress ( σ v ) and the strength parameters of the ground ( φ and c). In the CCM analysis, it can be determined that when the stress of the surrounding rock meets the failure criterion, the continuously increasing value of confinement loss will expand the plastic radius, which will lead to a gradual decrease in the radial stress and tangential stress in the plastic zone.

3.2. Derivation of Displacements in the Elastic and Plastic Regions

Regarding the stress change in the surrounding rock caused by tunnel excavation and the corresponding strain under the plane strain condition, according to the relationship of constitutive law, the radial strain ε r e and tangential strains ε θ e in the elasticity can be expressed as follows:
{ ε θ e ε r e } = 1 2 G [ 1 ν ν ν 1 ν ] { Δ σ θ Δ σ r } ,
where G is the shear modulus and ν is the Poisson’s ratio of the ground. The increment of stresses Δ σ θ and Δ σ r can be obtained in Equations (12) and (13) with λ = λ e and r = R, and can be obtained as
Δ σ r = R = λ e σ v 2 ( k 1 + k 2 ) ,
Δ σ θ = λ e σ v 2 ( k 1 3 k 2 ) .
Based on the assumption of small strain, the relationship between strain and displacement in the compatibility equation can be expressed as
ε r = d u r d r .
According to the assumption of axisymmetric, the effect of tangential strain could be neglected. Then, combining the relationship between Equation (28) of constitutive law and compatibility Equation (31), the following expression can be obtained as
2 G d u r d r = ( 1 ν ) Δ σ r ν Δ σ θ .
The radial displacement in the elastic region can be obtained by integrating the above equation, which can be expressed in normalized form as follows:
2 G σ v ( R , θ ) u r R = λ σ v 2 σ v ( R , θ ) ( R r ) { k 1 + k 2 [ 4 ( 1 v ) ( R r ) 2 ] } .
In addition, the total tangential and radial strains, ε θ and ε r , can be decomposed into elastic and plastic parts as
ε r = ε r e + ε r p ,
ε θ = ε θ e + ε θ p ,
where the subscripts p and e represent the plastic and elastic parts, respectively. Regarding the plastic flow rule needed to determine the displacement field in the plastic region, the plastic strain must conform to the normality rule; this paper adopts the non-associated flow rule and assumes the volume plastic strain, which can be obtained as follows:
ε r p + K ψ ε θ p = 0 ,
where K ψ = t a n 2 ( 45 + ψ / 2 ) and ψ is the dilation angle of the ground. Combining Equations (28), (34) and (36) leads to the differential equation
d u r d r + K ψ u r r = f ( r ) ,
where
f ( r ) = ε r e + K ψ ε θ e .
To substitute the equation of constitutive law (28) into the above equation, then
f ( r ) = 1 2 G [ ( K ψ ν K ψ ν ) Δ σ θ + ( 1 ν ν K ψ ) Δ σ r ] .
According to the boundary conditions of the radial displacement in the plastic region, the differential Equation (37) can be obtained with engineering mathematics methods for homogeneous and particular solutions. Then, the closed-form analytical solution of the radial displacement in the plastic region can be obtained, which is expressed in the normalized form as follows:
2 G σ v ( R , θ ) u r R = λ e ( σ v σ v ( R , θ ) ) ( r R ) [ C 1 + C 2 ( r R p ) K p 1 + C 3 ( R p r ) K ψ + 1 ] ,
where
C 1 = 1 2 ν K p 1 [ ( K p + 1 ) k 1 + ( K p 3 ) k 2 2 ] ,
C 2 = 1 + K ψ K p ν ( K p + 1 ) ( K ψ + 1 ) ( K p 1 ) ( K ψ + K p ) [ ( k 1 k 2 ) k 2 λ e ] ,
C 3 = ( 1 2 ν ) K p 1 [ ( K p + 1 ) k 1 + ( K p 3 ) k 2 2 ] 1 + K ψ K p ν ( K p + 1 ) ( K ψ + 1 ) ( K p 1 ) ( K ψ + K p ) [ ( k 1 k 2 ) k 2 λ e ] + [ k 1 + k 2 ( 3 4 ν ) 2 ]
For the coefficients C1, C2, and C3 to meet the consistency conditions, these coefficients must satisfy the requirements of the following equation during the calculation process:
C 1 + C 2 + C 3 = k 1 + k 2 ( 3 4 ν ) 2 .
According to the closed-form analytical solution obtained, the radial displacements in the plastic and elastic regions can be summarized as follows:
(1)
In the plastic region (RrRp), the radial displacement is obtained as
2 G σ v ( R , θ ) u r = R R = λ e ( σ v σ v ( R , θ ) ) [ C 1 + C 2 ( R R p ) K p 1 + C 3 ( R p R ) K ψ + 1 ] .
(2)
The radial displacement at the elastic-plastic interface (r = Rp):
2 G σ v ( R , θ ) u r = R p R = λ e σ v 2 σ v ( R , θ ) [ k 1 + ( 3 4 ν ) k 2 ] ( R p R ) .
(3)
In the elastic region (Rp r), the radial displacement becomes
2 G σ v ( R , θ ) u r R = λ e σ v 2 σ v ( R , θ ) ( R p R ) ( R p r ) { k 1 + k 2 [ 4 ( 1 v ) ( R p r ) 2 ] } .
Finally, the above displacements can be suggested using the function ur = f (r, θ, λ) instead of the function f (x, y, z).

4. Numerical Analysis Process and Calculation Steps

4.1. Incremental Procedure for Explicit Analysis Method

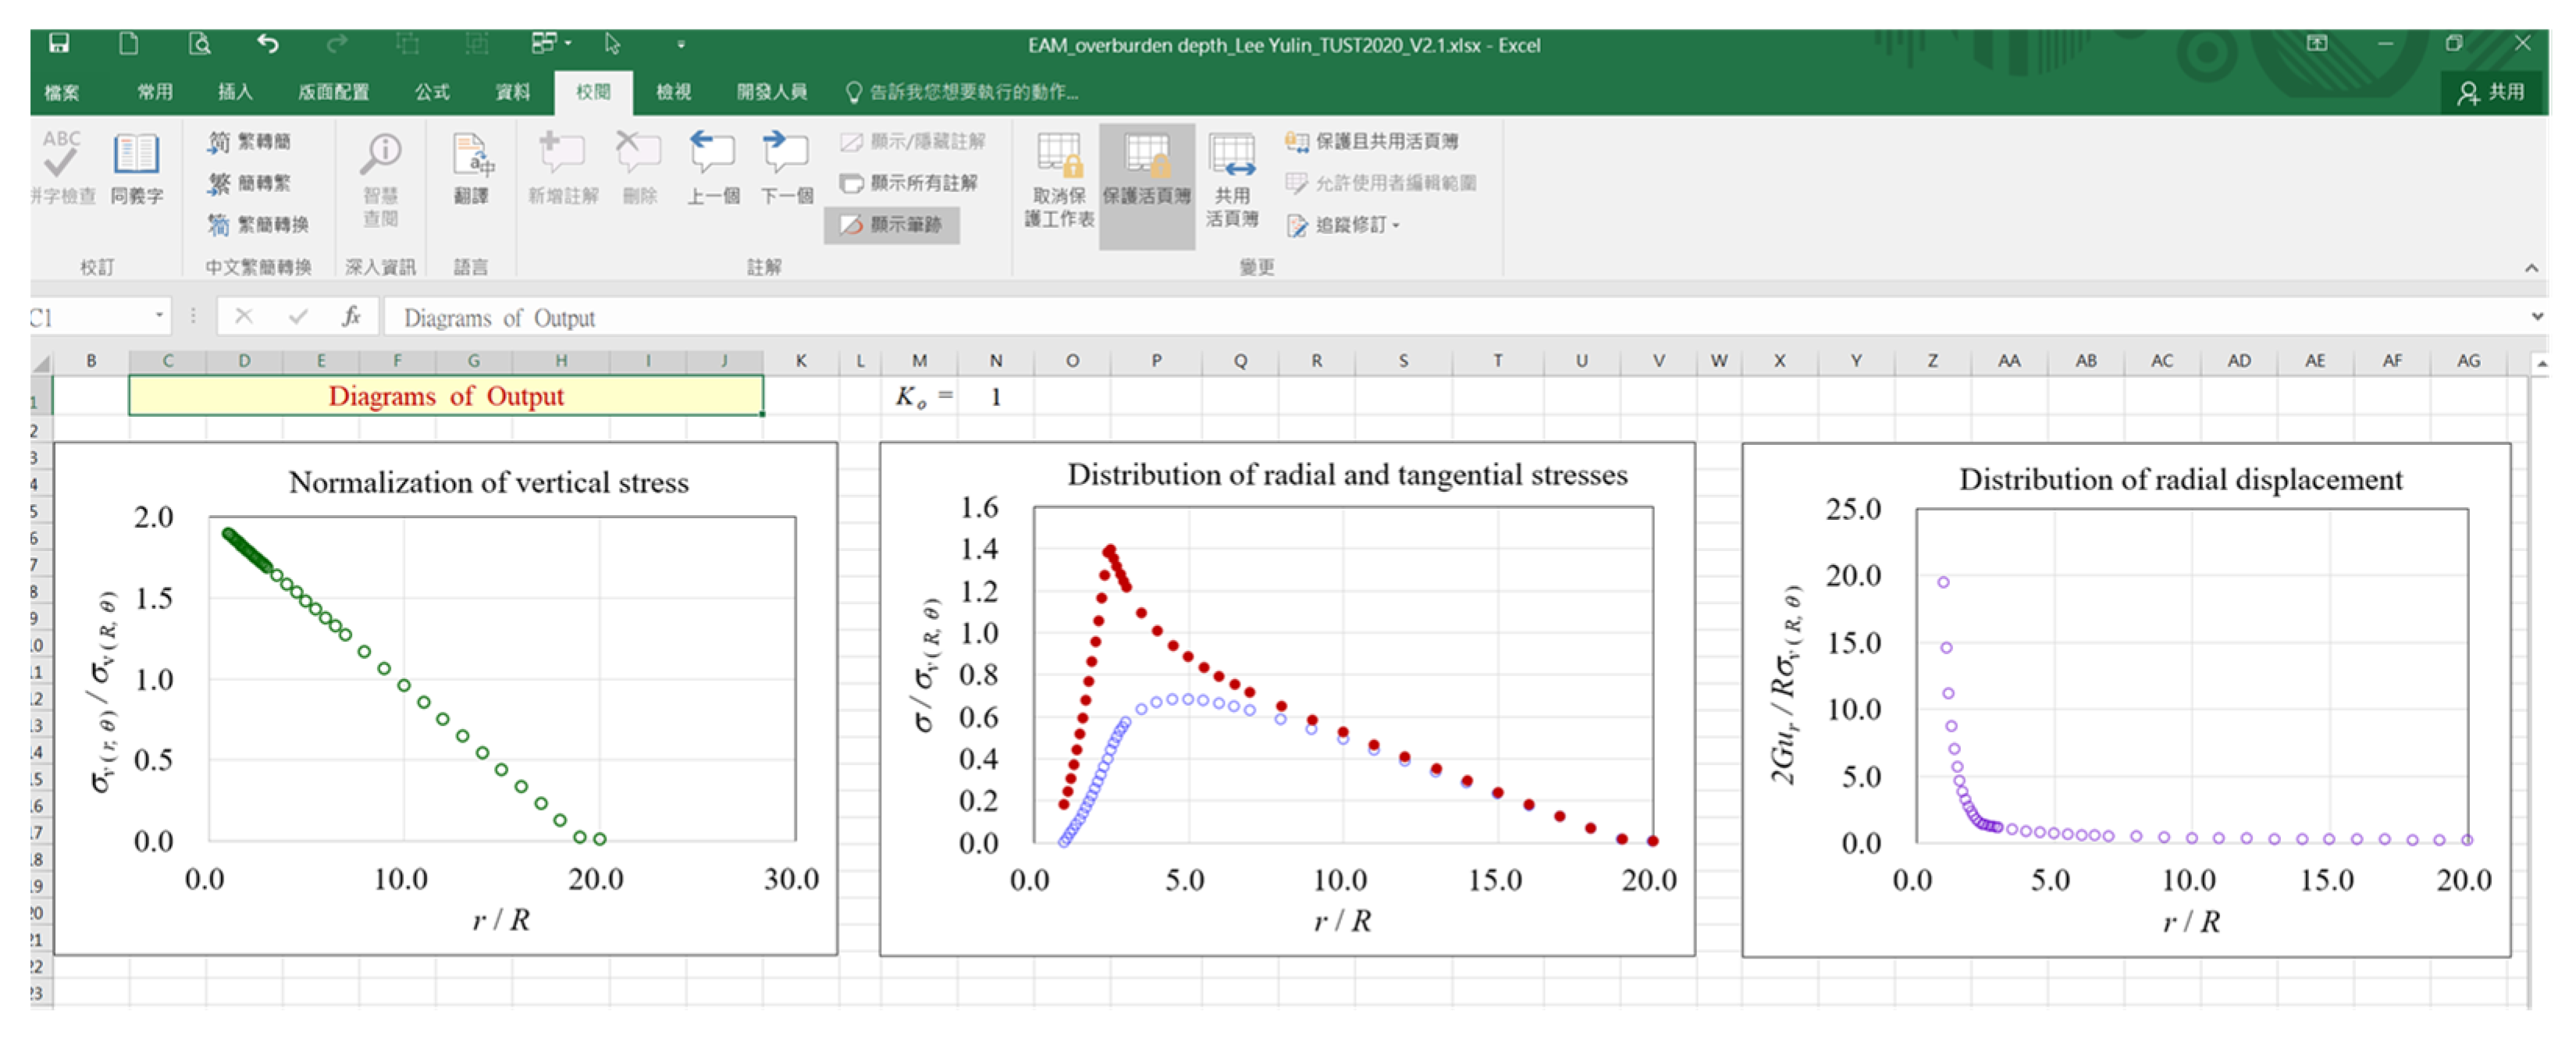
The incremental procedure with the explicit algorithm used to realize the calculation in this paper is called the Explicit Analysis Method (EAM), which not only implements analytical solutions and converts them into executable calculations, but also directly calculates using a simple calculation spreadsheet as shown in Figure 4. The EAM can process the incremental steps of confinement loss to simulate the effect of advancing excavation of the tunnel, calculate the stress/displacement of each calculation step, and draw the stress path at the intrados of the tunnel, the ground reaction curve, and the stress/displacement distribution on the cross-section of the tunnel as shown in Figure 5.
The calculation steps of the Explicit Analysis Method (EAM) are described as follows:
(1)
Input the following data: physical properties and mechanical parameters of materials, geometric parameters of the analysis range, unsupported distance, and initial in situ stress.
(2)
Select a value of confinement loss λz at a certain distance z from the tunnel face to simulate the effect of advancing excavation due to the unsupported distance of the tunnel.
(3)
Subdivide the confinement loss λz into n segments, so the incremental step Δλ can be expressed as
Δ λ = 1 n ( 1 λ z ) .
(4)
Calculate the value of each incremental step λ as
λ i + 1 = λ z λ i + 1 = λ i + i Δ λ i = 0 i = 1 ~ ( n 1 ) } .
(5)
Superimpose each incremental step and reach the final value λ n = λ i + 1
(6)
Use Equation (27) to calculate the confinement loss at the elastic limit λz.
(7)
If λ i + 1 < λ e , it indicates that the stress state is in the elastic region. At this point, the radial and tangential stress/displacement can be calculated using Equations (18), (19) and (33), respectively.
(8)
Else, if λ i + 1 λ e , it indicates that that the stress state is in the plastic region. Thus, the plastic radius Rp can be calculated using Equation (26). Thereafter, the developed program automatically calculates the radial and tangential stresses and the radial displacements according to Equations (22), (23) and (40), respectively.
(9)
The program records the calculated data and presents them in the following stress/displacement distribution format: ( σ r / σ v ( R , θ ) , r/R), ( σ θ / σ v ( R , θ ) , r/R), and ( 2 G u r / R σ ( R , θ ) , r/R).
(10)
When i < n − 1, iterate step (4) through step (10).
(11)
When i = n − 1, the process is stopped. Record the data from each step.
(12)
The program will systematically draw the stress/displacement distribution of the tunnel section as shown in Figure 5.

4.2. Numerical Analysis of Finite Element Method

To verify the validity of the results obtained by the Explicit Analysis Method (EAM) proposed in this paper, this study attempts to use the Finite Element Method (FEM) to compare the results of theoretical analysis and numerical calculation. The numerical simulation and analysis of this research adopt the 2D finite element program developed in the laboratory, and its main calculation content and steps include three main parts: (1) pre-processing program; (2) main calculation program; (3) post-processing program. The calculation steps and contents are as follows:
(1)
Pre-processing program: prepare calculation data, including calculation range, automatically generated 2D excavation and support meshes, calculation matrix optimization, re-node numbering, input parameters according to the selected composition mode, and define each module group, boundary conditions and the use of the initial stress method, the number of iterative operations, and the allowable accuracy.
(2)
Main calculation program: read data and related calculations, including the parameters of each group of elements, the total domain coordinate value of each node, the parameters of the constitutive law of each module, the degree of freedom of each node, the state of force, the number of repeated operations, and the allowable accuracy value, etc.
(3)
Post-processing programs: visual interface processing and drawing output, including the iso-value of the displacement distribution map, and total displacement, the iso-value of the stress distribution map of principal stress and deviatoric stress, the distribution map of stress field and displacement field, etc.
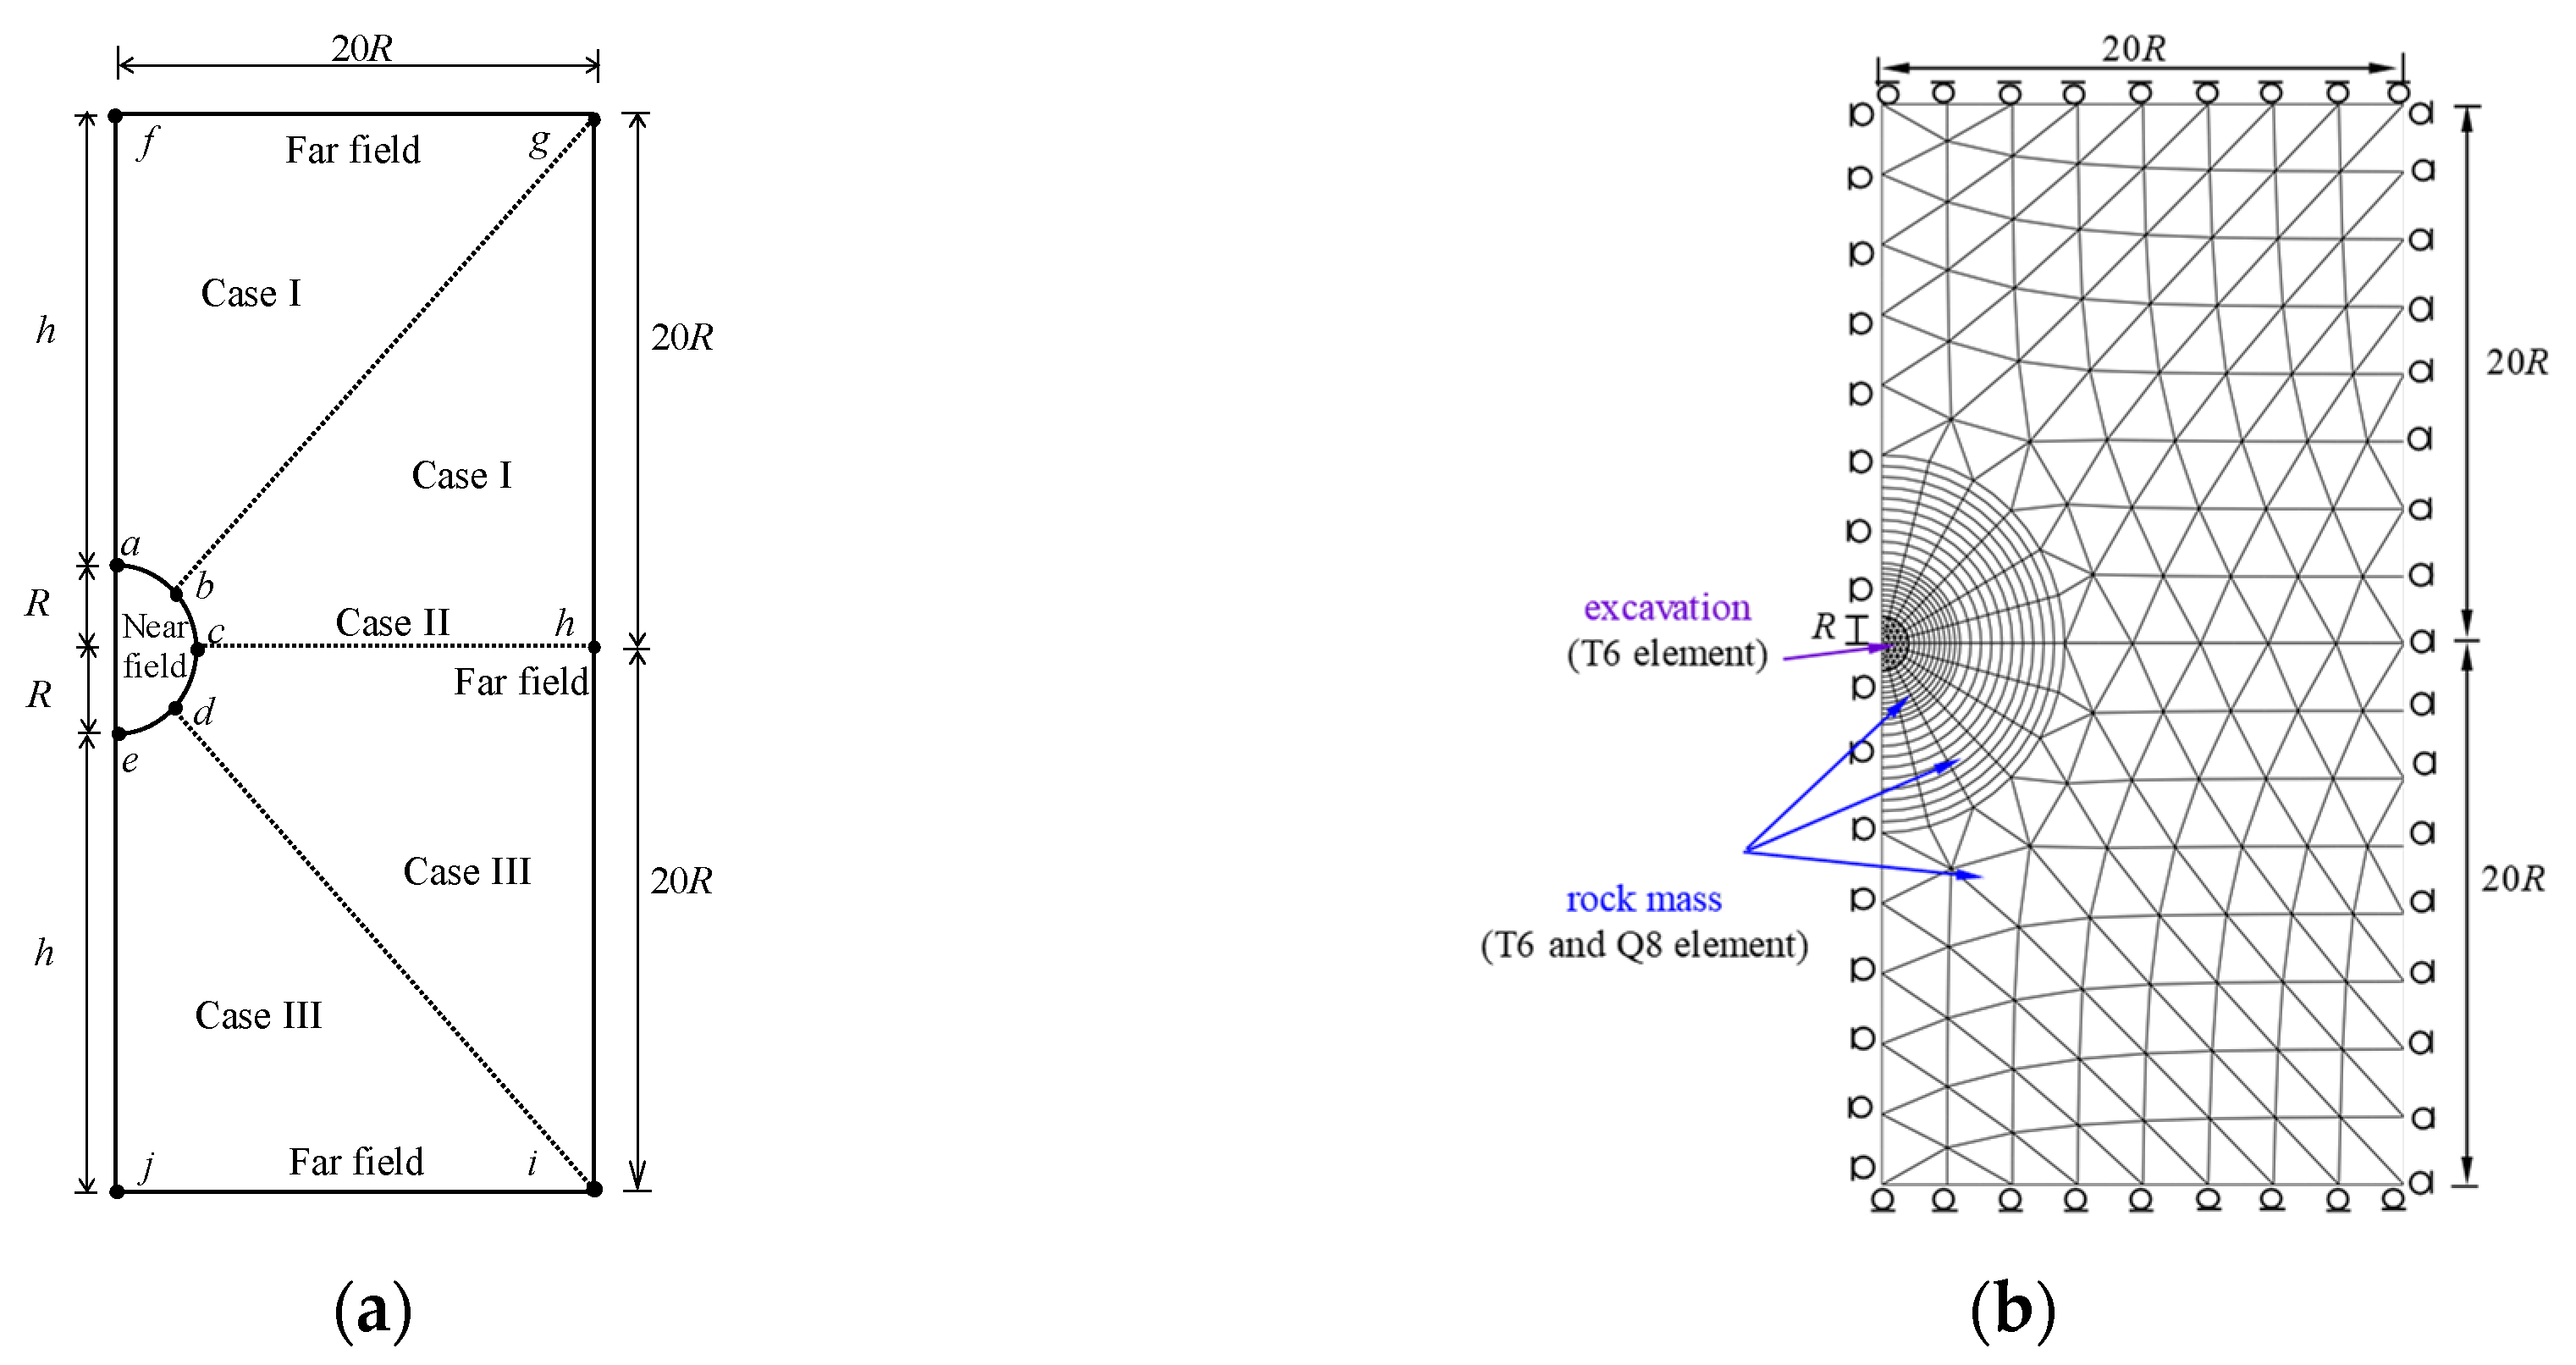
To consider the influence of the overburden depth on the initial stress, Figure 6a shows the assumptions of three different boundary conditions, including Case I (the area above the spring line, 0° < θ < 90°), Case II (the spring line position, θ = 90°), and Case III (the area below the spring line, 90° < θ < 180°). As for the assumptions on geometric size and boundary condition, this study adopts a distance of 20 times the excavation radius of the upper, lower, and right half of the tunnel center, and the bottom and both sides of the mesh are respectively supported by rollers as the boundary limit of the analysis. The category of meshes in finite element analysis includes three groups of elements (mass elements for excavation, ground, and lining), 352 elements (328 six-node triangular elements T6 and 24 eight-node quadrilateral elements Q8), and 777 total nodes as shown in Figure 6b. The input data of the calculation is shown in Table 1.
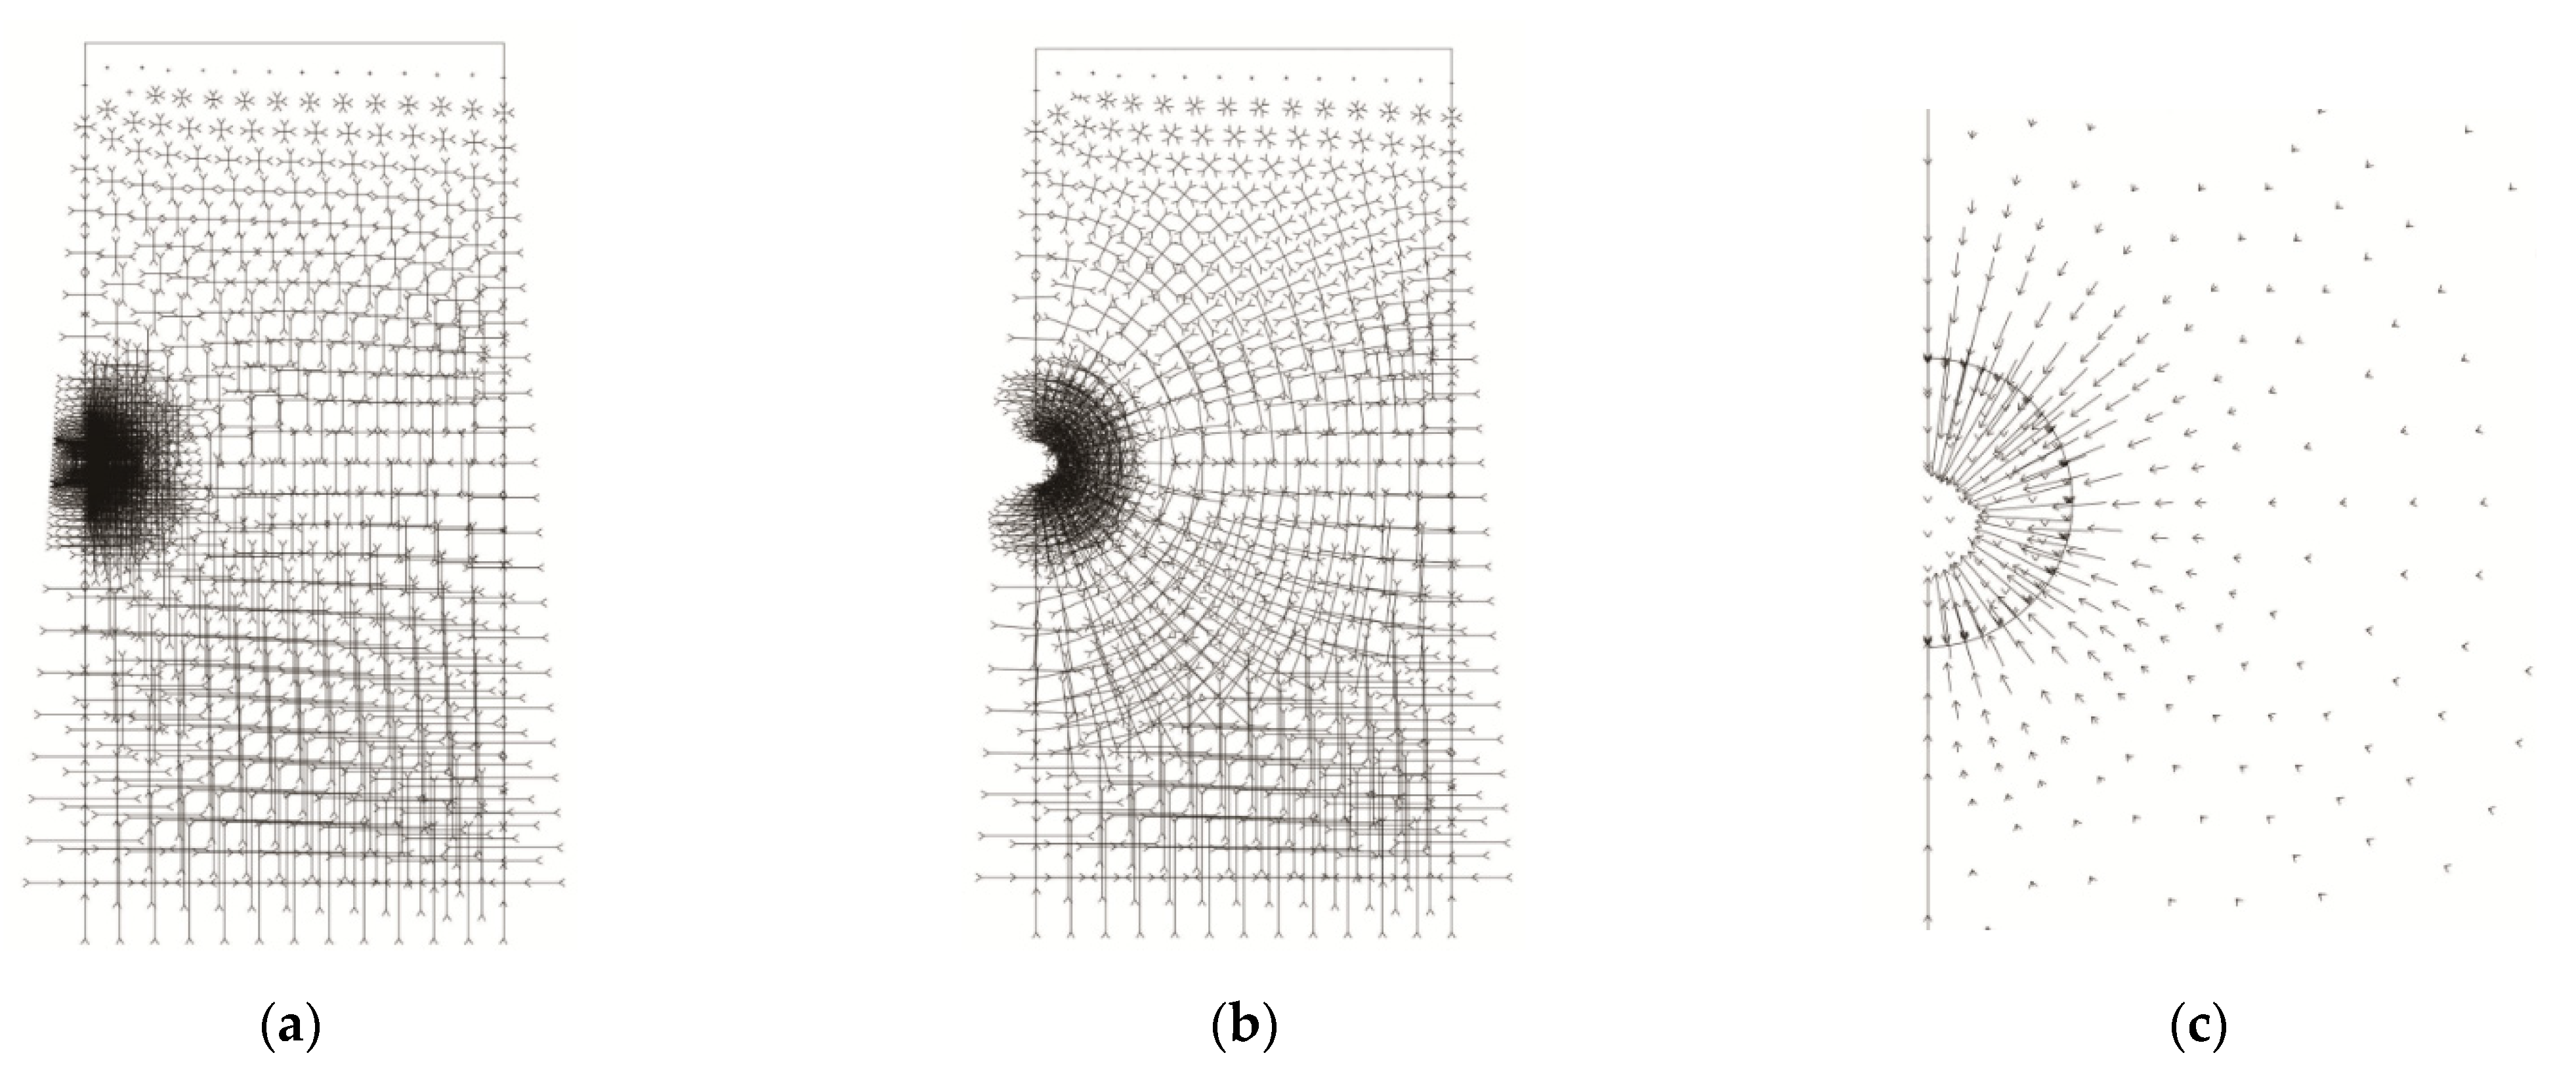
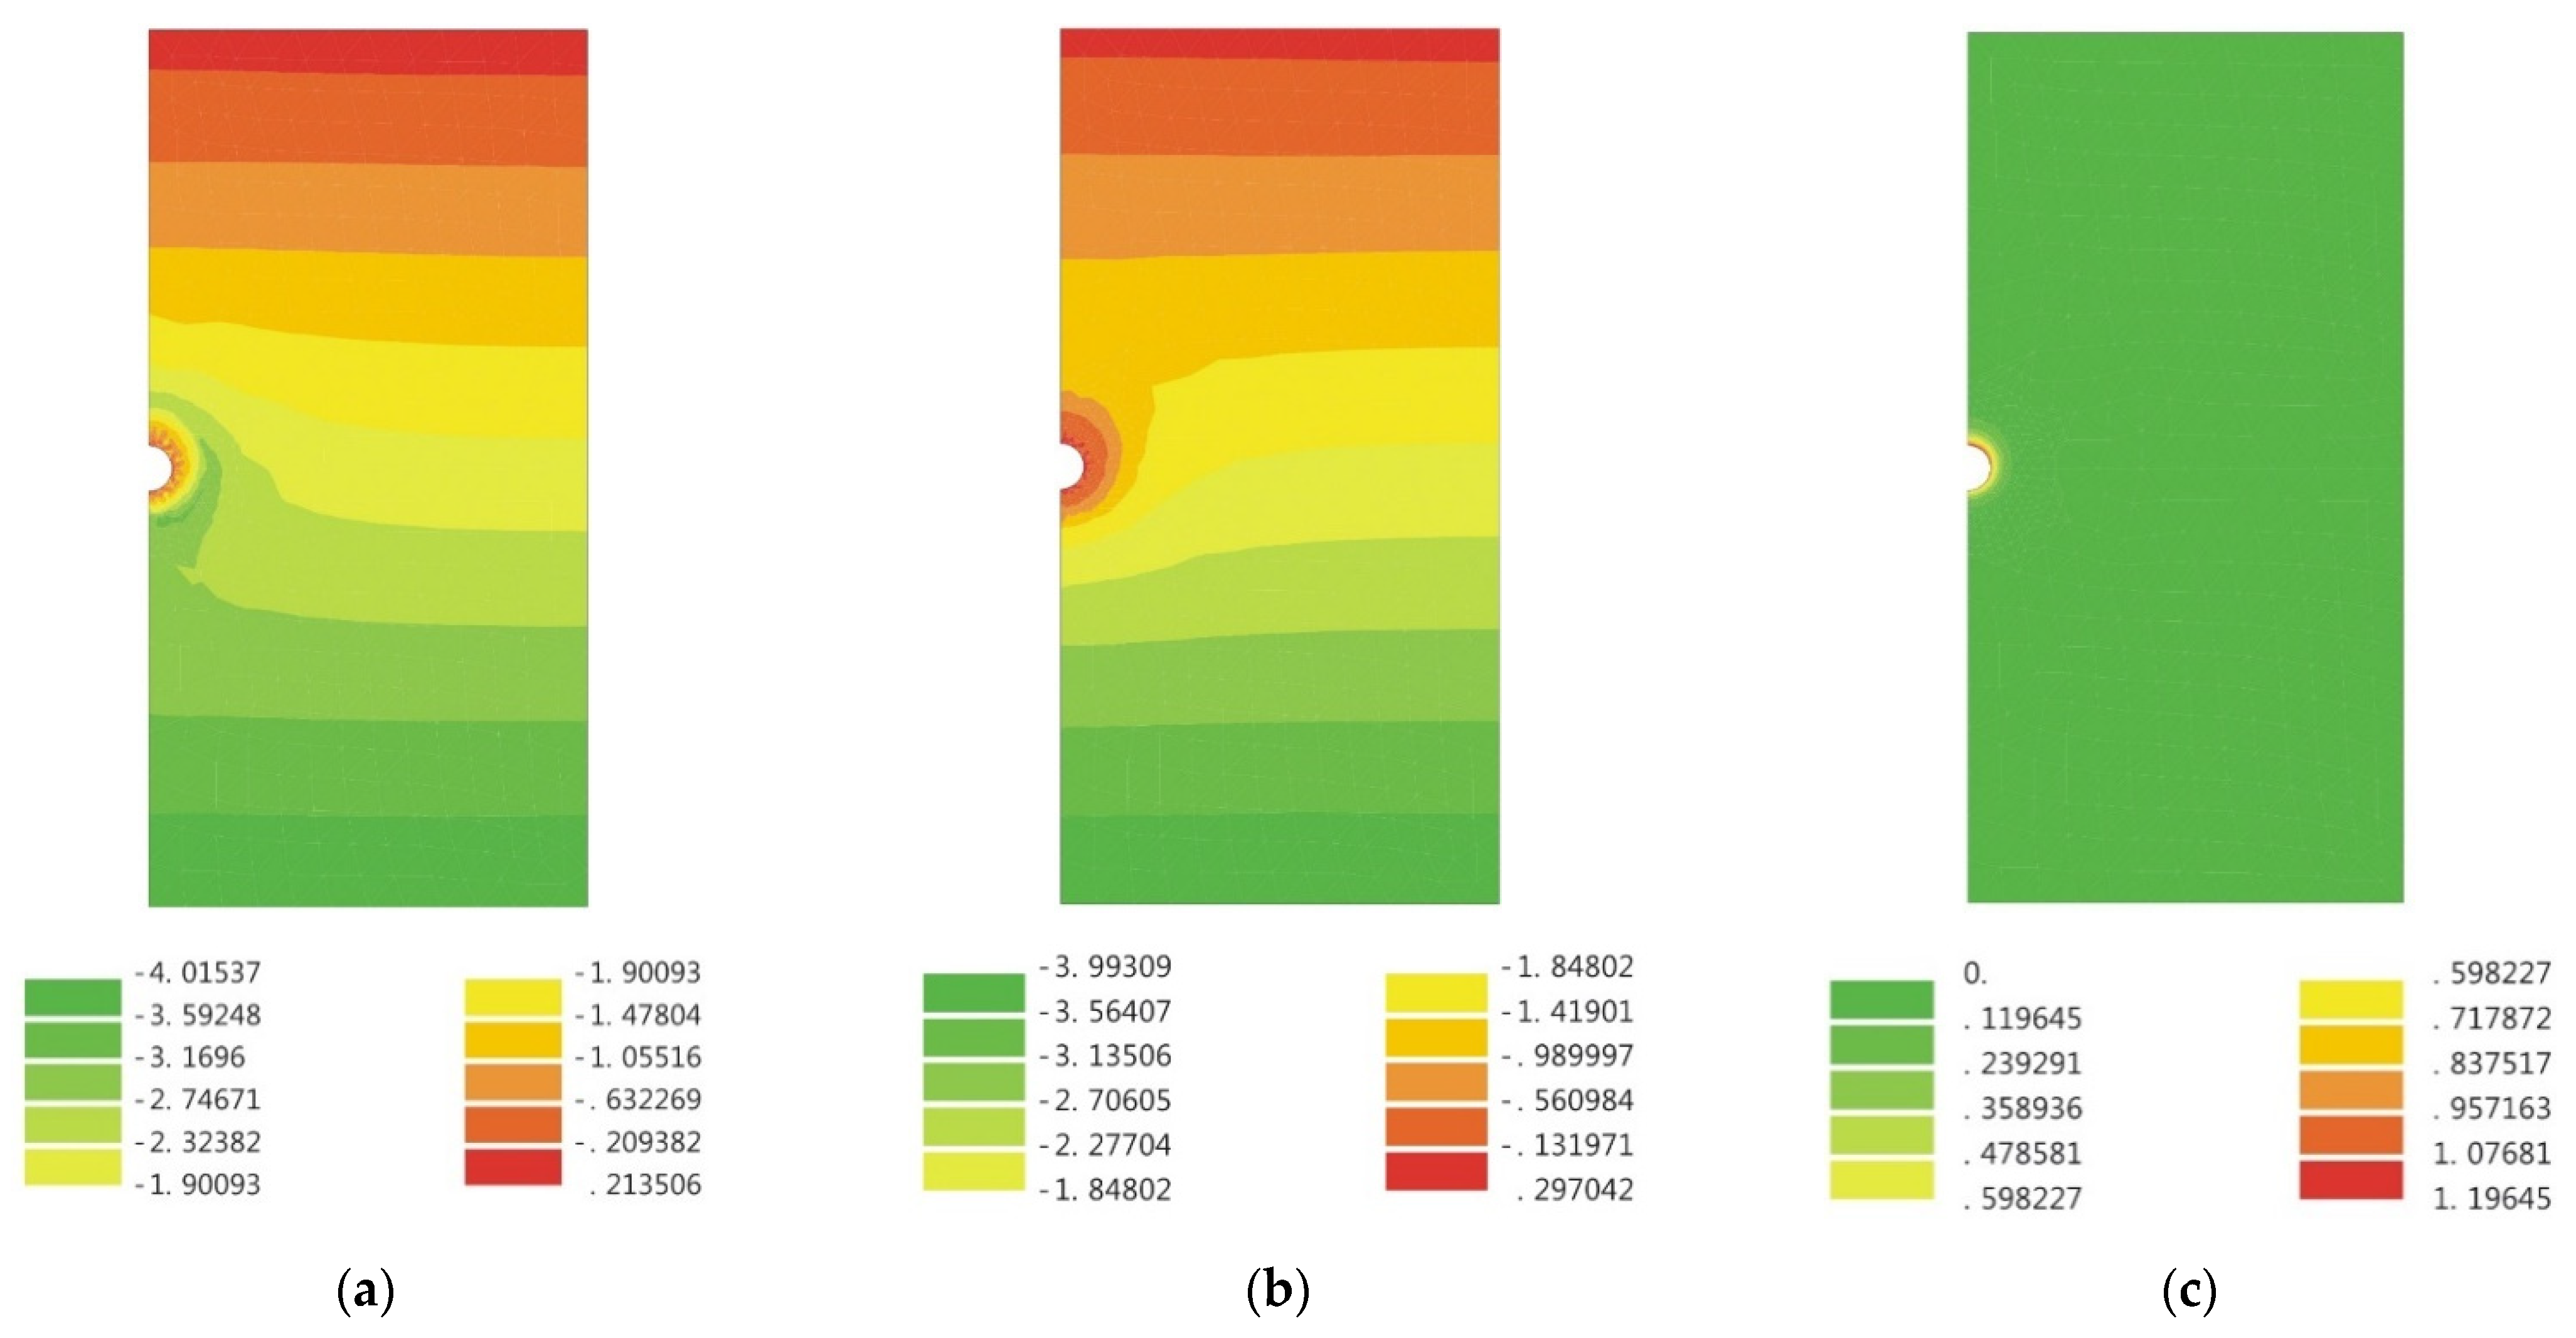
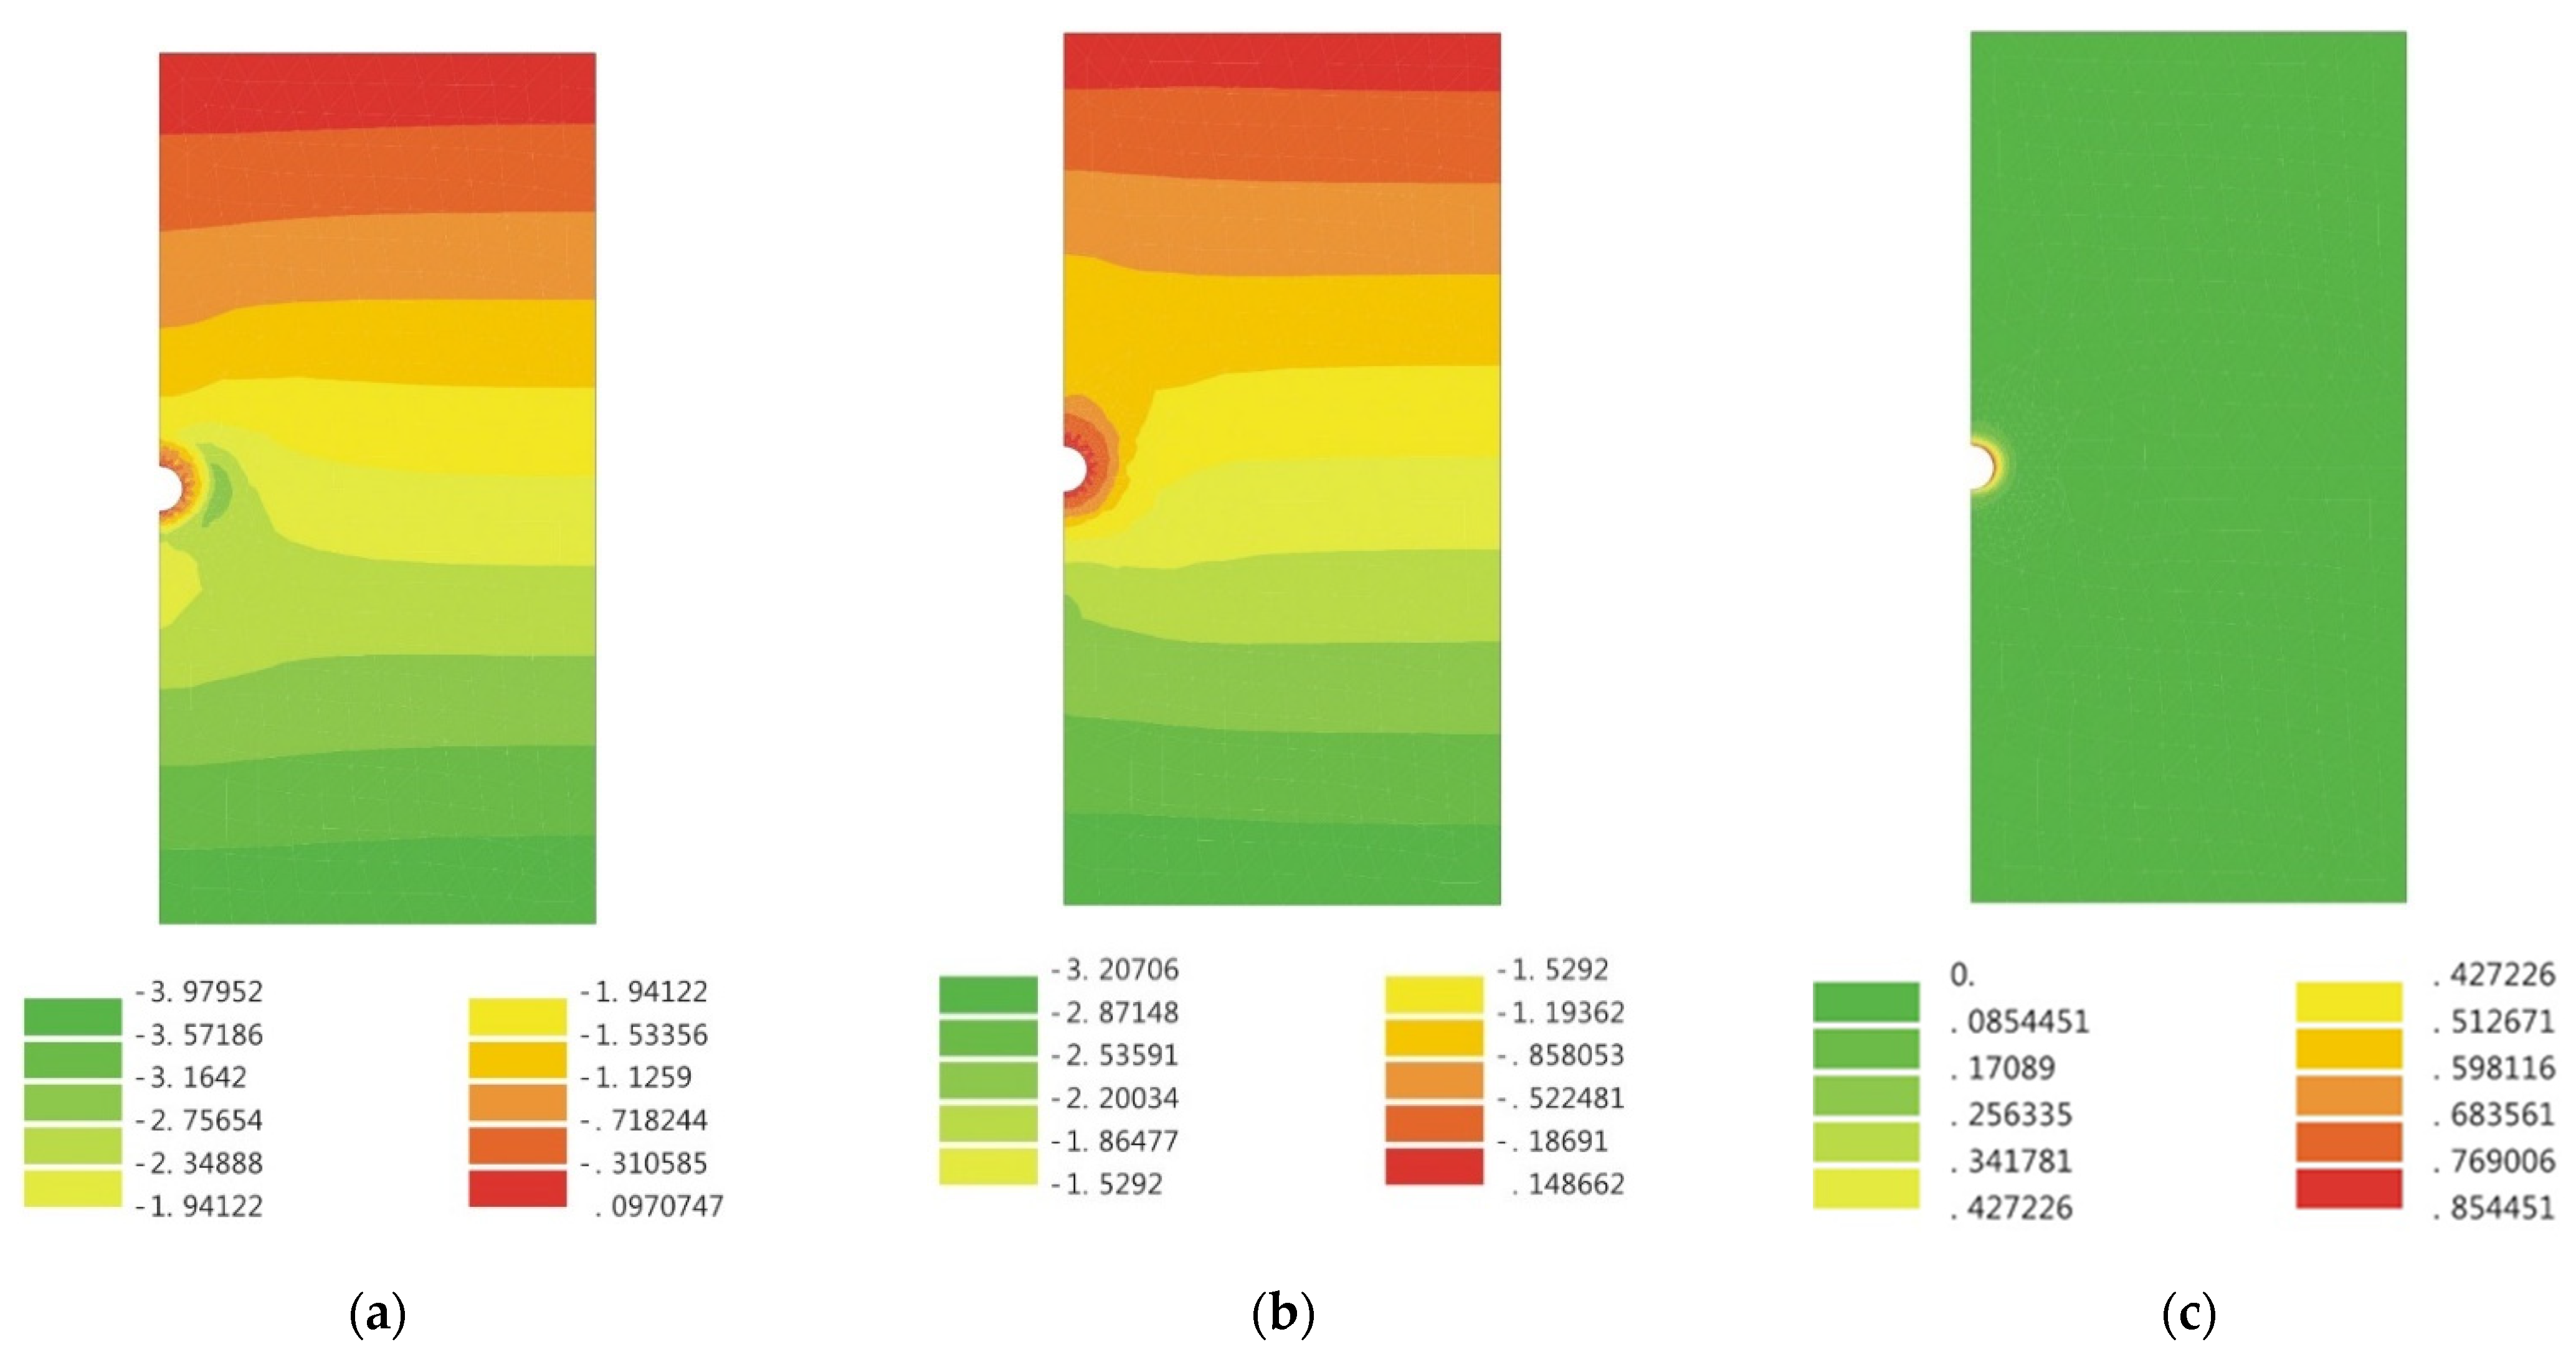
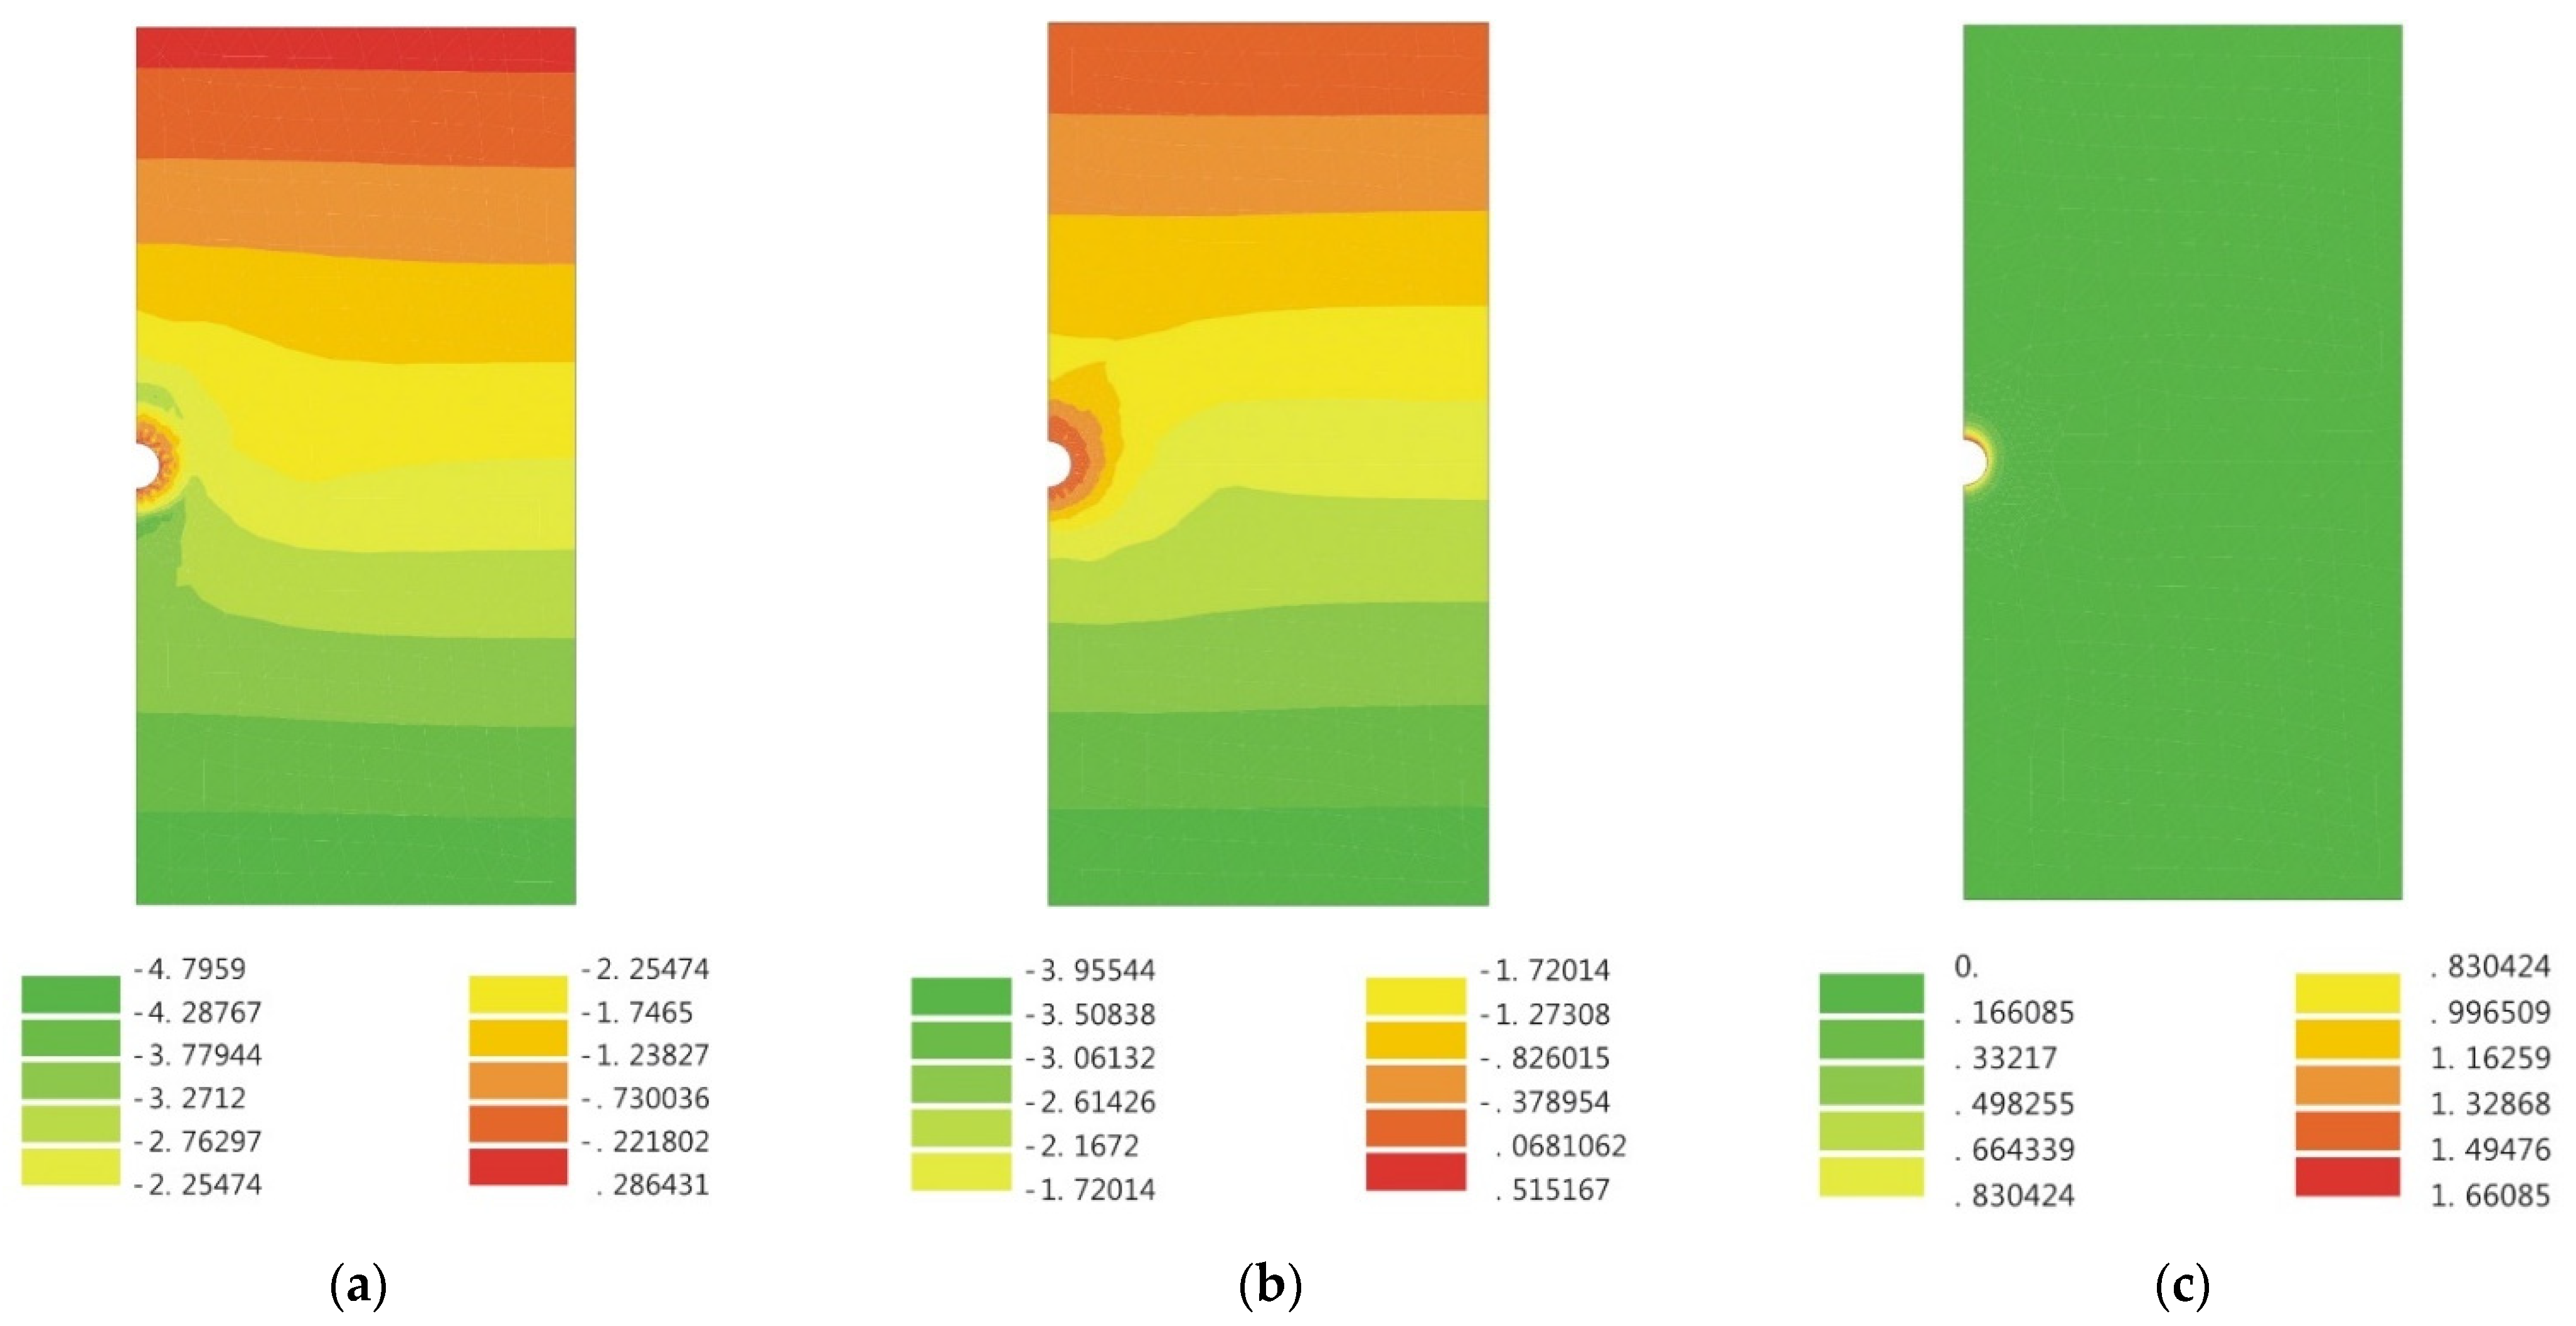
The results of the finite element analysis include the distribution of stress/displacement in the surrounding rock of the tunnel. For example, Figure 7a shows the initial isotropic stress distribution (Ko = 1.0) around the tunnel before it has been excavated. Figure 7b depicts the state of the final stress distribution around the excavation of the tunnel, where it can be observed that the radial stress is zero, while the tangential stress increases at the intrados of the tunnel (in the near field). The principal stress rotates around the proximal region of the tunnel, while the initial isotropic stress remains constant in the far field. Figure 7c describes the distribution of the total displacement moving toward the center of the tunnel. Figure 8 shows the simulation results after tunnel excavation under the initial isotropic stress condition, including the iso-value distribution of major principal stress, minor principal stress, and total displacement. In addition, Figure 9 and Figure 10 show the iso-value contour plots of the simulated results around the excavation of the tunnel under the initial anisotropic stress condition (Ko = 0.8 and 1.2) in the finite element analysis, respectively.

5. Comparison of Results Obtained by EAM and FEM

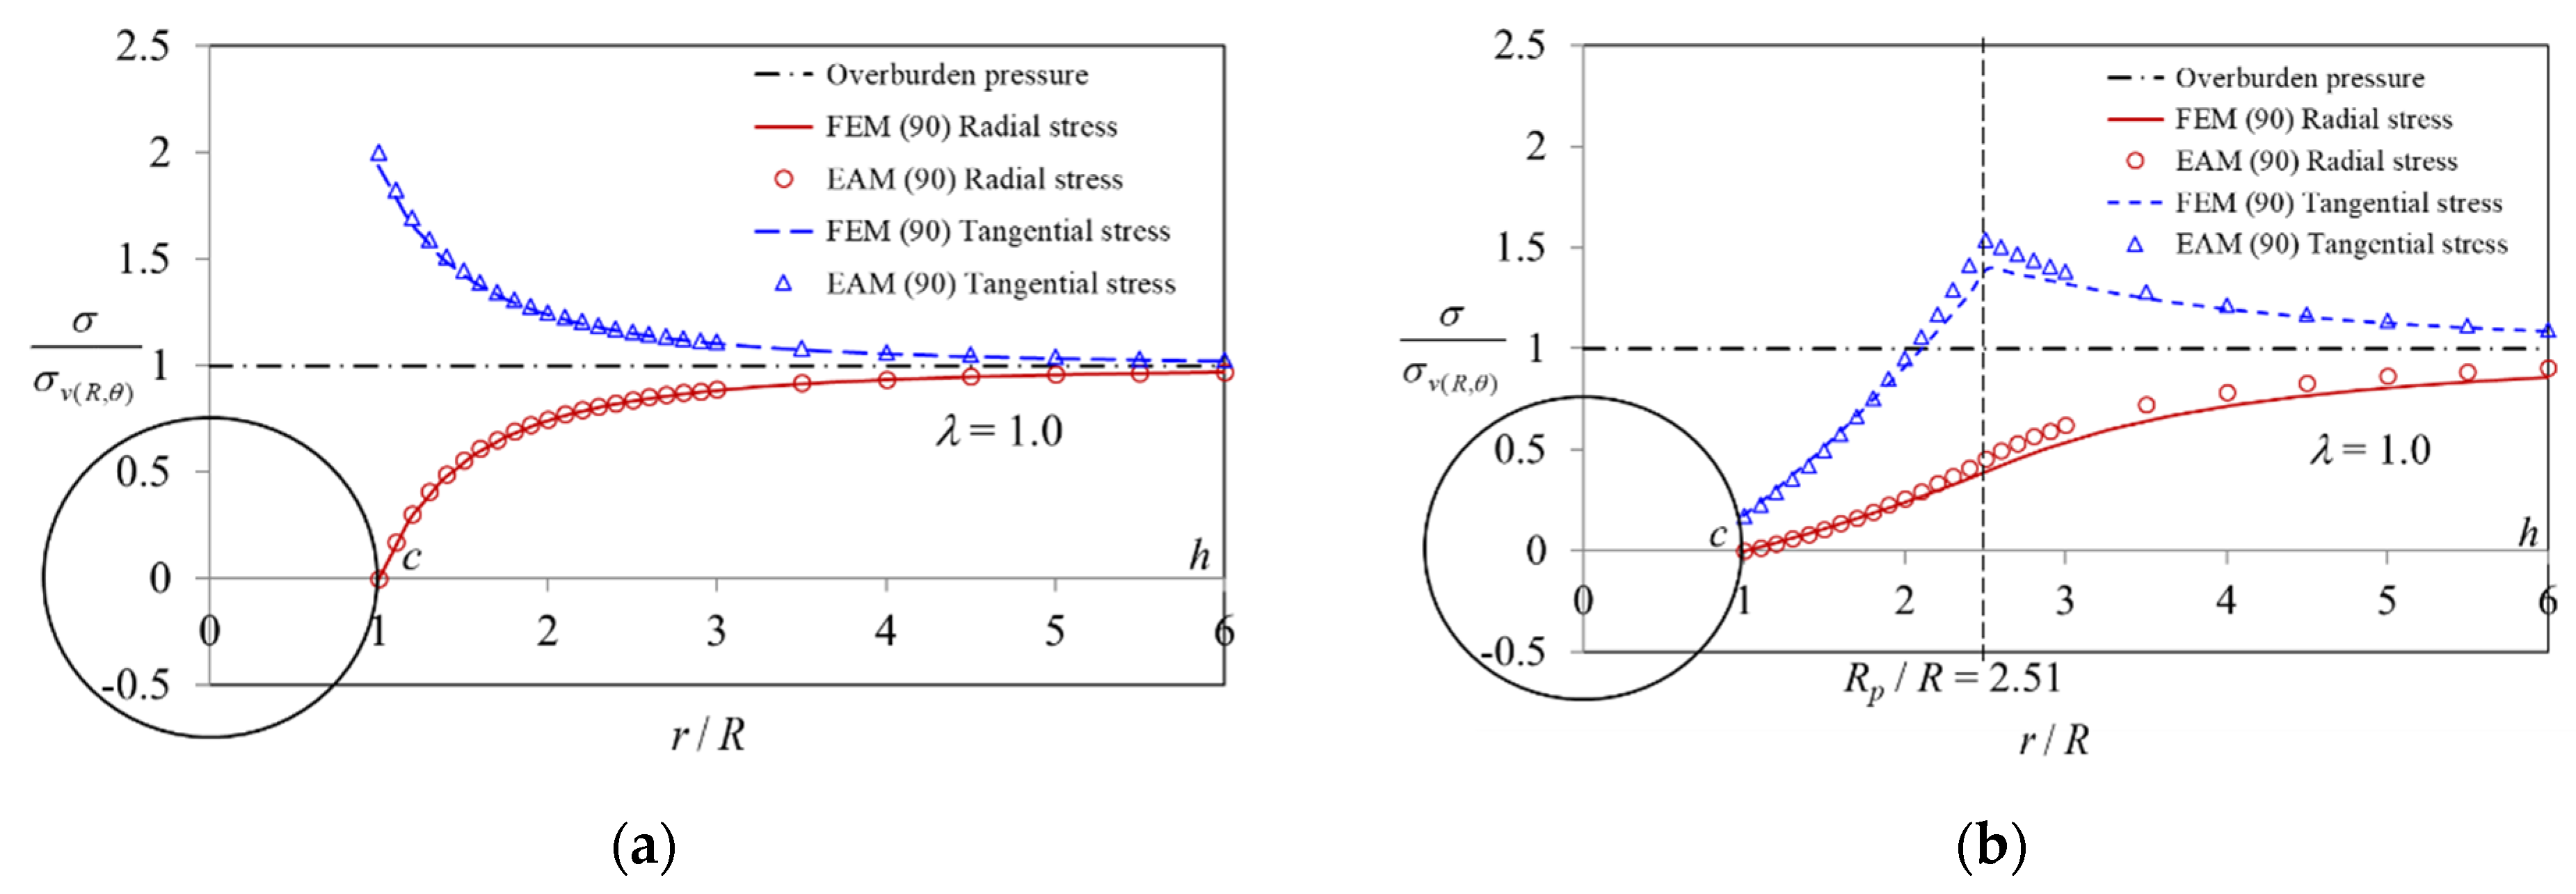
The distribution of stresses/displacements on the cross-section of a circular tunnel excavated in an initial anisotropic stress state (Ko = 0.8 and 1.2) is investigated by the comparison of results obtained by the Explicit Analysis Method (EAM) and the Finite Element Method (FEM). As mentioned above, the assumptions of three different boundary conditions are proposed to consider the influence of the overburden depth on the initial stress. To verify the change in surrounding stress caused by tunnel excavation, for example, in Case II (the spring line position, θ = 90°, a distance r along the horizontal line ch, and the initial stress that equals to γ (h + R)), five stress states can be used to describe it as follows:
(1)
When the location is far from the tunnel (λ = 0 and r ), the stresses satisfy the initial anisotropic stress condition (such as the stresses along the ch line in Figure 11 and Figure 12);
(2)
When the stresses are in the elastic region (0 < λ < λe, Rp < r < ∞), as the value of the confinement loss increases, the radial stress gradually decreases (Figure 11a), while the tangential stress (Figure 11b) and the radial displacement (Figure 11c) increase gradually. In addition, it can be observed that both stresses are distributed along the horizontal axis r/R and separated in a symmetrical shape (Figure 11d);
(3)
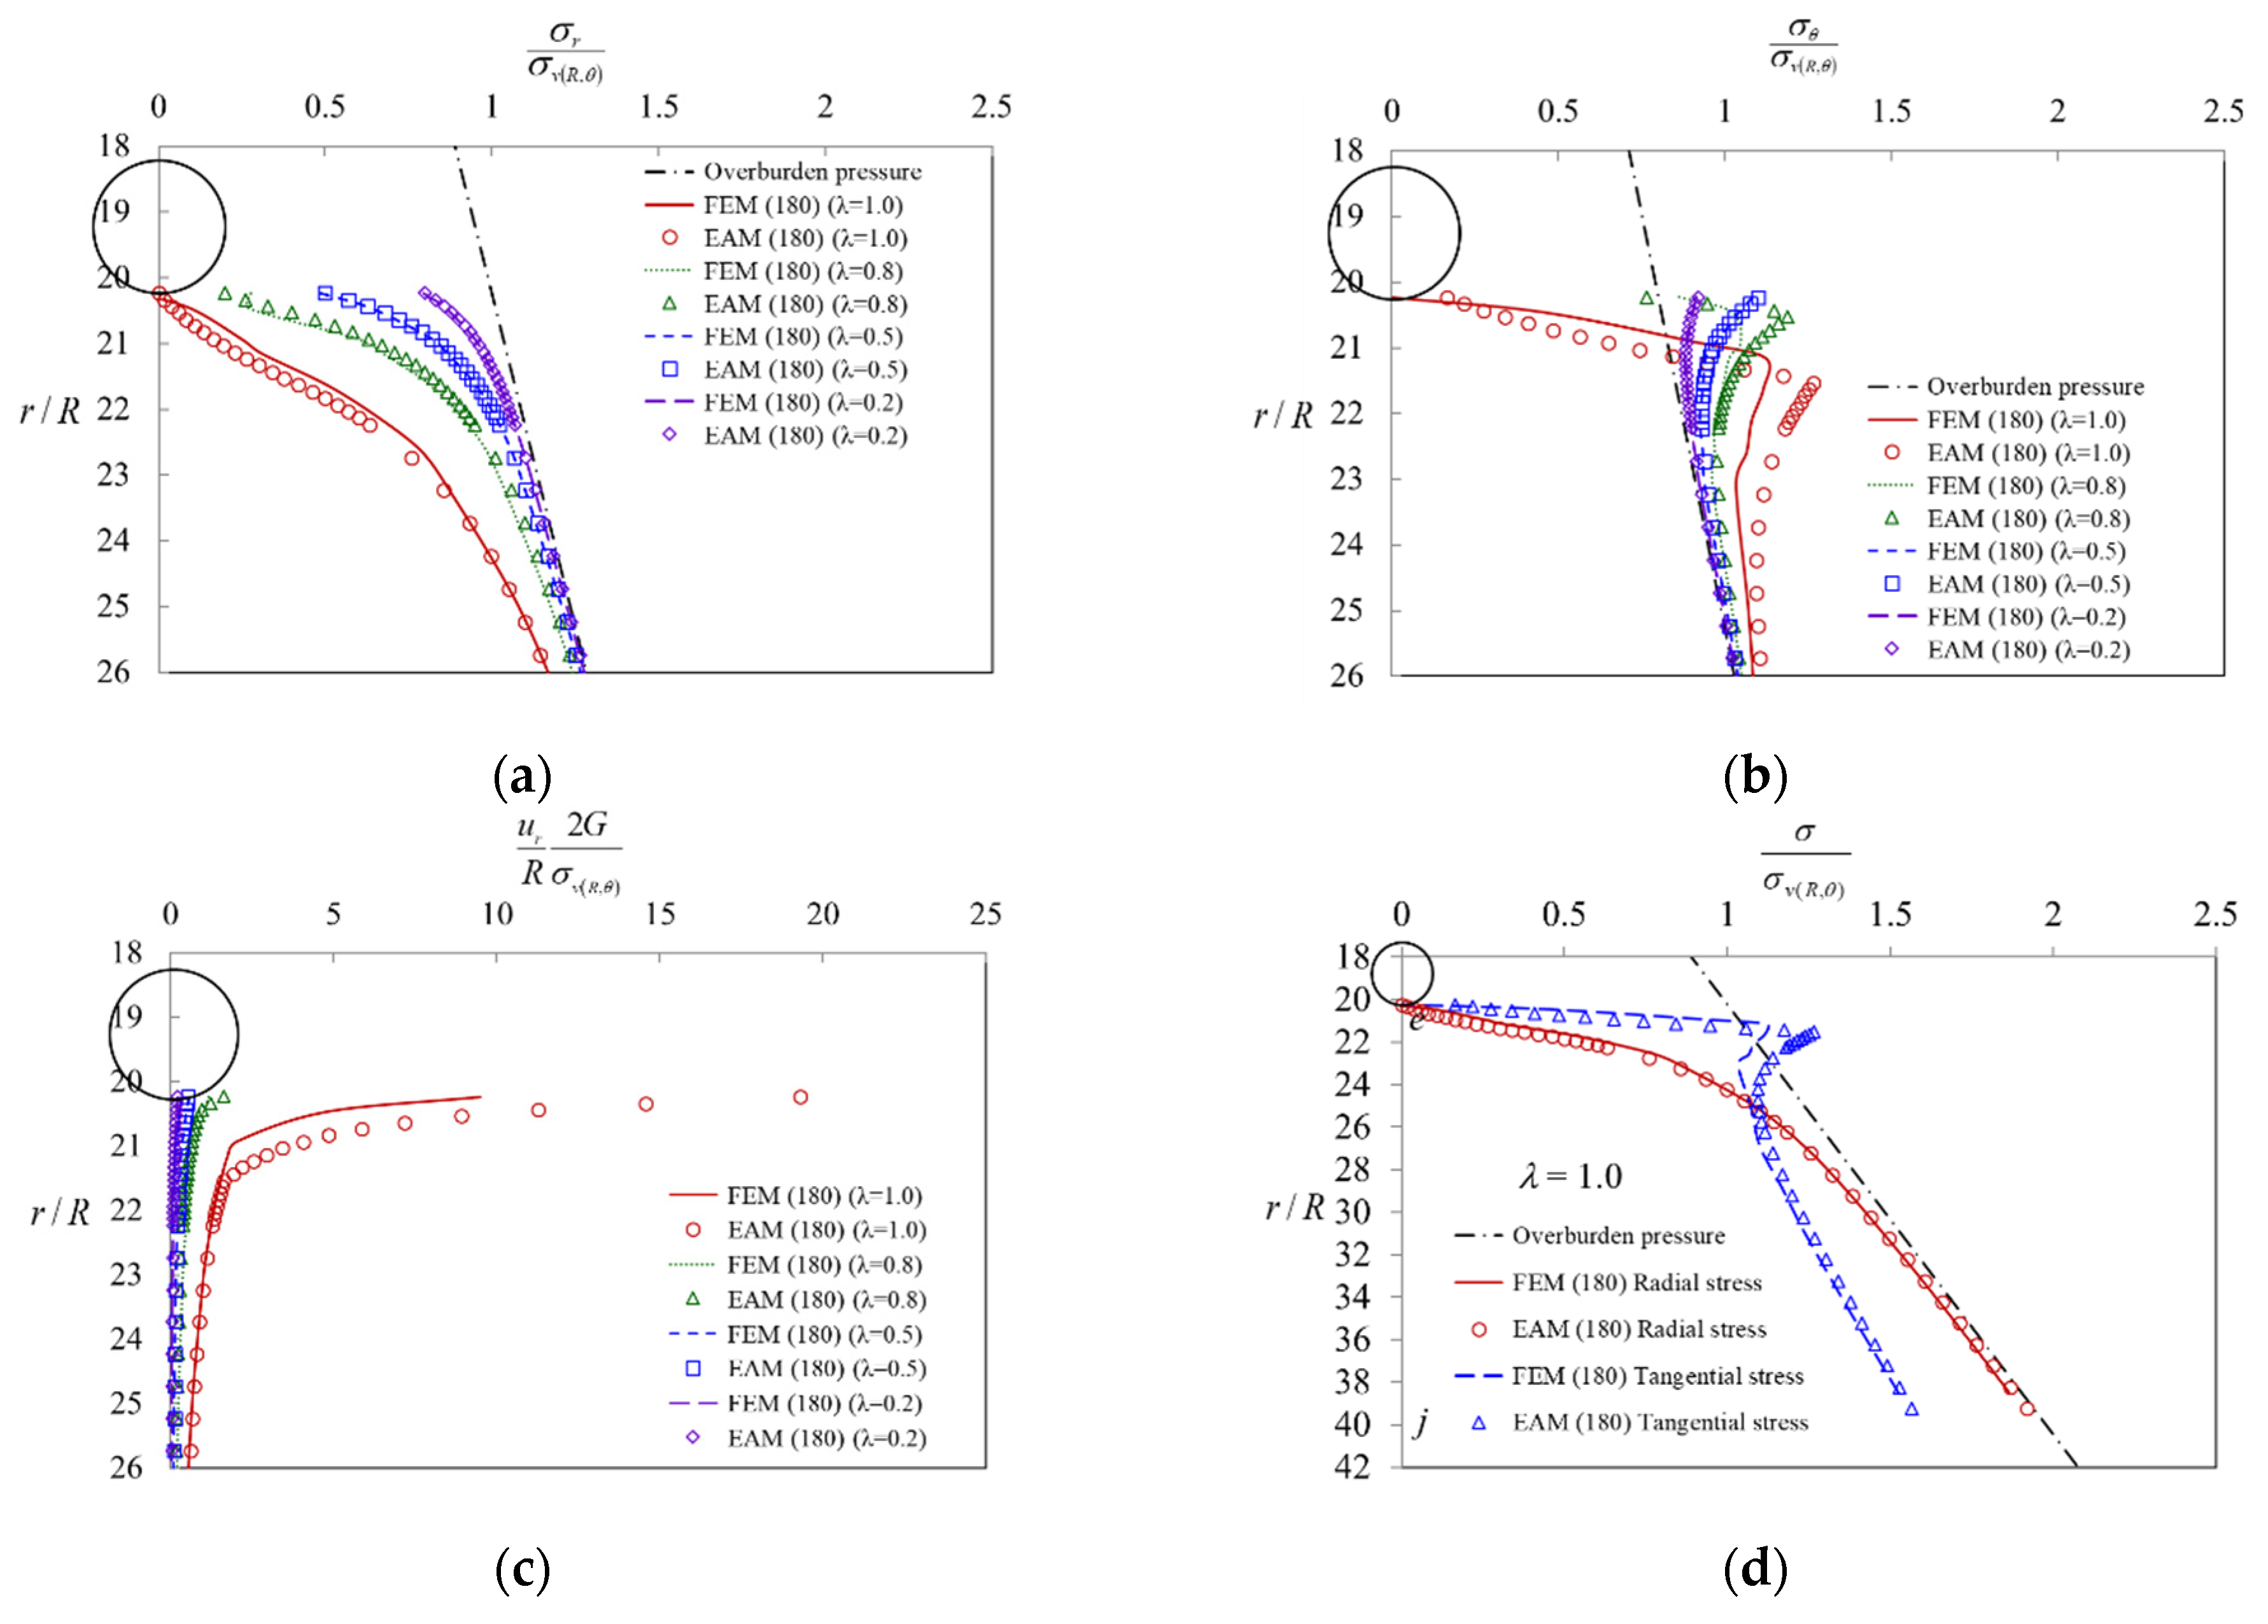
When it occurs on the interface between elastic and plastic regions (λ = λe, and r = Rp = 2.49R), the stress state shows that the radial stress begins to change the curvature (Figure 12a), and the tangential stress reaches the maximum value (Figure 12b,d);
(4)
When the stresses are in the plastic region (λe < λ < 1, R < r < Rp), as the value of the confinement loss continues to increase, both the radial stress and the tangential stress decrease sharply (Figure 12d);
(5)
When it is located at the intrados of the tunnel (λ = 1.0, r = R) as the tangential stress is just equal to the uniaxial compressive strength (UCS) of the ground, the radial stress is completely released to zero (Figure 12d).
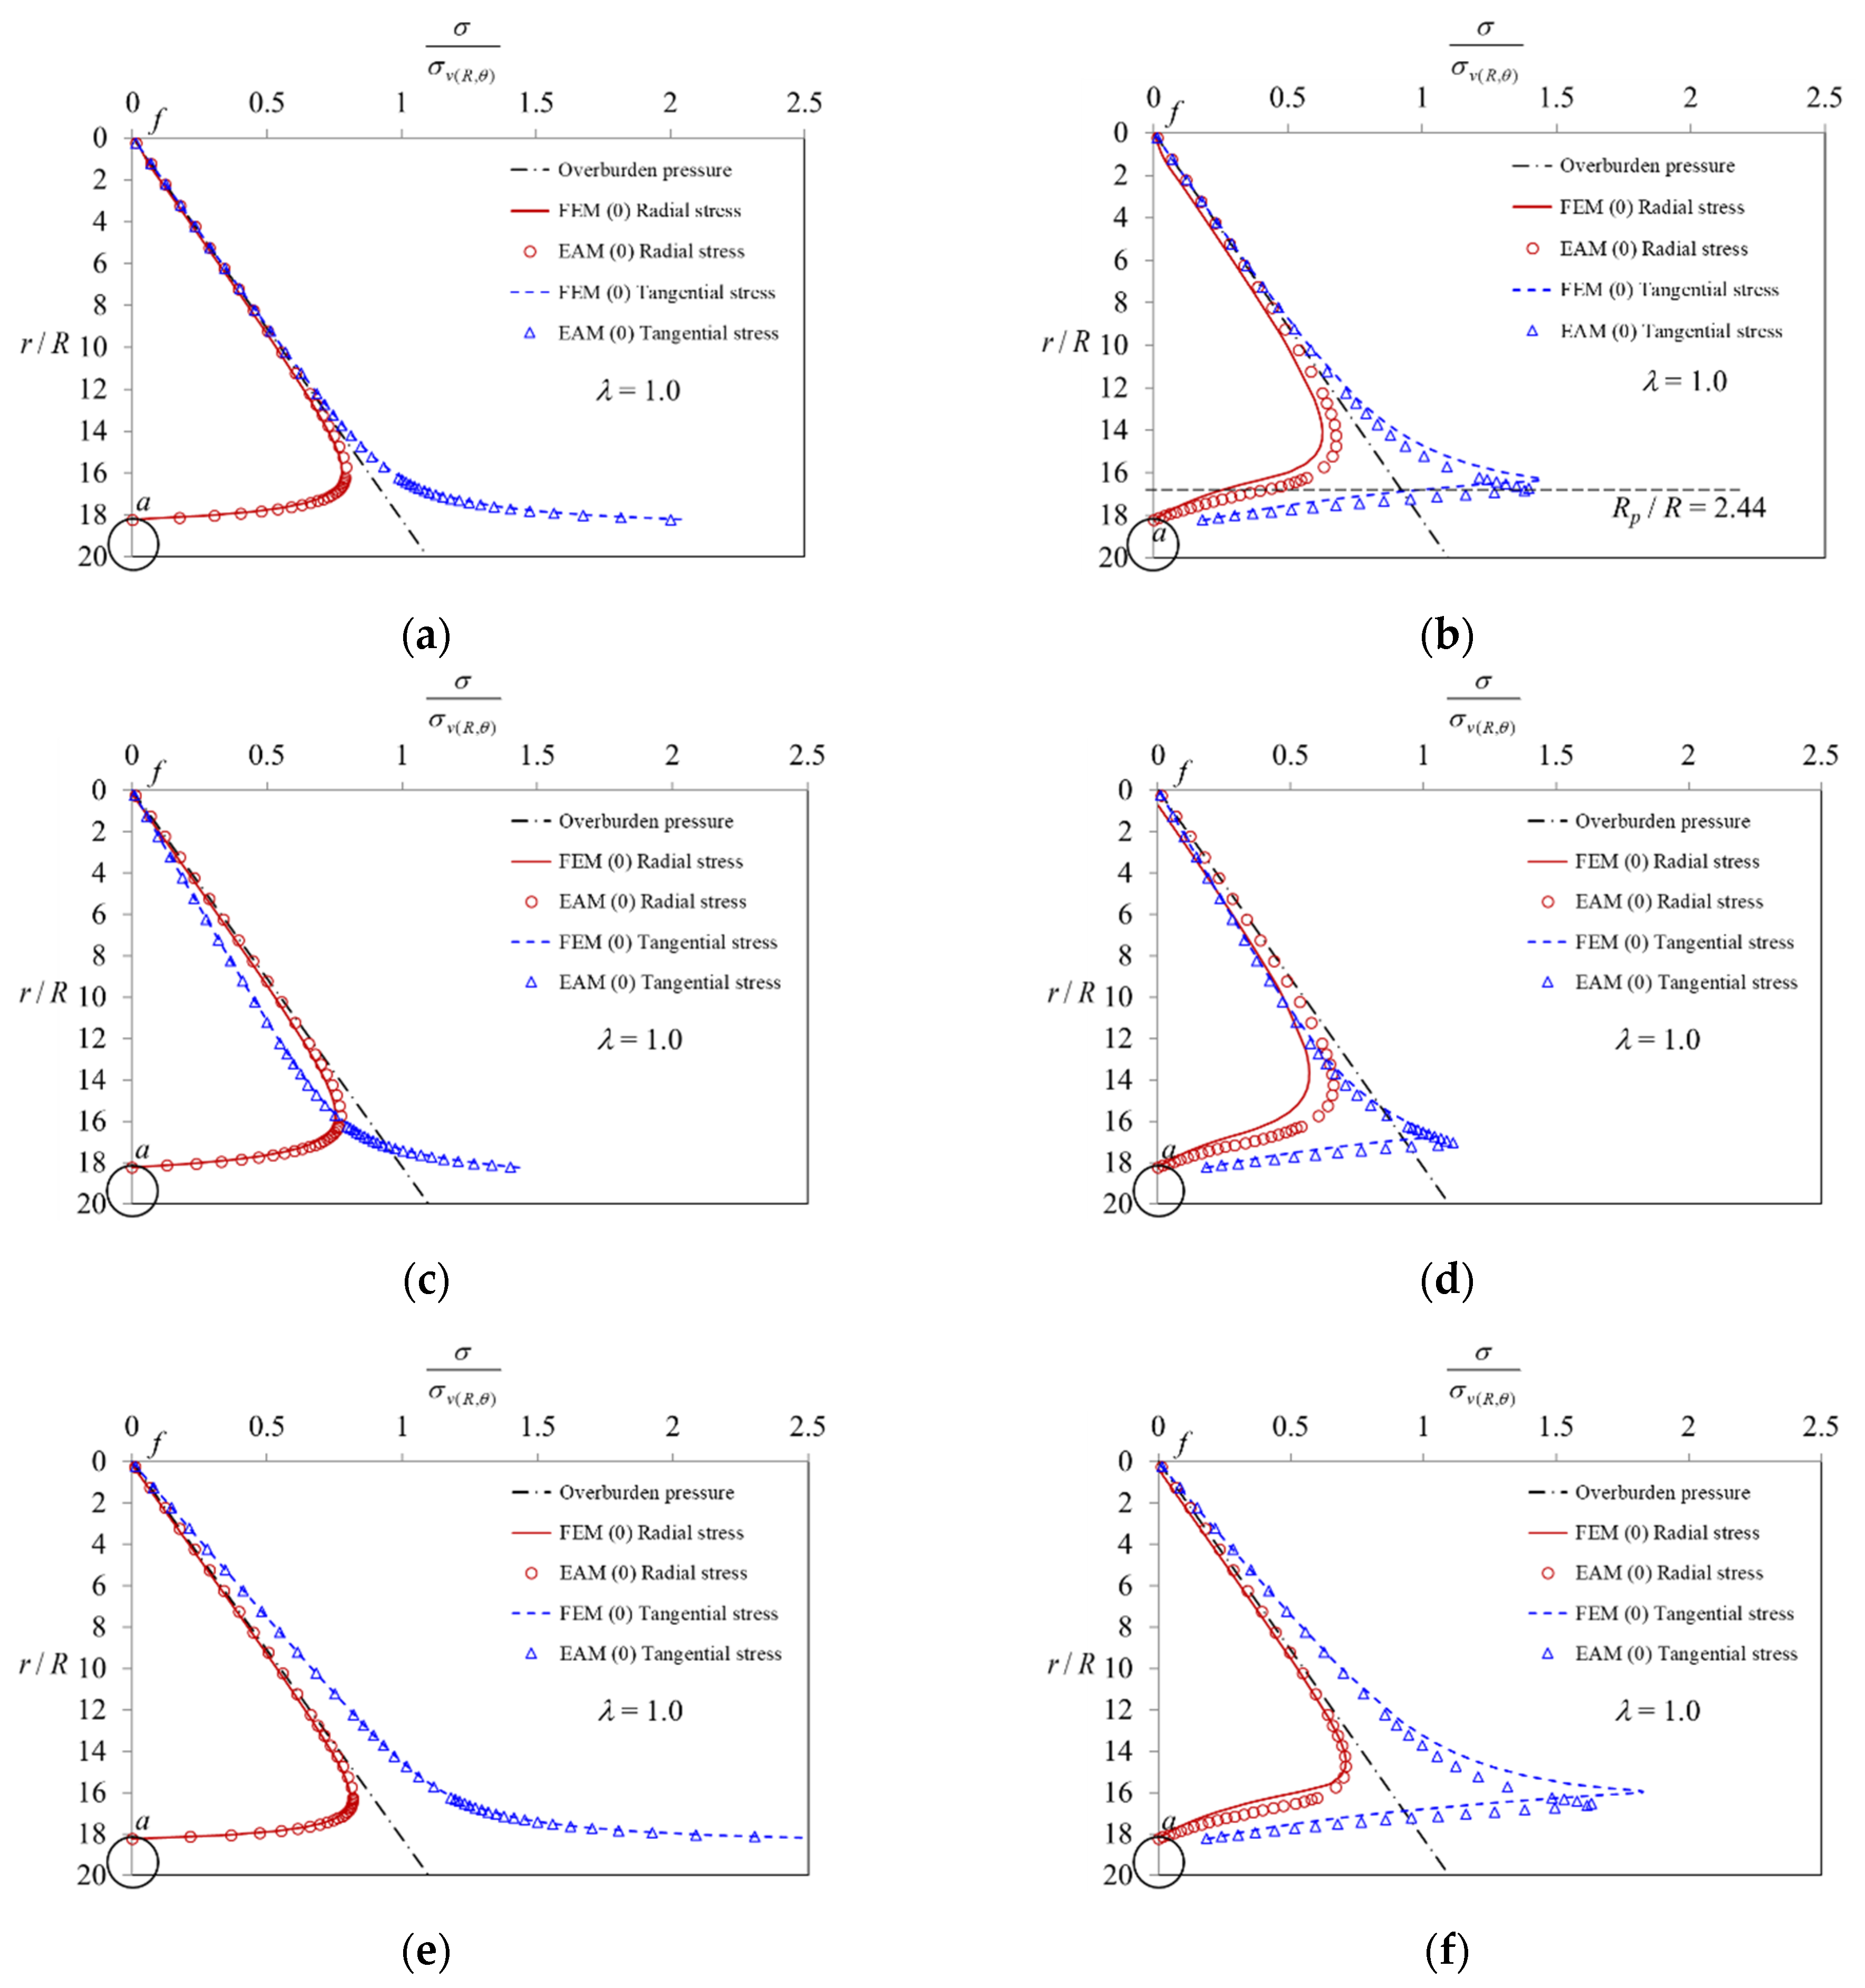
In this case (Case II), the comparison of the results obtained by EAM and FEM shows that Figure 13a,b represent the tangential and radial stress distributions of elastic media and elastoplastic media under isotropic stress conditions, respectively. In addition, the same results obtained under the anisotropic stress condition (Ko = 0.8 and 1.2) in the elastic media and the elastoplastic media are shown in Figure 13. It can be observed that the stress/displacement distribution along the tunnel spring line is not affected by the overburden depth, whether under isotropic (Ko = 1.0) or anisotropic (Ko = 0.8 and 1.2) stress conditions. This analysis result is consistent with that obtained after the original assumption of the CCM. However, this is not the case for Case I and Case III, which are affected by the overburden depth.
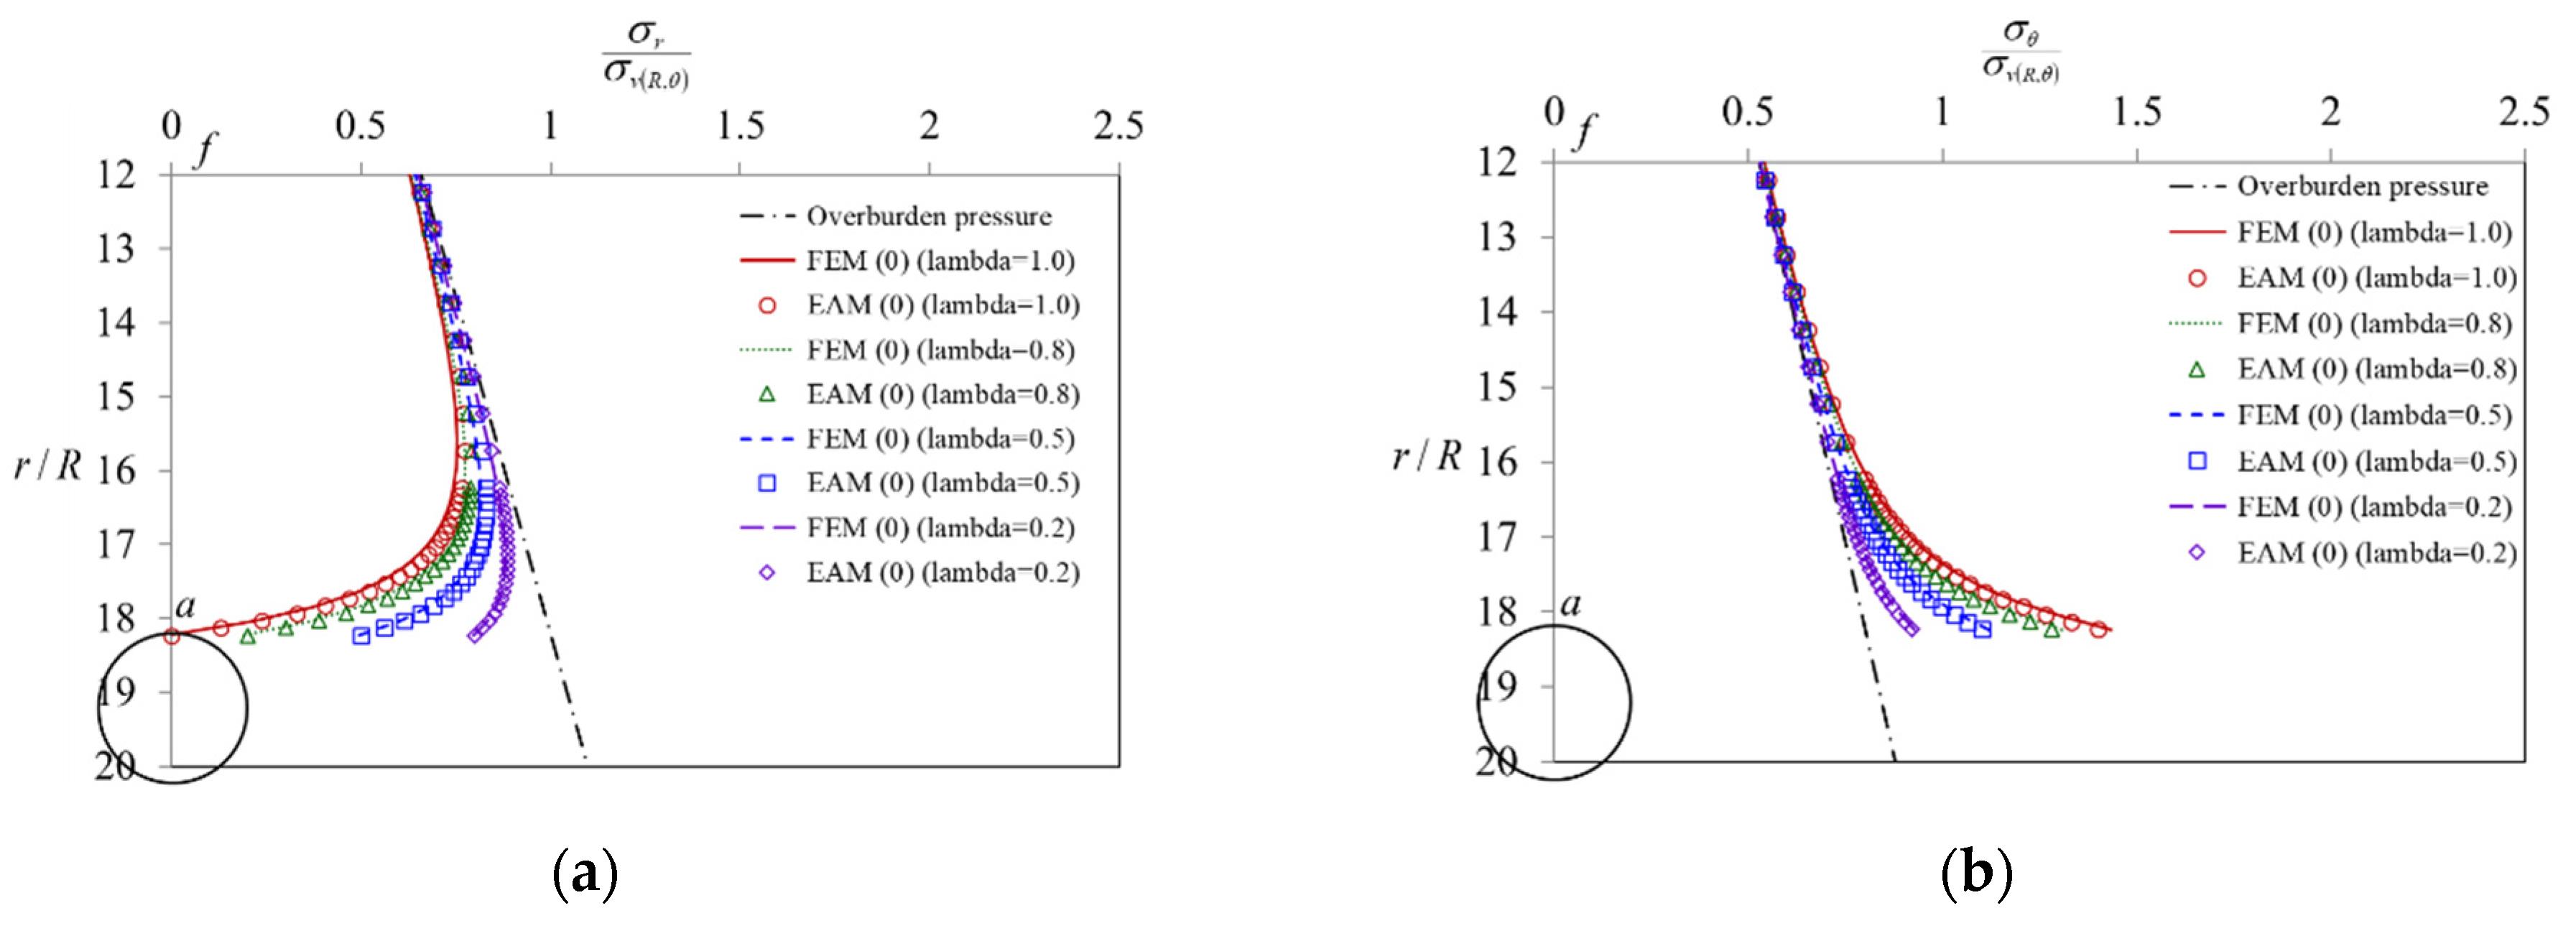
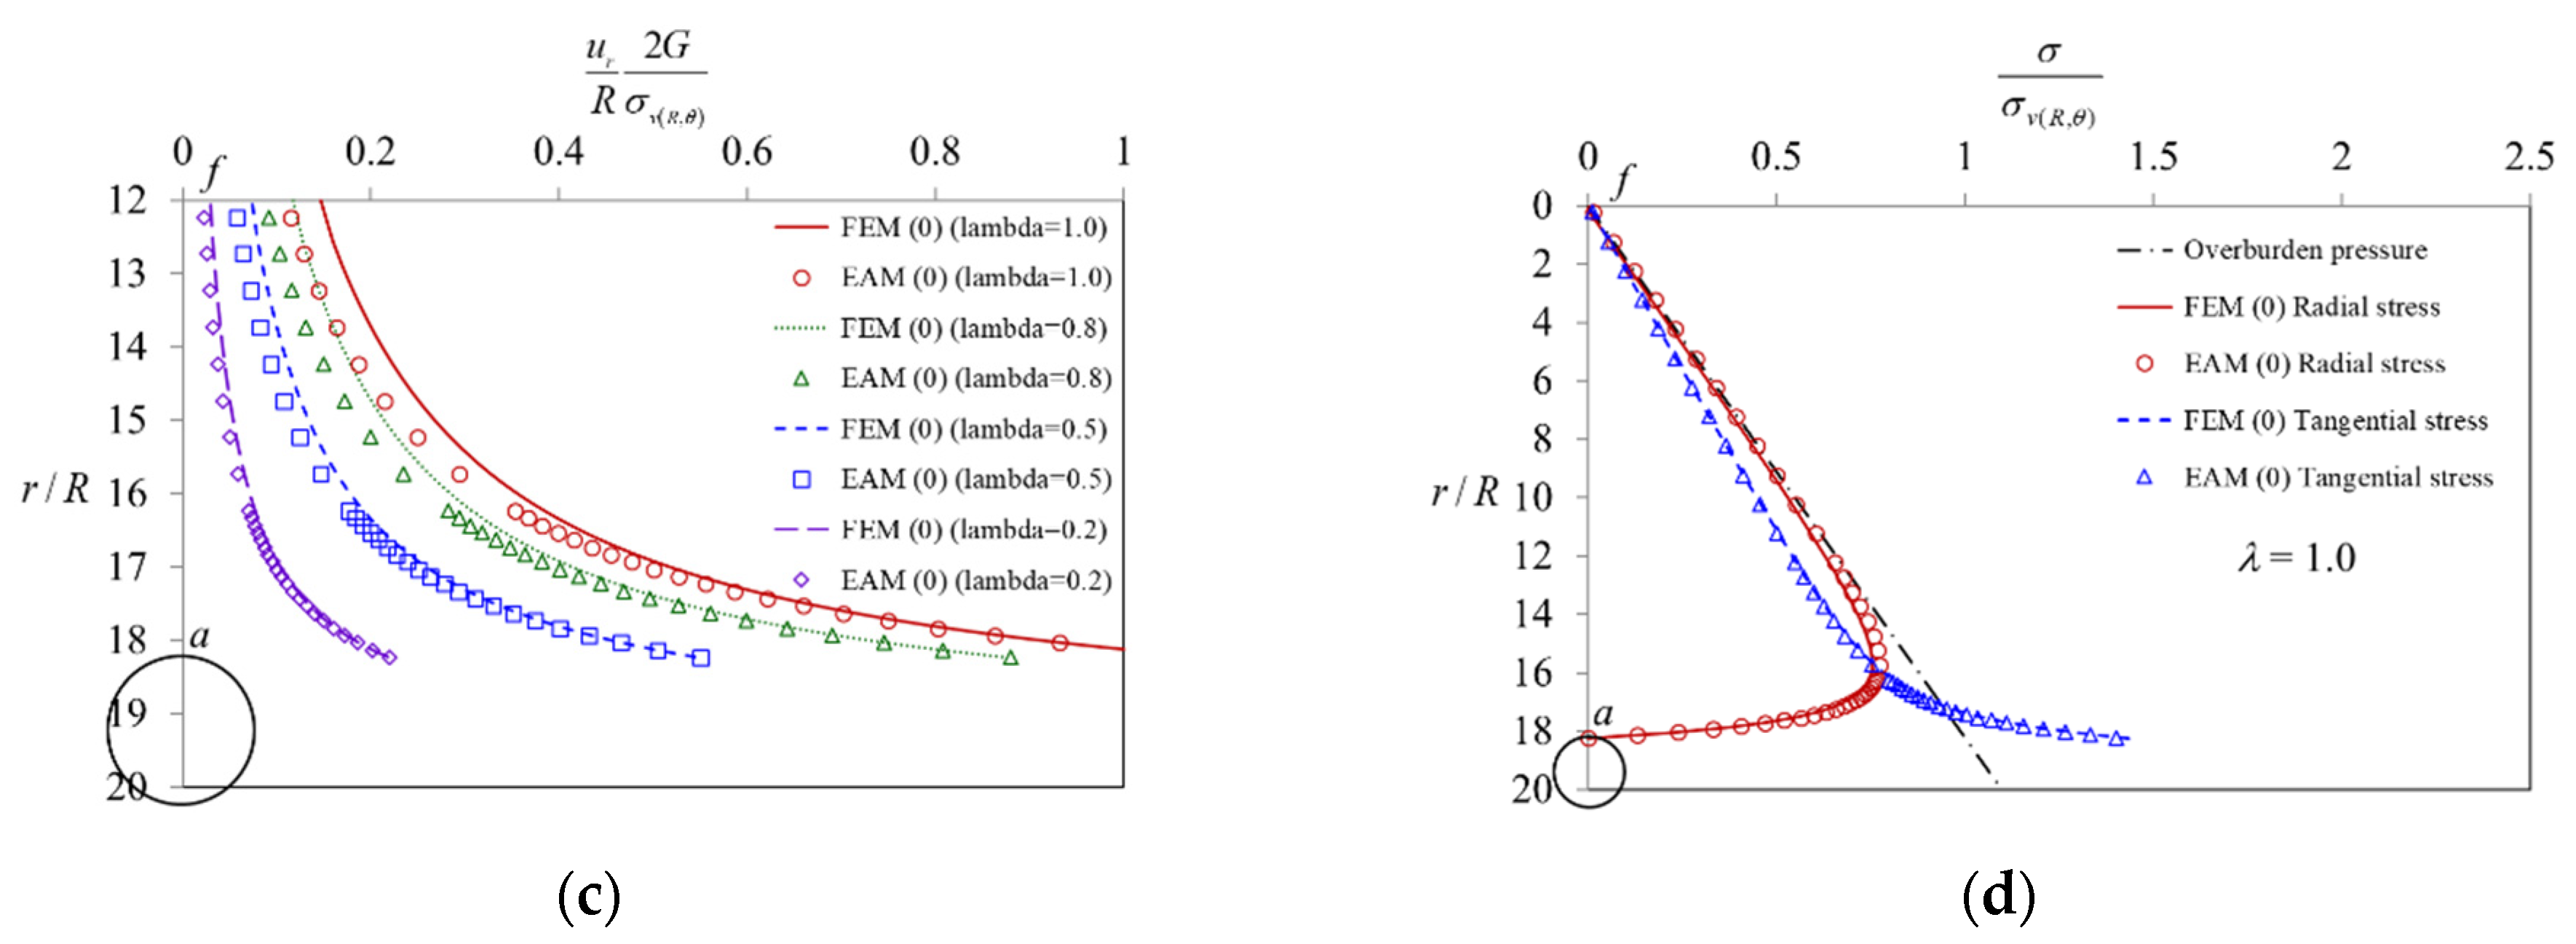
Under the anisotropic stress condition (Ko = 0.8), the study of Case I (the area above the spring line, 0° < θ < 90°) supposes that the observation is along the ground surface line while a distance r is along the vertical line af and the initial stress equals zero, σo = r · y = 0. Figure 14 and Figure 15, respectively, show the analysis results in the elastic region and in the elastoplastic region. From each figure, it can be observed that the stress/displacement distribution around the tunnel is especially concentrated along the overburden pressure line, and two stresses separate symmetrically along this line (dotted line in the Figures).
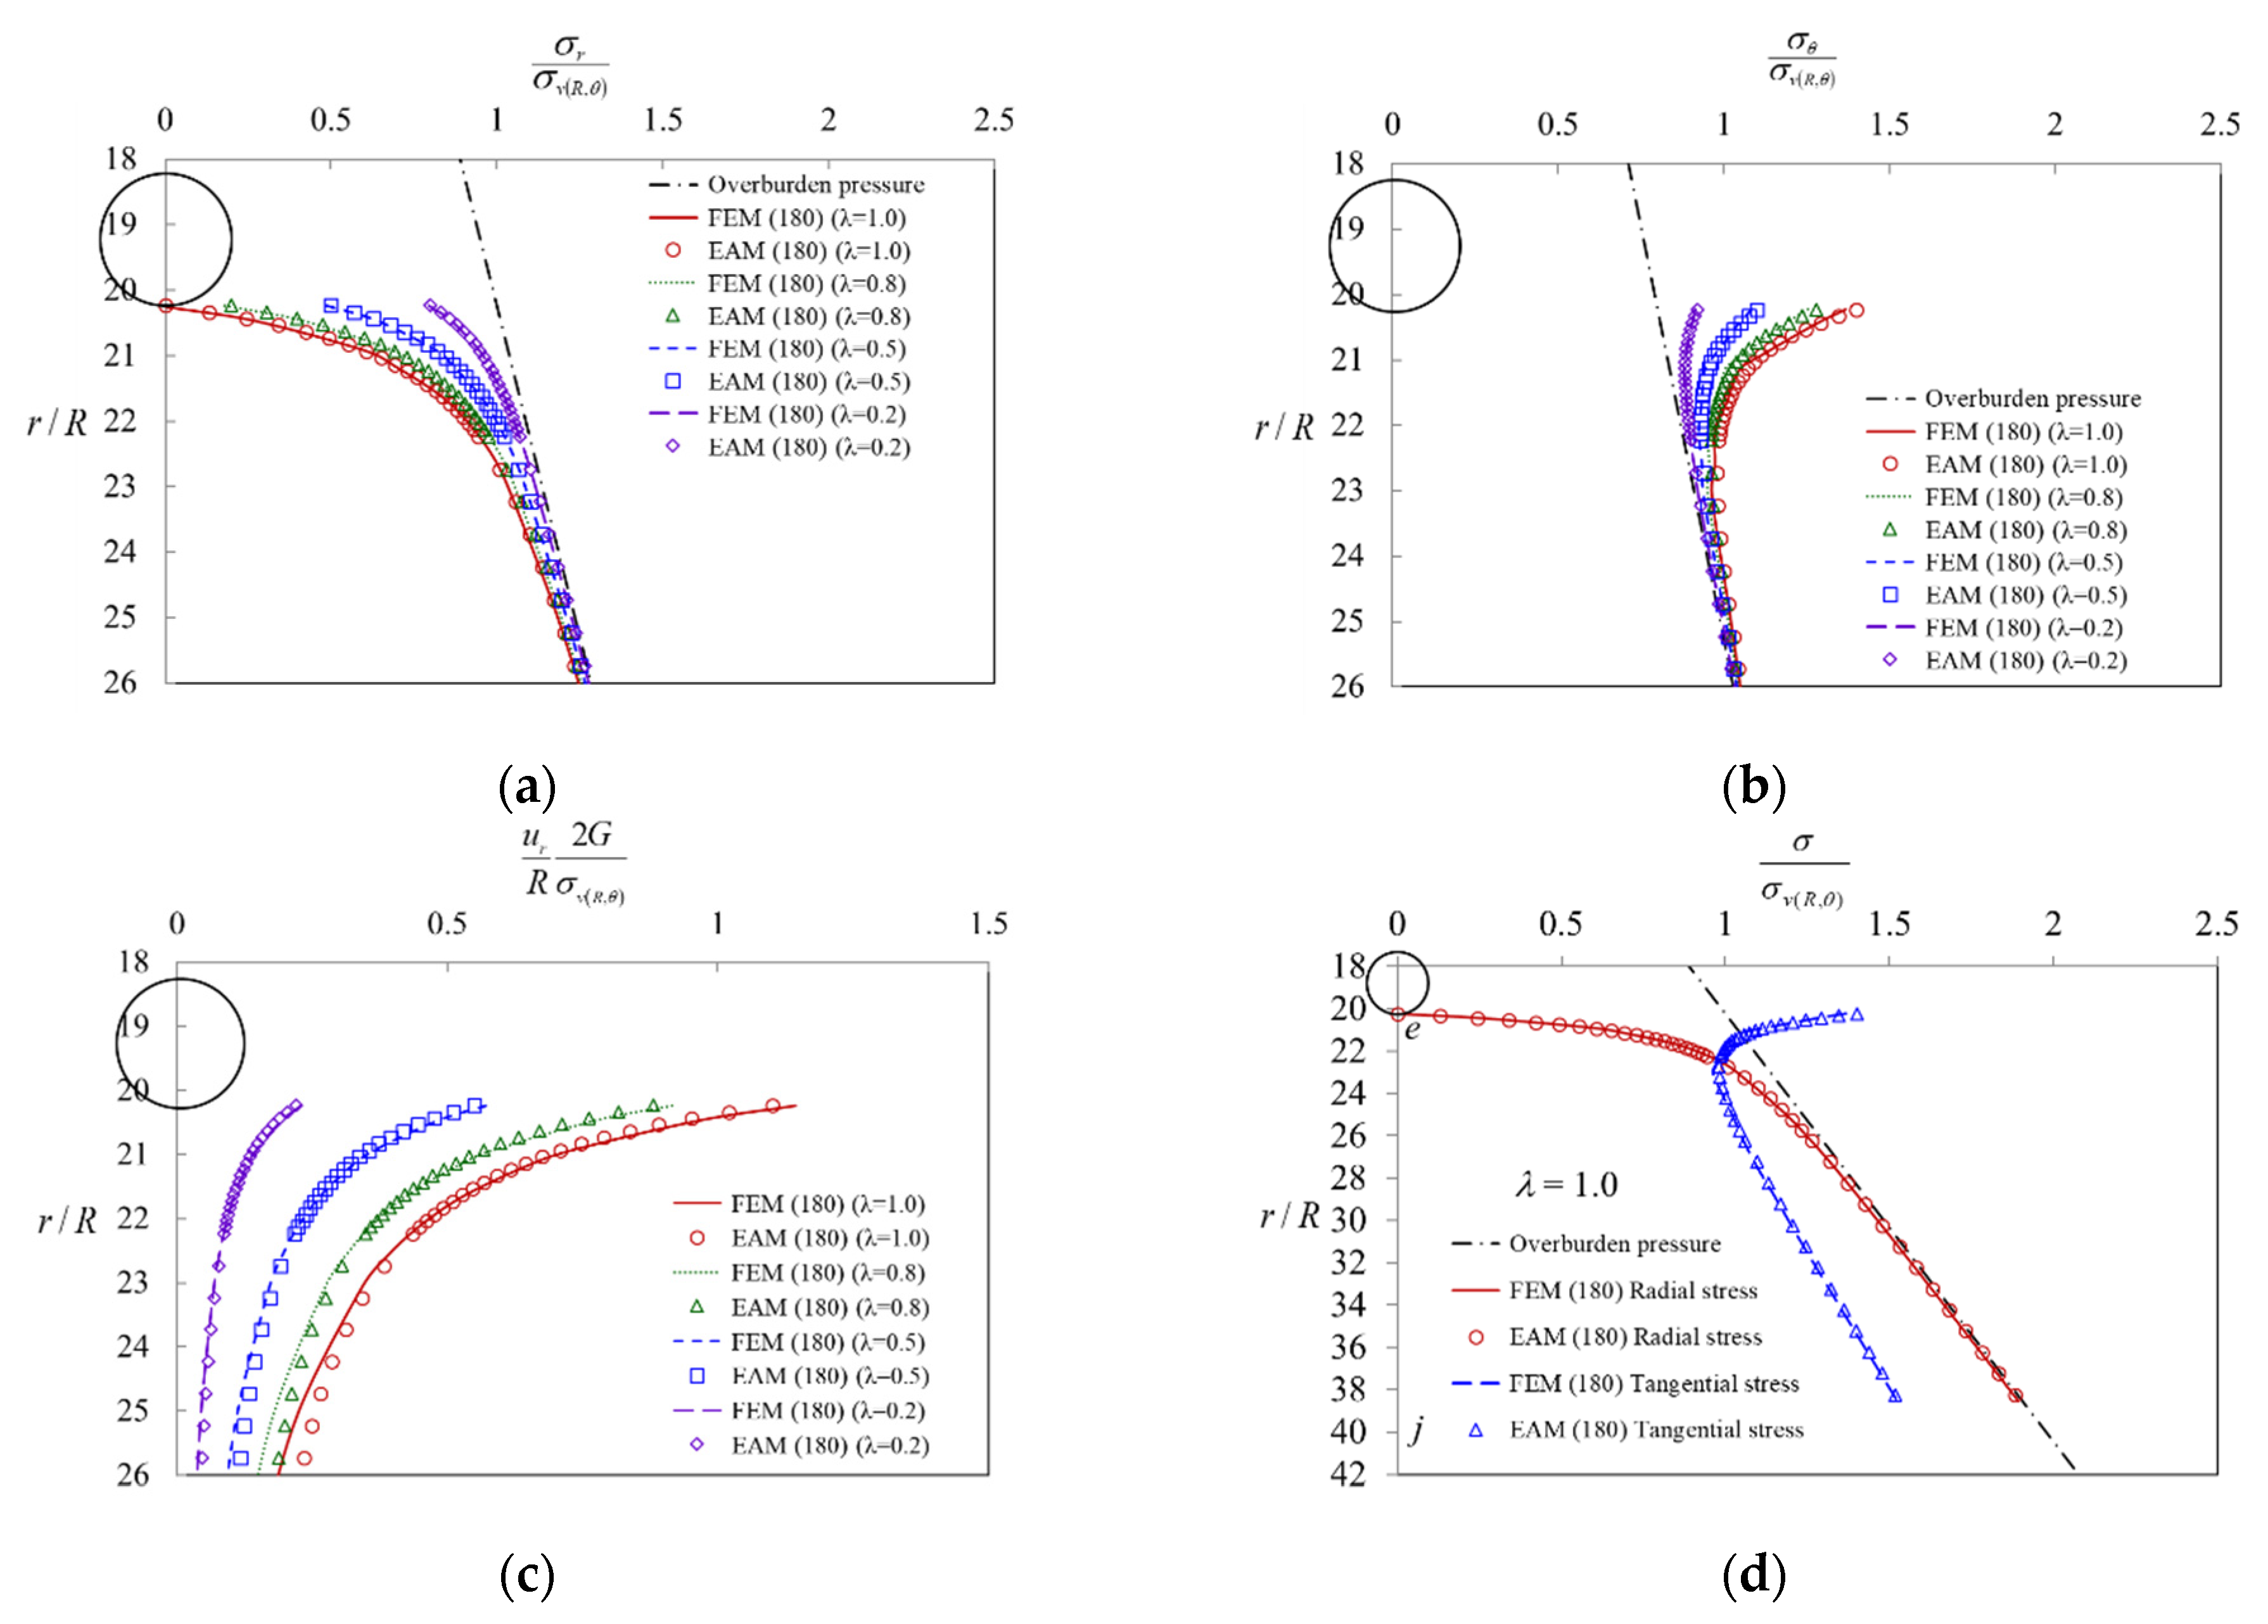
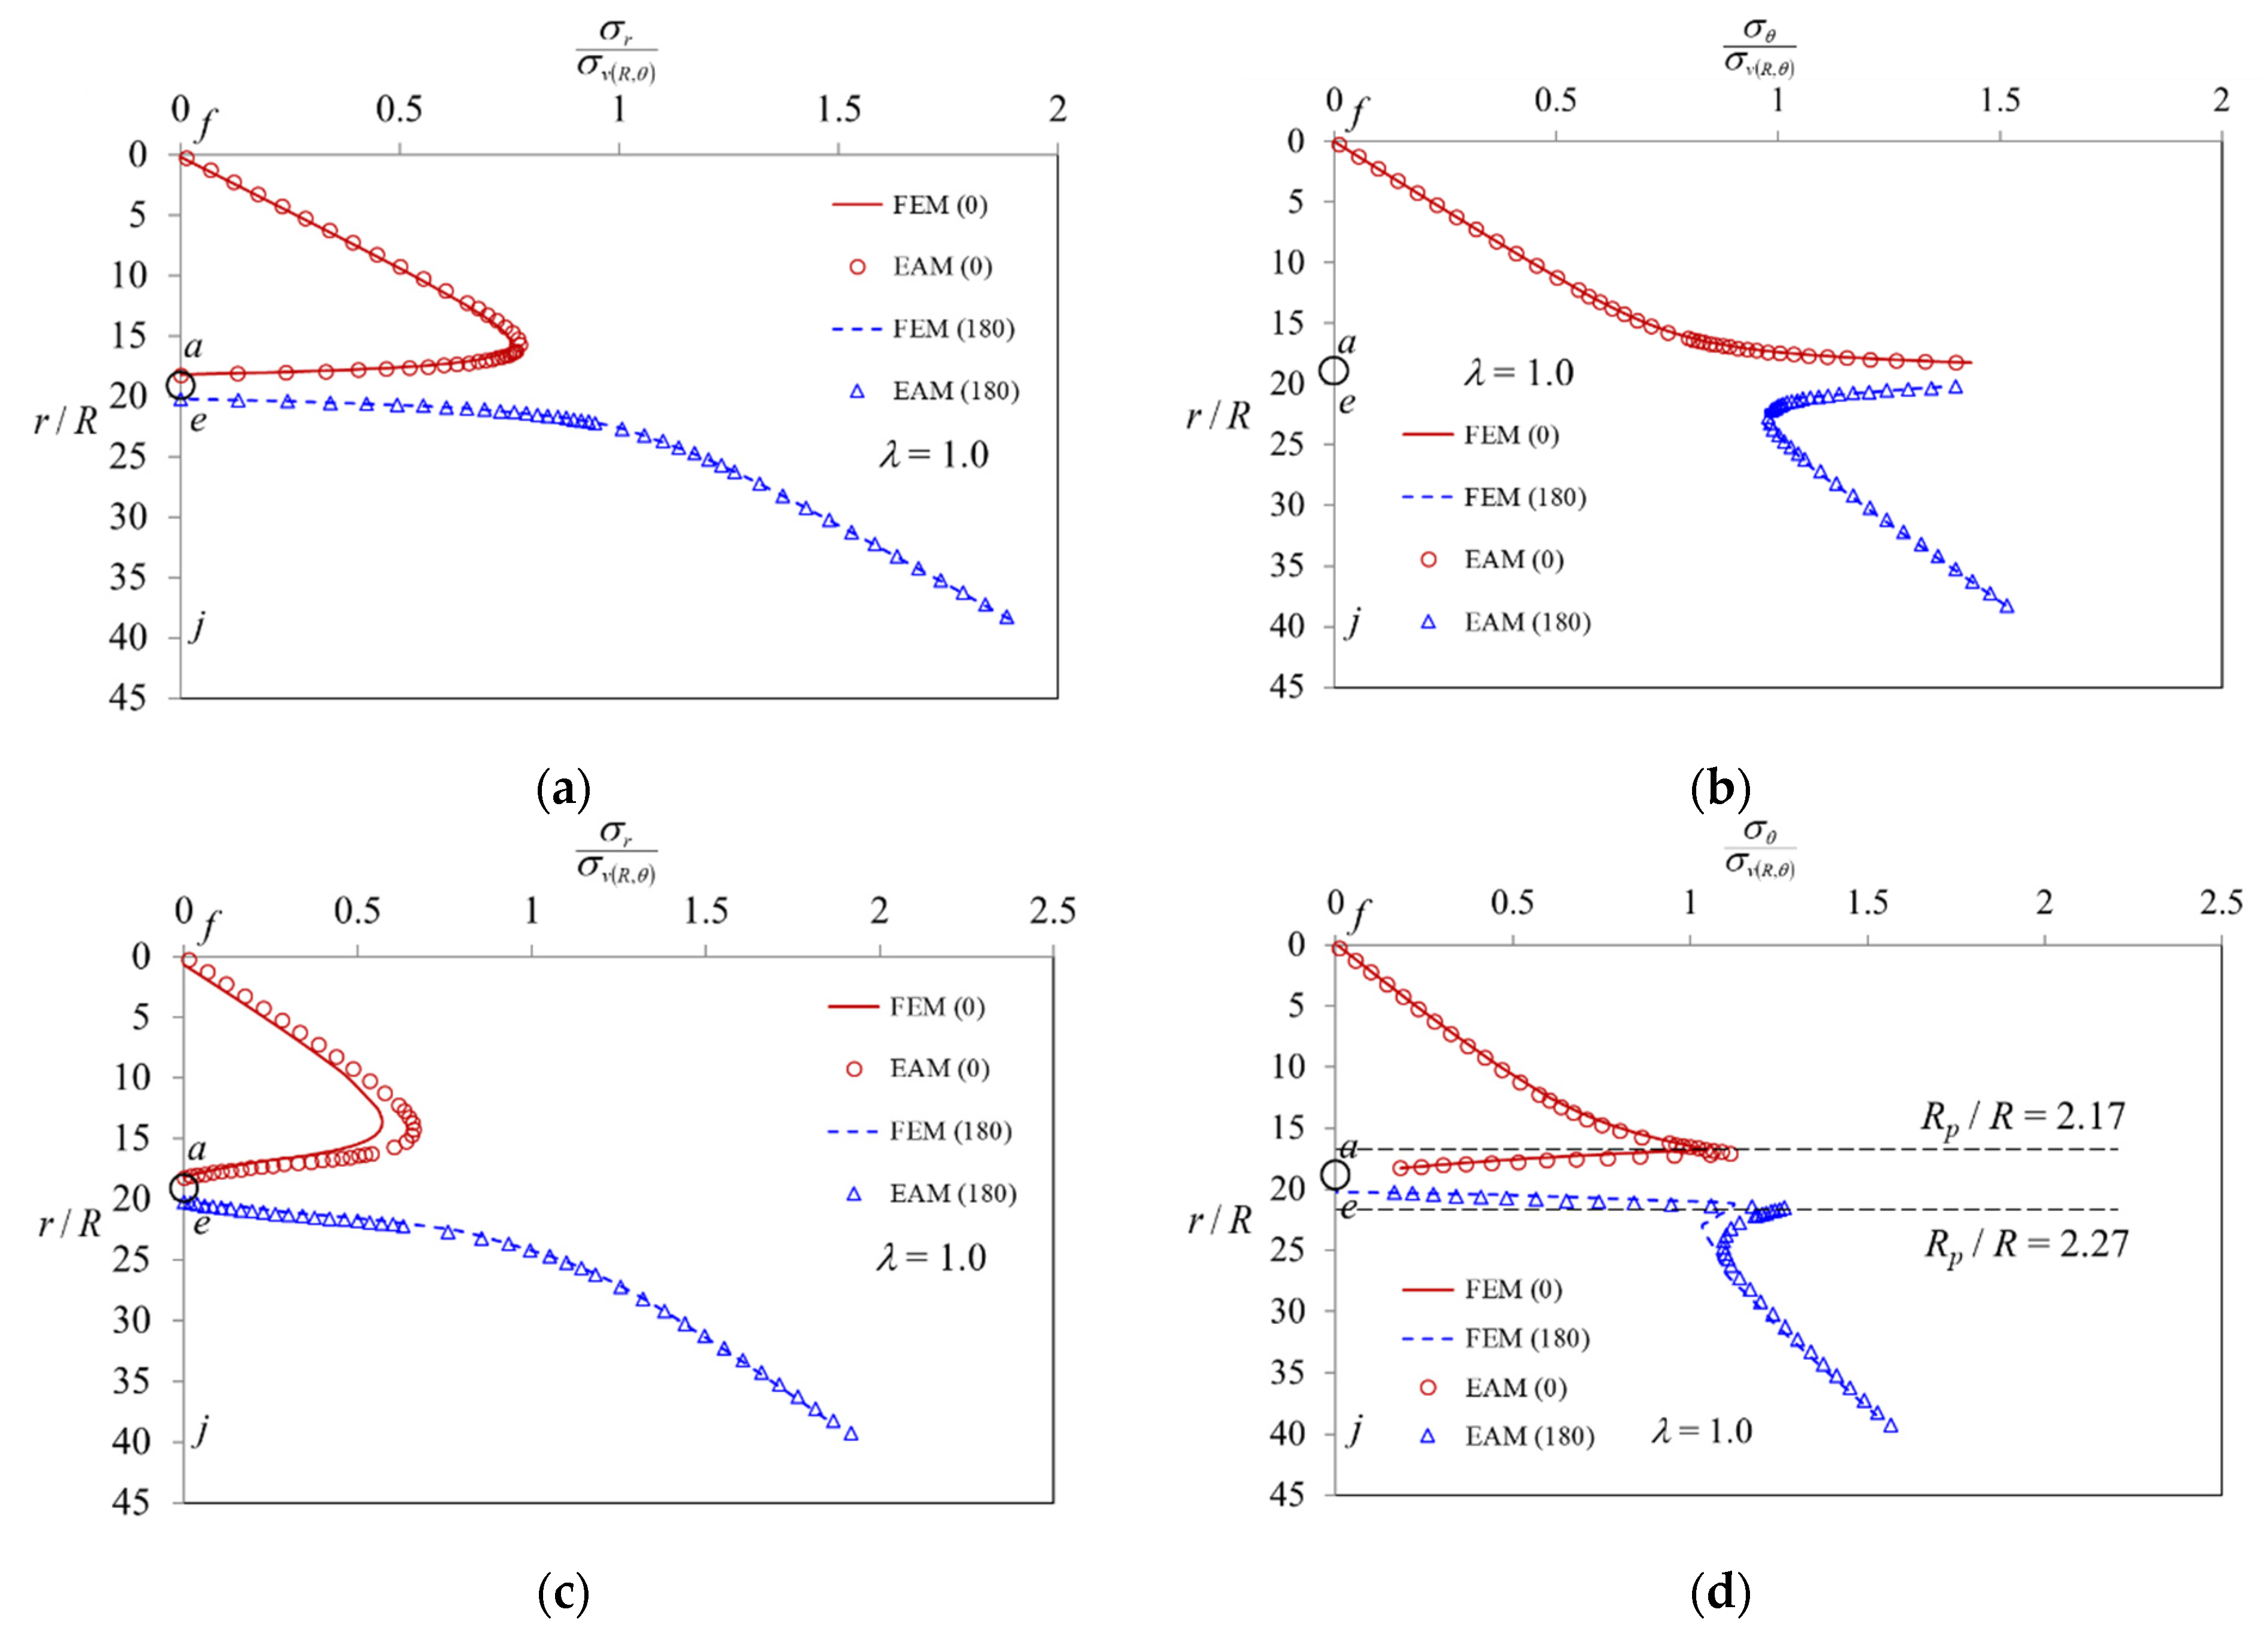
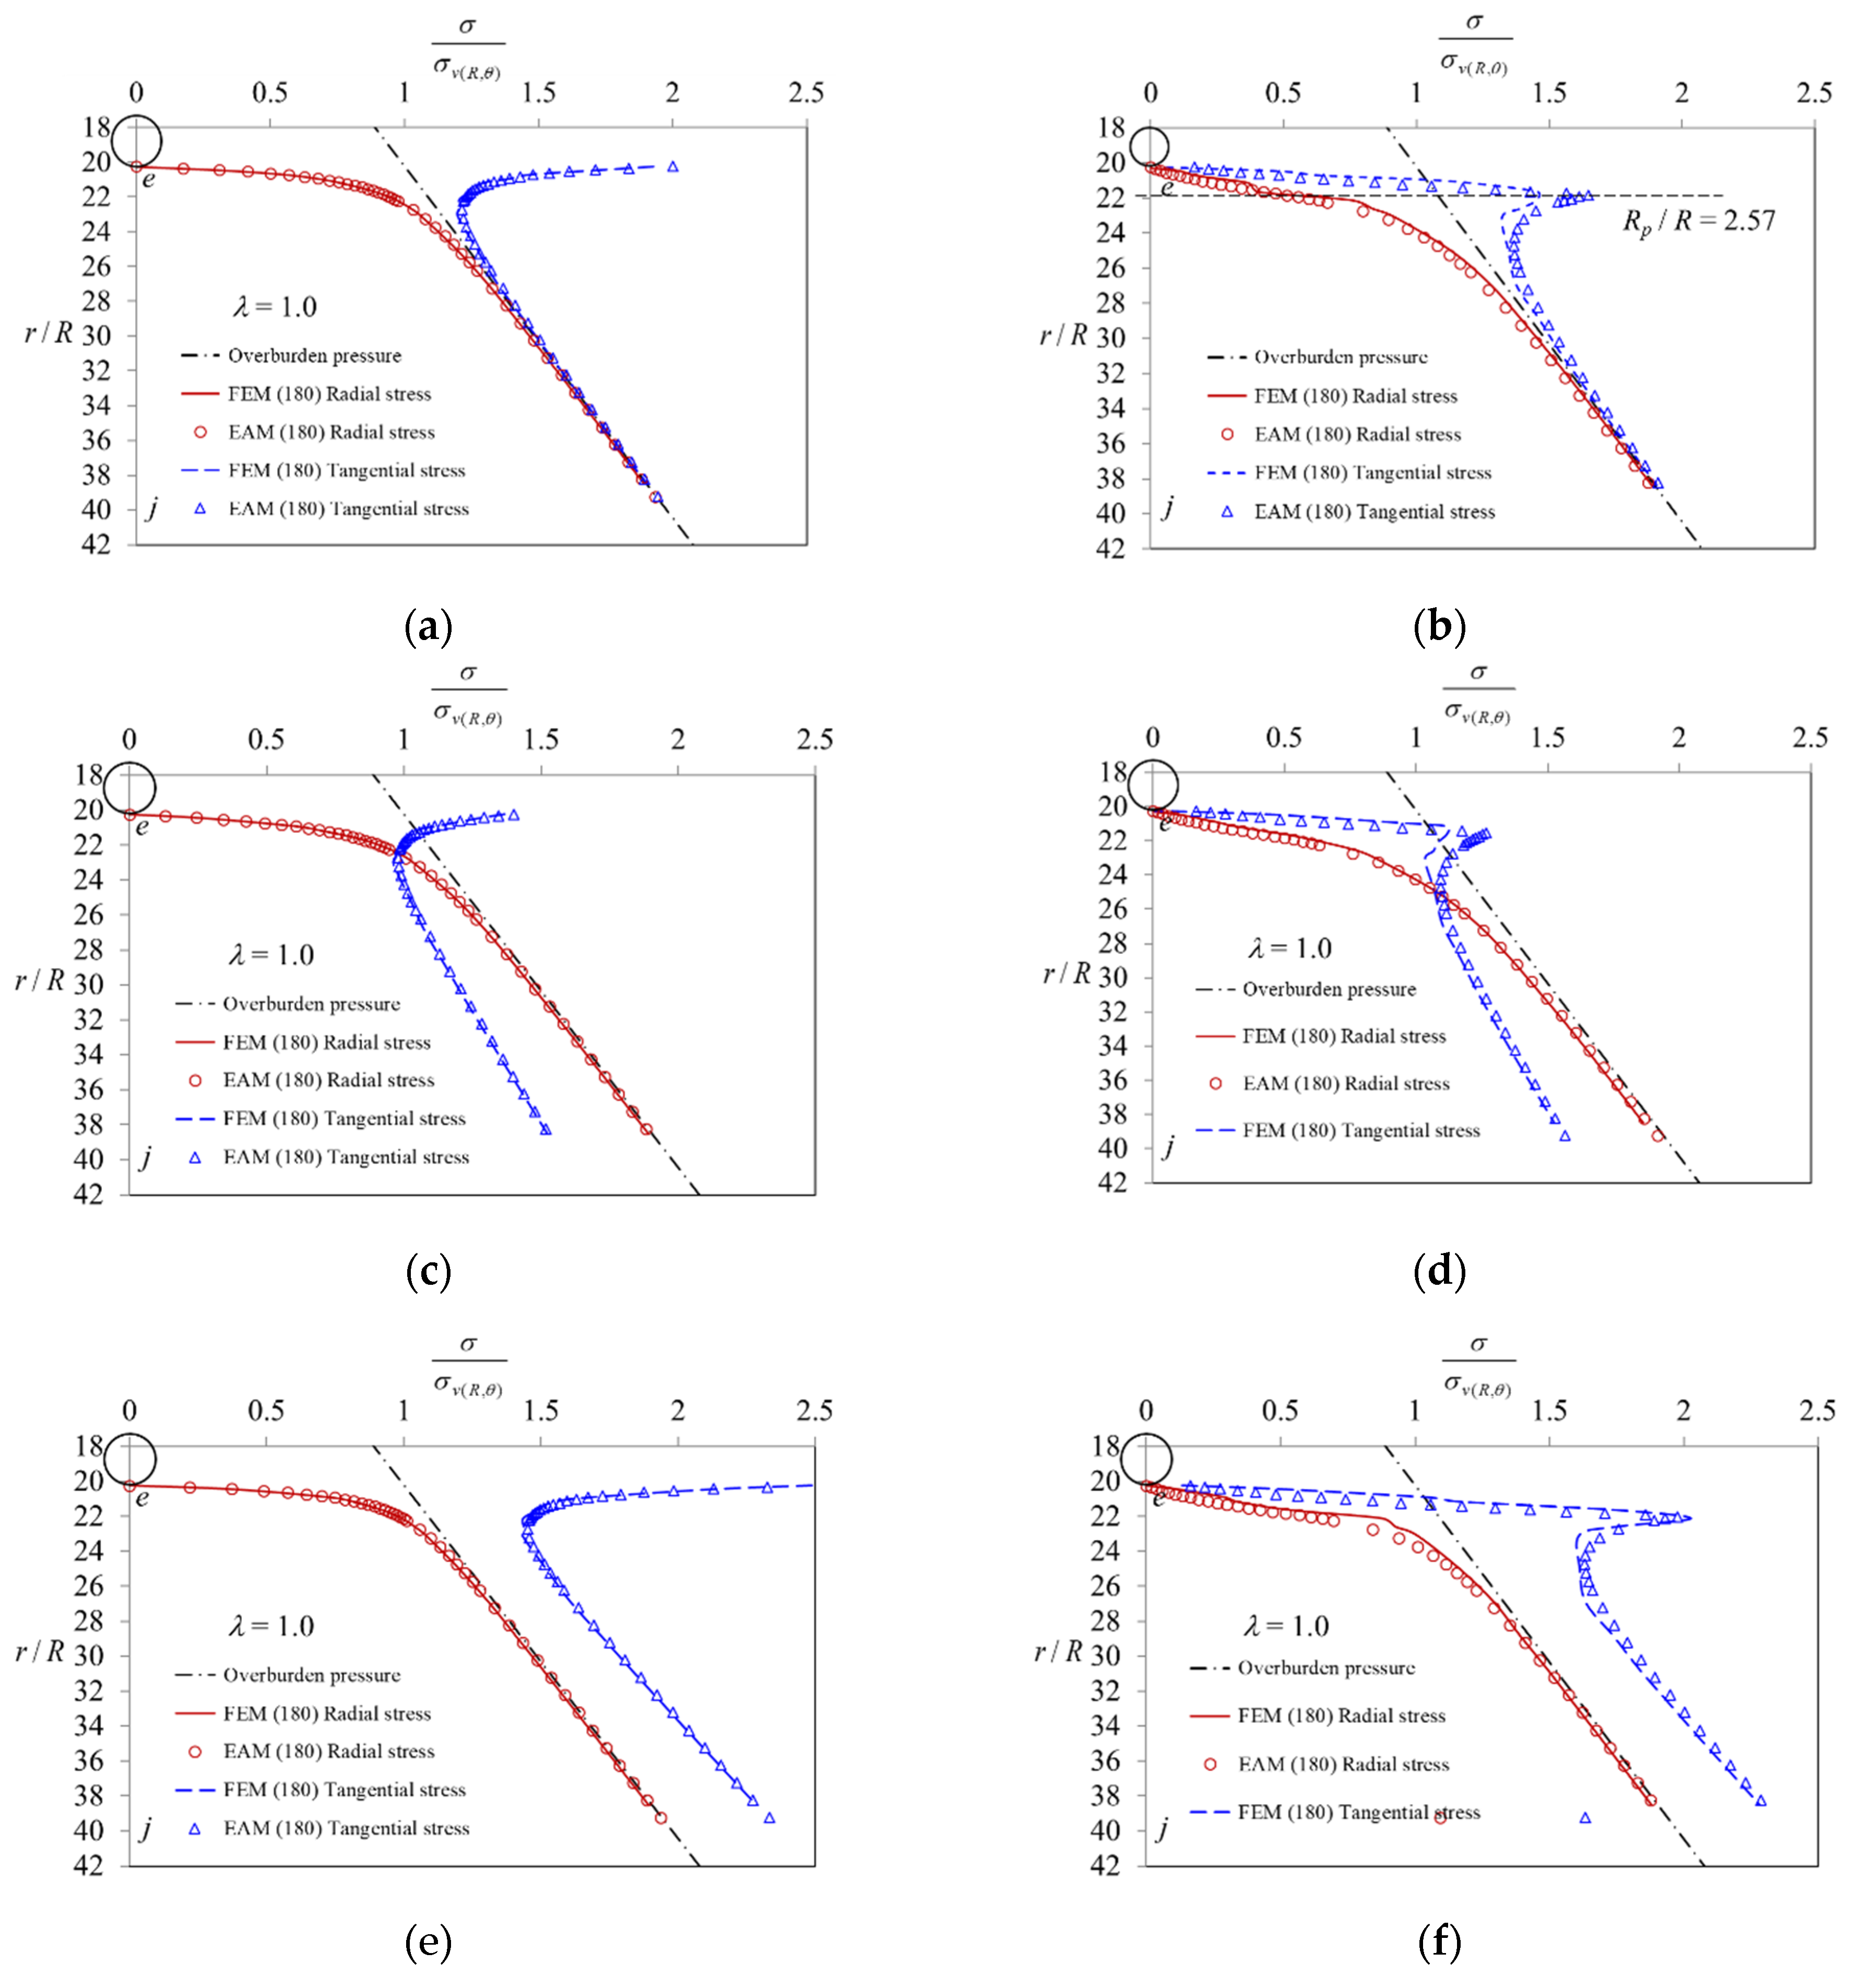
In addition, in Case III (the area below the spring line, 90° < θ < 180°), it supposes that a distance r is along the vertical line ej and the initial stress equals 2γ (h + R). Figure 16 and Figure 17 show the analysis results in the elastic region and in the elastoplastic region, respectively. As for the expression of stress anisotropy and the influence of overburden depth, it can be determined from (d) in Figure 14, Figure 15, Figure 16 and Figure 17 that the overburden pressure line can be represented by the distribution diagram of the radial stress line. In other words, the influence of two factors, overburden depth and stress anisotropy, can be described by using the tunnel radial stress distribution map.
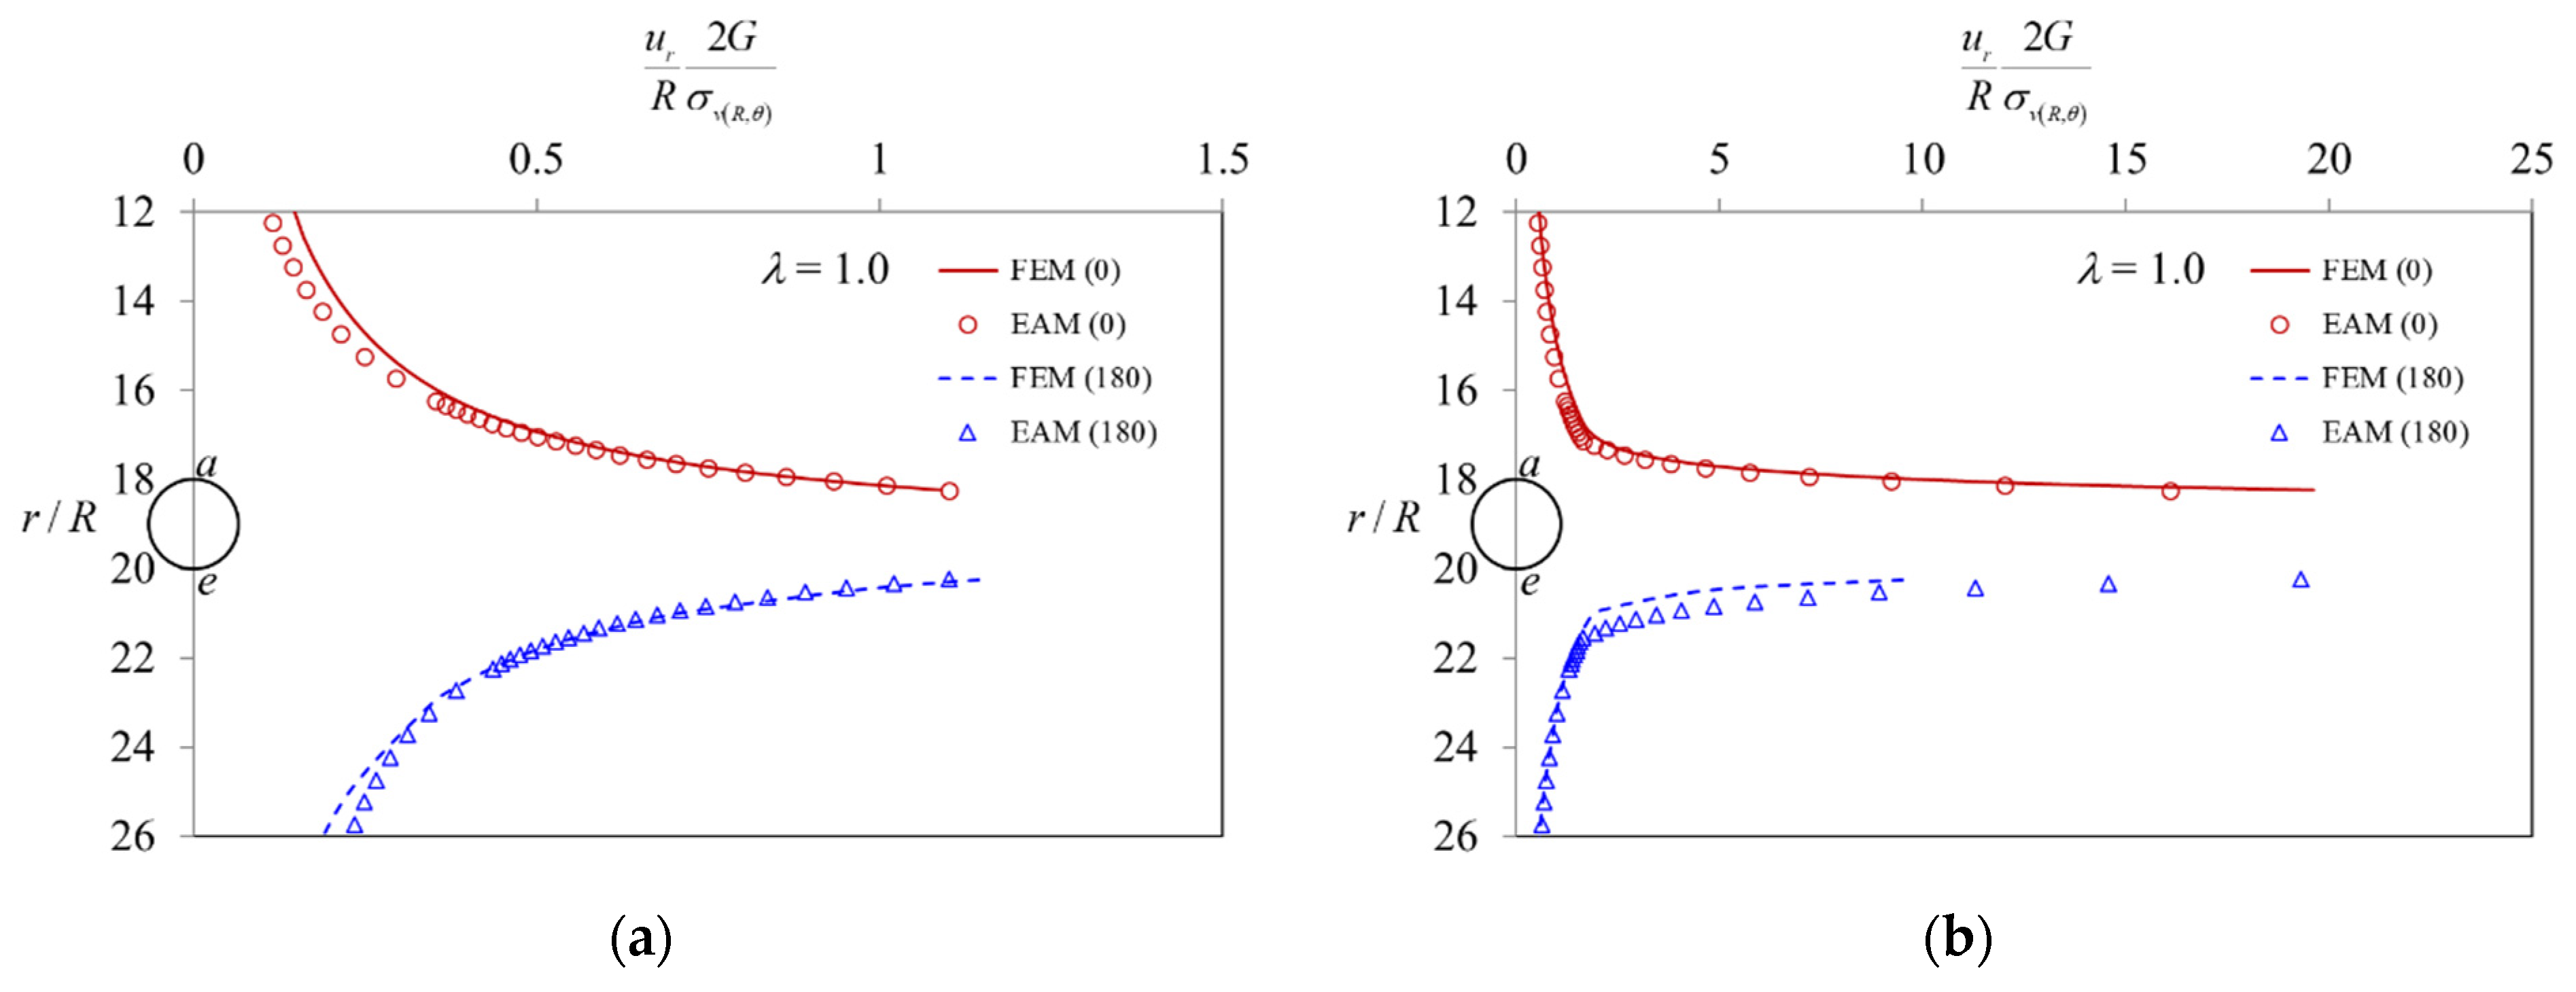
From the crown of the tunnel to the ground surface (line af), the height of the tunnel itself (2R), and from the invert of the tunnel to the deepest part (line ej), if these three distances are measured, that is, the distance from the ground surface to the depth of 20R. For this consideration, Figure 18a,b show the radial stress and the tangential stress in the elastic media, respectively. These stresses in the elastoplastic media are represented in Figure 18c,d. The comparison results of the EAM analysis proposed in this study with the FEM numerical analysis (shown in Figure 18) can not only present the distribution curve of the overburden pressure, but also describe the variation of the surrounding area caused by the tunnel advancing excavation. As shown in Figure 18d, the plastic radius values around the tunnel are the same under the isotropic stress condition; however, under the anisotropic stress condition, the plastic radius values are different. In addition, Figure 19a,b represent the radial displacement distribution in the elastic and elastoplastic media, respectively.
For the effects of stress under the isotropic and the anisotropic conditions, Figure 20 and Figure 21 show the study of stress distribution of Case I and III. One can observe that the overburden pressure line can be represented by the distribution diagram of the radial stress line, and the degree of change in the stress distribution is Ko = 1.2 first, then 1.0, and finally 0.8.

6. Discussion

There are several affected and unknown variables waiting to be explored for the effect of overburden depth and stress anisotropy on the ground reaction around a circular tunnel. That is, the changes such as tangential stress, radial displacement, and plastic radius are considered in the elastic or elastoplastic media.
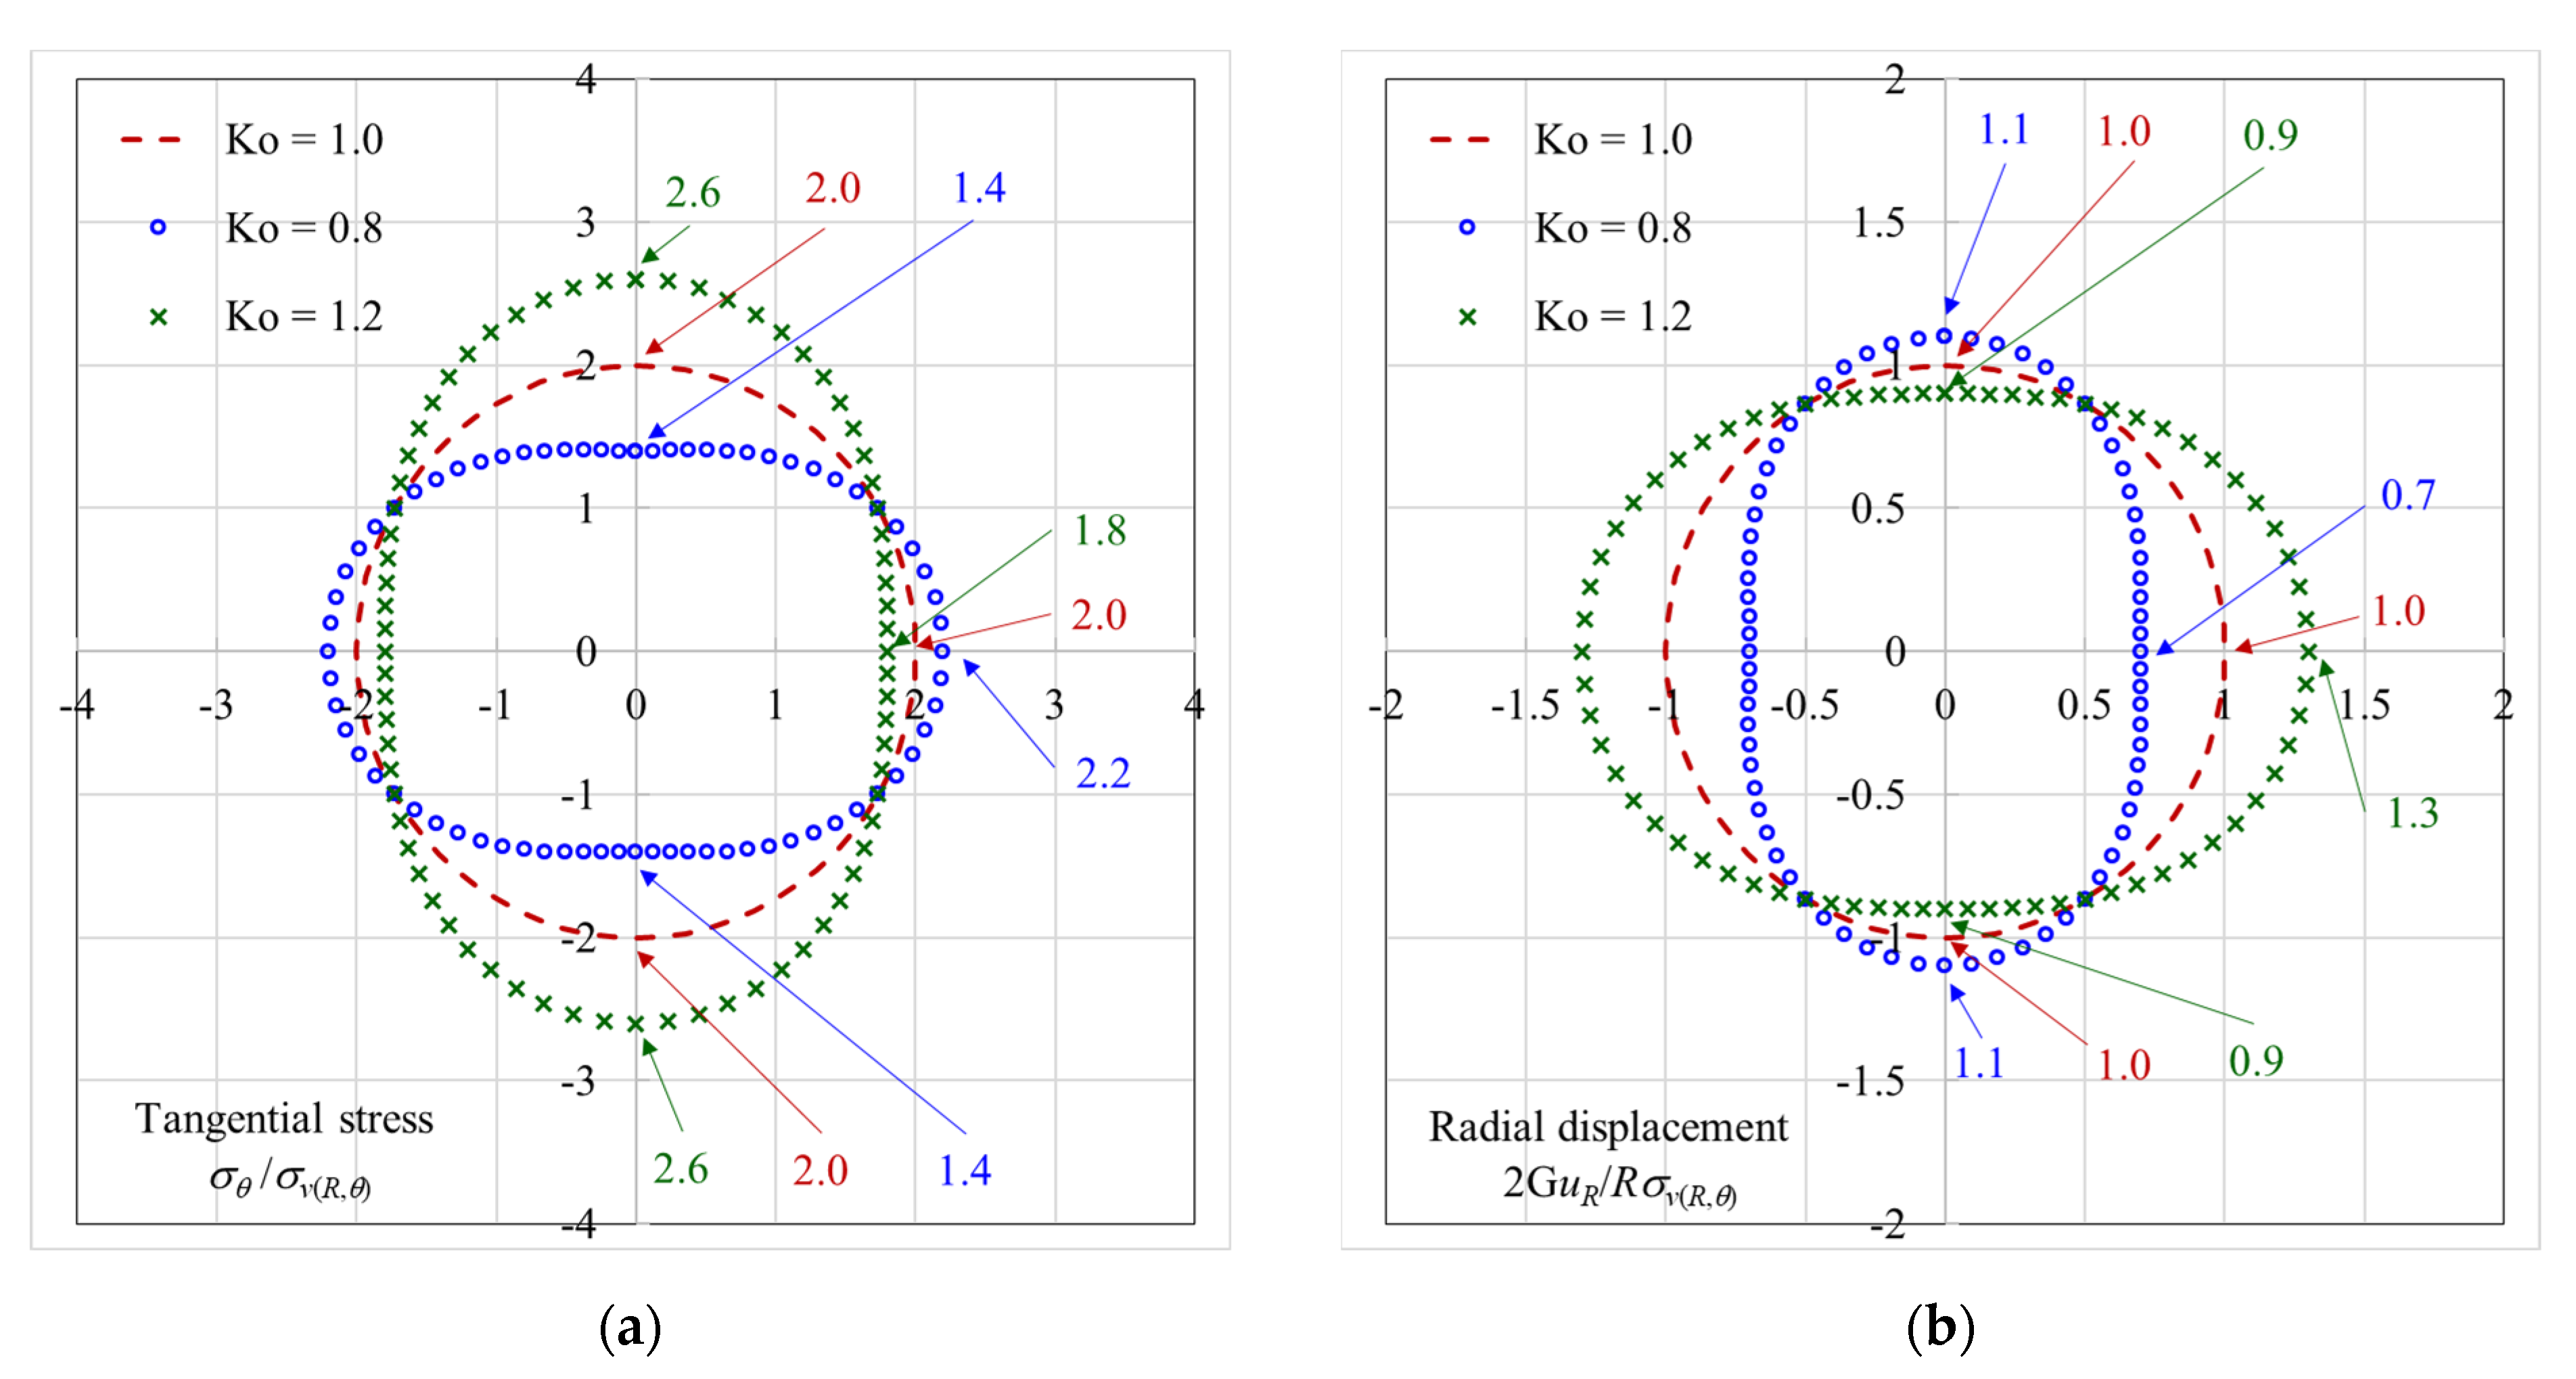
Firstly, the variation and distribution of tangential stress at the intrados of the tunnel in the elastic media are shown in Figure 22a. As shown in the figure, the tangential stress distribution diagram under the condition of stress isotropy (Ko = 1.0) presents a circular state, while the distribution diagram under the condition of stress anisotropy (Ko ≠ 1.0) presents an upright ellipse (Ko < 1.0); for a horizontal ellipse, Ko > 1.0. In other words, concerning the tangential stress concentration and its increase, Ko > 1.0 means that the stress concentration will occur at the crown of the tunnel, while Ko < 1.0 will occur at the spring line.
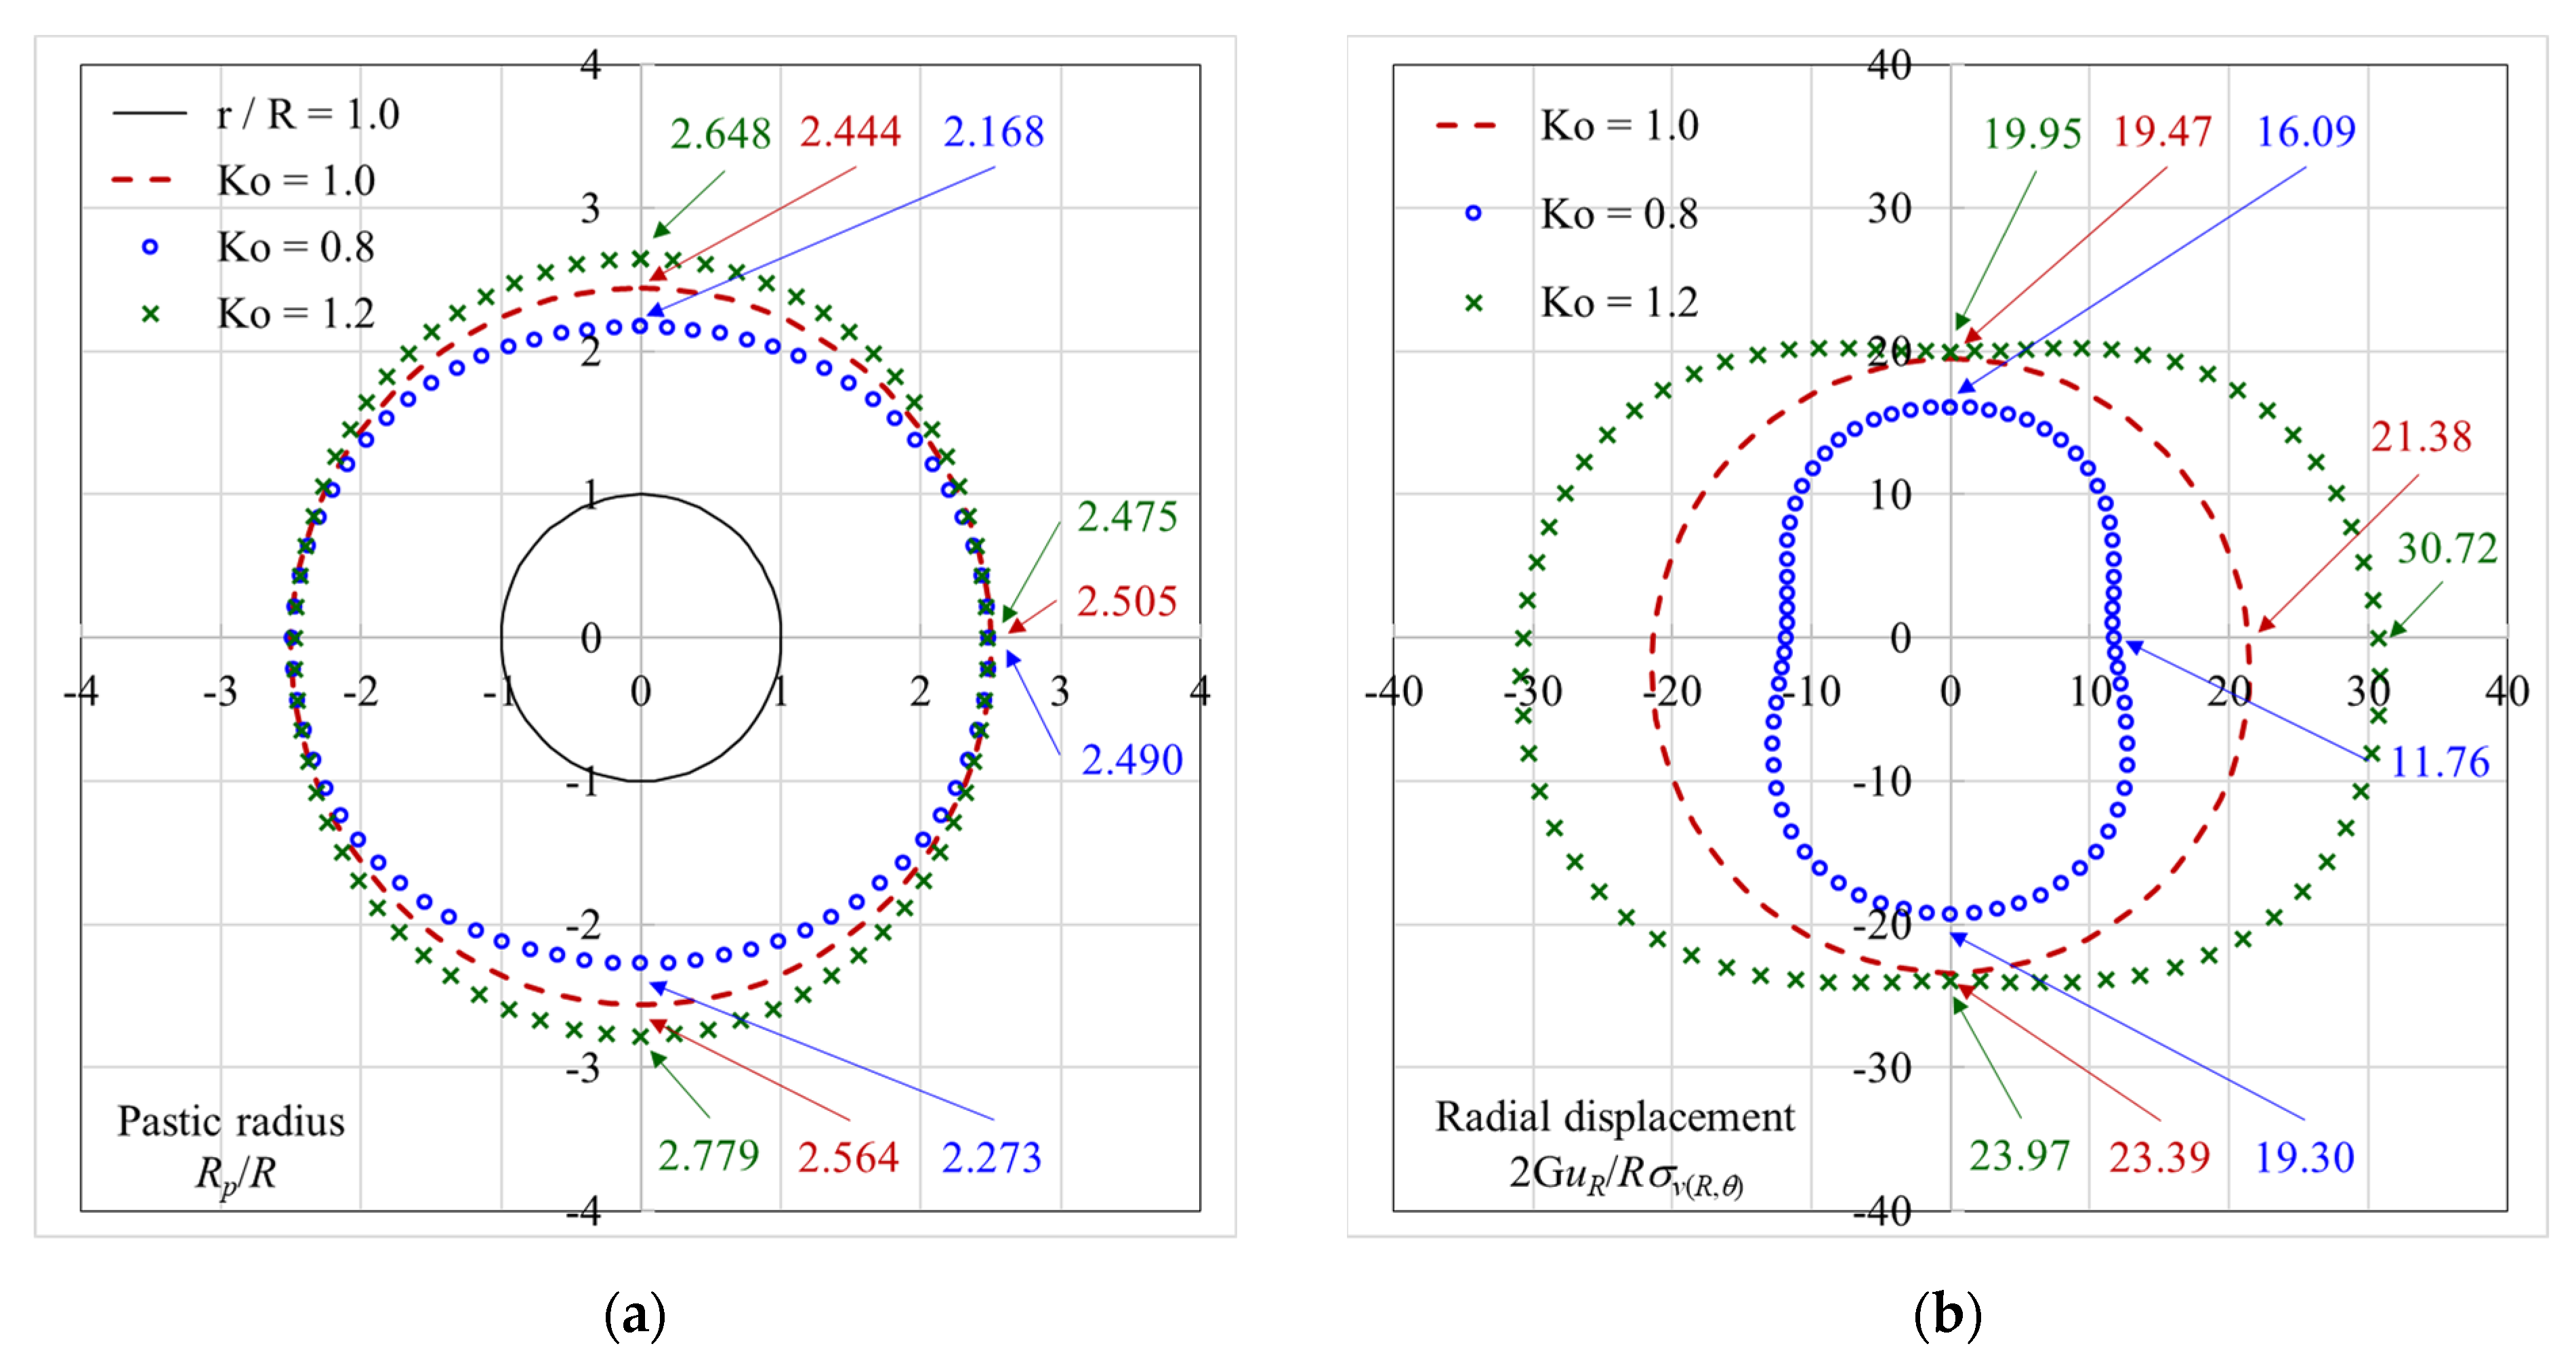
Secondly, the distribution range of the plastic zone is shown in Figure 23a. Under the condition of stress isotropy (Ko = 1.0), one can observe that the plastic radius increases with the increase in the overburden depth. It can be seen from this that the overburden depth has a significant effect on the distribution of the surrounding plastic zone caused by tunnel excavation. The plastic radius ratio (Rp/R) from large to small is the crown (2.444), the spring line (2.505), and the invert (2.564). The analysis results of stress anisotropy (Ko ≠ 1.0) also show that the plastic radius ratio at the invert of the tunnel is larger than that at the crown, indicating the importance of the influence of the overburden depth.
Finally, regarding the distribution changes in the radial displacement at the intrados of the tunnel, Figure 22b and Figure 23b show the analysis results of the radial displacement in the elastic and elastoplastic media, respectively. The results obtained by elastic analysis show that the larger radial displacement with Ko < 1.0 occurs at the crown and invert of the tunnel, while Ko > 1.0 occurs at the spring line. The same situation occurs in the elastoplastic analysis results, as shown in Figure 23b. In addition, it can also be determined that the radial displacement increases gradually with the depth. The values of radial displacement at the invert of the tunnel are always larger than those at the crown, again showing a significant influence of the overburden depth.

7. Conclusions

Through the theoretical analysis (CCM) concerning the behavior of the tunnel excavation, the derivation of the mechanical partial differential equation, the establishment and practice of the incremental calculation (EAM), and the comparison of the numerical analysis (FEM), the following conclusions can be drawn:
(1)
The theoretical analysis and numerical calculation of the ground reaction caused by the advancing excavation of a circular tunnel under anisotropic stress conditions influenced by the overburden depth is investigated in this paper.
(2)
It can be determined that the distribution of stress/displacement induced by tunnel advancing excavation is not affected by the overburden depth along the tunnel spring line in Case II, whether under isotropic or anisotropic stress conditions. In addition, it is not the case in Cases I and III, which are affected by the overburden depth.
(3)
The influence of these two factors, overburden depth and stress anisotropy, can be described by using the distribution map of the tunnel radial stress.
(4)
The comparison results of the EAM analysis proposed in this study with the FEM numerical analysis can not only present the distribution curve of the overburden pressure but also describe the variation of the surrounding area caused by the tunnel advancing excavation.
(5)
Due to the influence of overburden depth, the tangential stress, radial displacement, and plastic zone range of the tunnel invert are much larger than those of the tunnel crown, which cannot be considered and simulated by traditional CCM theoretical analysis.
(6)
Three assumptions of different boundary conditions that the initial anisotropic stress varies with the influence of the overburden depth are put forward to improve the defects that cannot be considered in the analysis of the traditional CCM.
(7)
The analytical closed-form solution interpreted by the incremental procedure was derived for considering the effect of advancing excavation of a circular tunnel in an elastoplastic media.
(8)
To use the confinement loss as an incremental step, simulation of the effect of advancing excavation of a circular tunnel is proposed and achieved by using the incremental procedure of the EAM to realize the calculation.
(9)
The results obtained by the closed-form solution explained by the incremental procedure show a very consistent trend with the results of the finite element analysis.
(10)
The EAM proposed in this study can deal with the influence of overburden depth and stress anisotropy, not only as a useful tool for deep tunnel support design, but also as a method which may be applied to shallow tunnel behavior in the next stage of research.

Author Contributions

Methodology, Supervision, Writing—original draft, Y.-L.L.; Formula derivation, Verification, M.-L.Z., C.-H.M., C.-S.C. and C.-M.L.; Software programming, Computation, C.-M.L. All authors have read and agreed to the published version of the manuscript.

Funding

This research received no external funding.

Conflicts of Interest

The authors declare no conflict of interest.

References

  1. Panet, M. Le Calcul des Tunnels par la Méthode Convergence-Confinement; Presses de l’Ecole Nationale des Ponts et Chaussées: Paris, France, 1995. [Google Scholar]
  2. Panet, M.; Sulem, J. Convergence-Confinement Method for Tunnel Design; Springer: Cham, Switzerland, 2022. [Google Scholar]
  3. Lee, Y.-L.; Hsu, W.-K.; Lee, C.-M.; Xin, Y.-X.; Zhou, B.-Y. Direct Calculation Method for the Analysis of Non-linear Behavior of Ground-Support Interaction of a Circular Tunnel Using Convergence Confinement Approach. Geotech. Geol. Eng. 2021, 39, 973–990. [Google Scholar] [CrossRef]
  4. Lee, Y.-L.; Hsu, W.-K.; Chou, P.-Y.; Hsieh, P.-W.; Ma, C.-H.; Kao, W.-C. Verification and Comparison of Direct Calculation Method for the Analysis of Support–Ground Interaction of a Circular Tunnel Excavation. Appl. Sci. 2022, 12, 1929. [Google Scholar] [CrossRef]
  5. Oreste, P. The convergence–confinement method: Roles and limits in modern geomechanical tunnel design. Am. J. Appl. Sci. 2009, 6, 757–771. [Google Scholar] [CrossRef] [Green Version]
  6. Pacher, F. Deformationsmessungen im Versuchsstollen als Mittel zur Erforschung des Gebirgsverhaltens und zur Bemessung des Ausbaues. In Grundfragen auf dem Gebiete der Geomechanik; Felsmechanik und Ingenieurgeologie; Springer: Berlin/Heidelberg, Germany, 1964; pp. 149–161. [Google Scholar] [CrossRef]
  7. Panet, M. Recommendations on the Convergence-Confinement Method, Association Française des Tunnels et de l’Espace Souterrain (AFTES). 2001. pp. 1–11. Available online: https://tunnel.ita-aites.org/media/k2/attachments/public/Convergence-confinement%20AFTES.pdf. (accessed on 28 September 2022).
  8. Brown, E.T.; Bray, J.W.; Ladanyi, B.; Hoek, E. Ground Response Curves for Rock Tunnels. J. Geotech. Eng. 1983, 109, 15–39. [Google Scholar] [CrossRef]
  9. Brady, B.; Brown, E. Rock Mechanics for Underground Mining; Chapman & Hall: London, UK, 1993. [Google Scholar]
  10. Wang, Y. Ground Response of Circular Tunnel in Poorly Consolidated Rock. J. Geotech. Eng. 1996, 122, 703–708. [Google Scholar] [CrossRef]
  11. Carranza-Torres, C.; Fairhurst, C. The elasto-plastic response of underground excavations in rock masses that satisfy the Hoek–Brown failure criterion. Int. J. Rock Mech. Min. Sci. 1999, 36, 777–809. [Google Scholar] [CrossRef]
  12. Carranza-Torres, C.; Fairhurst, C. Application of the Convergence-Confinement method of tunnel design to rock masses that satisfy the Hoek-Brown failure criterion. Tunn. Undergr. Space Technol. 2000, 15, 187–213. [Google Scholar] [CrossRef]
  13. Oreste, P.P. Analysis of structural interaction in tunnels using the covergence-confinement approach. Tunn. Undergr. Space Technol. 2003, 18, 347–363. [Google Scholar] [CrossRef]
  14. Sharan, S. Exact and approximate solutions for displacements around circular openings in elastic–brittle–plastic Hoek–Brown rock. Int. J. Rock Mech. Min. Sci. 2005, 42, 542–549. [Google Scholar] [CrossRef]
  15. Carranza-Torres, C. Elasto-plastic solution of tunnel problems using the generalized form of the hoek-brown failure criterion. Int. J. Rock Mech. Min. Sci. 2004, 41, 629–639. [Google Scholar] [CrossRef]
  16. Cui, L.; Zheng, J.-J.; Zhang, R.-J.; Lai, H.-J. A numerical procedure for the fictitious support pressure in the application of the convergence–confinement method for circular tunnel design. Int. J. Rock Mech. Min. Sci. 2015, 78, 336–349. [Google Scholar] [CrossRef]
  17. Park, K.-H.; Kim, Y.-J. Analytical solution for a circular opening in an elastic–brittle–plastic rock. Int. J. Rock Mech. Min. Sci. 2006, 43, 616–622. [Google Scholar] [CrossRef]
  18. Guan, Z.; Jiang, Y.; Tanabasi, Y. Ground reaction analyses in conventional tunnelling excavation. Tunn. Undergr. Space Technol. 2007, 22, 230–237. [Google Scholar] [CrossRef]
  19. Serrano, A.; Olalla, C.; Reig, I. Convergence of circular tunnels in elastoplastic rock masses with non-linear failure criteria and non-associated flow laws. Int. J. Rock Mech. Min. Sci. 2011, 48, 878–887. [Google Scholar] [CrossRef]
  20. Alejano, L.; Rodriguez-Dono, A.; Alonso, E.; Fdez-Manín, G. Ground reaction curves for tunnels excavated in different quality rock masses showing several types of post-failure behaviour. Tunn. Undergr. Space Technol. 2009, 24, 689–705. [Google Scholar] [CrossRef]
  21. Oreste, P.; Pella, D. Modelling progressive hardening of shotcrete in convergence-confinement approach to tunnel design. Tunn. Undergr. Space Technol. 1997, 12, 425–431. [Google Scholar] [CrossRef]
  22. Rodríguez, R.; Díaz-Aguado, M.B. Deduction and use of an analytical expression for the characteristic curve of a support based on yielding steel ribs. Tunn. Undergr. Space Technol. 2013, 33, 159–170. [Google Scholar] [CrossRef]
  23. Oke, J.; Vlachopoulos, N.; Diederichs, M. Improvement to the Convergence-Confinement Method: Inclusion of Support Installation Proximity and Stiffness. Rock Mech. Rock Eng. 2018, 51, 1495–1519. [Google Scholar] [CrossRef]
  24. Gschwandtner, G.G.; Galler, R. Input to the application of the convergence confinement method with time-dependent material behaviour of the support. Tunn. Undergr. Space Technol. 2012, 27, 13–22. [Google Scholar] [CrossRef]
  25. Sandrone, F.; Labiouse, V. Analysis of the evolution of road tunnels equilibrium conditions with a convergence–confinement approach. Rock Mech. Rock Eng. 2010, 43, 201–218. [Google Scholar] [CrossRef]
  26. Bernaud, D.; Rousset, G. The ‘new implicit method’ for tunnel analysis. Int. J. Numer. Anal. Methods Géoméch. 1996, 20, 673–690. [Google Scholar] [CrossRef]
  27. De La Fuente, M.; Taherzadeh, R.; Sulem, J.; Nguyen, X.-S.; Subrin, D. Applicability of the convergence-confinement method to full-face excavation of circular tunnels with stiff support system. Rock Mech. Rock Eng. 2019, 52, 2361–2376. [Google Scholar] [CrossRef]
  28. Panet, M.; Guenot, A. Analysis of convergence behind the face of a tunnel. In Proceedings of the 3rd International Symposium, Brighton, UK, 7–11 June 1982; pp. 197–204. [Google Scholar]
  29. Humbert, P.; Dubouchet, A.; Fezans, G.; Remaud, D. CESAR-LCPC, un progiciel de calcul dédié au génie civil. Bull. Lab. Ponts Chaussées 2005, 256, 7–37. Available online: https://www.ifsttar.fr/collections/BLPCpdfs/blpc_256-257_7-37.pdf. (accessed on 28 September 2022).
  30. Mousivand, M.; Maleki, M. Constitutive Models and Determining Methods Effects on Application of Convergence–Confinement Method in Underground Excavation. Geotech. Geol. Eng. 2017, 36, 1707–1722. [Google Scholar] [CrossRef]
  31. Mousivand, M.; Maleki, M.; Nekooei, M.; Mansoori, M.R. Application of Convergence–Confinement Method in Analysis of Shallow Non-circular Tunnels. Geotech. Geol. Eng. 2017, 35, 1185–1198. [Google Scholar] [CrossRef]
  32. Panet, M. Calcul du souténement des tunnels à section circulaire par la méthode convergence-confinement avec un champ de contraintes initiales anisotropes. Tunn. Ouvrages Souterr. 1986, 77, 228–232. [Google Scholar]
  33. Detournay, E.; St. John, C.M. Design charts for a deep circular tunnel under non-uniform loading. Rock Mech. Rock Eng. 1988, 21, 119–137. [Google Scholar] [CrossRef]
  34. Ravandi, E.G.; Rahmannejad, R. Wall displacement prediction of circular, D shaped and modified horseshoe tunnels in non-hydrostatic stress fields. Tunn. Undergr. Space Technol. 2013, 34, 54–60. [Google Scholar] [CrossRef]
  35. Shen, B.; Barton, N. The disturbed zone around tunnels in jointed rock Masses. Int. J. Rock Mech. Min. Sci. 1997, 34, 117–125. [Google Scholar] [CrossRef]
  36. Panthi, K.K.; Shrestha, P.K. Estimating Tunnel Strain in the Weak and Schistose Rock Mass Influenced by Stress Anisotropy: An Evaluation Based on Three Tunnel Cases from Nepal. Rock Mech. Rock Eng. 2018, 51, 1823–1838. [Google Scholar] [CrossRef] [Green Version]
  37. Lee, Y.-L. Explicit Procedure and Analytical Solution for the Ground Reaction Due to Advance Excavation of a Circular Tunnel in an Anisotropic Stress Field. Geotech. Geol. Eng. 2018, 36, 3281–3309. [Google Scholar] [CrossRef]
  38. Vitali, O.P.M.; Celestino, T.B.; Bobet, A. Analytical Solution for a Deep Circular Tunnel in Anisotropic Ground and Anisotropic Geostatic Stresses. Rock Mech. Rock Eng. 2020, 53, 3859–3884. [Google Scholar] [CrossRef]
  39. Lee, Y.-L. Explicit analysis for the ground-support interaction of a circular tunnel excavation in anisotropic stress fields. J. Chin. Inst. Eng. 2020, 43, 13–26. [Google Scholar] [CrossRef]
  40. Zhao, K.; Bonini, M.; Debernardi, D.; Janutolo, M.; Barla, G.; Chen, G. Computational modelling of the mechanised excavation of deep tunnels in weak rock. Comput. Geotech. 2015, 66, 158–171. [Google Scholar] [CrossRef]
  41. Lee, Y.-L. Incremental procedure method for the analysis of ground reaction due to excavation of a circular tunnel by considering the effect of overburden depth. Tunn. Undergr. Space Technol. 2019, 93, 103059. [Google Scholar] [CrossRef]
  42. González-Nicieza, C.; Álvarez-Vigil, A.; Menéndez-Díaz, A.; González-Palacio, C. Influence of the depth and shape of a tunnel in the application of the convergence–confinement method. Tunn. Undergr. Space Technol. 2008, 23, 25–37. [Google Scholar] [CrossRef]
  43. Vlachopoulos, N.; Diederichs, M.S. Improved Longitudinal Displacement Profiles for Convergence Confinement Analysis of Deep Tunnels. Rock Mech. Rock Eng. 2009, 42, 131–146. [Google Scholar] [CrossRef]
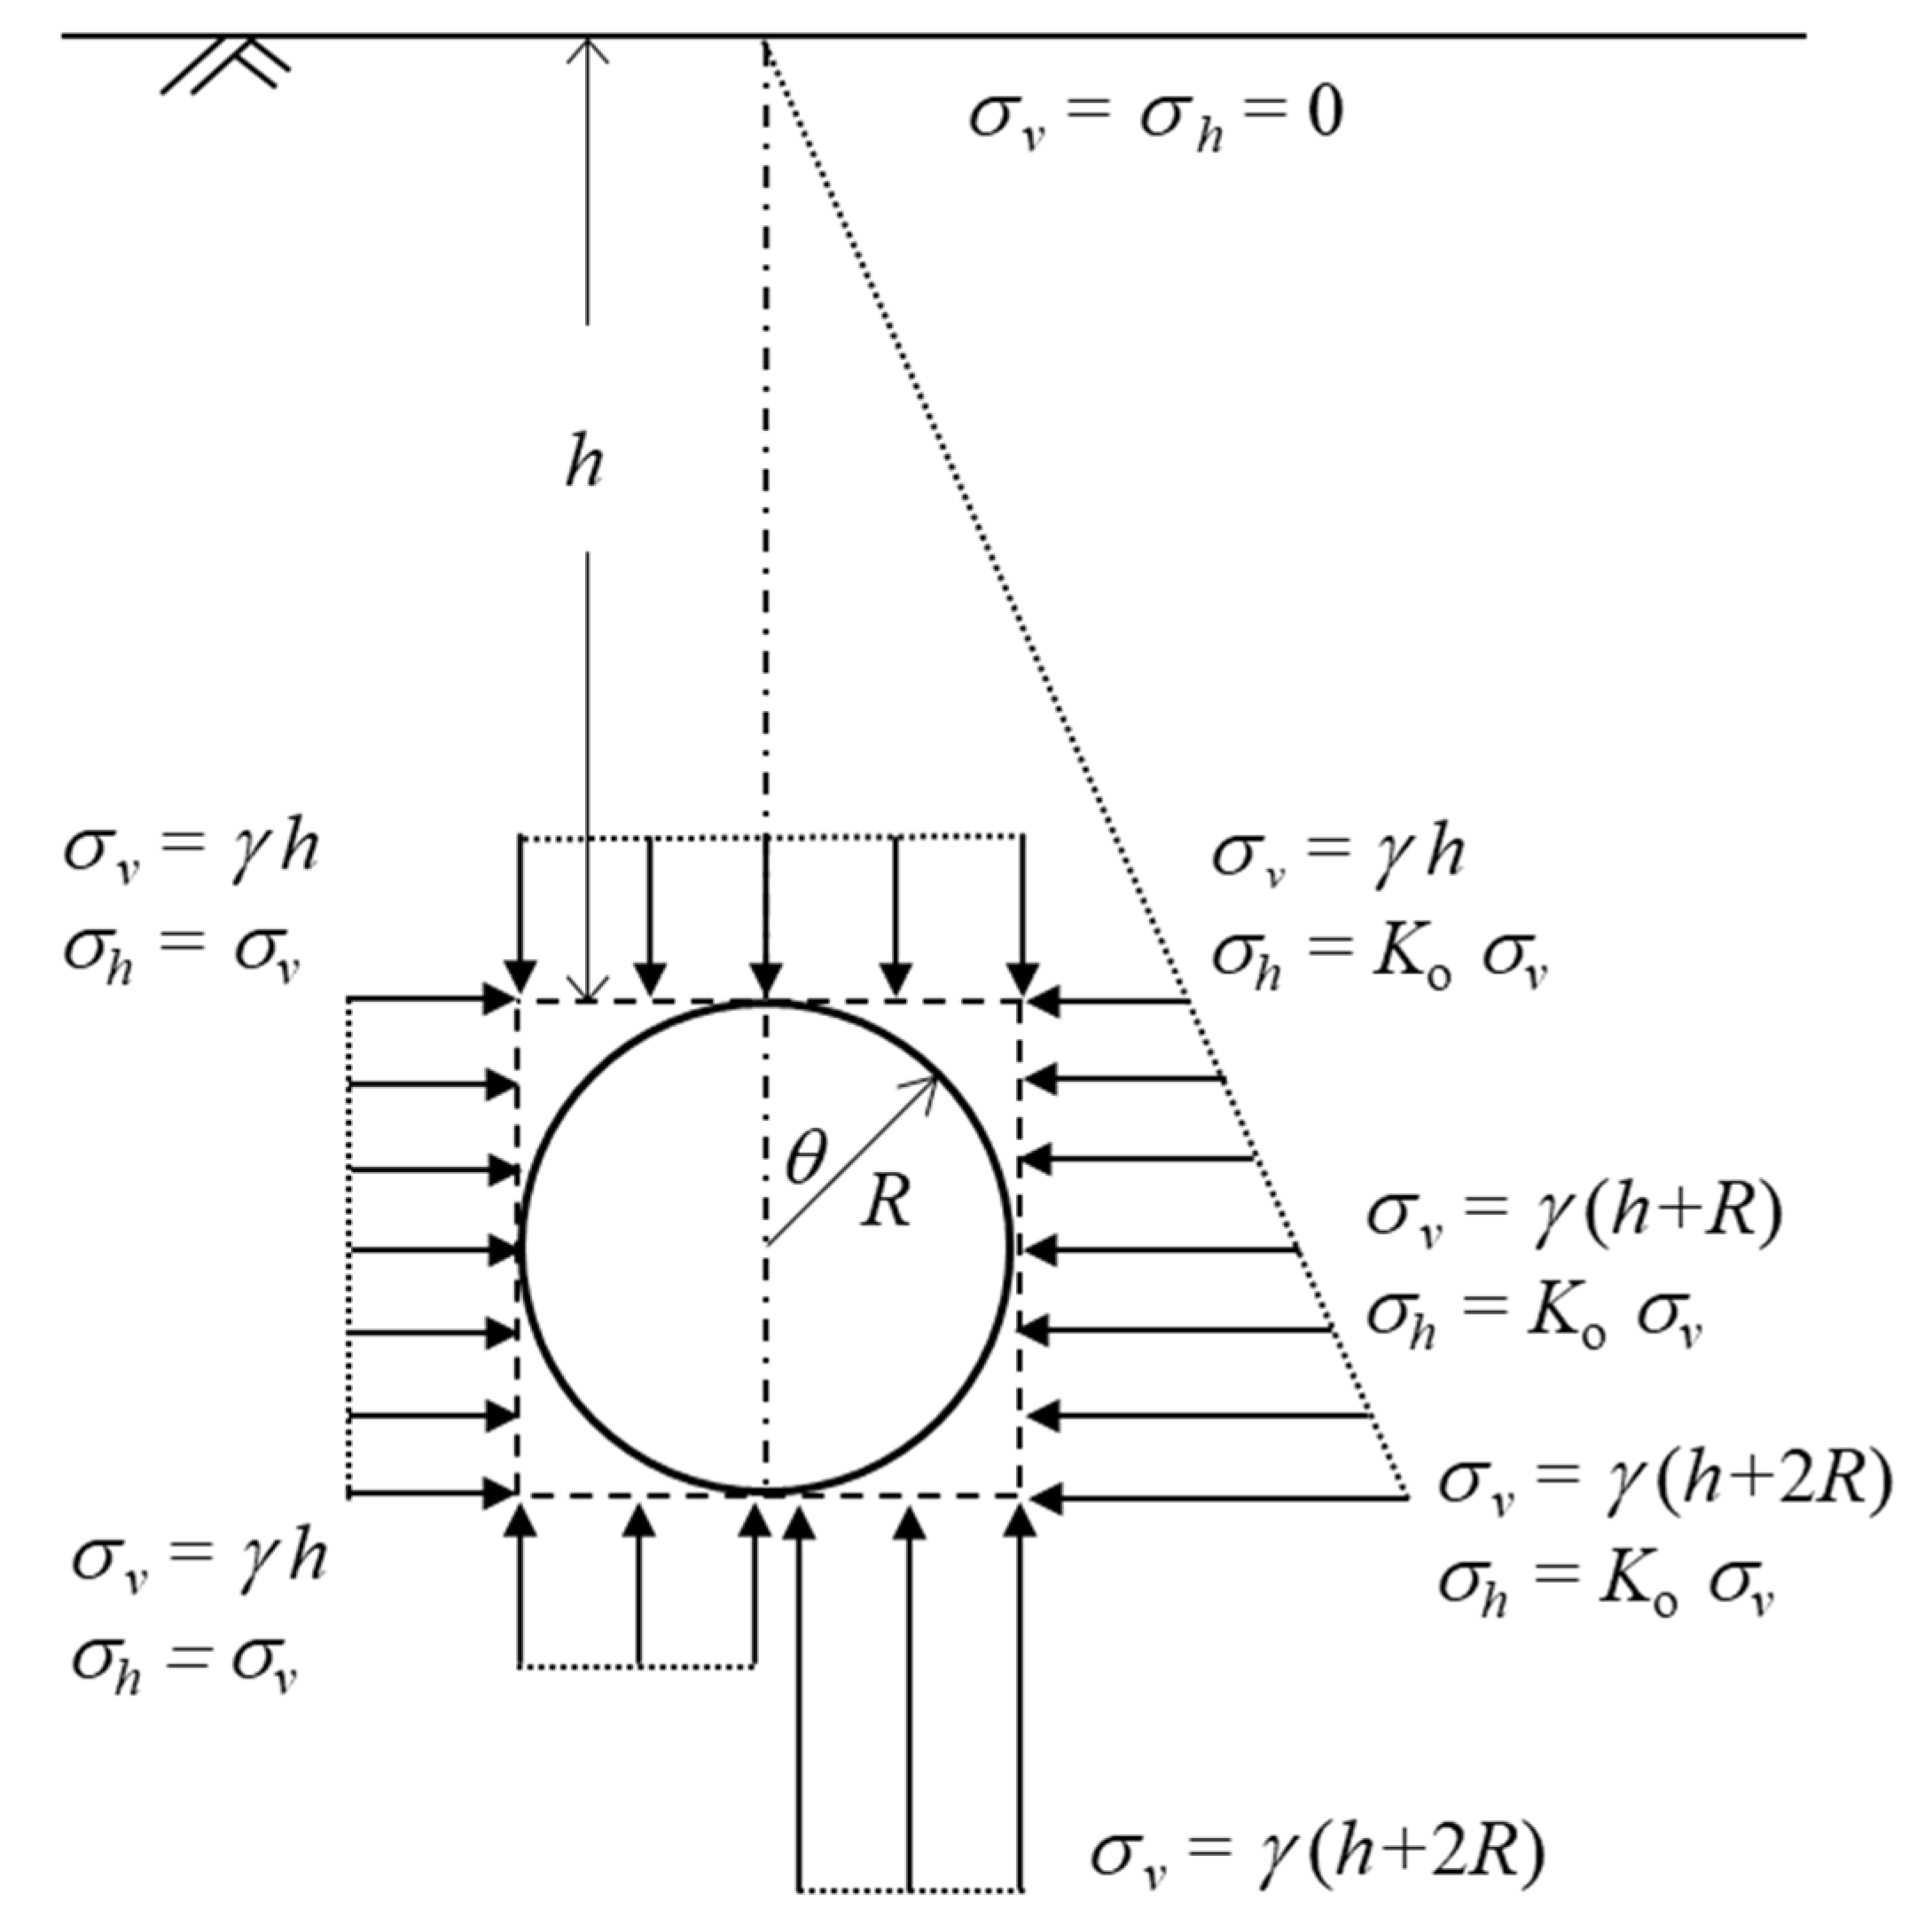
Figure 1. Schematic diagram of overburden pressure for initial isotropic/anisotropic stress around a circular tunnel.
Mathematics 11 00243 g001
Figure 2. Schematic diagram of conversion of overburden pressure: (a) the Cartesian coordinate system and (b) the polar coordinate system.
Mathematics 11 00243 g002
Figure 3. Schematic diagram of the stress change around a circular tunnel from the near-field to the far-field stress.
Mathematics 11 00243 g003
Figure 4. Calculation spreadsheet presented by the Explicit Analysis Method (EAM).
Mathematics 11 00243 g004
Figure 5. Drawing results presented by the Explicit Analysis Method (EAM).
Mathematics 11 00243 g005
Figure 6. (a) Assumptions of three different boundary conditions with the initial anisotropic stress in different far-field conditions and (b) finite element mesh and boundary condition.
Mathematics 11 00243 g006
Figure 7. Distribution diagram of initial isotropic stress/displacement (Ko = 1.0) around the tunnel in finite element analysis (a) initial stress before excavation, (b) final stress state after excavation, and (c) total displacement after excavation.
Mathematics 11 00243 g007
Figure 8. Iso-value contour plots of the final stress/displacement distribution around the tunnel under the initial isotropic stress condition (Ko = 1.0) in finite element analysis. (a) Major Principal stress (MPa), (b) Minor Principal stress (MPa), and (c) total displacement (m).
Mathematics 11 00243 g008
Figure 9. Iso-value contour plots of the final stress/displacement distribution around the tunnel under the initial anisotropic stress condition (Ko = 0.8) in finite element analysis. (a) Major Principal stress (MPa), (b) Minor Principal stress (MPa), and (c) total displacement (m).
Mathematics 11 00243 g009
Figure 10. Iso-value contour plots of the final stress/displacement distribution around the tunnel under the initial anisotropic stress condition (Ko = 1.2) in finite element analysis. (a) Major Principal stress (MPa), (b) Minor Principal stress (MPa), and (c) total displacement (m).
Mathematics 11 00243 g010
Figure 11. Ground reaction around the tunnel obtained by EAM and FEM with the different incremental values of λ in an elastic media, and the distribution of (a) radial stress, (b) tangential stress, (c) radial displacement, and (d) tangential and radial stresses with λ = 1.0 (Case II and Ko = 0.8).
Mathematics 11 00243 g011
Figure 12. Ground reaction around the tunnel obtained by EAM and FEM with the different incremental values λ in an elastoplastic media, and the distribution of (a) radial stress, (b) tangential stress, (c) radial displacement, and (d) tangential and radial stresses with λ = 1.0 (Case II and Ko = 0.8).
Mathematics 11 00243 g012
Figure 13. Comparison of the ground reaction around a circular tunnel in Case II (θ = 90°) between the EAM and FEM with λ = 1.0, the distribution of tangential and radial stresses for (a) Ko = 1.0 in the elastic media, (b) Ko = 1.0 in the elastoplastic media, (c) Ko = 0.8 in the elastic media, (d) Ko = 0.8 in the elastoplastic media, (e) Ko = 1.2 in the elastic media, and (f) Ko = 1.2 in the elastoplastic media.
Mathematics 11 00243 g013aMathematics 11 00243 g013b
Figure 14. Ground reaction around the tunnel obtained by EAM and FEM with the different incremental values of λ in an elastic media, and the distribution of (a) radial stress, (b) tangential stress, (c) radial displacement, and (d) tangential and radial stresses with λ = 1.0 (Case I, θ = 0°, along the ground surface line and Ko = 0.8).
Mathematics 11 00243 g014aMathematics 11 00243 g014b
Figure 15. Ground reaction around the tunnel obtained by EAM and FEM with the different incremental values λ in an elastoplastic media, and the distribution of (a) radial stress, (b) tangential stress, (c) radial displacement, and (d) tangential and radial stresses with λ = 1.0 (Case I, θ = 0°, along the ground surface line and Ko = 0.8).
Mathematics 11 00243 g015
Figure 16. Ground reaction around the tunnel obtained by EAM and FEM with the different incremental values λ in an elastic media, and the distribution of (a) radial stress, (b) tangential stress, (c) radial displacement, and (d) tangential and radial stresses with λ = 1.0 (Case III, θ = 180°, along the deep line and Ko = 0.8).
Mathematics 11 00243 g016
Figure 17. Ground reaction around the tunnel obtained by EAM and FEM with the different incremental values λ in an elastoplastic media, and the distribution of (a) radial stress, (b) tangential stress, (c) radial displacement, and (d) tangential and radial stresses with λ = 1.0 (Case III, θ = 180°, along the deep line and Ko = 0.8).
Mathematics 11 00243 g017
Figure 18. Ground reaction around the tunnel obtained by EAM and FEM in Case I (θ = 0°) and Case III (θ = 180°) with λ = 1.0 and Ko = 0.8, and the distribution of (a) radial stress in the elastic media, (b) tangential stress in the elastic media, (c) radial stress in the elastoplastic media, and (d) tangential stress in the elastoplastic media.
Mathematics 11 00243 g018
Figure 19. Ground reaction around the tunnel obtained by EAM and FEM in Case I (θ = 0°) and Case III (θ = 180°) with λ = 1.0 and Ko = 0.8, and the distribution of radial displacements (a) in the elastic media, and (b) in the elastoplastic media.
Mathematics 11 00243 g019
Figure 20. Ground reaction around the tunnel obtained by EAM and FEM in Case I (θ = 0°) with λ = 1.0, and the distribution of tangential and radial stresses for (a) Ko = 1.0 in the elastic media, (b) Ko = 1.0 in the elastoplastic media, (c) Ko = 0.8 in the elastic media, (d) Ko = 0.8 in the elastoplastic media, (e) Ko = 1.2 in the elastic media, and (f) Ko = 1.2 in the elastoplastic media.
Mathematics 11 00243 g020
Figure 21. Ground reaction around the tunnel obtained by EAM and FEM in Case I (θ = 180°) with λ = 1.0, and the distribution of tangential and radial stresses for (a) Ko = 1.0 in the elastic media, (b) Ko = 1.0 in the elastoplastic media, (c) Ko = 0.8 in the elastic media, (d) Ko = 0.8 in the elastoplastic media, (e) Ko = 1.2 in the elastic media, and (f) Ko = 1.2 in the elastoplastic media.
Mathematics 11 00243 g021
Figure 22. Ground reaction around the tunnel in the elastic media simulated by the EAM with λ = 1.0, and the distribution of (a) tangential stress and (b) radial displacement.
Mathematics 11 00243 g022
Figure 23. Ground reaction around the tunnel in the elastoplastic media simulated by the EAM with λ = 1.0, and the distribution of (a) plastic radius and (b) radial displacement.
Mathematics 11 00243 g023
Table 1. Input data required for calculation.
ParameterValue
Depth of tunnel crown, h (m)94.8
In situ stress ratio, Ko0.8, 1.0, 1.2
Unit weight, γ (MPa/m)0.027
Tunnel excavation radius, R (m)5.2
Poisson’s ratio, ν0.25
Elastic modulus, E (MPa)3000.0
Internal friction angle, φ (°)30.0
Cohesion, c (MPa)0.1
Dilation angle, ψ (°)30.0
Disclaimer/Publisher’s Note: The statements, opinions and data contained in all publications are solely those of the individual author(s) and contributor(s) and not of MDPI and/or the editor(s). MDPI and/or the editor(s) disclaim responsibility for any injury to people or property resulting from any ideas, methods, instructions or products referred to in the content.