Article

User2Vec: A Novel Representation for the Information of the Social Networks for Stock Market Prediction Using Convolutional and Recurrent Neural Networks

Computer Engineering Department, Amirkabir University of Technology, Tehran 1591634311, Iran
*
Author to whom correspondence should be addressed.
Mathematics 2023, 11(13), 2950; https://doi.org/10.3390/math11132950
Submission received: 17 May 2023 / Revised: 23 June 2023 / Accepted: 25 June 2023 / Published: 1 July 2023
(This article belongs to the Special Issue Computational Intelligence in Management Science and Finance)

Abstract

:
Predicting stock market trends is an intriguing and complex problem, which has drawn considerable attention from the research community. In recent years, researchers have employed machine learning techniques to develop prediction models by using numerical market data and textual messages on social networks as their primary sources of information. In this article, we propose User2Vec, a novel approach to improve stock market prediction accuracy, which contributes to more informed investment decision making. User2Vec is a unique method that recognizes the unequal impact of different user opinions on specific stocks, and it assigns weights to these opinions based on the accuracy of their associated social metrics. The User2Vec model begins by encoding each message as a vector. These vectors are then fed into a convolutional neural network (CNN) to generate an aggregated feature vector. Following this, a stacked bi-directional long short-term memory (LSTM) model provides the final representation of the input data over a period. LSTM-based models have shown promising results by effectively capturing the temporal patterns in time series market data. Finally, the output is fed into a classifier that predicts the trend of the target stock price for the next day. In contrast to previous attempts, User2Vec considers not only the sentiment of the messages, but also the social information associated with the users and the text content of the messages. It has been empirically proven that this inclusion provides valuable information for predicting stock direction, thereby significantly enhancing prediction accuracy. The proposed model was rigorously evaluated using various combinations of market data, encoded messages, and social features. The empirical studies conducted on the Dow Jones 30 stock market showed the model’s superiority over existing state-of-the-art models. The findings of these experiments reveal that including social information about users and their tweets, in addition to the sentiment and textual content of their messages, significantly improves the accuracy of stock market prediction.

1. Introduction

The stock market is one of the most critical financial markets in every country’s economy. Predicting changes in this market holds great value for both small and large investors, as well as financial analysts, since even minor fluctuations can cause significant profit or financial loss. However, the increasing interest of investors in short-term stock market investments calls for the replacement of traditional prediction methods, which were primarily focused on long-term investments, with faster and more cost-effective approaches. As prediction methods continue to advance, the information sources utilized by these models have also undergone changes over the past few decades. The widespread use of social media platforms and the dissemination of people’s thoughts, opinions, and experiences within these networks have motivated researchers to incorporate this valuable asset into their stock market prediction models. Deep neural networks have further facilitated the introduction of several innovative techniques for predicting share prices using these networks. These methods can be examined based on their prediction objectives, information sources or features, and the techniques employed.
Stock market prediction models are developed with different goals. The primary focus of stock market prediction has been on forecasting the price of a share for a specific future period [1,2]. The price of a share is a numerical value, and its variation over time is often treated as a time series in various studies [3,4]. The prediction timeframe can range from minutes to months. For instance, Di Persio et al. [5] developed a model utilizing a multi-layer RNN, an LSTM, and a gated recurrent unit (GRU) to forecast Google stock price movements. Similarly, Althelaya et al. [6] focused on evaluating and comparing LSTM deep learning architectures for the short- and long-term prediction of financial time series. Another common aim of stock market prediction methods is to determine the trend of stock prices rather than predicting exact price values. This approach treats prediction as a binary classification task, thus classifying whether the price will increase or decrease [7,8]. Some researchers have also explored the trends in market changes or market indexes, such as the Dow Jones index [9,10]. With the growing use of social networks and their impact on financial markets, the sentiment analysis of messages [11] and scoring the members [12] of these networks have attracted the attention of researchers. In this paper, our focus is on predicting the daily price trend of certain shares in the DOW30 index.
Machine learning methods for predicting stock markets use different information sources or sets of features. One of the most crucial features shared among nearly all models is market data, which includes the open/high/low/close (OHLC) prices of shares during various time periods. Data from other markets, such as oil prices, are also used in many models [13]. While classical methods were primarily limited to these numerical data, it has been shown that news and public opinions expressed in social network messages can provide valuable information for predicting market behavior. As a result, natural language processing has been employed to extract sentiment from textual data as news, blog posts, micro blogs, and messages [14]. Social information about users, such as the number of followers or the accuracy of their predictions, is also utilized as a feature to weigh their opinions. Economic data, such as knowledge graphs illustrating relationships among companies and industries, macroeconomic data for a country, and analytics data from companies, can serve as potential features for share prediction. In this paper, we propose a comprehensive model that extracts and incorporates both market data and social media information for prediction.
Over the past few decades, a wide range of methods and techniques has been utilized for stock market prediction. Traditionally, human traders have relied on fundamental and technical analysis. Fundamental analysis involves estimating the intrinsic value of a stock, while technical analysis focuses on identifying recurring patterns in OHLC candlestick charts [15]. However, automatic trading algorithms have adopted statistical and machine learning approaches for stock market prediction. Statistical methods treat the stock price over time as a time series and make assumptions of linearity, stationarity, and normality in the input data. The autoregressive integrated moving average (ARIMA) [16,17] and generalized autoregressive conditional heteroscedasticity (GARCH) [18,19] are well-known examples in this category. With the advancement of machine learning (ML) models, they have gained significant attention in stock market prediction. ML techniques can be categorized into shallow and deep learning methods. Shallow models, such as naive Bayes [20], logistic regression [21], support vector machines [22,23], decision trees [2,24], random forests [25], and early neural networks such as multilayer perceptron [26,27,28], have been extensively examined in this domain. However, following the emergence of deep learning methods, stock market prediction, as with many other data analysis tasks, has been dominated by deep neural networks [29]. Section 2 explores some models from this group.
LSTM is a type of deep network used for various tasks, particularly in handling sequential data [30,31,32]. LSTM networks are well-suited for time-series data such as stock market prediction. In this context, the sequential nature of past stock prices forms a time series, where the order of the data is crucial. The ability of the LSTM network to keep and forget information over time enables it to capture the temporal dependencies in the data [33] effectively, which is essential for accurately predicting future stock prices. Compared to other advanced models such as transformers, LSTMs have a distinct advantage. Transformers, although powerful, are not inherently designed to handle sequential time-series data, as they process the entire sequence simultaneously [34]. Transformers have gained recognition for their exceptional performance in natural language processing tasks where the parallel processing of complete sentences or documents can be beneficial. However, for time-series data such as stock prices, this approach may not always be optimal [35]. LSTM models process data sequentially, and their stateful nature makes them well-suited for problems where data order matters, as with stock prices. The LSTM architecture is specifically designed to keep past information using a mechanism called a ‘gate’. These gates control the flow of information into and out of the memory cell, thereby determining which information should be kept or discarded [36]. This capability allows LSTM models to excel at capturing long-term dependencies in sequence data, which is crucial for stock market prediction. Furthermore, the sequential processing of LSTM models can be more computationally efficient when handling long sequences [37]. Unlike the transformer model, where each element in the sequence needs to be connected to every other element, LSTM models can process the elements individually, thereby making them a more practical choice for large datasets or long sequences that are commonly encountered in stock market prediction [8]. While transformers are complex models with various parameters, LSTM models are relatively simpler and more interpretable. In practical terms, this means that understanding the predictions made by an LSTM model and diagnosing and resolving any issues that may arise during model training or inference can be easier compared to transformers [34].
CNNs, which were originally designed for image processing tasks [38,39], have also found use in time-series data prediction such as stock market forecasting. A key feature of CNNs is their ability to extract local and global features [40], which can be useful in stock prediction. For instance, local features could represent short-term fluctuations in the stock market, while global features could capture long-term trends. Combining CNNs with LSTM models allows the resulting model to both abstract features effectively (through CNNs) and understand their sequential nature. Integrating LSTM models and CNNs into a hybrid model can leverage the strengths of both architectures. In such a model, the CNN layer can extract salient features from the input data, thereby reducing its dimensionality and highlighting crucial patterns. These abstracted features are then fed into the LSTM layer, which considers the sequential dependencies among these features to make final predictions. By employing this hybrid approach, the model benefits from the ability of CNNs to identify local and global trends and the capacity of LSTM models to understand temporal dynamics, thus leading to potentially more accurate and robust predictions. Considering these considerations, the LSTM model’s ability to handle sequential data gives it an edge over the transformer model for specific tasks such as stock market prediction [41].
In this paper, we propose a general method for predicting the close price’s trend (up/down) of a stock in the next day based on the market and social networks data of the current day. In this model, a novel representation, known as User2Vec, was devised for the opinion of each investor about a stock. User2Vec is a real-valued vector composed of the investor’s message in a social network in an embedded format, the sentiment of the message, the investor’s social and prediction scores, and the market data. Despite most of the existing approaches in which the predictions of different users about a specific stock are assumed to be of the same value, our method weights these opinions in two different ways: (1) the social information is used to estimate how influential the user is, and (2) the user’s predictions in the past are used to estimate the accuracy of his predictions. In the following, a 1D-CNN stacked bidirectional LSTM is proposed to aggregate all opinions and predict the future of the stock. The proposed model was applied to several stocks in the Dow Jones market, and the results were analyzed. Through a thorough analysis of the results, we evaluated the effectiveness of our approach in enhancing the prediction of stock trends. The experimental findings show promising outcomes, thus indicating the potential value of incorporating social network data and User2Vec representation in stock market forecasting.
The main contributions of this research are as follows:
  • We presented a hybrid model that leverages diverse sources of information for stock market prediction.
  • We proposed a new representation called User2Vec, which captures each user’s tweet about a specific share.
  • We employed two user scoring mechanisms based on the accuracy of their predictions and their credibility within the social network.
  • We used 1D-CNN stacked recursive neural networks to forecast the market direction for the next day.
The rest of the paper is organized as follows: Section 2 provides a brief review of related works. The proposed model is presented in Section 3. Section 4 reports and examines the experimental results. Finally, Section 5 concludes the paper.

2. Literature Review

Each stock market prediction model comprises two primary components: the prediction method, and the features used by the model. While some researchers aim to enhance prediction accuracy by employing more advanced techniques, others focus on obtaining informative feature sets from various information sources. There are studies that report advancements in both aspects. In the following, we will first explore the machine learning methods that are commonly employed for stock market prediction and then review the features used in these models.

2.1. Prediction Methods

Regarding the first category of related works that focus on improving the prediction method, there is a wide range of algorithms and tools available for stock market prediction, such as neural networks, deep learning, support vector machines (SVMs), and random forests.
Machine learning methods have predominantly been used for technical analysis in this field, with various studies comparing various types of algorithms. Ensemble approaches such as random forests and AdaBoost, as well as single classifier models such as neural networks and logistic regression, were compared using data from 5767 businesses [42]. Sharma et al. [43] proposed using LSboost to aggregate the predictions of an ensemble of trees in a random forest (referred to as LS-RF). Each prediction model defines a set of technical indicators as inputs. The performance of the suggested model was compared to that of the well-known support vector regression model. Picasso et al. [44] incorporated technical and fundamental analysis parameters to evaluate the performance of several machine learning methods, including SVM and random forest. Various other supervised approaches, such as support vector regression (SVR) [45], multiple linear regression (LMLR) [46], and the j48 algorithm [47], have been investigated within the field of stock market prediction.
Artificial neural networks (ANN), based on several studies, have emerged as popular tools for financial prediction [48,49,50]. Most of these studies have utilized historical market data as input features. Among ANNs, the multilayer perceptron (MLP) network is widely employed for stock forecasts. MLP is a feed-forward network comprising one or more hidden layers: an input layer, and an output layer. Each layer incorporates non-linear learning capabilities. Previous studies [26,27,28] have proposed MLP networks for stock market prediction tasks. Deep ANNs are also extensively used in this field. To predict NASDAQ prices, ref. [51] tested ANNs with various structures using historical prices on four- and nine-day timeframes. Their findings indicated that deep ANNs outperformed shallow networks. Arévalo et al. [52] applied a deep ANN with five hidden layers to forecast Apple’s stock in the NASDAQ exchange, and they achieved approximately 65% directional accuracy. Chong et al. [8] explored different data representation methods, including auto-encoder, RBM, and PCA, using raw data with 380 variables. These representations were employed as input for a deep ANN in stock prediction tasks. The results indicated no significant superiority of one method over the others. Hoseinzade et al. [53] employed combinations of historical prices, technical indicators, and macroeconomic data as features. They used a CNN model to train the model in 3D spaces. The proposed model was compared to a PCA+ANN technique, and the results showed the CNN outperformed the other methods. Gao et al. [54] and Wang et al. [55] integrated attention layers with CNNs to forecast the following day’s index price based on past data. The findings suggested that the attention-based approach yielded the best results among the tested models.
Recurrent neural networks (RNNs) incorporate an internal memory, thereby enabling them to capture historical information and generate predictions [56,57]. Among RNNs, LSTM is a widely used type that has also been applied to stock market prediction. Nelson et al. [58] fed technical indicators into an LSTM to forecast price trends in the Brazilian stock exchange. The results showed the superior performance of LSTM compared to MLP. In another work, [1] introduced a recursive network, the Echo State Network (ESN), to predict S&P 500 stocks. They used various stock market features, including price, volume, and the moving average. The ESN was applied to 50 stocks and achieved an error rate of 0.0027. Ding and Qin [59] proposed an LSTM-based network with multiple inputs and outputs—specifically, the opening price, lowest price, and highest price of a stock. Their investigations revealed that the suggested model outperformed the LSTM network model and other deep recurrent neural networks in predicting multiple values simultaneously, with a prediction accuracy exceeding 95%. Jin et al. [60] incorporated investors’ sentiment into stock prediction by utilizing empirical modal decomposition (EMD) to fail the complex sequence of stock prices. They also employed an LSTM network with attention mechanisms to focus on the most relevant data. The revised LSTM model not only improved prediction accuracy, but also reduced time delay according to the study’s findings. Liu et al. [61] proposed a two-component multi-element hierarchical attention capsule network. The first component, multi-element hierarchical attention, assigned weights to valuable information from various news and social media sources. The capsule network component captured additional context information from events. Their model enhanced prediction accuracy by quantifying the diverse influences of events.

2.2. Feature-Based Methods

Market data, which encompasses the open/high/low/close (OHLC) prices of a share over a specific period, stands as the most prevalent feature employed in nearly all prediction algorithms in this field [6,62,63,64]. The time of measurement (ranging from seconds to months) and the number of measurements used as inputs in the model may differ across various models.
In recent times, social networks have significantly influenced various aspects of human life, including financial markets. Social networks have a notable impact on financial markets through user interactions, opinion sharing, engaging in discussions, and following trusted individuals. Social trading is a specific form of this phenomenon, where investors observe and replicate the strategies of experts or peer traders. Within common social networks, two vital sources of information are the messages posted by users and the social information related to users themselves, such as following relationships. These aspects are further explored below. Concerning social network textual messages, sentiment analysis is a prevalent tool used to extract users’ opinions about shares, with the aim to classify the sentiment as positive, negative, or neutral [14]. Notably, the study conducted by Nelson et al. [65] represents one of the earliest attempts to forecast stock fluctuations using Twitter data.
To accurately assess stock market sentiment, the researchers evaluated a random subsample of tweets over six months and subsequently determined the correlation between this data and future stock market indicators. Baker et al. [66,67] developed a sentiment index that captures changes in investors’ sentiments. They showed that fluctuations in this index impacted investors and stimulated changes in the overall stock market. Gilbert et al. [68] suggested that an individual’s emotional state influences their decision making and confirmed that sentiment inferred from web content contained information that could forecast stock prices. While some studies have shown a correlation between emotional trends in internet comments and stock market movements, few have attempted to predict stock prices using sentiment analysis. For instance, Guo et al. [69] proposed a technique based on the hot optimization route, which examined the relationship between user mood and the stock market by analyzing user review data from a stock review website. Zhou et al. [70] achieved a stock market prediction accuracy of 64.15% using the SVM-ES model, wherein they incorporated social sentiments such as contempt, pleasure, melancholy, and fear. Picasso et al. [44] employed data science and machine learning tools to combine technical and fundamental assessments. The result was a predictive model capable of forecasting the trajectory of a portfolio comprising the twenty most-capitalized enterprises in the NASDAQ100 index. Bouktif et al. [71] employed improved sentiment analysis to assess the predictability of stock market directions. They delved deeper into stocks by examining various factors such as historical stock price, sentiment polarity, subjectivity, N-grams, custom text-based features, and feature delays. By employing advanced causality analysis, algorithmic feature selection, and machine learning techniques, including regularized model stacking, they collected and evaluated data from 10 major NASDAQ shares across diverse stock domains. Their method achieved a 60 percent accuracy rate, which surpassed existing sentiment-based stock market prediction algorithms, including deep learning. Alhamzeh et al. [72] analyzed innovative data sources, specifically StockTwits paired with financial news, and tackled the problem as a binary classification task. They adopted a hybrid approach that combines sentiment and event-based features. The findings indicated that StockTwits data outperformed price data in predicting the closing prices of eight NASDAQ100 companies. Another valuable information source from social networks is user-related data, including the user’s influence within the network and the accuracy of their predictions. Kamkarhaghighi et al. [12] examined the relationship between a Twitter user’s influential power in stock market prediction and their social network information, including details about their followers. They identified several active users in the stock exchange as valuable users and calculated a score for the accuracy of each user’s predictions. By setting a threshold to distinguish valuable and non-valuable users, they trained and reported the accuracy of a naive Bayes model using attributes such as the number of followers and the number of related followers of users. Ultimately, they concluded that users’ profile information could provide insights into their influence on the stock market. Bujari et al. [73] explored the relationship between various social features, including the number of each user’s followers and the volume of tweets related to each stock, in relation to that stock’s market data. The results revealed that predictive features for each stock differ, and there is no general model that applies to all stocks.

3. Materials and Methods

Figure 1 outlines the overall structure of our proposed model. The proposed model comprises three steps: (1) data collection, (2) feature extraction, and (3) prediction. Initially, input data is gathered from various sources, including text messages posted on social networks, social information related to the users, and market data containing the (open, high, low, close, Adj close, volume) prices of the target share at each time step. Twitter is a preferred data source for large-scale data analytics projects because of its appeal across the 5 Vs: Volume, Velocity, Variety, Value, and Veracity. It offers a vast volume of data generated daily, thus showcasing the rapid velocity of real-time data generation and sharing. Twitter shows variety by providing diverse data types and supporting multiple languages. The data obtained from Twitter holds value because of its ability to provide timely insights into user behavior and trends. However, it is important to consider the veracity of the data, as its reliability and accuracy can vary because of the diverse user base. Yahoo Finance is utilized as another source for extracting daily market data. The second stage of the model focuses on extracting valuable features from the raw data obtained in the previous step. These features are represented by a numerical vector known as User2Vec, which encodes user-specific information into a vector format. Figure 2 illustrates the five distinct features comprising the User2Vec. Various components are proposed to calculate the values of these features based on the gathered data. The social network analysis module provides social information about the message authors, such as the number of followers and friends, thereby indicating their importance within the network. The text messages of users undergo preprocessing and are then encoded using a word-embedding network. Subsequently, they are processed by a sentiment analyzer that generates embedded text and sentiment features. The financial data is used to determine the actual label representing the market’s direction. The user’s score is computed based on the number of accurate and inaccurate predictions they have made. Finally, the market data is encoded into a set of features. Each message posted on the monitored social network generates a corresponding User2Vec vector. These vectors encapsulate the user’s opinion about the target share, their score, and their social information, along with the market data from the current day. Deep neural networks of various types are employed to integrate this information and predict the direction of the share for the following day. The subsequent sections provide further details on the different components of the model.

3.1. Data Collection

Subsequent sections provide details on data collection and utilized tools. Each set of features in our proposed model was obtained from a specific source. While there may be additional fields in the data collected at each stage, only those included in the User2Vec feature set were used in this research. The datasets generated and analyzed during the current study are available in [74].

3.1.1. Yahoo Finance App

Many free websites and software platforms, such as Yahoo and Google, offer online trading services and immediate stock market statistics for the New York and NASDAQ exchanges. However, these statistics are subject to a 20 min delay for public access and are only available without delay to brokerage clients. For this study, we gathered price information for each stock from the Yahoo website on specific dates. In order to ensure the practical applicability of our proposed model, we focused on predicting the direction of the next day’s price rather than the actual price value itself. To achieve this goal, we employed the approach of predicting the market direction as the target variable using the following equation:
0 , i f ( N e x t D a y C l o s e P r i c e N e x t D a y O p e n P r i c e ) ( N e x t D a y O p e n P r i c e ) 0 1 , i f ( N e x t D a y C l o s e P r i c e N e x t D a y O p e n P r i c e ) ( N e x t D a y O p e n P r i c e ) > 0 .
This equation considers the relative increase or decrease in the price of each share and enables us to make informed investment decisions by considering market activity. The data collection process from the Yahoo website was facilitated through the utilization of the Yahoo Finance tool. In Table 1, we present the data samples extracted for Apple stock, including their corresponding starting prices. By accurately predicting the direction of price movements, our model aims to provide valuable insights and help make informed investment decisions.

3.1.2. Twitter API

Various APIs have been developed to extract data from Twitter, which is widely recognized as a public platform. In this study, we used three tools, namely GetOldTweets3 (https://pypi.org/project/GetOldTweets3/, accessed on 2 December 2020), Tweepy (https://pypi.org/project/tweepy/, accessed on 2 December 2020), and Textblob, to collect data from Twitter. Each of these tools has its own capabilities and limitations for accessing and retrieving tweets. GetOldTweets3 is a free service that enables searching through older tweets using hybrid and word search techniques. It provides essential information such as tweet ID (str), permalink (str), username (str), recipient (str), text (str), date and time (DateTime) in UTC, number of retweets (int), number of favorites (int), number of mentions (str), number of hashtags (str), and geolocation (str). Although the data obtained from GetOldTweets3 is informative, it does not include crucial social information, such as the number of followers and followings. To retrieve additional relevant social information for each user, we utilized Tweepy. Last, Textblob, another program used in this study, can extract the emotional sentiment of a tweet.

3.1.3. Statistical Analysis of the Collected Messages

Data was collected from the beginning of 2018 until the end of 2019 for all shares, and, for AAPL, data collection extended until the end of 2020. The total number of tweets collected over the two-year period varied for each share because of differences in the number of tweets per day. Table 2 presents the number of samples collected per share, including information on the related hashtags, the count of positive and negative tweets, and the number of unique user IDs.

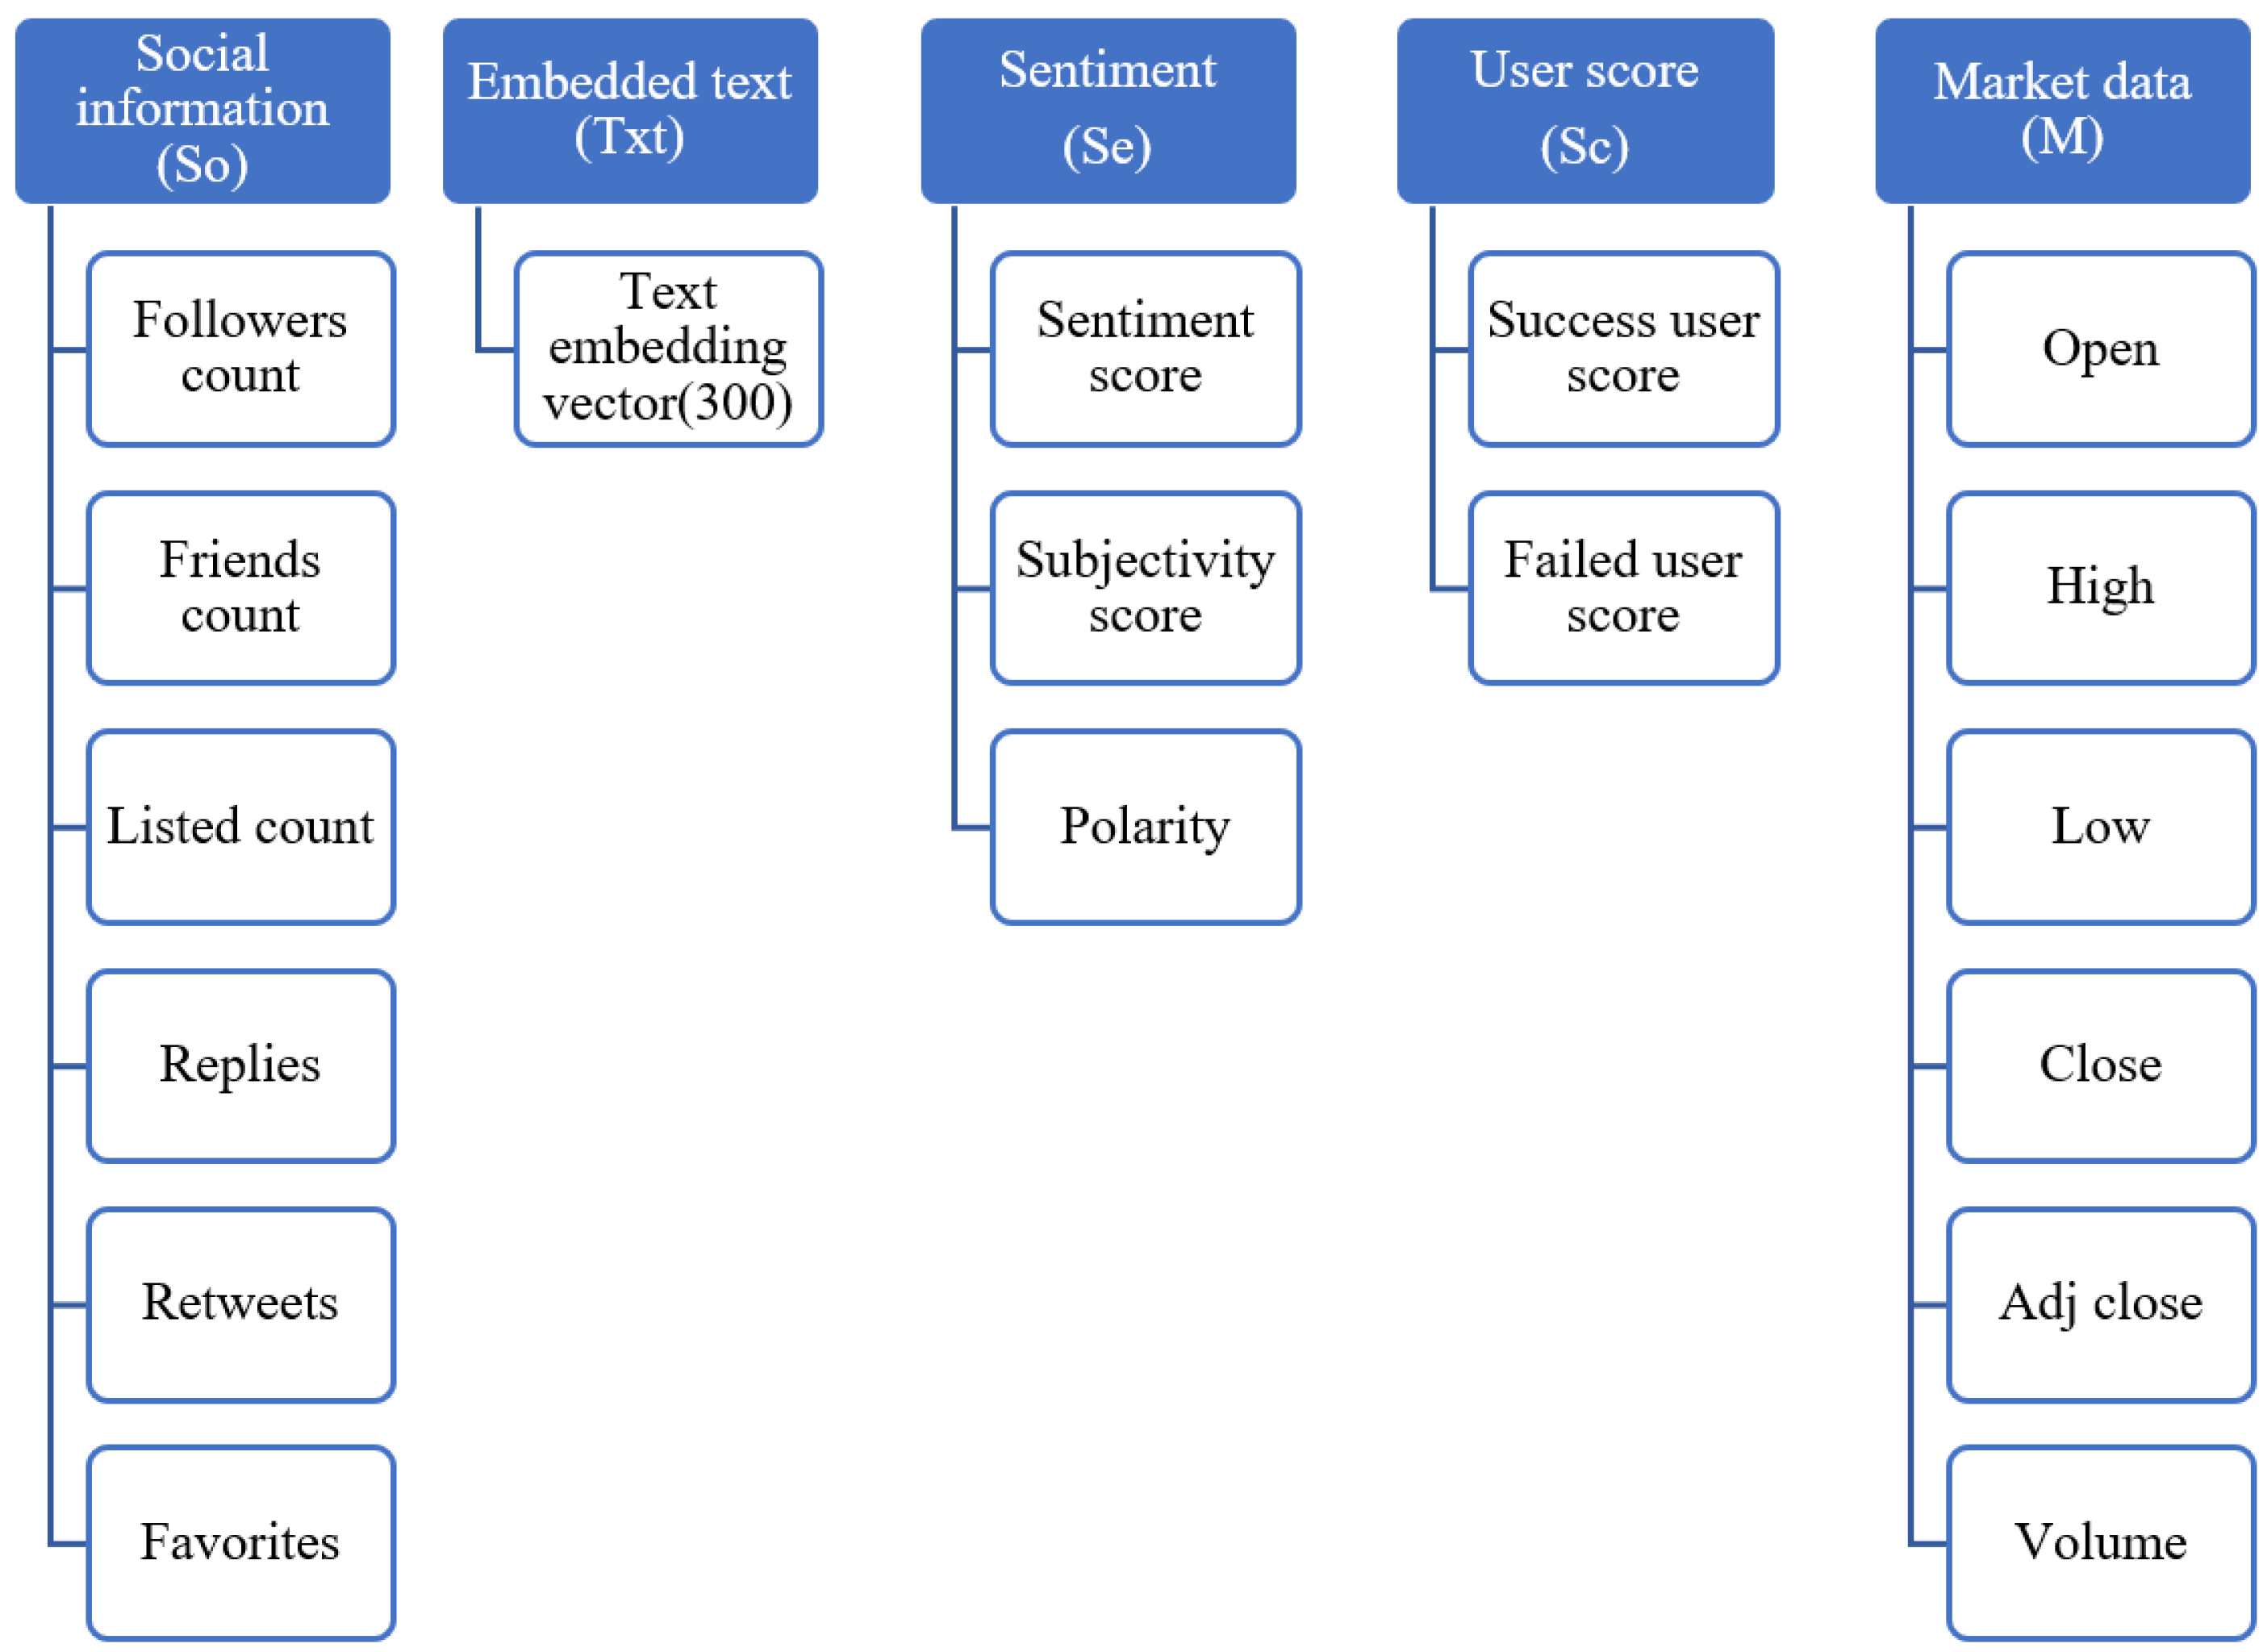
3.2. Feature Extraction

In this section, we delve into a more detailed examination of each of the features employed in the proposed User2Vec model.

3.2.1. Social Information

The social characteristics of a user or their tweets in a social network can significantly influence the impact of their comments on other users and future market changes. For instance, popular users are expected to have a higher level of effectiveness, since their messages reach larger communities compared to unknown users. Similarly, tweets that have been viewed or liked by a greater number of users have a wider reach among other users. Various metrics can measure a user’s activity or reach on Twitter. For instance, key features that can be used for this purpose include the number of followers a user has, the number of users they follow, and the frequency of retweets their tweets receive. Figure 2 illustrates different aspects of these features.

3.2.2. Embedded Text

The text of a user’s tweets on a social network can contain their opinions or news about a stock, which can influence the opinions of other users and market investors, thus ultimately impacting the future direction of the stock in the market. Therefore, this information can serve as an effective feature for market prediction. Incorporating the text of tweets, along with their emotional labels, can reduce the model’s reliance on the accuracy of the sentiment analyzer, thus enhancing the final accuracy of the model. To use the text of each tweet as a feature in the User2Vec model, we required a concise, effective, and consistent representation. This representation was generated by breaking the text of each tweet into its constituent words, thereby treating each tweet as a sequence of words. In the preprocessing step, all stop words and punctuation were removed from the tweets. This removal improves the overall accuracy of the model and enables the classifier to learn better features. The resulting sequence of words can be represented as [ x 1 , x 2 , , x n ] , where x i R k is a k-dimensional word vector corresponding to the i-th word in the sequence. In this process, we utilized the pre-trained Word2vec model [75] to map each word to its respective embedded vector. Subsequently, the text of each tweet, being a sequence of fixed-length vectors, was transformed into a single vector. To achieve this transformation, various techniques such as the maximum (max), minimum (min), or average (ave) embeddings of all words in a tweet were widely used [76,77]. In our approach, we employed the average technique to convert the embedding vectors of the tweet’s words into a k-dimensional vector as follows:
S = a v e ( x 1 , x 2 , , x n ) ,
where n is the number of words in a tweet.

3.2.3. Sentiment

The emotional label of a tweet reflects the user’s opinion regarding the desired share at the time the tweet was sent. As a result, it can serve as an important feature in the User2Vec model. The distinction between the User2Vec model and previous approaches lies in how this feature is utilized. In the User2Vec model, the significance of each tweet is determined by employing a deep neural network to incorporate the other proposed user features. Conversely, most previous works rely on calculating the numerical sum of the emotional labels from all users as the final feature for predicting market trend changes. In this study, the TextBlob tool was used to extract the emotional tag of each tweet. This tool provides properties such as subjective, objective, and sentiment for each tweet. The subjective and objective properties are numerical values ranging from 0 to 1, while the sentiment categorizes tweets as negative, positive, or neutral.

3.2.4. User Score

The ability of a user to predict future market changes for a specific share can assess the importance of their comments regarding that share. A user who has showed accurate predictions in the past is likely to continue making correct predictions in the future. Therefore, this feature can be leveraged to estimate the significance of each user’s opinion. It is important to note that a user’s success rate may vary across different shares. Some users might excel at predicting changes in certain shares while not performing as well in others. It becomes necessary to calculate the successes and failures of a user for each individual share separately. To determine a user’s success rate for a particular share, we employed sentiment analysis methods to extract the user’s opinions concerning that share. Subsequently, by comparing these opinions with the actual market data, the accuracy of each prediction can be assessed, and the number of successes and failures can be tallied. Let S t i represent the prediction of tweet i posted at time t regarding a target share, and let R t denote the actual direction of that share at the same time step. The score of the corresponding tweet can then be calculated as follows:
T w e e t S c o r e i = 1 i f s t i = R t 1 i f s t i R t .
Based on the individual scores of the tweets mentioned above, the total scores for correct and incorrect predictions made by user u can be derived using the following equations:
S u c c e s s U s e r S c o r e u = i , u s e r i = u I ( T w e e t S c o r e i = 1 )
F a i l u r e U s e r S c o r e u = i , u s e r i = u I ( T w e e t S c o r e i = 1 ) ,
where u s e r ( i ) represents the user ID of the individual who posted tweet i, and I is an indicator function that yields 1 when the specified condition is true and yields 0 if otherwise. The users’ scores are updated at each time step, and, in the proposed model, the final scores of the users were used.

3.2.5. Market Data

Market features comprise six components: OHLC features (open, high, low, and close prices), Adj Close, and volume. The adjusted closing price considers various factors that can influence stock prices after the market closes, such as stock splits, dividends, and rights offers. Volume reflects the number of shares traded. These features are widely employed in many stock market prediction models, as they help expect the future changes in stock prices by capturing the price fluctuations during the current time period. In most instances, market data from preceding days have proven effective in predicting future changes.

3.3. Prediction

The goal of this section of our proposed model is to predict the direction of the market by leveraging the capabilities of deep recurrent neural networks. Figure 3 depicts the comprehensive architecture of the prediction model introduced in this study. The model undergoes an end-to-end training process using the User2Vec feature vectors outlined in the preceding section. To accomplish this, a fusion of CNNs and a stack of bidirectional LSTM networks are employed to process the User2Vec and generate a condensed, high-level feature vector for each day. Subsequently, this extracted feature vector is inputted into a two-layer fully connected network, thereby enabling the prediction of market direction as either bullish or bearish. In the following, we explain the structures of the CNN and LSTM model used in the proposed model.
  • CNNs have shown their versatility and effectiveness in handling a wide range of data types, including sequences of embedded word vectors. Our proposed model uses a CNN network to process the feature matrix obtained from both numerical and textual data. The structure of the feature matrix is such that each row represents the feature vector of a specific tweet combined with the corresponding numerical market data, while each column captures a distinct feature containing relevant information. To extract meaningful patterns from the feature matrix, our model incorporates two convolutional layers within the CNN component. Each layer comprises fifty 1D filters, thereby enabling the model to capture and analyze local dependencies within the data effectively. Following the convolutional layers, we introduce a batch normalization layer to enhance the performance of the model and stability. This layer normalizes the intermediate outputs of the network, thereby mitigating the impact of internal covariate shifts, as well as improving overall training efficiency and the ability of the model to generalize. By harnessing the power of CNNs in our model architecture, we can efficiently process the combined numerical and textual data. This enables us to extract relevant features and facilitate subsequent analysis for market prediction purposes.
  • In our model, we used stacked bidirectional LSTM layers to generate a concise representation of the input data for predicting stock market direction, thus building upon the output of the CNN networks. Stacked structures, comprising two or more LSTM layers, are employed to capture increasingly complex data patterns. In a stacked RNN, the output of the lower layers serves as input for higher layers, thereby enabling the model to achieve varying levels of abstraction across multiple network layers. According to theoretical evidence, a deep hierarchical model can represent some functions more efficiently than a shallow one [78]. Traditional RNNs have a limitation in that they only consider previous context and disregard future context. However, bidirectional LSTM models overcome this limitation by processing data in both forward and backward directions, thereby effectively incorporating both past and future context. Our model incorporates stacked bidirectional LSTM layers to leverage this advantage. The feature vectors obtained from the outputs of the CNNs are fed into the cells of the first bidirectional LSTM network. One LSTM layer processes the data in its original order, while the other LSTM layer performs the same task in reverse. Each input vector generates two independent output vectors from these two networks: one considering the previous inputs and the other considering the future inputs. These two outputs are concatenated to form an intermediate representation for each input vector, which is then passed as input to the second bidirectional LSTM network. The second network operates similarly, thus producing the final representation of the input data for the last layer. The LSTM transition equations are as follows:
    i t = σ g ( W i x t + U i h t 1 + b i )
    f t = σ g ( W f x t + U f h t 1 + b f )
    c t = f t c t 1 + i t σ c ( W c x t + U c h t 1 + b c )
    o t = σ g ( W o x t + U o h t 1 + b o )
    h t = o t σ h ( c t ) ,
    where x t represents the input at time step t, i t displays the input gate activation, f t represents the forget gate activation, c t serves as the memory cell state, o t represents the output gate activation, and h t is the hidden state at time step t. W and U are weight matrices, and b denotes bias vectors. The activation functions used are the sigmoid function ( σ g ) and the hyperbolic tangent function ( σ c and σ h ).
    The output of the LSTM layers provides a bullish or bearish label, thereby representing the prediction of the network for the market direction of the following day.

4. Experimental Analysis

4.1. Evaluation Metrics

In this paper, the proposed model was evaluated using four measures: precision, recall, F-measure, and accuracy. These measures are calculated as follows:
P r e c i s i o n = T P T P + F P
R e c a l l = T P T P + F N
F m e a s u r e = 2 P r e c i s i o n R e c a l l P r e c i s i o n + R e c a l l
A c c u r a c y = T P + T N T P + T N + F P + F N ,
where T P represents the number of positive samples correctly classified as positive, T N represents the number of negative samples correctly classified as negative, F P represents the number of negative samples incorrectly classified as positive, and F N represents the number of positive samples incorrectly classified as negative. In this context, the labels “bullish” and “bearish” correspond to positive and negative labels, respectively.

4.2. Experiment Setup

Table 3 presents the optimal network structure and parameter settings for our proposed model, which includes the 1D-CNN, stacked bidirectional LSTM layers, and dense layers. As shown in the table, our model’s CNN module comprises two convolutional layers accompanied by their respective batch normalization layers. To minimize computational requirements, only 50 tweets per day were utilized in the model. The input tweets were selected from the messages of the most popular accounts. For all experiments, 80% of the data was allocated for training the model, while the remaining 20% was reserved for testing. The train and test data were chosen from distinct time periods to ensure that the test set was entirely independent from the training data.

4.3. Pre-Processing

The User2Vec feature set was utilized as the input of the prediction model. However, these features could not be directly used and required pre-processing. In the following, we describe the pre-processing steps undertaken.
  • Weekend data exclusion: To preserve the integrity and accuracy of our dataset, we performed a meticulous data pre-processing procedure to eliminate information pertaining to weekends or holidays. This aspect holds significant importance in financial data analysis, since markets are commonly closed during these time periods, thus introducing potential irregularities into the data. By excluding weekends and holidays from our dataset, we concentrated our analysis only on trading days when the market was active. This approach ensures consistency within our data and prevents any distortions or biases that may arise from incorporating non-trading days.
  • Time zone alignment: Achieving the proper alignment of time zones between financial data and text data is of paramount importance to ensure accurate analysis and the seamless integration of information. By establishing consistent time zones, we effectively eliminate discrepancies and allow for a seamless merging of these two essential data sources. In this study, we adopted the United States Eastern Time Zone as our reference time zone for data processing.
  • Normalization: In order to mitigate multivariate value divergence, the numerical characteristics were standardized using min–max normalization, thereby ensuring that their values fell within the range of [ 0 , 1 ] . This was achieved by linearly transforming the data values. The equation below describes the min–max normalization for feature vector x.
    The min–max normalization formula for normalizing a value x i to a target interval [ n m i n i , n m a x i ] with original boundaries [ m i n i , m a x i ] is represented as:
    N o r m ( x i ) = x i m i n x m a x x m i n x ,
    where x i is the i-th element in x. m i n x and m a x x denote the minimum and maximum values of x.
  • Tweet embedding layer: Word-embedding networks assign each word in a text to a D-dimensional vector space, which can subsequently serve as input for a neural network. Here, we utilized the word2vec word-embedding network, which was trained on a corpus of 100 billion words sourced from Google News. This network assigns a 300-dimensional vector to each of the 3 million words within its vocabulary. Each word in a tweet’s text is converted to a 300-dimensional vector. Then, by averaging these vectors, a 300-dimensional representation is produced for each tweet.

4.4. Model Performance

The aim of this section is to assess and analyze the accuracy of the predictions made by our proposed model. In order to achieve this, we compared the accuracy of our model with various baselines and state-of-the-art models in the field. We examined the impact of different components of the proposed model on the prediction accuracy.

4.4.1. Ablation Study

In this section, we investigated the impact of various components of our proposed User2Vec representation on the predictive accuracy of our model. We compared the outcomes of various variants of our model with several baselines. In the following section, we begin by introducing the baseline and the different versions of our model, and we then subsequently review their respective results.
Baselines: We compared the outcomes of our proposed model with those of several methods, commonly known as baseline methods, in previous works within this field for predicting the direction of the stock market one day in advance. The baseline models used for comparison in this study include the following:
  • Rand: A naive Bayes predictor that disregards all tweets and generates random predictions for market directions, with a 50% probability of success for both upward and downward trends.
  • Arima(M) [17]: A traditional prediction method that solely relies on market information.
  • SBiLSTM-Day2Vec(M,Se) [6]: A state-of-the-art deep neural network baseline that predicts stock trends by incorporating a sequence of market data (M) and sentiments of the messages (Se) for each day. Many previous works in the field use this model with variations, such as using daily aggregated sentiment or incorporating additional layers such as attention [26], ref. [55], to predict the stock’s direction. Unlike our proposed model, which uses the sentiment of each tweet separately, this model aggregates the sentiment for an entire day.
User2Vec variants: We investigated several variations in our proposed model, with each utilizing a distinct subset of the proposed feature set. The prediction network structure remained consistent across all models. The objective was to assess the influence of each feature and combinations thereof on enhancing the accuracy. The models are outlined as follows:
  • User2Vec (M,Se): This model incorporates market data and sentiment analysis as its feature set, which is a commonly employed approach to stock market prediction. Many prior studies have utilized these features in their models. Comparing the results with the outcomes of the baseline models is limited to the market data and sentiment tag (SBiLSTM-Day2Vec(M,Se)), which allows us to observe the impact of the primary contribution of this paper: converting each tweet of a user into a vector instead of converting all messages of a day into a vector.
  • User2Vec(Txt): In this model, solely the text section of the tweet is utilized to construct the input vector. This approach aims to investigate whether utilizing the text of the tweets directly can be effective or if it is preferable to employ the extracted sentiment from them.
  • User2Vec(Txt,M,Se): By comparing the results with a model that only uses the market and sentiment data, we can examine the effect of using the embedded text representations of tweets to enhance the accuracy of the model’s predictions.
  • User2Vec(Txt,M,Se,So): By comparing the results with the previous model, we can determine whether incorporating a social analysis of users can enhance the prediction accuracy or not.
  • User2Vec(Txt,M,Se,Sc): Similarly to the previous model, this model explores the impact of utilizing users’ scores on the model’s success rate.
  • User2Vec(M,Se,So): The only missing feature in this model is the text of the tweets. As the length of the embedded text is significantly larger than the numerical features, excluding this feature reduces the input size and the model’s parameters. Compared to the full model, the objective of this model is to examine the contribution of the textual component of the input data.
  • User2Vec(Txt,M,Se,So,Sc): This represents the complete version of our proposed model, wherein it incorporates the entire set of features.
Results All the aforementioned models were trained and tested using data from Apple’s stock, and the results are presented in Table 4. Based on these results, all the User2Vec models outperformed the baseline models in terms of accuracy. This reveals the effectiveness of the concept of converting each user’s opinion into a vector and utilizing a specific number of these vectors daily to predict the market trend for the following day. Specifically, the accuracy of our proposed User2Vec(M,Se) model significantly surpassed that of the SBiLSTM-Day2Vec(M,Se) model, which employed the same feature set but aggregated the entire message content of a day into a single vector.
Another significant finding from this experiment pertains to the impact of text features. Sentiment analysis is the most prevalent application of tweets or news text in stock market forecasting. In most studies, the market’s direction is subsequently predicted based on the sentiment analysis of tweets for each day. The text of the tweets is not directly utilized in these models. Constraining the models to interpret only three distinct sentiments (positive, negative, and neutral) from each tweet leads to a loss of valuable information inherent in the tweet’s text. Furthermore, the performance of the model is also constrained by the accuracy of the sentiment analysis method. In our proposed model, we directly incorporated the text of each tweet, along with its sentiment, as part of the feature set to address these limitations. Based on the results presented in Table 4, including the textual content in addition to the sentiment score enhanced the accuracy from 71% in User2Vec(M,Se) to 74% in User2Vec(Txt,M,Se), and from 72% in User2Vec(M,Se,So) to 78% in User2Vec(Txt,M,Se,So).
The next feature examined in this experiment is the social status information of Twitter users. This feature is seldom used in stock market prediction. In previous studies, relevant social features have been identified first, and then tweets were selected based on the values of these features. However, in our approach, we selected tweets from users with the highest number of followers each day and incorporated all the social information from those tweets in our proposed feature set. It is also obvious that individual messages from a particular user can exert differing impacts on the prediction. For instance, a message that garners more attention and is retweeted multiple times holds greater significance in predicting the future of a stock. Therefore, we also considered the social information conveyed by the messages. As the results indicate, incorporating social information improved the model’s accuracy from 74% in User2Vec(Txt,M,Se) to 78% in User2Vec(Txt,M,Se,So), from 73% in User2Vec(Txt,M,Se,Sc) to 75% in User2Vec(Txt,M,Se,So,Sc), and from 71% in User2Vec(M,Se) to 72% in User2Vec(M,Se,So). The results indicate that incorporating user scores not only cannot increase the accuracy, but also decreases it, wherein it was reduced from 74% in the User2Vec(Txt,M,Se,So) model to 73% in the User2Vec(Txt,M,Se,So,Sc) model.

4.4.2. Analysis and Comparison with the State of the Art

Based on the results got from the previous experiment, the User2Vec(Txt,M,Se,So) model was chosen as the final configuration of our proposed model. This model incorporates market data, tweet sentiment, the social information of users and tweets, and the text of the tweets. The model was applied to various companies within the Dow 30 stocks, and the results for predicting the next day’s closing price are presented in Table 5. The findings reveal that the AAPL achieved the highest accuracy, while the mean accuracy for the other stocks exceeded 60%. Upon closer examination of the stocks with lower prediction accuracies, such as GS and IBM, it becomes apparent that these companies generate less buzz on social media, resulting in a considerably smaller number of messages about them compared to companies with higher prediction accuracies like AAPL. This discrepancy is also clear in the number of unique users (IDs) who have tweeted about these stocks. For instance, while 63,355 users expressed their opinions about AAPL, the corresponding number for GS was only 182. Once again, this highlights the significance of expert opinions within our proposed model.
Our proposed algorithm was compared with eight state-of-the-art models, specifically those of Sharma et al. [43], Jin et al. [60], Liu et al. [61], Bouktif et al. [71], Mehta et al. [79], Wang C et al. [80], Wang Z et al. [81], and Wang J et al. [82]. Proposed with Transformer is a model that uses a transformer instead of LSTM. This comparative study was meticulously conducted to reveal the superiority and effectiveness of our model in the domain of stock market prediction. The comparative results are summarized in Table 6, which showcase the performance of all the models on Dow 30 stocks. In every key performance metric, our proposed model outperformed the others. Notably, it superseded the model by Wang J et al. [82], which was our stiffest competition across all criteria. The enhanced performance of our model is striking when considering the reduction in error. In two primary evaluation metrics, namely, accuracy and F-measure, our model successfully diminished the error rate by over 12% and 9%, respectively. This substantial decrease in error is a testament to the superior predictive capabilities of our algorithm. A comparison of our model with Proposed with Transformer helped to highlight the importance of LSTM over the transformer model. This comparison was insightful, as it revealed a significant reduction in the error rate by approximately 8.49% when using LSTM. This result further underscores the effectiveness of LSTM in handling the intricacies of time-series data, such as stock market prices, and its role in bolstering the accuracy of our proposed model.
Figure 4 presents the receiver operating characteristic (ROC) curves for the methodologies highlighted in Table 6. The area under the curve (AUC), a scalar measure of a classifier’s performance, was used to supplement our analysis. An AUC score of 1 signifies impeccable discrimination, while a score of 0.5 reflects an absolute lack of discrimination akin to random guessing. Notably, our proposed method surpassed all the other methods in achieving a remarkable AUC of 0.64. This superior performance underscores its substantial ability to accurately differentiate between positive and negative outcomes, thus bolstering the standing of our proposed method as an effective tool for stock market prediction. The Proposed with Transformer method secured an AUC of 0.60, thus highlighting its reliable ability to discern between positive and negative instances. These findings further emphasize the resilience and effectiveness of our proposed approach, whether it is implemented independently or in tandem with a transformer architecture. In contrast, the models presented by Wang J et al., Wang Z et al., and Wang C et al. [80,81,82], achieved only modest AUC values of 0.57, 0.53, and 0.53, respectively. While their discriminatory capabilities were satisfactory, they fell short when compared to our proposed methods. Further down the performance spectrum, Mehta et al., Bouktif et al., Liu et al., Jin et al., and Sharma et al. [43,60,61,71,79], demonstrated lesser performance, with AUC values spanning from 0.51 to 0.44. Among these, Sharma et al. found itself at the bottom with an AUC of a mere 0.44, which is only slightly better than pure chance. Our ROC analysis provides a clear demarcation of the varying performances of the evaluated methods. The unmatched predictive capacity of our proposed method, both independently and with a transformer, exemplifies the effectiveness of our approach. This analysis not only paves the way for potential improvements, but also unveils promising applications in the realm of stock prediction.
Finally, we conducted statistical tests to evaluate the significance of the superiority of our proposed model. To achieve this, we extracted 10 train/test datasets from the original dataset and calculated the accuracy of both models for each dataset. Out of all the models studied, only the implementation of SBiLSTM-Day2Vec(M,Se) was available for comparison. By performing a t-test between our proposed model and the SBiLSTM-Day2Vec(M,Se) model, we obtained a p-value of 0.0002 and a t-value of 6.2006. These results clearly indicate that there was a significant difference between the outcomes of the two models. The average accuracy of our model across these ten runs was 74, with a standard deviation of 4. In contrast, the SBiLSTM-Day2Vec model had a mean accuracy of 62 and a standard deviation of 0.5.

4.4.3. Discussion

Our research introduced the novel User2Vec model for predicting stock market trends. A unique feature of User2Vec is its capacity to assign weights to different user opinions based on their respective social metrics, thus recognizing that each opinion carries varying levels of influence on specific stocks. This model effectively integrates and processes various sources of information, including numerical market data, sentiment from social network messages, the textual content of messages, and associated social information of users. Empirical studies conducted on the Dow Jones 30 stock market show a clear enhancement in prediction accuracy, thereby demonstrating the superiority of User2Vec over existing state-of-the-art models. Most existing models in this domain predominantly focus on numerical market data and the sentiment analysis of social network messages. However, our User2Vec model expands on these traditional approaches by assimilating not only the sentiment, but also the social information associated with the users and the textual content of the messages. Previous models often fall short in effectively integrating these disparate sources of information, which presents a significant gap in the existing research. Our approach addresses this gap by offering a holistic approach to data assimilation that significantly improves prediction accuracy. The enhanced accuracy of User2Vec is likely because of its unique approach in considering the varying influence of different user opinions. Traditional models often treat all user opinions equally and neglect the reality that certain users or messages may have a larger impact on stock performance. By encoding each message as a vector and feeding it into a convolutional neural network, our model effectively processes a vast array of information from different sources. It subsequently uses a stacked bidirectional LSTM model to provide a comprehensive representation of the input data over a period. Our findings support the value of considering the social information associated with users and messages. This inclusion recognizes that the context in which an opinion is formed and shared can have significant bearing on its weight and impact, thus offering more nuanced predictions.
While User2Vec offers an innovative framework for predicting stock market trends, it is crucial to recognize its limitations. One potential drawback lies in its dependence on the precise social metrics used to assign weight to user opinions. If these benchmarks are inaccurate or skewed, it could negatively affect the model’s predictive performance. User2Vec’s evaluation was primarily focused on the Dow Jones 30 stock market, which leaves the model’s broad applicability to other markets or sectors unproven. Future research needs to address these limitations by enhancing both the model’s applicability and robustness. Another potential pitfall is the noise and misinformation within social network textual messages. Platforms such as these are prone to fake news, spam, and manipulation, which potentially could lead to imprecise sentiment analysis and skewed user opinion perceptions. Such inaccuracies could compromise the reliability of user opinion weights and subsequently impair the model’s predictive precision. It is imperative for future research to explore methods to counteract such noise and misinformation, such as implementing robust filtering algorithms or integrating credibility assessments of user-generated content. The model’s dependence on historical data for training and evaluation raises questions about its adaptability to changing market dynamics. Given the stock market’s susceptibility to evolving trends, patterns, and shifts in investor sentiment, the capacity of the model to adjust to new market conditions and change its predictions accordingly remains unclear. Future studies could investigate approaches to incorporating adaptive learning techniques or integrating real-time data streams to improve the model’s adaptability. The computational complexity of the User2Vec model may also present scalability issues. The processes of encoding messages, training deep learning architectures, and conducting comprehensive evaluations require substantial computational resources and time. With the continuously growing volume of social network data, optimizing the model’s efficiency and scalability is crucial. Future research should investigate techniques to optimize computations and improve User2Vec’s scalability, thereby facilitating its applicability to larger datasets and supporting real-time prediction systems.
Integrating multicriteria decision-making methods, such as the Analytic Hierarchy Process (AHP), the Technique for Order of Preference by Similarity to Ideal Solution (TOPSIS), or Multi-Attribute Utility Theory (MAUT), might offer a more nuanced approach to understanding and quantifying the impact of user opinions on stock market predictions [83,84]. These multicriteria methods are adept at handling complex decision-making scenarios involving multiple factors. Their implementation could help to capture the multifaceted nature of user opinions and the diverse ways these opinions can influence stock market trends. The exploration of hybrid methodologies, which would combine multicriteria methods with complementary techniques such as machine learning, artificial neural networks, or clustering algorithms, could be valuable. Such an approach would provide a more comprehensive perspective to leverage both quantitative and qualitative information to weight user assessments more accurately and reliably. A promising research direction might be the introduction of a dynamic weighting system, where the weights of user opinions are continuously updated based on their predictive accuracy. This could aid in more precisely and adaptively identifying influential users. Future work could investigate User2Vec’s robustness by testing it against other financial markets and comparing its performance with other state-of-the-art models. This could not only validate the model’s generalizability but also offer further insights into how the integration of social metrics can enhance stock market prediction across different contexts. Last, the potential for real-time prediction and analysis should be explored by developing strategies for the model to react to rapidly evolving market conditions and adapt its predictions accordingly. This advancement could transform User2Vec into a practical tool for real-time financial decision making.

5. Conclusions

The influence of investor sentiment on stocks, coupled with market prices, has been a cornerstone in a multitude of studies focusing on predicting future stock price trends. These studies consistently affirm that including textual opinions can boost the accuracy of predictions. Considering this concept, we have introduced a groundbreaking representation for stock market prediction in this paper named User2Vec. In User2Vec, each message undergoes encoding as a vector and is subsequently processed through a convolutional network. The output from this network is then fed into a bidirectional LSTM network, which furnishes the final representation deployed in the classification network. Our model markedly deviates from previous efforts in this field by integrating accessible social information pertaining to the users and messages, as well as the actual text of the messages. This integration is realized while also considering the sentiment of each message, with each message undergoing separate encoding. Our experimental results decisively showed that including tweet text supplied valuable information for predicting stock direction, even when sentiment from the message was already available. Integrating social information from users and their tweets further improved the results. When juxtaposed with results from state-of-the-art models, the superior performance of our proposed model is apparent. However, it’s essential to note that the effectiveness of our model hinges on the presence of informative messages about the target stock. For stocks associated with a sparse number of messages, the model performance diminishes and reflects the level of performance exhibited by previous models.
This paves the way for future improvements in our User2Vec model. To counteract sparse messages, future versions of the model might incorporate alternative data sources or leverage techniques to extrapolate information from the limited available data. Further enhancements can also be introduced, such as refining the method of encoding messages, enabling the extraction of more nuanced information from the text of the tweets, or augmenting the system’s capacity to handle the growing volume of data in social networks. Lastly, one can also explore the prospects of integrating more sophisticated machine learning techniques to improve the accuracy and robustness of predictions, thereby making User2Vec an even more powerful tool for stock market prediction.

Author Contributions

Conceptualization, P.E.; methodology, M.S. and A.N.; software, M.S.; validation, P.E.; formal analysis, P.E.; investigation, P.E.; resources, M.S.; data curation, A.N.; writing—original draft preparation, P.E.; writing—review and editing, P.E., M.S. and A.N.; visualization, M.S. and A.N.; supervision, A.N.; project administration, A.N. All authors have read and agreed to the published version of the manuscript.

Funding

This research received no external funding.

Data Availability Statement

Data will be made available on request.

Conflicts of Interest

The authors declare no conflict of interest.

References

  1. Bernal, A.; Fok, S.; Pidaparthi, R. Financial Market Time Series Prediction with Recurrent Neural Networks; Citeseer: State College, PA, USA, 2012. [Google Scholar]
  2. Chakraborty, P.; Pria, U.S.; Rony, M.R.A.H.; Majumdar, M.A. Predicting stock movement using sentiment analysis of Twitter feed. In Proceedings of the 2017 6th International Conference on Informatics, Electronics and Vision & 2017 7th International Symposium in Computational Medical and Health Technology (ICIEV-ISCMHT), Himeji, Japan, 1–3 September 2017; pp. 1–6. [Google Scholar]
  3. Dingli, A.; Fournier, K.S. Financial time series forecasting—A deep learning approach. Int. J. Mach. Learn. Comput. 2017, 7, 118–122. [Google Scholar] [CrossRef]
  4. Guo, K.; Sun, Y.; Qian, X. Can investor sentiment be used to predict the stock price? Dynamic analysis based on the China stock market. Phys. A Stat. Mech. Appl. 2017, 469, 390–396. [Google Scholar] [CrossRef]
  5. Di Persio, L.; Honchar, O. Recurrent neural networks approach to the financial forecast of Google assets. Int. J. Math. Comput. Simul. 2017, 11, 7–13. [Google Scholar]
  6. Althelaya, K.A.; El-Alfy, E.S.M.; Mohammed, S. Evaluation of bidirectional LSTM for short-and long-term stock market prediction. In Proceedings of the 2018 9th International Conference on Information and Communication Systems (ICICS), Irbid, Jordan, 3–5 April 2018; pp. 151–156. [Google Scholar]
  7. Zhang, J.; Cui, S.; Xu, Y.; Li, Q.; Li, T. A novel data-driven stock price trend prediction system. Expert Syst. Appl. 2018, 97, 60–69. [Google Scholar] [CrossRef]
  8. Chong, E.; Han, C.; Park, F. Deep learning networks for stock market analysis and prediction: Methodology, data representations, and case studies. Expert Syst. Appl. 2017, 83, 187–205. [Google Scholar] [CrossRef] [Green Version]
  9. Zhao, B.; He, Y.; Yuan, C.; Huang, Y. Stock market prediction exploiting microblog sentiment analysis. In Proceedings of the 2016 International Joint Conference on Neural Networks (IJCNN), Vancouver, BC, Canada, 24–29 July 2016; pp. 4482–4488. [Google Scholar]
  10. Bao, W.; Yue, J.; Rao, Y. A deep learning framework for financial time series using stacked autoencoders and long-short term memory. PLoS ONE 2017, 12, e0180944. [Google Scholar] [CrossRef] [PubMed] [Green Version]
  11. Li, M.; Yang, C.; Zhang, J.; Puthal, D.; Luo, Y.; Li, J. Stock market analysis using social networks. In Proceedings of the Australasian Computer Science Week Multiconference, Brisbane, QLD, Australia, 29 January–2 February 2018; pp. 1–10. [Google Scholar]
  12. Kamkarhaghighi, M.; Chepurna, I.; Aghababaei, S.; Makrehchi, M. Discovering credible Twitter users in the stock market domain. In Proceedings of the 2016 IEEE/WIC/ACM International Conference on Web Intelligence (WI), Omaha, NE, USA, 13–16 October 2016; pp. 66–72. [Google Scholar]
  13. Daly, K.; Fayyad, A. Can oil prices predict stock market returns? Mod. Appl. Sci. 2011, 5, 44. [Google Scholar] [CrossRef] [Green Version]
  14. Taboada, M. Sentiment analysis: An overview from linguistics. Annu. Rev. Linguist. 2016, 2, 325–347. [Google Scholar] [CrossRef] [Green Version]
  15. Velay, M.; Daniel, F. Stock chart pattern recognition with deep learning. arXiv 2018, arXiv:1808.00418. [Google Scholar]
  16. Hyndman, R.J.; Athanasopoulos, G.; Bergmeir, C.; Caceres, G.; Chhay, L.; O’Hara-Wild, M.; Yasmeen, F. Forecast: Forecasting Functions for Time Series and Linear Models. 2019. Available online: https://cran.r-project.org/package=forecast (accessed on 16 May 2023).
  17. Li, L.; Leng, S.; Yang, J.; Yu, M. Stock market autoregressive dynamics: A multinational comparative study with quantile regression. Math. Probl. Eng. 2016, 2016, 1285768. [Google Scholar] [CrossRef] [Green Version]
  18. Lin, Z. Modelling and forecasting the stock market volatility of SSE Composite Index using GARCH models. Future Gener. Comput. Syst. 2018, 79, 960–972. [Google Scholar] [CrossRef]
  19. Bollerslev, T. Generalized autoregressive conditional heteroskedasticity. J. Econom. 1986, 31, 307–327. [Google Scholar] [CrossRef] [Green Version]
  20. Cen, L.; Ruta, D.; Ruta, A. Using Recommendations for Trade Returns Prediction with Machine Learning. In Proceedings of the International Symposium on Methodologies for Intelligent Systems, Warsaw, Poland, 26–29 June 2017; Springer: Cham, Switzerland, 2017; pp. 718–727. [Google Scholar]
  21. Huang, C.F.; Li, H.C. An Evolutionary Method for Financial Forecasting in Microscopic High-Speed Trading Environment. Comput. Intell. Neurosci. 2017, 2017, 9580815. [Google Scholar] [CrossRef] [Green Version]
  22. Tang, L.; Zhang, S.; He, L.; Fan, H. Research on Stock Prediction in China based on Social Network and SVM Algorithms. In Proceedings of the 2018 2nd International Conference on Economic Development and Education Management (ICEDEM 2018), Dalian, China, 29–30 December 2018; Atlantis Press: Amsterdam, The Netherlands, 2018; pp. 435–438. [Google Scholar]
  23. Bustos, O.; Pomares, A.; Gonzalez, E. A comparison between SVM and multilayer perceptron in predicting an emerging financial market: Colombian stock market. In Proceedings of the 2017 Congreso Internacional de Innovacion y Tendencias en Ingenieria (CONIITI), Bogotá, Colombia, 4–6 October 2017; IEEE: New York, NY, USA, 2017; pp. 1–6. [Google Scholar]
  24. Weng, B.; Ahmed, M.A.; Megahed, F.M. Stock market one-day ahead movement prediction using disparate data sources. Expert Syst. Appl. 2017, 79, 153–163. [Google Scholar] [CrossRef]
  25. Bouktif, S.; Fiaz, A.; Awad, M. Stock market movement prediction using disparate text features with machine learning. In Proceedings of the 2019 Third International Conference on Intelligent Computing in Data Sciences (ICDS), Marrakech, Morocco, 28–30 October 2019; pp. 1–6. [Google Scholar]
  26. Hu, H.; Tang, L.; Zhang, S.; Wang, H. Predicting the direction of stock markets using optimized neural networks with Google Trends. Neurocomputing 2018, 285, 188–195. [Google Scholar] [CrossRef]
  27. Qiu, M.; Song, Y. Predicting the direction of stock market index movement using an optimized artificial neural network model. PLoS ONE 2016, 11, e0155133. [Google Scholar] [CrossRef] [PubMed] [Green Version]
  28. Mingyue, Q.; Cheng, L.; Yu, S. Application of the Artificial Neural Network in predicting the direction of stock market index. In Proceedings of the 2016 10th International Conference on Complex, Intelligent, and Software Intensive Systems (CISIS), Fukuoka, Japan, 6–8 July 2016; pp. 219–223. [Google Scholar]
  29. Zhong, X.; Enke, D. Forecasting daily stock market return using dimensionality reduction. Expert Syst. Appl. 2017, 67, 126–139. [Google Scholar] [CrossRef]
  30. Hong, L.; Modirrousta, M.; Hossein Nasirpour, M.; Mirshekari Chargari, M.; Mohammadi, F.; Moravvej, S.; Rezvanishad, L.; Rezvanishad, M.; Bakhshayeshi, I.; Alizadehsani, R.; et al. GAN-LSTM-3D: An efficient method for lung tumour 3D reconstruction enhanced by attention-based LSTM. CAAI Trans. Intell. Technol. 2023. [Google Scholar] [CrossRef]
  31. Sartakhti, M.; Kahaki, M.; Moravvej, S.; Joortani, M.; Bagheri, A. Persian language model based on BiLSTM model on COVID-19 corpus. In Proceedings of the 2021 5th International Conference On Pattern Recognition And Image Analysis (IPRIA), Kashan, Iran, 28–29 April 2021; pp. 1–5. [Google Scholar]
  32. Moravvej, S.; Mousavirad, S.; Moghadam, M.; Saadatm, M. An lstm-based plagiarism detection via attention mechanism and a population-based approach for pre-training parameters with imbalanced classes. In Proceedings of the Neural Information, Processing of the 28th International Conference (ICONIP 2021), Sanur, Indonesia, 8–12 December 2021; pp. 690–701. [Google Scholar]
  33. Moravvej, S.; Joodaki, M.; Kahaki, M.; Sartakhti, M. A method based on an attention mechanism to measure the similarity of two sentences. In Proceedings of the 2021 7th International Conference on Web Research (ICWR), Tehran, Iran, 19–20 May 2021; pp. 238–242. [Google Scholar]
  34. Vaswani, A.; Shazeer, N.; Parmar, N.; Uszkoreit, J.; Jones, L.; Gomez, A.; Kaiser, Ł.; Polosukhin, I. Attention is all you need. In Proceedings of the Advances in Neural Information Processing Systems, Long Beach, CA, USA, 4–9 December 2017; Volume 30. [Google Scholar]
  35. Lim, B.; Arık, S.; Loeff, N.; Pfister, T. Temporal fusion transformers for interpretable multi-horizon time series forecasting. Int. J. Forecast. 2021, 37, 1748–1764. [Google Scholar] [CrossRef]
  36. Moravvej, S.; Maleki Kahaki, M.; Salimi Sartakhti, M.; Joodaki, M. Efficient GAN-based method for extractive summarization. J. Electr. Comput. Eng. Innov. 2022, 10, 287–298. [Google Scholar]
  37. Moravvej, S.; Kahaki, M.; Sartakhti, M.; Mirzaei, A. A method based on attention mechanism using bidirectional long-short term memory (BLSTM) for question answering. In Proceedings of the 2021 29th Iranian Conference On Electrical Engineering (ICEE), Tehran, Iran, 18–20 May 2021; pp. 460–464. [Google Scholar]
  38. Moravvej, S.; Alizadehsani, R.; Khanam, S.; Sobhaninia, Z.; Shoeibi, A.; Khozeimeh, F.; Sani, Z.; Tan, R.; Khosravi, A.; Nahavandi, S.; et al. RLMD-PA: A reinforcement learning-based myocarditis diagnosis combined with a population-based algorithm for pretraining weights. Contrast Media Mol. Imaging 2022, 2022, 8733632. [Google Scholar] [CrossRef]
  39. Danaei, S.; Bostani, A.; Moravvej, S.; Mohammadi, F.; Alizadehsani, R.; Shoeibi, A.; Alinejad-Rokny, H.; Nahavandi, S. Myocarditis Diagnosis: A Method using Mutual Learning-Based ABC and Reinforcement Learning. In Proceedings of the 2022 IEEE 22nd International Symposium on Computational Intelligence and Informatics and 8th IEEE International Conference on Recent Achievements in Mechatronics, Automation, Computer Science and Robotics (CINTI-MACRo), Budapest, Hungary, 21–22 November 2022; pp. 265–270. [Google Scholar]
  40. Moravvej, S.; Mirzaei, A.; Safayani, M. Biomedical text summarization using conditional generative adversarial network (CGAN). arXiv 2021, arXiv:2110.11870. [Google Scholar]
  41. Wang, J.; Yu, L.; Lai, K.; Zhang, X. Dimensional sentiment analysis using a regional CNN-LSTM model. In Proceedings of the 54th Annual Meeting of the Association for Computational Linguistics, Berlin, Germany, 7–12 August 2016; Volume 2, pp. 225–230. [Google Scholar]
  42. Ballings, M.; Van den Poel, D.; Hespeels, N.; Gryp, R. Evaluating multiple classifiers for stock price direction prediction. Expert Syst. Appl. 2015, 42, 7046–7056. [Google Scholar] [CrossRef]
  43. Sharma, N.; Juneja, A. Combining of random forest estimates using LSboost for stock market index prediction. In Proceedings of the 2nd International Conference for Convergence in Technology (I2CT), Mumbai, India, 7–9 April 2017; pp. 1199–1202. [Google Scholar] [CrossRef]
  44. Picasso, A.; Merello, S.; Ma, Y.; Oneto, L.; Cambria, E. Technical analysis and sentiment embeddings for market trend prediction. Expert Syst. Appl. 2019, 135, 60–70. [Google Scholar] [CrossRef]
  45. Izzah, A.; Sari, Y.A.; Widyastuti, R.; Cinderatama, T.A. Mobile app for stock prediction using Improved Multiple Linear Regression. In Proceedings of the 2017 International Conference on Sustainable Information Engineering and Technology (SIET), Batu, Indonesia, 24–25 November 2017; pp. 150–154. [Google Scholar]
  46. Ariyo, A.A.; Adewumi, A.O.; Ayo, C.K. Stock price prediction using the ARIMA model. In Proceedings of the 2014 UKSim-AMSS 16th International Conference on Computer Modelling and Simulation, Cambridge, UK, 26–28 March 2014; pp. 106–112. [Google Scholar]
  47. Ouahilal, M.; El Mohajir, M.; Chahhou, M.; El Mohajir, B.E. Optimizing stock market price prediction using a hybrid approach based on HP filters and support vector regression. In Proceedings of the 2016 4th IEEE International Colloquium on Information Science and Technology (CiSt), Tangier, Morocco, 24–26 October 2016; pp. 290–294. [Google Scholar]
  48. Krollner, B.; Vanstone, B.J.; Finnie, G.R. Financial time series forecasting with machine learning techniques: A survey. In Proceedings of the 18th European Symposium on Artificial Neural Networks (ESANN), Bruges, Belgium, 28–30 April 2010. [Google Scholar]
  49. Tollo, G.; Tanev, S.; Liotta, G.; De March, D. Using online textual data, principal component analysis and artificial neural networks to study business and innovation practices in technology-driven firms. Comput. Ind. 2015, 74, 16–28. [Google Scholar] [CrossRef] [Green Version]
  50. Corazza, M.; De March, D.; Tollo, G. Design of adaptive Elman networks for credit risk assessment. Quant. Financ. 2021, 21, 323–340. [Google Scholar] [CrossRef]
  51. Moghaddam, A.H.; Moghaddam, M.H.; Esfandyari, M. Stock market index prediction using artificial neural network. J. Econ. Financ. Adm. Sci. 2016, 21, 89–93. [Google Scholar] [CrossRef] [Green Version]
  52. Arévalo, A.; Niño, J.; Hernández, G.; Sandoval, J. High-frequency trading strategy based on deep neural networks. In Proceedings of the International Conference on Intelligent Computing, Lanzhou, China, 2–5 August 2016; Springer: Cham, Switzerland, 2016; pp. 424–436. [Google Scholar]
  53. Hoseinzade, E.; Haratizadeh, S. CNNpred: CNN-based stock market prediction using a diverse set of variables. Expert Syst. Appl. 2019, 129, 273–285. [Google Scholar] [CrossRef]
  54. Gao, P.; Zhang, R.; Yang, X. The application of stock index price prediction with neural networks. Math. Comput. Appl. 2020, 25, 53. [Google Scholar] [CrossRef]
  55. Wang, Y.; Li, Q.; Huang, Z.; Li, J. EAN: Event attention network for stock price trend prediction based on sentimental embedding. In Proceedings of the 10th ACM Conference on Web Science, Boston, MA, USA, 30 June–3 July 2019; pp. 311–320. [Google Scholar]
  56. Moravvej, S.; Mousavirad, S.; Oliva, D.; Mohammadi, F. A Novel Plagiarism Detection Approach Combining BERT-based Word Embedding, Attention-based LSTMs and an Improved Differential Evolution Algorithm. arXiv 2023, arXiv:2305.02374. [Google Scholar]
  57. Yu, S.; Xia, F.; Li, S.; Hou, M.; Sheng, Q. Spatio-Temporal Graph Learning for Epidemic Prediction. Acm Trans. Intell. Syst. Technol. 2023, 14, 36. [Google Scholar] [CrossRef]
  58. Nelson, D.M.; Pereira, A.C.; de Oliveira, R.A. Stock market’s price movement prediction with LSTM neural networks. In Proceedings of the 2017 International Joint Conference on Neural Networks (IJCNN), Anchorage, AK, USA, 14–19 May 2017; pp. 1419–1426. [Google Scholar]
  59. Ding, G.; Qin, L. Study on the prediction of stock price based on the associated network model of LSTM. Int. J. Mach. Learn. Cybern. 2020, 11, 1307–1317. [Google Scholar] [CrossRef] [Green Version]
  60. Jin, Z.; Yang, Y.; Liu, Y. Stock closing price prediction based on sentiment analysis and LSTM. Neural Comput. Appl. 2019, 32, 9713–9729. [Google Scholar] [CrossRef]
  61. Liu, J.; Lin, H.; Yang, L.; Xu, B.; Wen, D. Multi-Element Hierarchical Attention Capsule Network for Stock Prediction. IEEE Access 2020, 8, 143114–143123. [Google Scholar] [CrossRef]
  62. Baughman, M.; Haas, C.; Wolski, R.; Foster, I.; Chard, K. Predicting Amazon spot prices with LSTM networks. In Proceedings of the 9th Workshop on Scientific Cloud Computing, Tempe, AZ, USA, 11 June 2018; pp. 1–7. [Google Scholar]
  63. Lin, Y.F.; Huang, T.M.; Chung, W.H.; Ueng, Y.L. Forecasting fluctuations in the financial index using a recurrent neural network based on price features. IEEE Trans. Emerg. Top. Comput. Intell. 2020, 5, 780–791. [Google Scholar] [CrossRef]
  64. Zhou, Z.; Zhao, J.; Xu, K. Can online emotions predict the stock market in China? In Proceedings of the International Conference on Web Information Systems Engineering, Shanghai, China, 8–10 November 2016; Springer: Cham, Switzerland, 2016; pp. 328–342. [Google Scholar]
  65. Zhang, X.; Fuehres, H.; Gloor, P.A. Predicting stock market indicators through twitter “I hope it is not as bad as I fear”. Procedia-Soc. Behav. Sci. 2011, 26, 55–62. [Google Scholar] [CrossRef] [Green Version]
  66. Baker, M.; Wurgler, J. Investor sentiment and the cross-section of stock returns. J. Financ. 2006, 61, 1645–1680. [Google Scholar] [CrossRef] [Green Version]
  67. Baker, M.; Wurgler, J. Investor sentiment in the stock market. J. Econ. Perspect. 2007, 21, 129–152. [Google Scholar] [CrossRef] [Green Version]
  68. Gilbert, E.; Karahalios, K. Widespread worry and the stock market. In Proceedings of the International AAAI Conference on Web and Social Media, Washington, DC, USA, 23–26 May 2010; Volume 4. [Google Scholar]
  69. Guo, Z.; Ye, W.; Yang, J.; Zeng, Y. Financial index time series prediction based on bidirectional two dimensional locality preserving projection. In Proceedings of the 2017 IEEE 2nd International Conference on Big Data Analysis (ICBDA), Beijing, China, 10–12 March 2017; pp. 934–938. [Google Scholar]
  70. Zhou, S.; Zhou, L.; Mao, M.; Tai, H.M.; Wan, Y. An optimized heterogeneous structure LSTM network for electricity price forecasting. IEEE Access 2019, 7, 108161–108173. [Google Scholar] [CrossRef]
  71. Bouktif, S.; Fiaz, A.; Awad, M.A. Augmented Textual Features-Based Stock Market Prediction. IEEE Access 2020, 8, 40269–40282. [Google Scholar] [CrossRef]
  72. Alhamzeh, A.; Mukhopadhaya, S.; Hafid, S.; Bremard, A.; Egyed-Zsigmond, E.; Kosch, H.; Brunie, L. A Hybrid Approach for Stock Market Prediction Using Financial News and Stocktwits. In CLEF 2021: Experimental IR Meets Multilinguality, Multimodality, and Interaction; Lecture Notes in Computer, Science; Candan, K.S., Ionescu, B., Goeuriot, L., Larsen, B., Müller, H., Joly, A., Maistro, M., Piroi, F., Faggioli, G., Ferro, N., Eds.; Springer: Cham, Switzerland, 2021; Volume 12880. [Google Scholar] [CrossRef]
  73. Bujari, A.; Furini, M.; Laina, N. On using cashtags to predict companies stock trends. In Proceedings of the 2017 14th IEEE Annual Consumer Communications Networking Conference (CCNC), Las Vegas, NV, USA, 8–11 January 2017; pp. 25–28. [Google Scholar]
  74. Pegah, E.; Mehdi, S.; Ahmad, N. U2VDow30: Dow 30 Stocks tweets for proposing User2Vec approach. Mendeley Data 2022. [Google Scholar] [CrossRef]
  75. Mikolov, T.; Chen, K.; Corrado, G.; Dean, J. Efficient estimation of word representations in vector space. arXiv 2013, arXiv:1301.3781. [Google Scholar]
  76. Socher, R.; Perelygin, A.; Wu, J.; Chuang, J.; Manning, C.; Ng, A.; Potts, C. Recursive Deep Models for Semantic Compositionality Over a Sentiment Treebank. In Proceedings of the 2013 Conference on Empirical Methods in Natural Language Processing (EMNLP), Seattle, WA, USA, 18–21 October 2013. [Google Scholar]
  77. Tang, D.; Wei, F.; Yang, Y.; Zhou, M.; Liu, T.; Qin, B. Learning Sentiment-Specific Word Embedding for Twitter Sentiment Classification. In Proceedings of the 52th ACL Conference, Baltimore, Maryland, 22–27 June 2014. [Google Scholar]
  78. Bengio, Y. Learning Deep Architectures for AI; Now Publishers Inc.: Delft, The Netherlands, 2009. [Google Scholar]
  79. Mehta, P.; Pandya, S.; Kotecha, K. Harvesting social media sentiment analysis to enhance stock market prediction using deep learning. PeerJ Comput. Sci. 2021, 7, e476. [Google Scholar] [CrossRef] [PubMed]
  80. Wang, C.; Chen, Y.; Zhang, S.; Zhang, Q. Stock market index prediction using deep Transformer model. Expert Syst. Appl. 2022, 208, 118128. [Google Scholar] [CrossRef]
  81. Wang, Z.; Hu, Z.; Li, F.; Ho, S.; Cambria, E. Learning-based stock trending prediction by incorporating technical indicators and social media sentiment. Cogn. Comput. 2023, 15, 1092–1102. [Google Scholar] [CrossRef]
  82. Wang, J.; Zhu, S. A Novel Stock Index Direction Prediction Based on Dual Classifier Coupling and Investor Sentiment Analysis. Cogn. Comput. 2023, 15, 1023–1041. [Google Scholar] [CrossRef]
  83. Ammirato, S.; Fattoruso, G.; Violi, A. Parsimonious AHP-DEA Integrated Approach for Efficiency Evaluation of Production Processes. J. Risk Financ. Manag. 2022, 15, 293. [Google Scholar] [CrossRef]
  84. Fattoruso, G.; Barbati, M.; Ishizaka, A.; Squillante, M. A hybrid AHPSort II and multi-objective portfolio selection method to support quality control in the automotive industry. J. Oper. Res. Soc. 2022, 74, 209–224. [Google Scholar] [CrossRef]
Figure 1. Overview of the proposed User2Vec model.
Mathematics 11 02950 g001
Figure 2. The feature set used in the User2Vec model.
Mathematics 11 02950 g002
Figure 3. The architecture of the prediction module of the proposed model.
Mathematics 11 02950 g003
Figure 4. ROC diagram for the proposed model and state-of-the-art methods on the Dow 30 stocks [43,60,61,71,79,80,81,82]. Bule dashed line represents the ROC curve for a random guess.
Mathematics 11 02950 g004
Table 1. Apple stock market data.
DateOpenHighLowCloseAdj CloseVolumeLabel
1/8/2018174.35175.61173.93174.3171.0320,567,8000
1/9/2018174.55175.06173.41174.3171.0121,584,0000
1/10/2018173.16174.3173174.2170.9723,959,9001
1/11/2018174.59175.49174.49175.2171.9518,667,7001
Table 2. The characteristics of the collected data from Twitter for the DOW 30 index shares.
Hashtag#Tweets#Positive Tweets#Negative Tweets#Unique User-ID
AAPL417,334366,08051,25463,355
AXP956928731674163
BA66,63724,48110,484641
CAT41,54313,19374033380
CSCO70932919841187
CVX15,2146322173940
DIS153,03254,06718,651877
DOW14,697237125285
GS59,40126,5149042182
HD62,49721,5537139123
IBM62,87119,898739410,440
INTC36,81614,3945166551
JNJ42,04514,6565975448
JPM10,6143817149299
KO16,4445756227317
MCD68,81023,1638199218
MMM11,3013500235547
MRK19,68776102202132
MSFT156,64381,40213,081979
NKE50,65917,5516653946
PFE74,73326,8297601151
PG53,86618,8035635193
TRV44511344505318
UNH15,5765574228080
UTX997730851323267
V34,63812,4925144163
VZ18,91370282513116
WBA29,8358002339256
WMT13,26852751706313
XOM23,43981533558250
Table 3. Parameter settings.
ModelParameterValue
CNNfilter size50
kernel size1
activation functionrelu
LSTMunit size20
Proposedbatch size128
learning rate0.01
optimizerAdam
loss functionmean absolute error
epoch700
Table 4. Results obtained using different models on Apple stock.
ModelAccuracyPrecisionRecallF-Measure
Rand0.4623 ± 0.00550.5645 ± 0.00470.6412 ± 0.00610.5012 ± 0.0070
Arima(M)0.5105 ± 0.00350.5955 ± 0.00330.7022 ± 0.00500.5345 ± 0.0063
SBiLSTM-Day2Vec(M,Se)0.6255 ± 0.00420.6245 ± 0.00390.9602 ± 0.00220.7523 ± 0.0028
User2Vec(M,Se)0.7140 ± 0.00300.6902 ± 0.00310.9015 ± 0.00230.7812 ± 0.0025
User2Vec(Txt)0.6815 ± 0.00370.7241 ± 0.00330.7255 ± 0.00340.7210 ± 0.0035
User2Vec(Txt,M,Se)0.7444 ± 0.00270.7212 ± 0.00320.9045 ± 0.00210.8019 ± 0.0024
User2Vec(Txt,M,Se,So)0.7810 ± 0.00250.7845 ± 0.00240.8615 ± 0.00260.8245 ± 0.0023
User2Vec(M,Se,So)0.7242 ± 0.00310.7200 ± 0.00320.8242 ± 0.00280.7712 ± 0.0027
User2Vec(Txt,M,Se,Sc)0.7344 ± 0.00300.7314 ± 0.00320.8300 ± 0.00270.7842 ± 0.0026
User2Vec(Txt,M,Se,So,Sc)0.7514 ± 0.00290.8100 ± 0.00230.7311 ± 0.00310.7710 ± 0.0027
Table 5. Results obtained using the proposed model for various companies on the Dow 30 stocks.
StockAccuracyPrecisionRecallF-Measure
Apple0.7410 ± 0.00150.7443 ± 0.00230.7546 ± 0.00210.7494 ± 0.0018
CAT0.6358 ± 0.00340.6614 ± 0.00360.6728 ± 0.00310.6670 ± 0.0033
CSCO0.7143 ± 0.00270.7059 ± 0.00250.7301 ± 0.00280.7177 ± 0.0026
CVX0.6351 ± 0.00330.6406 ± 0.00370.6601 ± 0.00350.6502 ± 0.0036
GS0.5682 ± 0.00420.5816 ± 0.00430.6012 ± 0.00410.5911 ± 0.0042
IBM0.5987 ± 0.00380.6027 ± 0.00390.6128 ± 0.00370.6077 ± 0.0038
JNJ0.6214 ± 0.00350.6137 ± 0.00370.6208 ± 0.00360.6170 ± 0.0037
JPM0.7273 ± 0.00220.7143 ± 0.00240.8333 ± 0.00230.7692 ± 0.0025
MCD0.6182 ± 0.00360.6363 ± 0.00370.6423 ± 0.00380.6392 ± 0.0037
MSFT0.6605 ± 0.00330.7046 ± 0.00340.7911 ± 0.00320.7452 ± 0.0035
KO0.6061 ± 0.00390.6230 ± 0.00410.6545 ± 0.00400.6381 ± 0.0042
Table 6. Results obtained using the proposed model and other state-of-the-art methods on the Dow 30 stocks.
WorkAccuracyPrecisionRecallF-Measure
Sharma et al. [43]0.5201 ± 0.00350.5404 ± 0.00370.5302 ± 0.00390.5335 ± 0.0038
Jin et al. [60]0.5523 ± 0.00310.5644 ± 0.00300.5801 ± 0.00320.5721 ± 0.0031
Liu et al. [61]0.5804 ± 0.00290.5909 ± 0.00280.6050 ± 0.00300.5979 ± 0.0029
Bouktif et al. [71]0.6003 ± 0.00270.6110 ± 0.00260.6251 ± 0.00280.6180 ± 0.0027
Mehta et al. [79]0.6250 ± 0.00240.6355 ± 0.00230.6485 ± 0.00250.6359 ± 0.0024
Wang C et al. [80]0.6455 ± 0.00220.6563 ± 0.00210.6688 ± 0.00230.6525 ± 0.0022
Wang Z et al. [81]0.6650 ± 0.00200.6661 ± 0.00190.6880 ± 0.00210.6720 ± 0.0020
Wang J et al. [82]0.6800 ± 0.00190.6913 ± 0.00180.7132 ± 0.00200.7072 ± 0.0019
Proposed with Transformer0.7051 ± 0.00170.7269 ± 0.00120.7483 ± 0.00180.7324 ± 0.0017
Proposed0.7661 ± 0.00160.7667 ± 0.00140.7878 ± 0.00180.7722 ± 0.0018
Disclaimer/Publisher’s Note: The statements, opinions and data contained in all publications are solely those of the individual author(s) and contributor(s) and not of MDPI and/or the editor(s). MDPI and/or the editor(s) disclaim responsibility for any injury to people or property resulting from any ideas, methods, instructions or products referred to in the content.

