Article

Redundancy-Based Resilience Optimization of Multi-Component Systems

1
School of Management, Zhengzhou University, Zhengzhou 450001, China
2
Science and Technology on Information Systems Engineering Laboratory, National University of Defense Technology, Changsha 410073, China
*
Author to whom correspondence should be addressed.
Mathematics 2023, 11(14), 3151; https://doi.org/10.3390/math11143151
Submission received: 4 June 2023 / Revised: 30 June 2023 / Accepted: 12 July 2023 / Published: 18 July 2023

Abstract

:
Systems are damaged due to various disturbances, and the reliability of the systems is reduced. Measures to improve system resilience need to be studied since many systems still need to operate normally after suffering damage. In this paper, the whole process of the disturbance and recovery of the system is considered, and a resilience optimization model of a multi-component system is proposed. Firstly, a system resilience assessment method is proposed based on system reliability, and the system resilience loss is used as the resilience assessment index. Secondly, two component importance indexes, loss importance and recovery importance, are proposed for the system disturbance phase and recovery phase, respectively. The two importance indexes are weighted to obtain the weighted importance so as to measure the change law of system resilience and determine the influence degrees of components on system reliability. Then, under the constraint of maintenance time, an optimization model is established to determine a redundancy strategy to maximize system resilience. Finally, through an example analysis of a wind turbine system with its main components, it is verified that the redundancy strategy proposed with this method can reduce the loss of system resilience and effectively improve system reliability.

1. Introduction

1.1. Background

Over time, more and more multi-component systems have appeared, and the research on them is becoming more and more in-depth. For example, in the system design stage, reliability analysis can be carried out to maximize system reliability. In the system operation stage, the reliability analysis of each component can predict faults in advance. Preventive maintenance is carried out accordingly to avoid losses. However, in real life, many complex systems are still damaged due to various natural disasters or man-made destruction. For example, in 2021, Zhengzhou’s traffic and subway system was severely damaged by floods, and the entire subway was shut down, causing huge losses [1]. But many important systems still need to operate normally after being damaged. At this time, it is necessary to study measures to improve the resilience of these systems to ensure that they can resist a certain degree of damage.
As an indicator that can effectively reflect a system’s resistance to disturbances and the recovery ability of the system, resilience has been studied by many scholars [2,3,4,5,6,7]. But in the existing literature, most of the research on multi-component system resilience optimization lacks the consideration of adding redundant components into a system to improve the system resilience. The reliability of components is reduced after disturbance, resulting in a lower level of system reliability. By adding redundancy to different components, the resilience loss can be minimized, and the system reliability can be improved.
Maintenance resources are limited, so it is necessary to find components that have a high impact on system reliability when optimizing the resilience of a multi-component system [8]. In order to find the most recoverable components, importance measures are widely used in repairable systems. Currently, the effects of disturbances and recovery processes on component importance have not been considered simultaneously in the research on multi-component system resilience optimization. Wu et al. [9] investigated an optimal recovery strategy of components to maximize the resilience of power systems. Barker et al. [10] proposed two component importance measures based on resilience to identify the most influential components on overall network resilience.
Therefore, this paper studied a redundancy strategy for a multi-component system under maintenance time constraints based on weighted importance, considering both disturbance and recovery processes, to minimize system resilience loss and improve system reliability.

1.2. Literature Review

Many scholars have studied the modeling and evaluation methods of system resilience. Jiang et al. [11] proposed the resilience index of a natural gas network system based on gas supply capacity and calculated the resilience value by integrating the performance curve. Dong et al. [12] used the Wiener process to perform reliability analysis for systems with two-stage degradation, which is informative for system maintenance decisions. Li et al. [13] presented an evaluation method for resilience from a mission perspective to optimize the resilience of UAV swarms under sustained attack considering cost and benefit constraints. Dong et al. [14] measured road driving performance based on link reliability and evaluated traffic network resilience.
Zhou et al. [15] considered the multi-fault mixing phenomenon caused by local and global network load redistribution. It improved the resilience of a system with mixed cascading failure. Tang et al. [16] used the extended linear programming optimization model to study the resilience of urban rail transit systems and proposed a congestion-dredging strategy under multiple strikes. Zhang et al. [17] proposed a resilience optimization model of a road-bridge traffic network system based on the total recovery time and cumulative benefit rate. Tiong et al. [18] proposed a stochastic multi-objective resilience optimization model based on network structure characteristics and post-interrupt service performance indicators to evaluate resilience.
The optimization of system resilience is inseparable from the development of related algorithms. Dui et al. [19] proposed a grouping maintenance strategy optimization scheme considering variable costs based on a calefactive simulated annealing algorithm. Liu et al. [20] solved the minimum cost shielding of communication networks based on a genetic heuristic algorithm, which made the resilience of a communication network reach the ideal level. Feng et al. [21] optimized the resilience of UAV formation reconfiguration based on an adaptive learning pigeon heuristic optimization algorithm. Schworm et al. [22] used quantum annealing to optimize system toughness considering operating costs. Liu et al. [23] used the improved grey wolf optimization algorithm to improve the resilience of an irrigation water resources system. Feng et al. [24] proposed a new time-based resilience index and used an improved pigeon-inspired optimization algorithm to formulate a resilience optimization strategy.
Importance theory can be used to identify the key components of a system and is widely used in maintenance decision-making and reliability evaluation [8,25,26]. In order to determine a redundancy strategy, it is necessary to identify the components that have the greatest impact on system reliability through the importance measure and give priority to adding redundant components.
Dui et al. [27] proposed resilience importance based on performance loss to evaluate the performance recovery efficiency of a main coolant system. Zhang et al. [28] proposed the elastic efficiency importance measure and maintenance efficiency measure to determine the importance of components and guide the maintenance sequence. Dui et al. [29] proposed node importance, determined the redundant structure of key nodes, and maximized the reliability of information-processing network layer tasks. Do et al. [30] proposed a component preventive maintenance strategy based on time-dependent importance. Chen et al. [31] modeled the reliability of a pod rotary system and used the integrated importance measure and Griffith importance to identify the weak components of the system.

1.3. Novelty and Contribution

In terms of system resilience evaluation, most of the existing literature has built resilience indicators based on system performance to evaluate and optimize system resilience. Due to the unstable performance of a system after disturbance, system reliability can be used instead of performance to analyze system resilience. However, few studies have used reliability to construct resilience models. In terms of importance, most of the existing literature has paid more attention to the process of performance degradation caused by system disturbance. The recovery process also has a great influence on the importance index, but few studies have taken into account the two processes of disturbance and recovery. In terms of recovery measures, many studies consider maintenance costs, so most of them choose preventive maintenance or other maintenance measures. Few studies have considered reducing the operational risk of a system by adding redundancy to the components.
This paper fills the above research gap and makes the following contributions:
  • A system resilience evaluation method is proposed based on system reliability, and we use system resilience loss as a resilience evaluation index.
  • Loss importance and recovery importance are proposed for the processes of disturbance and recovery, respectively. On the basis of loss importance and recovery importance, the weighted importance is obtained to determine the degree of influence of components on system reliability.
  • Under the constraint of maintenance time, the redundancy strategy based on weighted importance can maximize system reliability and optimize system resilience.
  • The effectiveness of the method is verified using a wind turbine system with multiple components as an example. The results show that the proposed redundancy strategy can restore system reliability faster and improve the resilience level of a system.

1.4. Structure

The rest of this paper is structured as follows. Section 2 introduces a resilience assessment method for a multi-component system. In Section 3, a resilience optimization model is established to maximize the system resilience of a system. Section 4 uses an example of a wind turbine system with multiple components to verify the proposed method. Section 5 summarizes the thesis and puts forward future work.

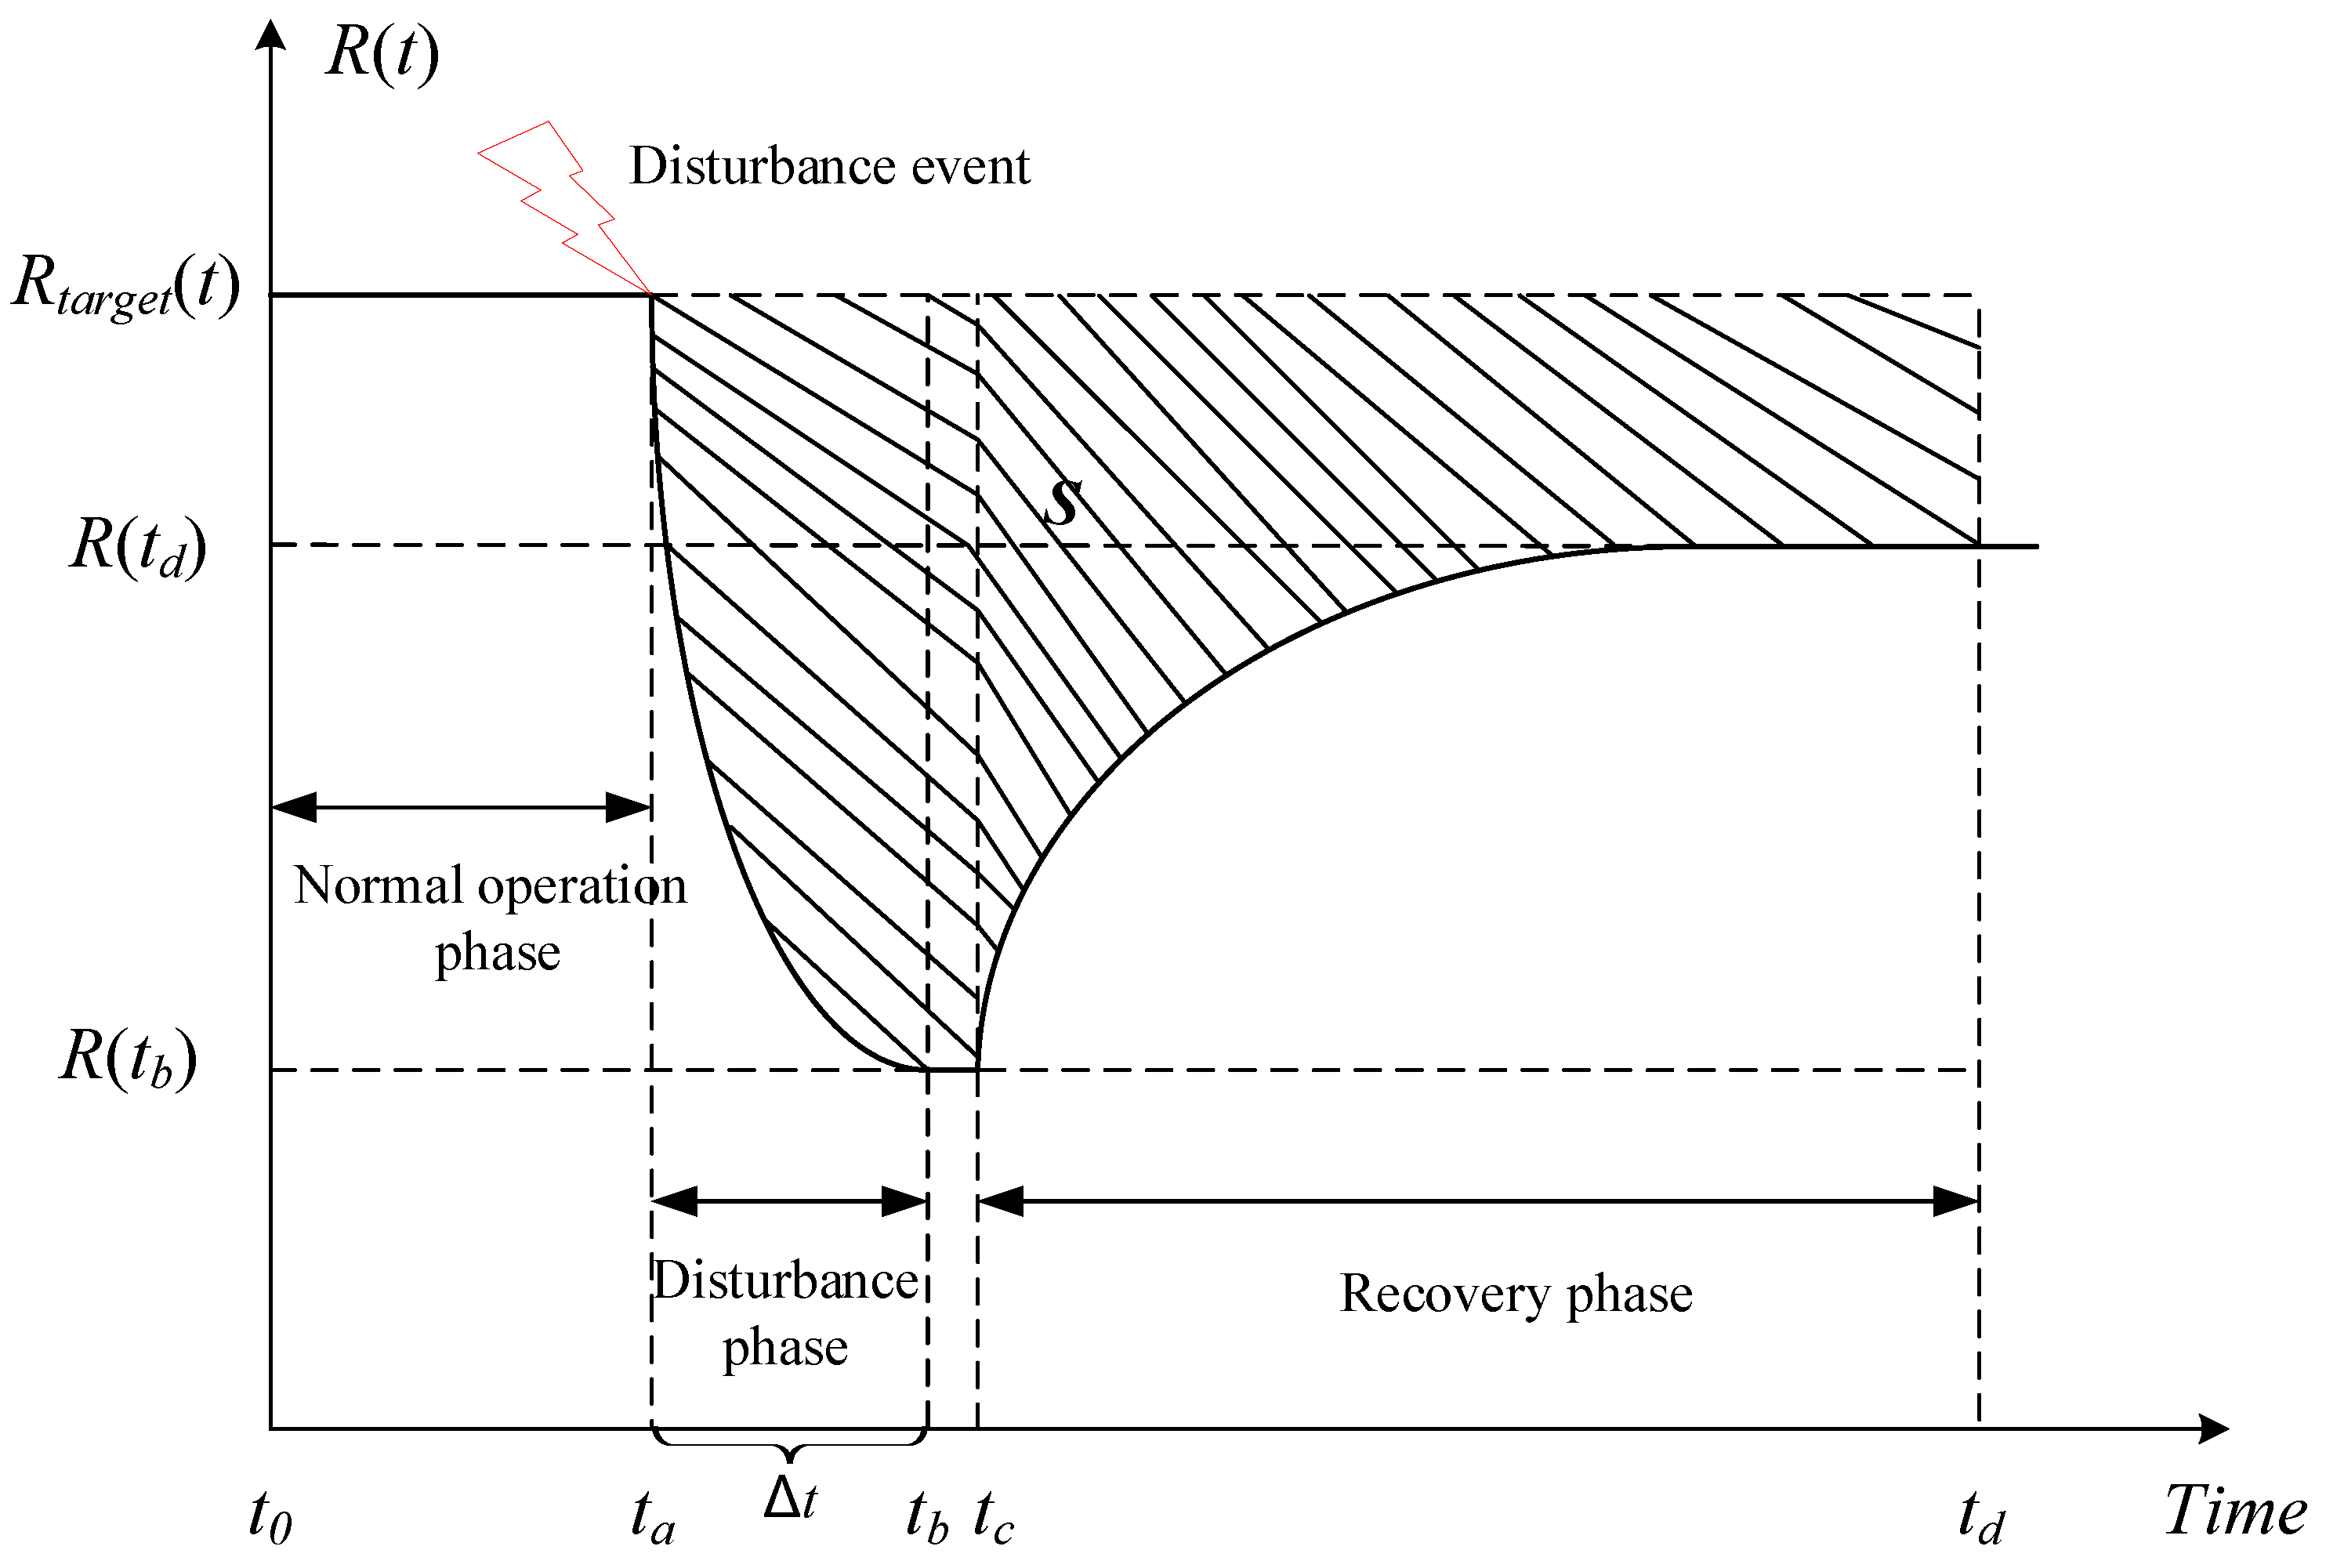
2. Resilience Assessment

In this paper, a multi-component system is considered. The system’s reliability is a function of the reliability of all its components. During operation, the reliability of the whole system also declines due to the declining reliability of the components. The system needs to bear the risk of failure during continuous operation. When the system reliability drops to the threshold, the system fails and stops.
In general, system resilience consists of two phases: disturbance and recovery [32]. However, disturbance is often random. Under certain structure and performance conditions, the anti-disturbance ability of a system is determined. This paper assumes that the duration of disturbance is fixed, so the resilience loss of each component due to disturbance is fixed. Therefore, for the resilience optimization of a system, we can pay more attention to the recovery process. At the same time, the recovery process of many systems is gradual. For example, in a multi-component system, a damaged component loses its functionality and can continue to operate only after maintenance activities are completed or redundant components are introduced.
Some systems suffer from a sharp decline in performance after disturbance, and even directly fail. For example, a power system will directly fail due to the impact of major natural disasters. At this time, it is not reasonable to use performance to analyze the resilience of the system. The reliability of the system can be used instead of performance, and then the resilience optimization strategy can be implemented for the system. In this paper, we mainly add redundant components to the system during the recovery process, and the recovery process is shown in Figure 1.
In Figure 1, R ( t ) is the reliability of the whole system. There are three phases before and after the system is disturbed:
  • Phase 1: The normal operation phase, t t 0 , t a . R t a r g e t ( t ) refers to the system reliability in order to complete the operation task from the time t 0 before the system is disturbed, which represents the initial maximum level of system reliability. We do not consider the degradation or wear process of the components. At the same time, when the disturbance degree of the external environment to the system is small, its influence can be ignored because the system itself has a certain degree of anti-disturbance. Therefore, in the normal operation phase, the system reliability curve is horizontal.
  • Phase 2: The disturbance phase, t t a , t b . When the degree of external disturbance is large, the system reliability begins to decline until the reliability drops to the threshold, and the system fails and stops running. R t a is the level of system reliability at the moment t a when the system suffers the disturbance. R t b is the system reliability after a certain time of disturbance. We assume that the duration of disturbance is fixed, so the value of t b t a is fixed.
  • Phase 3: The recovery phase, t t c , t d . By adding redundancy to the components, the system is restored. R t d refers to the reliability level that the system can be restored to t d . Because the recovery time is limited, the final system does not necessarily return to the best state.
In addition, when t t b , t c , it takes a certain amount of time to allocate materials and personnel before the system is repaired. However, the system has stopped running at this time, so the system reliability curve is horizontal during this period. In this paper, because the preparation of materials is not the focus of this study, and this period of time is very short, we do not consider the impact of this time period.
Generally, there are two common methods for assessing system resilience [33]:
Method   1 :   R r a t i o = t a t d P t d t t a t d P t a r g e t t d t ;   Method   2 :   R l o s s = t a t d P t a r g e t t t a t d P t .
In Method 1, the ratio is used to represent the resilience of the system when it is disturbed. Method 2 represents the resilience loss before and after the system is disturbed. A larger R r a t i o and smaller R l o s s are better. In addition, Method 1 is applicable for comparing different systems, and Method 2 is suitable for the optimization of a single system. This paper mainly focuses on the resilience optimization of a multi-component system. Therefore, Method 2 is selected for resilience evaluation. In addition, since the performance of the system is unstable after disturbance, we use system reliability instead of performance to analyze resilience.
When the system is restored, there is a strict recovery time limit, and redundant components cannot be replaced for all components. Suppose that there are N * components in the system, and N ( N N * ) components are replaced during the recovery process. Therefore, the total time T can be calculated according to Equation (1):
T = i = 1 N T i .
In Equation (1), T i is the time required to replace the redundant components for component i .
During the operation of the system, the reliability declines and needs to be improved with recovery measures. During the recovery process, the system runs at risk, that is, there is a huge downtime risk. Reflected in Figure 1, the area of the S region is the risk of system recovery. The larger the S , the slower the system recovers, and the greater the risk of the system. In addition, the degree of recovery of the system by adding redundant components to different components is different. Therefore, a recovery measure is needed to effectively guide the recovery process. According to Figure 1, the system resilience loss T R l o s s is assessed as in Equation (2):
T R l o s s = S = t a t d R t a r g e t t d t t a t d R t d t = R t a r g e t t ( Δ t + i = 1 N T i ) t a t d R t d t .
T R l o s s is the resilience loss of the system during the disturbance and recovery process. Δ t is the duration of the disturbance. If the system is to be maximally resilient, the system must bear the least risk and the least resilience loss in the recovery process.

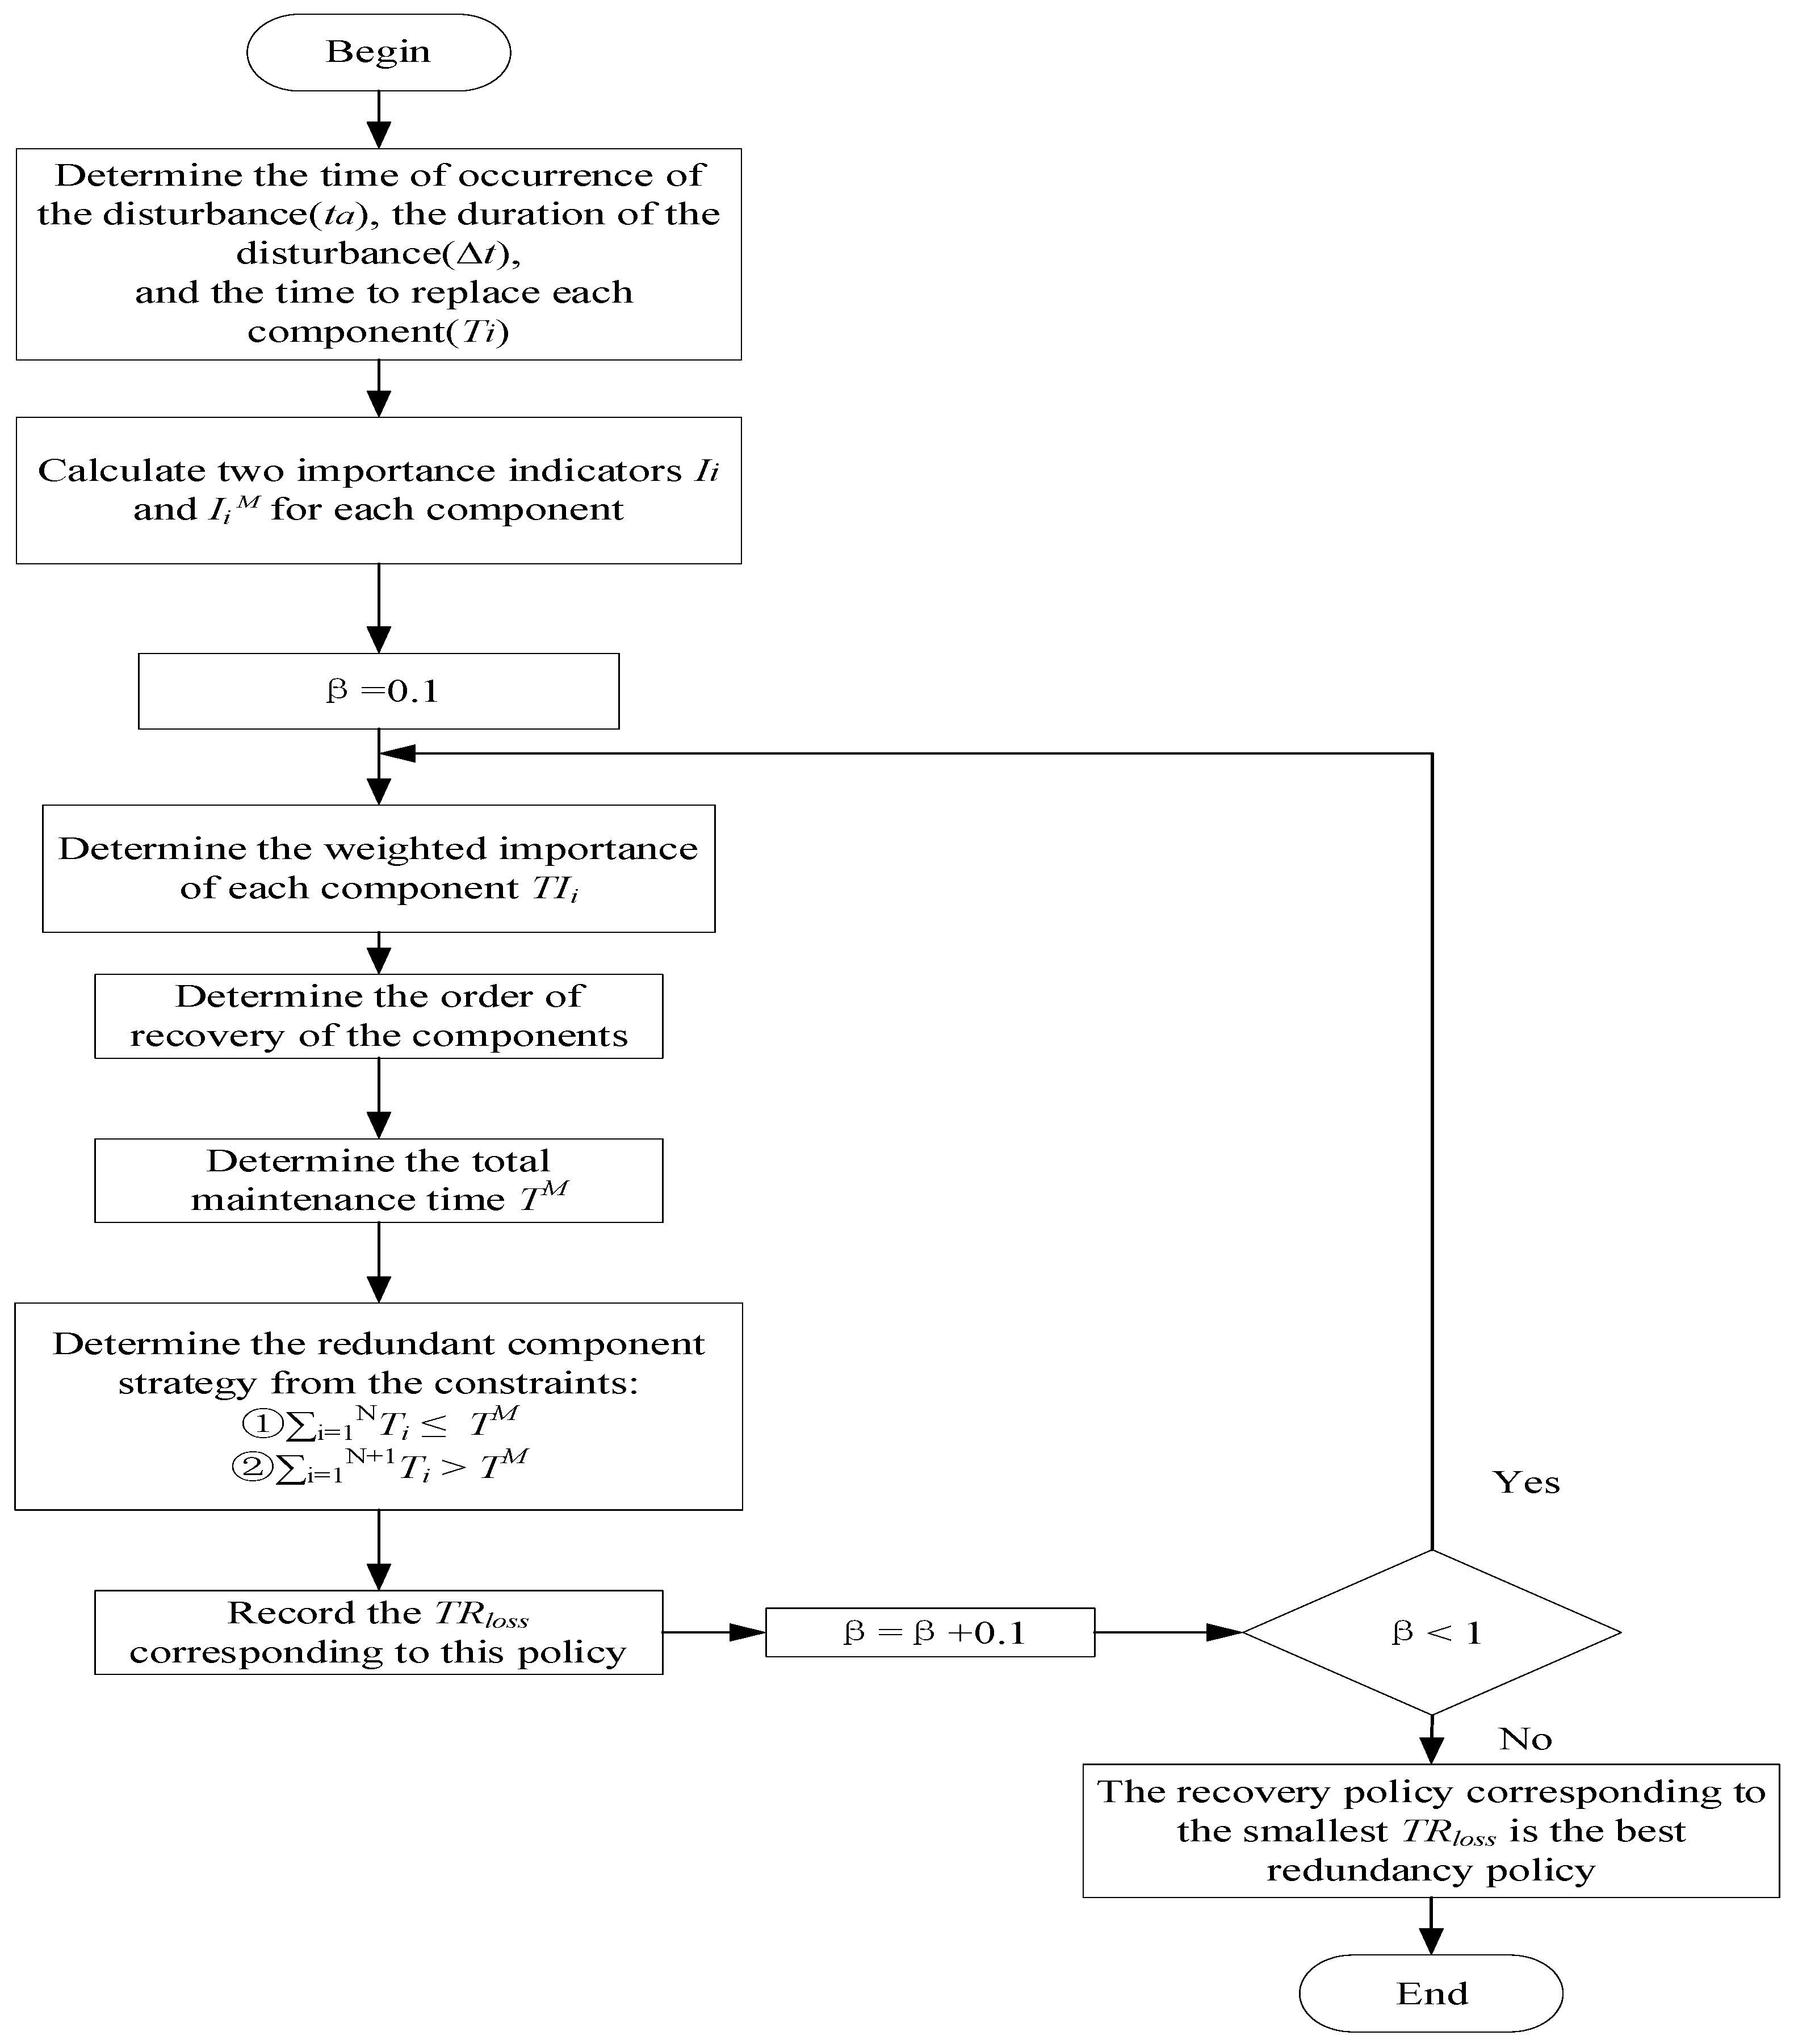
3. Resilience Optimization Considering Redundant Components
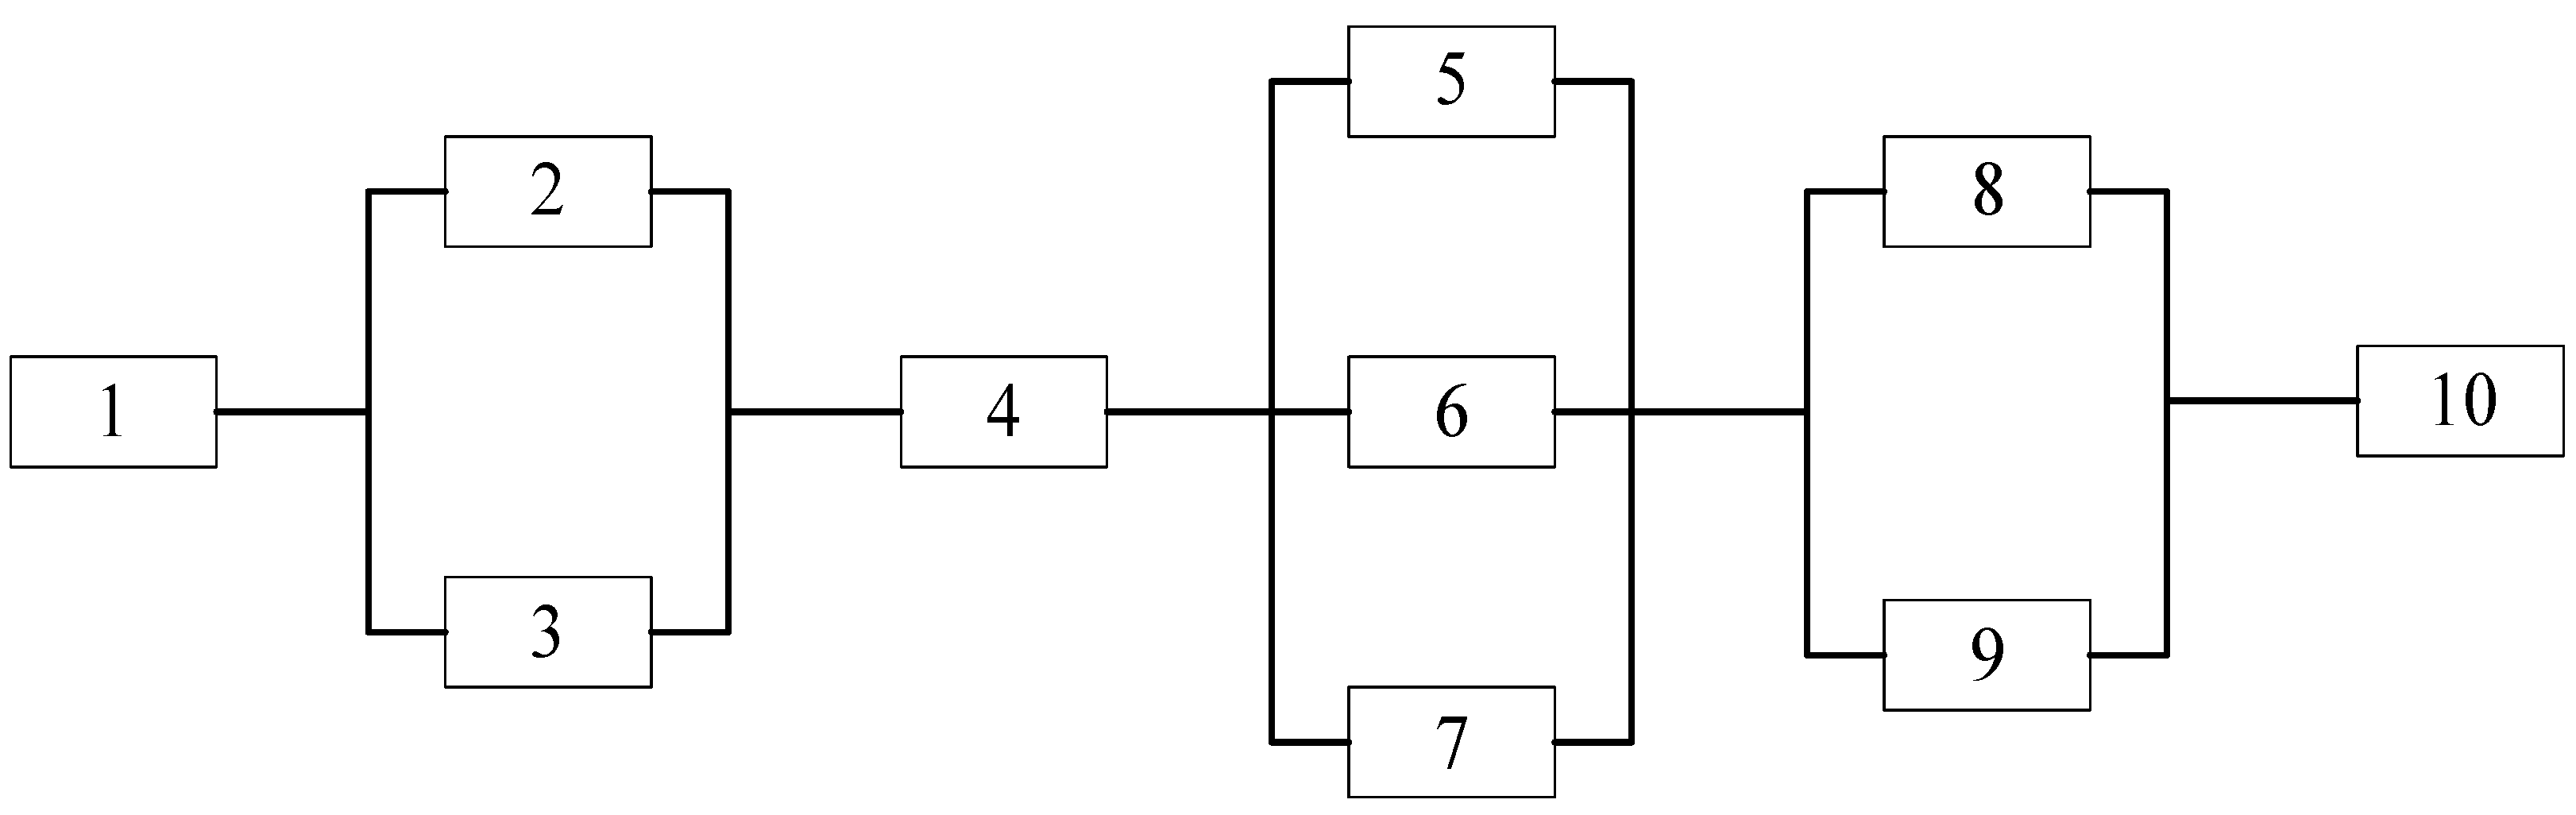
Resilience optimization is used to improve system resilience, which requires the analysis of component resilience. Adding redundancy to components is an important method. However, in reality, due to the constraints of various conditions, it is impossible to add redundancy to each component, so it is necessary to use the importance index to sort them to find the components that have a greater impact on the system reliability.
Suppose that a system consists of n components, and the reliability of the system is a function of the reliability of the components, that is, R t = f ( R 1 t , R 2 t , , R n t ) . Under the influence of disturbance, the reliability of components decreases, and the system reliability also decreases. At this time, the system is at great risk of failure. For example, when a UAV runs on rainy and snowy days, its reliability is affected, but it does not cause damage to the UAV. Suppose that the system is subjected to external disturbances at time t a , and the duration of the disturbances is fixed, expressed as Δ t , at which time the component accelerates failure. The accelerated failure time model is used to determine the component reliability after the end of the disturbance [34], as shown in Equation (3):
R i e t = R i α i t .
In Equation (3), R i e t refers to the reliability function of component i during the disturbance process. R i t is the reliability of component i before it is disturbed. α i is the acceleration coefficient of component i .
Then, the influence degree of each component on the system reliability is obtained when it is disturbed, that is, the loss importance, as shown in Equation (4):
I i = R i ( t a ) R i e t a + Δ t R ( t a ) R t R 1 e t , R 2 e t , R i e t , , R N e t .
In Equation (4), I i refers to the importance of components in the disturbance process. R i ( t a ) is the reliability of component i when disturbed at time t a . R i e t a + Δ t is the reliability of component i after the disturbance, and the duration of the disturbance is Δ t . R t R 1 e t , R 2 e t , R i e t , , R N e t refers to the reliability of the system at the end of the disturbance. When the time t a of the disturbance is determined, the loss importance of the components can be determined. The larger the I i value is, the greater the impact of component i on system reliability when disturbed.
When the components are disturbed, the reliability of the system decreases sharply. At this time, redundant components need to be replaced for system recovery. However, the replacement takes a certain time, and the system continues to operate normally after the replacement is completed. Replacing redundant components can be regarded as repairing and restoring components. Adding redundancy to each component separately can obtain the degree of influence of each component on the system reliability. Since the maintenance time T i can be regarded as the time required to restore component i to a perfect state, from the perspective of system reliability recovery time, the recovery importance of a component can be expressed as
I i M = R t R i = 1 , ϕ . R t R 1 e t , R 2 e t , R i e t , , R N e t i = 1 N T i R t R i = 1 , ϕ . R t R 1 e t , R 2 e t , R i e t , , R N e t T i .
In Equation (5), I i M is the importance of component i during system recovery. ϕ ( . ) denotes the state of all other components, and K i denotes the state of component i . R t R i = 1 , ϕ ( . ) is the system reliability after replacing the redundant component for component i . At this time, component i is a brand-new component, and the reliability is 1. The larger the value of I i M , the greater the impact of replacing the redundant component for component i on the system reliability.
However, from the perspective of the whole system, the study of system resilience needs to consider both system failure and recovery. At this time, using the weighted idea to measure the impacts of components on system reliability, we obtain
T I i = β I i + 1 β I i M .
In Equation (6), T I i indicates the degree of influence of component i on system reliability throughout the disturbance and recovery process, that is, the weighted importance. β and ( 1 β ) are the weights occupied by the two component importance indicators I i and I i M , respectively, and β is between 0 and 1.
In the system design phase, if system resilience is to be maximized, redundant components need to be added for components with a higher T I i , and the risk of the system in the recovery process must be the smallest, so the resilience loss must be the smallest. In addition, in real life, it is often affected by the maintenance time. It is impossible to add redundant components to every component, so the model is optimized as in Equations (7) and (8). The specific solution process is shown in Figure 2.
Objective function: minimize the resilience loss of the system.
min T R l o s s
Constraints:
i = 1 N T i T M
i = 1 N + 1 T i > T M .
In Equations (7) and (8), T M is the maximum maintenance time that can be spent on system recovery. Equation (7) implies that the total time of replacing redundant components for N components cannot exceed the maximum maintenance time T M . Equation (8) implies that the total time taken by a maintenance team to replace redundant components for N + 1 components will exceed the maximum maintenance time T M .
In Figure 2, firstly, according to the actual situation, we can determine the time t a when the disturbance occurs, the duration of the disturbance Δ t , and the time T i required to replace the redundant components for component i . Secondly, using Equations (4) and (5), we can calculate the loss importance I i and recovery importance I i M of component i . Thus, the weighted importance of each component can be obtained via Equation (6). Thirdly, the components are sorted according to their weighted importance. We should first add redundancy to components with larger weighted importance values. Finally, under the limitation of the total maintenance time, we replace the redundant components as much as possible, and the resilience loss can be calculated. Comparing the resilience loss of the system with different β values, the recovery order corresponding to the minimum resilience loss value is the best redundancy strategy.
Considering the universality of the model and the urgency of the maintenance time, we simply set the step size of β to 0.1 based on the idea of traversal, which is convenient for front-line managers to make decisions quickly. Since the weighted importance T I i = β I i + 1 β I i M , the loss importance and recovery importance cannot be covered simultaneously when β = 0 or β = 1 , and thus, β 0,1 .

4. Example Analysis

In this section, we consider a wind turbine system with multiple components. The main components of the system are shown in Table 1. Figure 3 shows the structural connection between the components. And the numbers in Figure 3 correspond to the serial numbers of the components.
Component 1 is the blade that captures the wind energy to turn the turbine. Components 2 and 3 are two independent pitch systems that are connected in parallel to form a dual pitch control system for more flexible and precise control of the turbine. Component 4 is the hub, ensuring the stable operation of the turbine rotor and blades through structural support, rotation, and steering functions. Components 5, 6, and 7 are stator coils that are connected in parallel to form a three-phase wound generator stator, providing a more stable and balanced power output. Components 8 and 9 are rotors that are connected in parallel to form a multi-rotor generator that interacts with the generator’s stator to generate electrical energy and increase the power output of the entire system. Component 10 is the yaw system, which controls the direction of the entire wind turbine [19].
The Weibull distribution is used to analyze the life and failure modes of a component or system. Therefore, we assume that the component lifetime obeys the Weibull distribution, the failure rate function is λ i t = γ θ ( t θ ) γ 2 , the reliability function is R i t = e x p [ ( t θ ) γ 1 ] , and the parameters of each component are shown in Table 2.

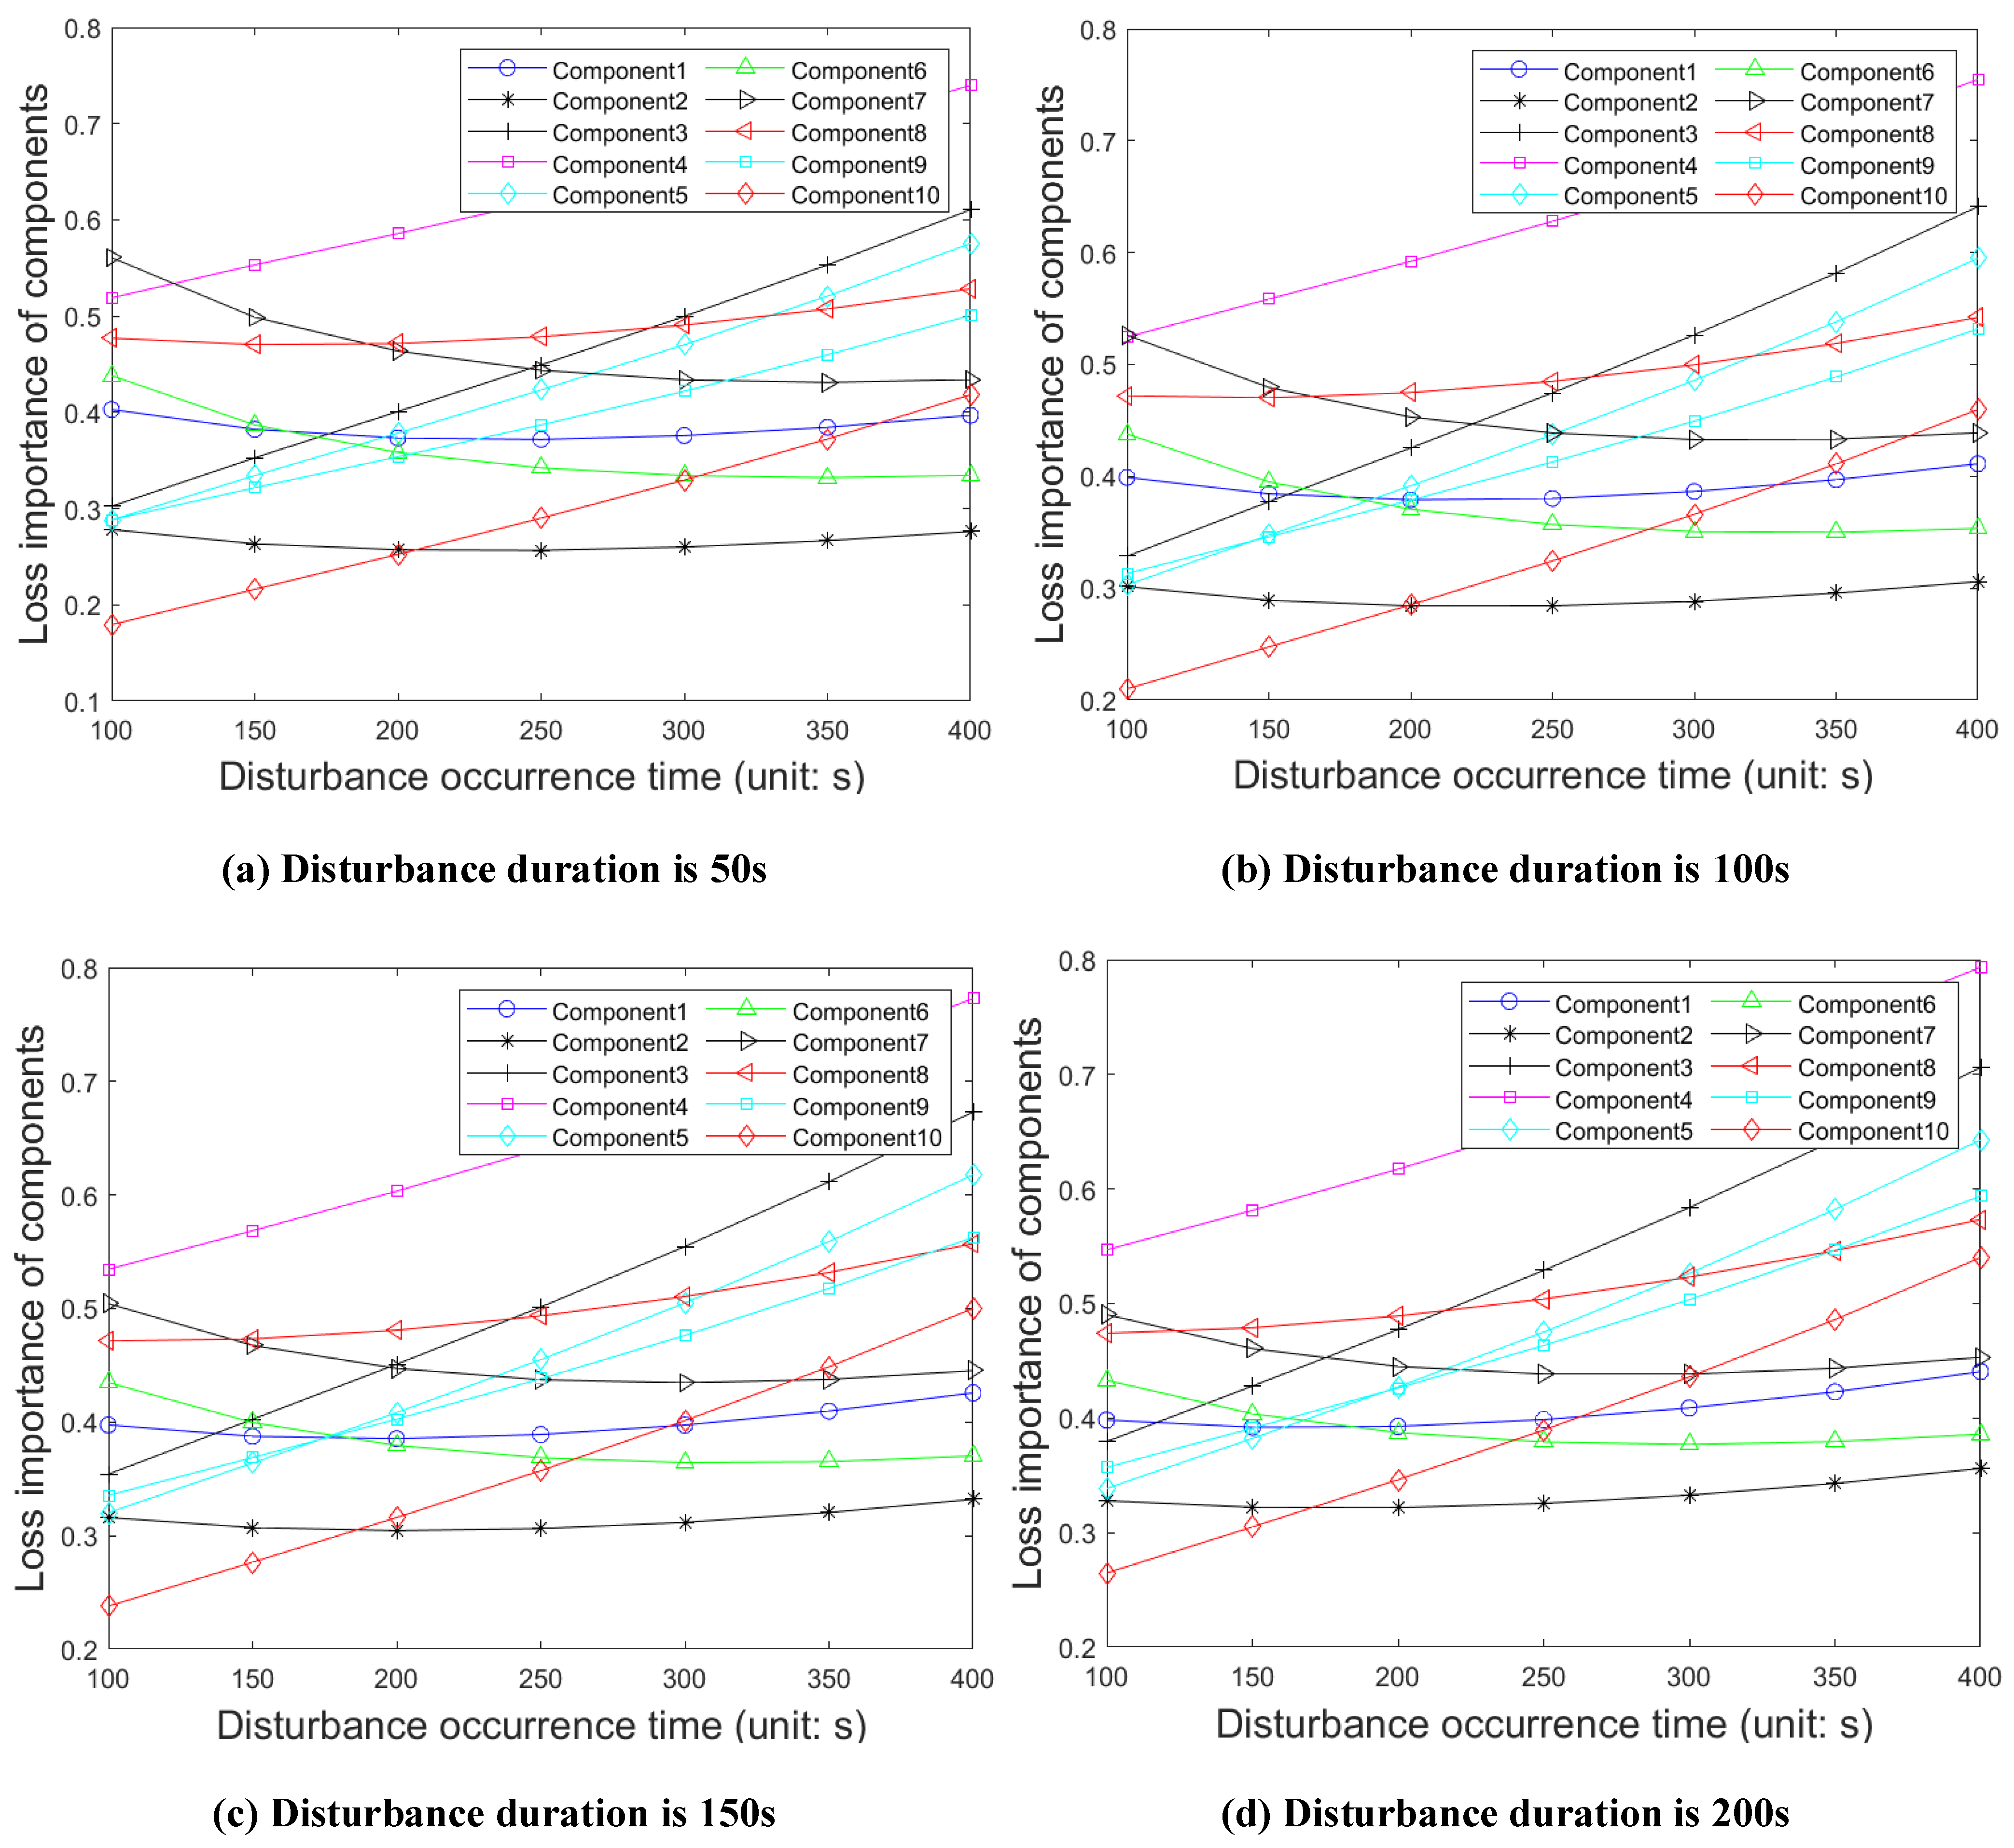
4.1. Analysis of Loss Importance

When the wind turbine system is disturbed, the reliability of the components decreases rapidly, and the risk of wind turbine system failure increases sharply. When the duration of the disturbance is constant, the component reliability and wind turbine system reliability are analyzed at the same time. Then, the influence degree of the component on the wind turbine system reliability can be determined, that is, the loss importance I i , as shown in Figure 4.
From Figure 4, we can obtain the importance of each component when the wind turbine system is disturbed. With the increase in the occurrence time of the disturbance, the importance curves of component 6 and component 7 show a downward trend, while the importance curves of the other components show an upward trend. This indicates that when the wind turbine system is disturbed, the influence of component 6 and component 7 on the wind turbine system reliability becomes smaller and smaller with the increase in the occurrence time of the disturbance, while the influence of the other components on the wind turbine system reliability becomes larger and larger. And the importance curves of component 3, component 4, component 5, component 9, and component 10 rise faster, which indicates that the importance of the components changes more and more with the increase in the occurrence time of the disturbance, and the impact on the wind turbine system reliability increases.
In addition, the importance curves of the components in Figure 4 intersect with each other, so the order of component importance is constantly changing. The component of the upper curve in each graph is more important. For example, when the duration of the disturbance is 50 s and 100 s, it can be obtained that the importance I 7 of component 7 is the largest when the occurrence time of the disturbance is 100 s. With the increase in the occurrence time of the disturbance, the importance I 4 of component 4 exceeds I 7 and becomes the largest and remains unchanged. As the occurrence time of the disturbance increases, the importance curve of component 10 continues to rise, and intersects with the importance curves of component 2, component 6, and component 1, successively.

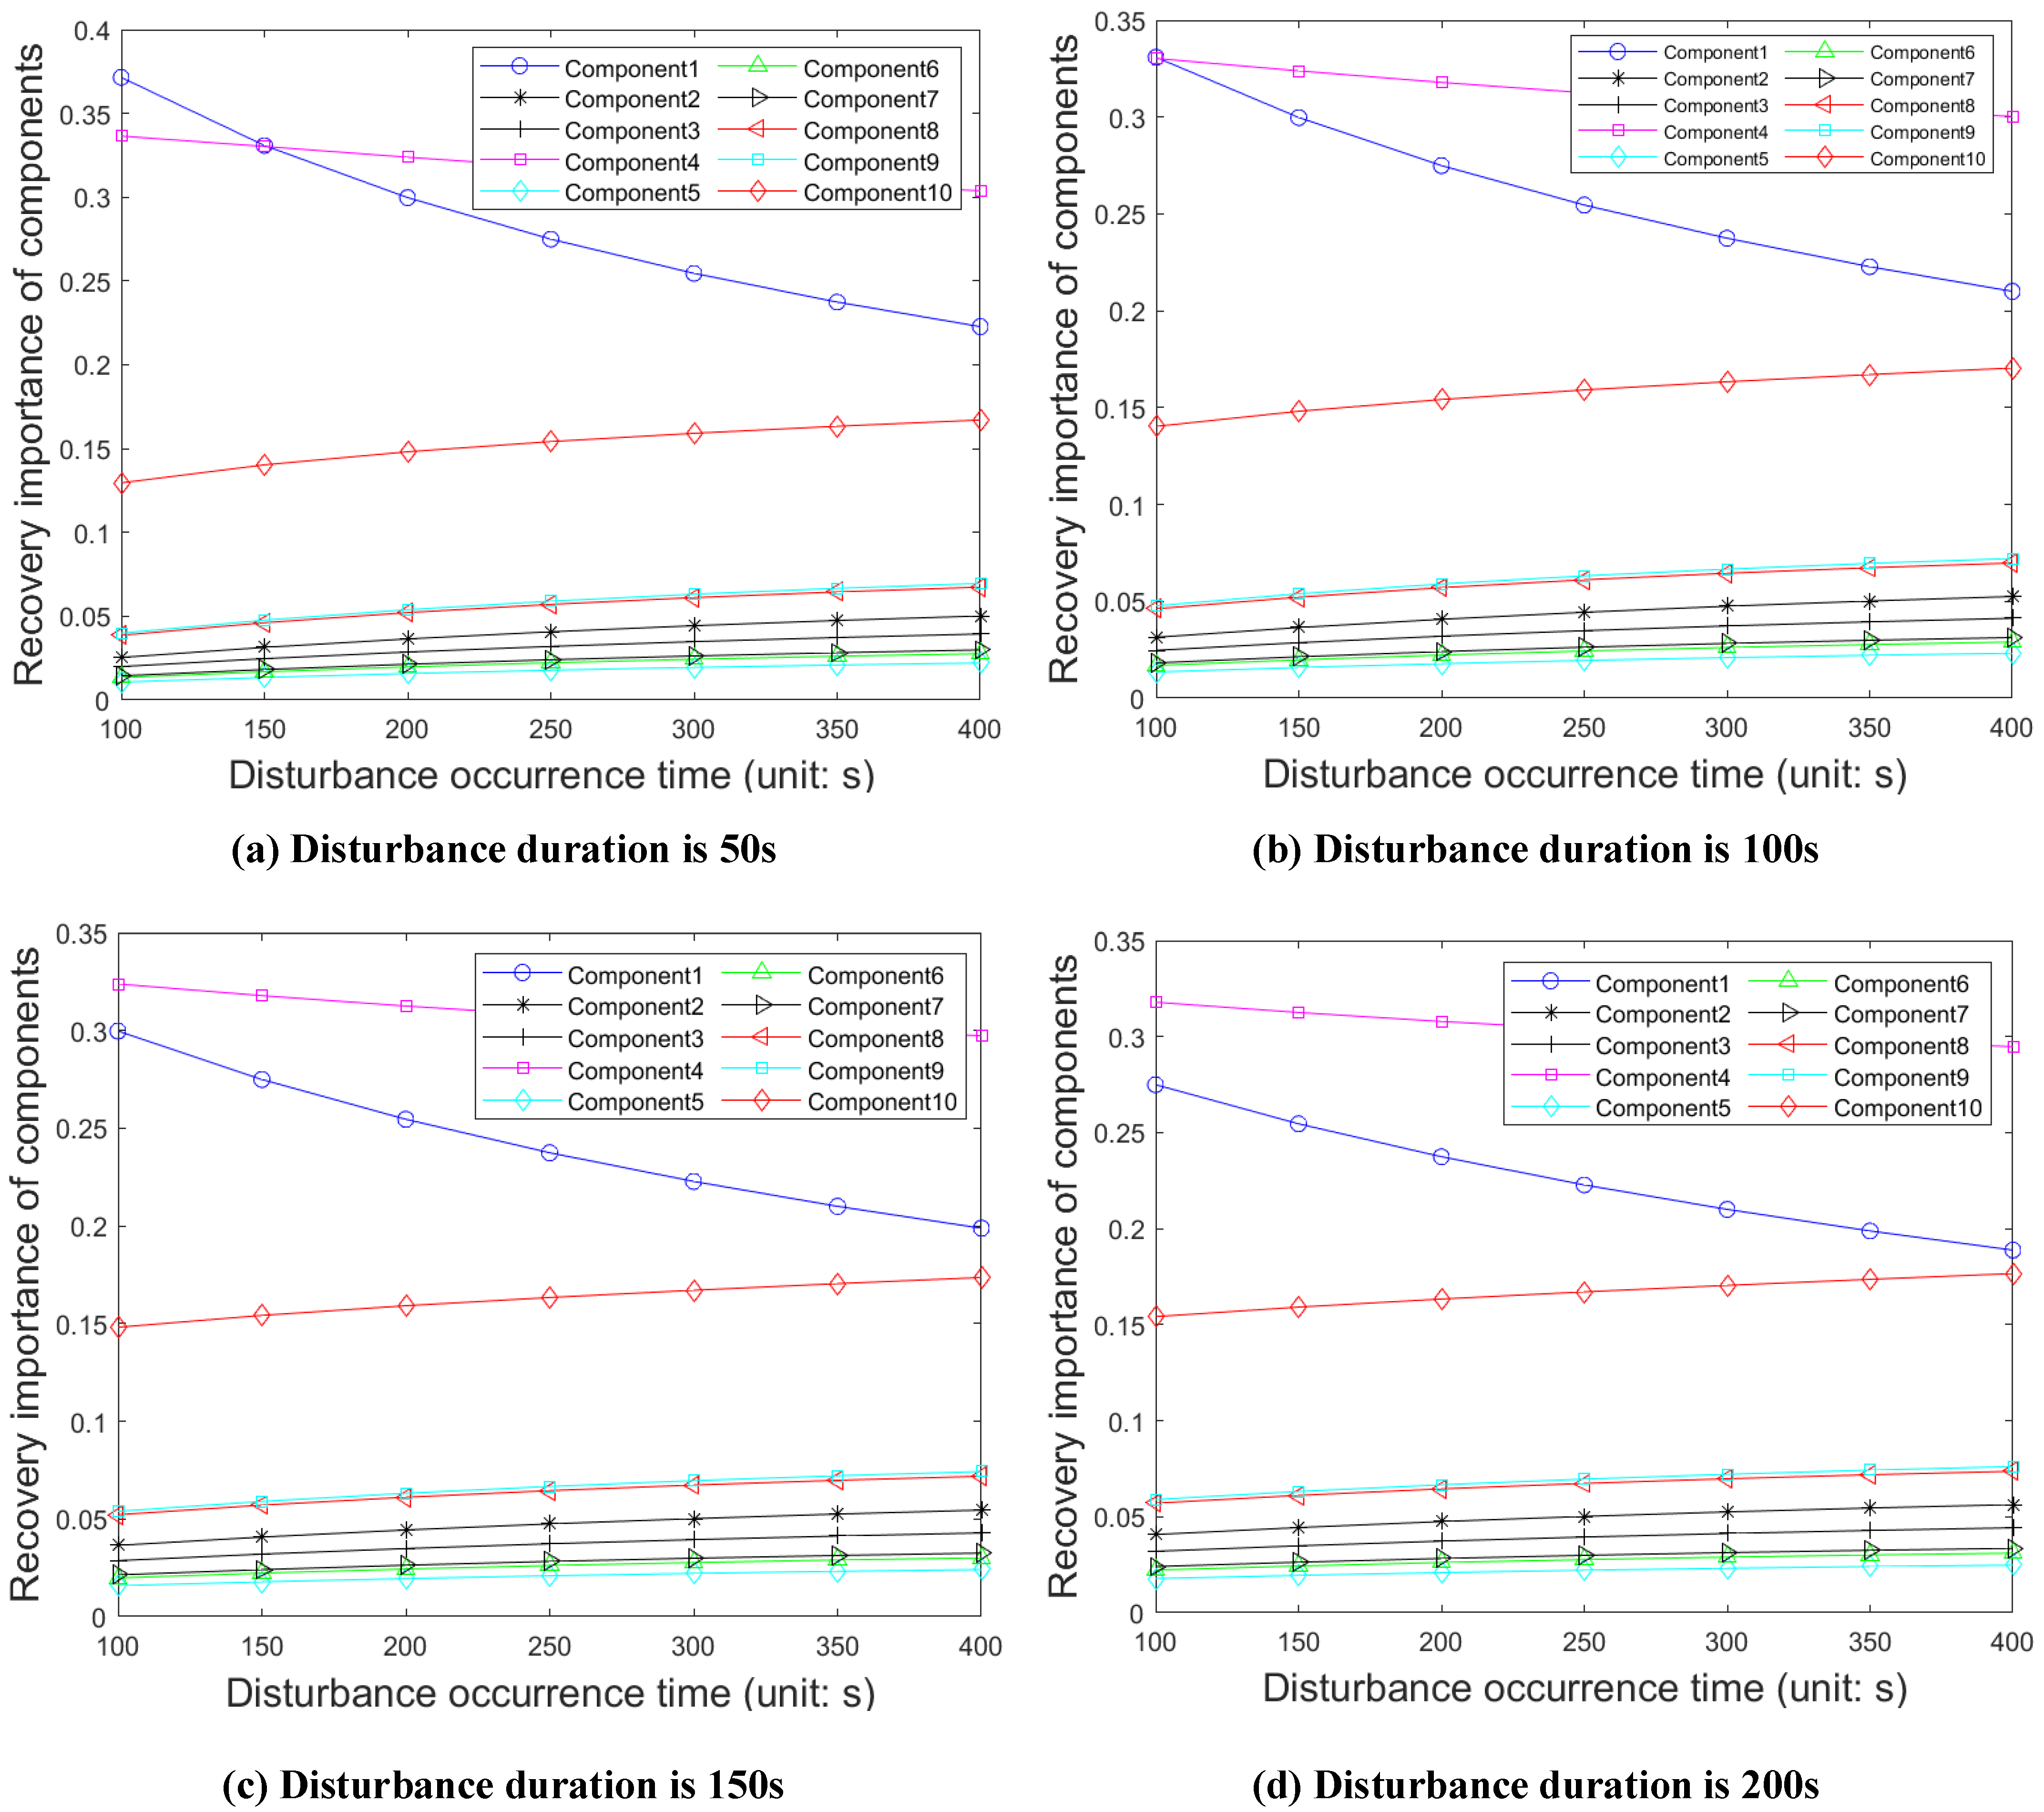
4.2. Analysis of Recovery Importance

In the recovery phase, the reliability of the wind turbine system is gradually recovered by replacing redundant components for each component. By replacing the redundant component for each component separately, the degree of influence of each component on the wind turbine system reliability, that is, the recovery importance I i M , can be obtained, as shown in Figure 5.
In Figure 5, we can see that the importance curves of the components show a decreasing trend except for the importance curves of component 1 and component 4, which show an increasing trend but a slower trend. However, regardless of the duration of the disturbance, the components with higher importance are I 1 M , I 4 M , and I 10 M . This indicates that the three components have a strong influence on the wind turbine system reliability during the recovery process. The components with lower component importance are always component 9, component 8, component 2, component 3, component 7, component 6, and component 5, and the order of importance remains the same regardless of the disturbance duration: I 9 M > I 8 M > I 2 M > I 3 M > I 7 M > I 6 M > I 5 M .
When the disturbance duration is 50 s and 100 s, the importance curve of component 1 intersects with the importance curve of component 4. And when the disturbance duration is 150 s and 200 s, I 4 M is always maximum and the order of importance keeps constant as I 4 M > I 1 M > I 10 M .

4.3. Analysis of Weighted Importance

The study of the resilience of the wind turbine system needs to consider both loss importance and recovery importance to accurately analyze the impact of each component on the wind turbine system reliability. According to the weighting idea, when the disturbance duration Δ t is 100 s, the weighted importance of the components T I i is obtained, as shown in Figure 6.
As can be seen in Figure 6, as the weight of the loss of importance increases, the importance curves of component 1 and component 10 change from higher levels to gradually intersect with the importance curves of the other components, while the importance curve of component 4 is always at the highest position. By analyzing the weighted importance of the components, the redundancy strategy of the wind turbine system can be determined when the disturbance occurrence time, the disturbance duration, and the total maintenance time are determined.

4.4. Determination of Redundancy Strategy

Since the impact of the maintenance time needs to be considered in realistic situations, the redundant components were reasonably added to maximize system resilience and minimize system risk under the limited maintenance time. Determining the total maintenance time T M as 900 s, the occurrence time of disturbance t a as 100 s, and the duration time disturbance Δ t as 100 s, the weighted importance ranking of each component with different β values can be obtained from Figure 6 to determine the order of adding redundant components.
After simulation, it was concluded that T R l o s s has a minimum value when β = 0.2 . The weighted importance values of each component under this condition are shown in Table 3.
As a result, redundant components should be added to component 4, component 1, component 10, component 8, component 7, and component 6 in that order. At this time, if the redundant components are added to any of the components 2, 3, and 9, the total maintenance time T M will be exceeded.
To verify the effectiveness of the method, it was compared with several random redundancy strategies. The change process of system reliability with different redundancy strategies is shown in Figure 7.
In Figure 7, considering the disturbance and recovery process at the same time, the redundancy strategy determined using the weighted importance of the components is better than the random redundancy strategies at improving the reliability of the wind turbine system. And it can provide more effective help by adding redundant components in the system design stage.
In this paper, the redundancy strategy determined using weighted importance can minimize system resilience loss, that is, maximize system resilience. Table 4 shows the resilience loss with different strategies.
In Table 4, we use a random function to generate several random recovery orders, calculate the corresponding resilience loss, and take the average value. The loss of resilience is compared with that of the proposed method. The results show that the loss of resilience with the redundancy strategy determined using the weighted importance that is proposed in this paper is lower than the loss of resilience with the random redundancy strategies, which confirms the effectiveness of the redundancy strategy proposed in this paper.

5. Conclusions and Future Work

  • In this paper, according to the resilience loss before and after the system was disturbed, the system resilience was measured.
  • In this paper, the weighted importance measure was used to determine the degree of influence of components on system reliability. We should prioritize adding redundancy to the components with higher weighted importance.
  • In this paper, under the constraint of total maintenance time, a redundancy strategy was developed to reduce the resilience loss of the system through the resilience optimization model.
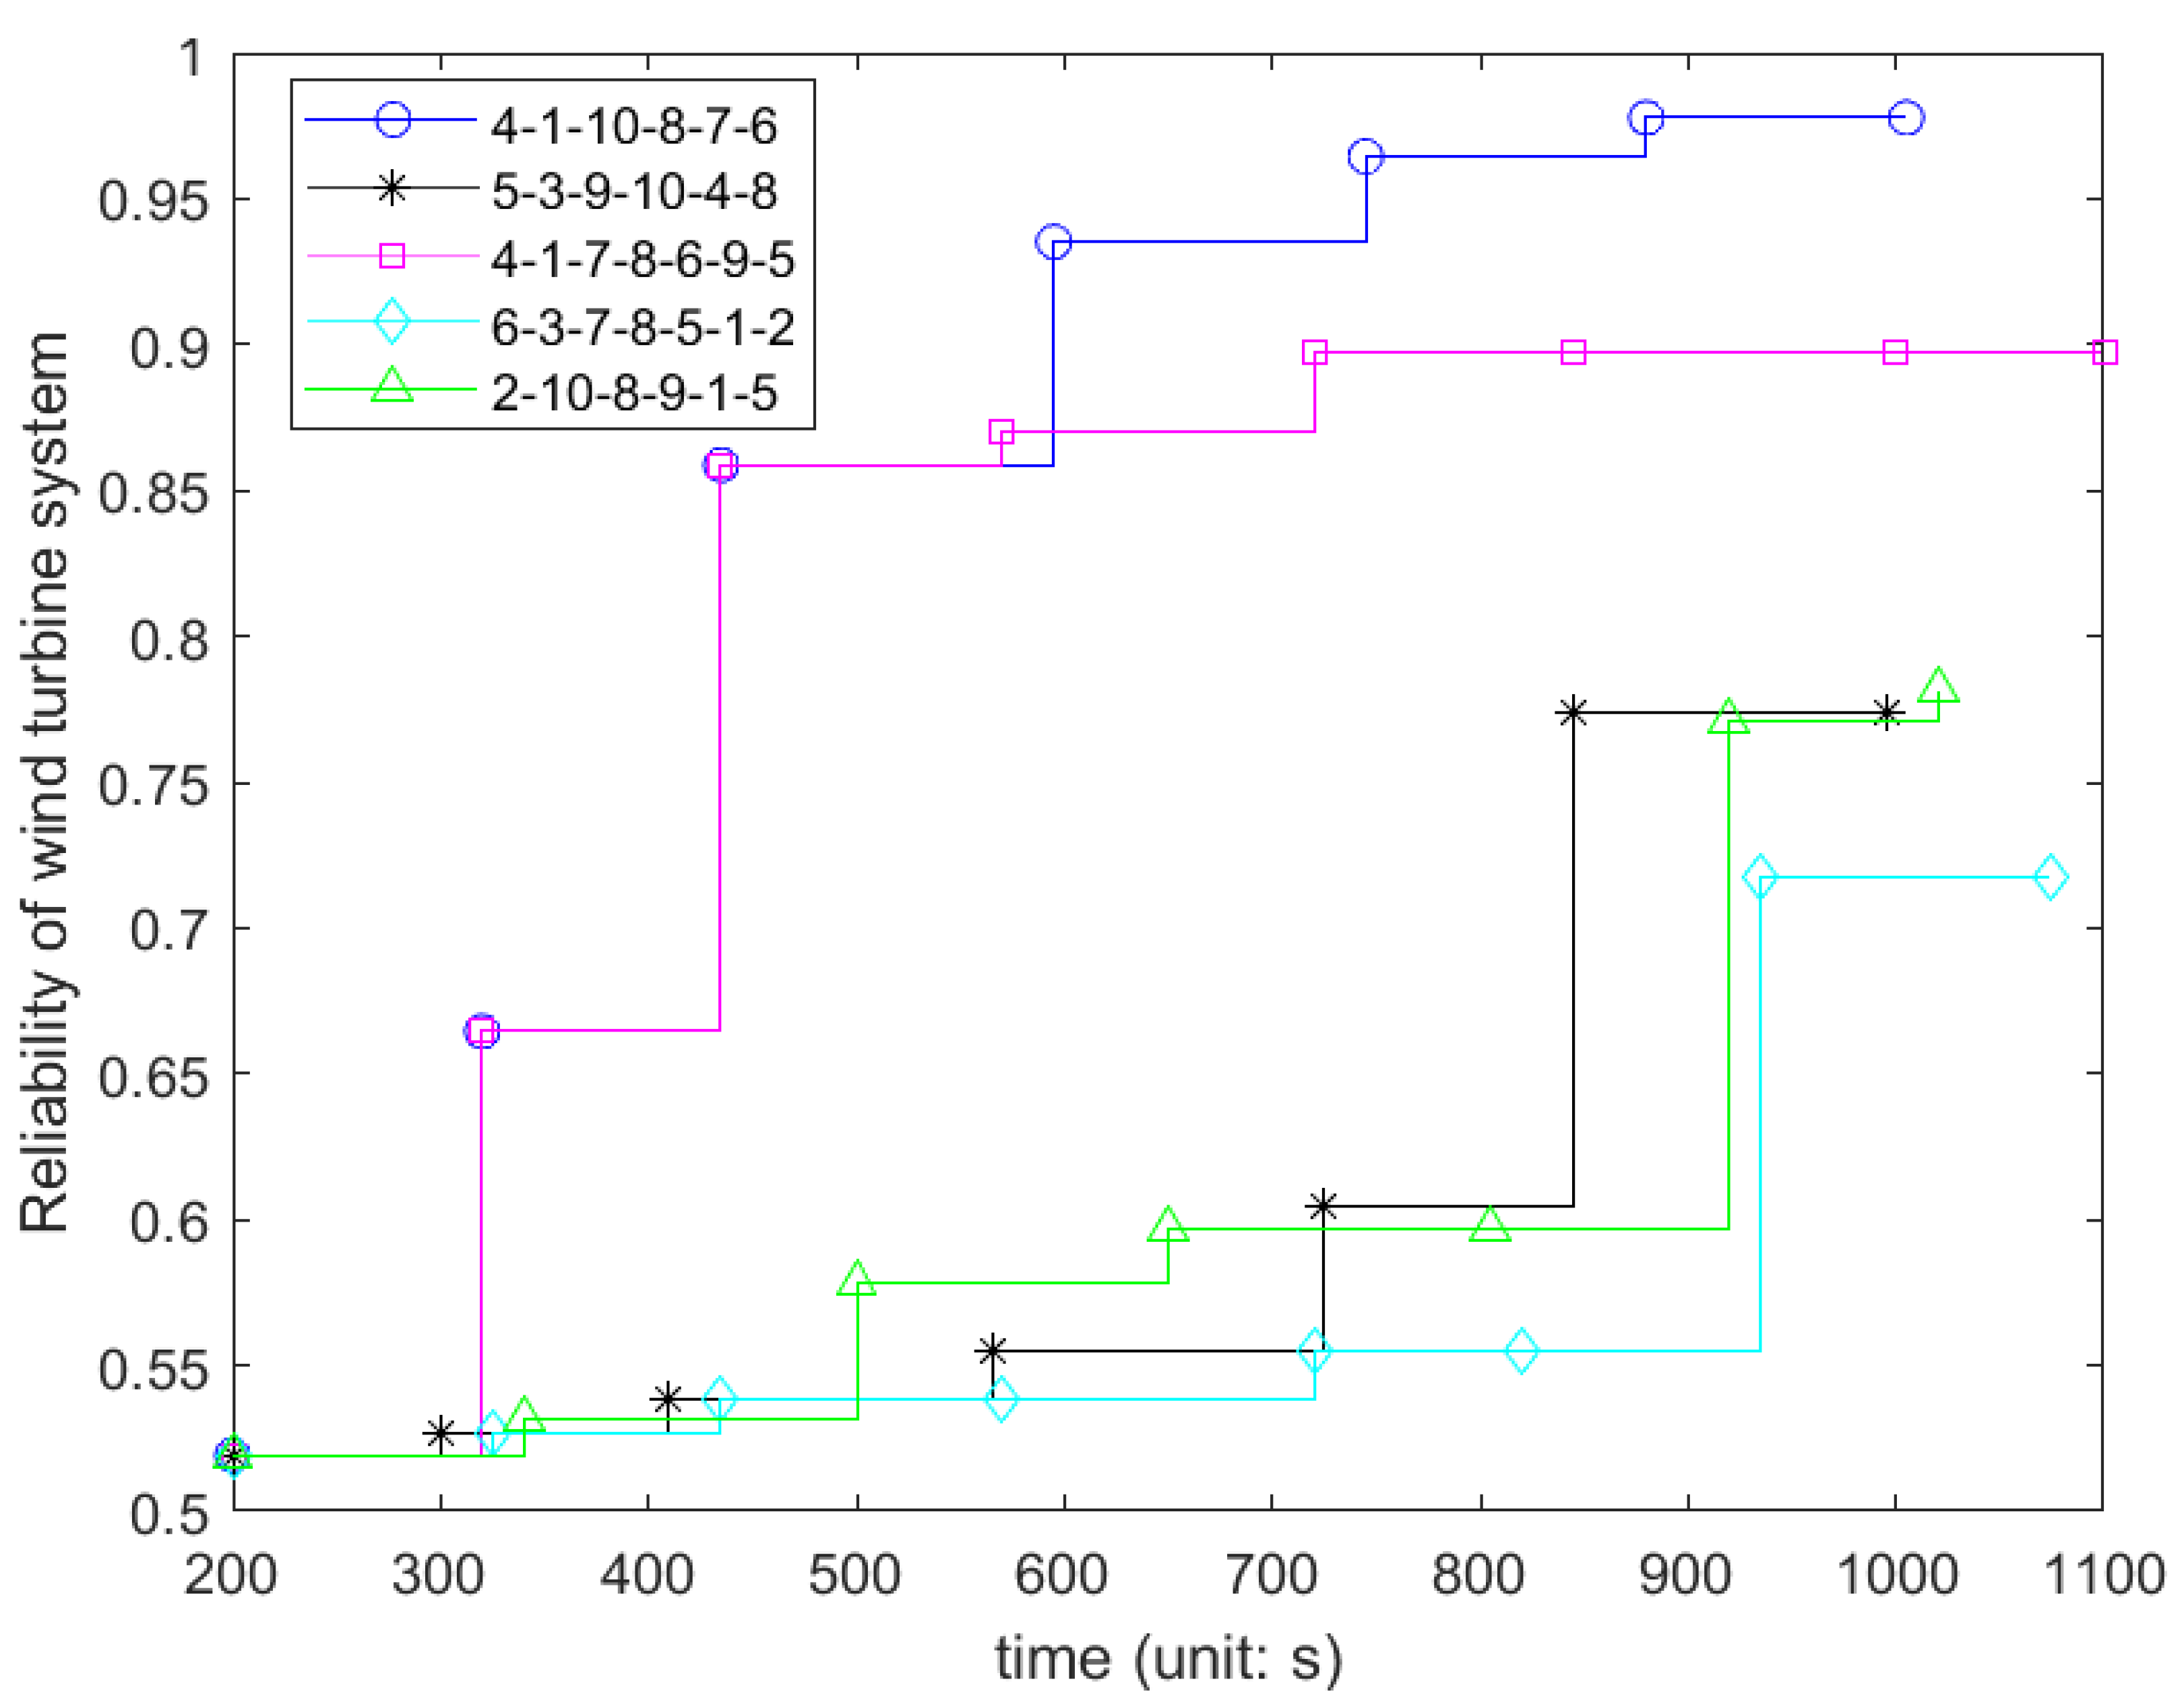
  • In the case study, we applied the model proposed in this paper to a wind turbine system with multiple components and verified the validity of the model. The wind turbine system had 10 major components, and the resilience loss of the as was calculated by analyzing the reliability of the system during the disturbance and during the recovery process. The priority of adding redundancy to the components was obtained by calculating the weighted importance of the components. After the calculation, 4-1-10-8-7-6 was obtained as the best redundancy strategy. The example shows that the redundancy strategy determined using this method can reduce the loss of system resilience, which verifies the accuracy of the model.
In real life, the occurrence time and duration of natural disasters, human factors, and other factors in a system are more likely to be random or uncertain. Therefore, in future research, we could deepen the study of the disturbance stage of a system, for example, the time of disturbance and the duration of disturbance can be changed. In addition, the model in this paper can be extended to multi-state multi-component systems.

Author Contributions

Conceptualization, H.D. and X.W.; methodology, H.D.; software, X.W.; validation, H.Z.; formal analysis, X.W.; investigation, H.D.; resources, H.Z.; data curation, X.W.; writing—original draft preparation, X.W. and H.D.; writing—review and editing, H.D. and H.Z.; supervision, H.Z.; funding acquisition, H.D. All authors have read and agreed to the published version of the manuscript.

Funding

This research was funded by the Key Science and Technology Program of Henan Province (no. 222102520019).

Data Availability Statement

The authors confirm that the data supporting the findings of this study are available within the article.

Conflicts of Interest

The authors declare no conflict of interest.

References

  1. Dui, H.; Yang, Y.; Zhang, Y.-A.; Zhu, Y. Recovery Analysis and Maintenance Priority of Metro Networks Based on Importance Measure. Mathematics 2022, 10, 3989. [Google Scholar] [CrossRef]
  2. Li, R.; Gao, Y. On the Component Resilience Importance Measures for Infrastructure Systems. Int. J. Crit. Infrastruct. Prot. 2022, 36, 100481. [Google Scholar] [CrossRef]
  3. Wang, N.; Wu, M.; Yuen, K.F. Assessment of Port Resilience Using Bayesian Network: A Study of Strategies to Enhance Readiness and Response Capacities. Reliab. Eng. Syst. Saf. 2023, 237, 109394. [Google Scholar] [CrossRef]
  4. An, X.; Yin, Z.; Tong, Q.; Fang, Y.; Yang, M.; Yang, Q.; Meng, H. An Integrated Resilience Assessment Methodology for Emergency Response Systems Based on Multi-Stage STAMP and Dynamic Bayesian Networks. Reliab. Eng. Syst. Saf. 2023, 238, 109445. [Google Scholar] [CrossRef]
  5. Lian, X.; Qian, T.; Li, Z.; Chen, X.; Tang, W. Resilience Assessment for Power System Based on Cascading Failure Graph under Disturbances Caused by Extreme Weather Events. Int. J. Electr. Power Energy Syst. 2023, 145, 108616. [Google Scholar] [CrossRef]
  6. Tong, Q.; Gernay, T. Resilience Assessment of Process Industry Facilities Using Dynamic Bayesian Networks. Process Saf. Environ. Prot. 2023, 169, 547–563. [Google Scholar] [CrossRef]
  7. Wang, X.; Kang, Q.; Wei, X.; Guo, L.; Liang, Z. Resilience Assessment and Recovery of Distribution Network Considering the Influence of Communication Network. Int. J. Electr. Power Energy Syst. 2023, 152, 109280. [Google Scholar] [CrossRef]
  8. Liu, M.; Wang, D.; Zhao, J.; Si, S. Importance Measure Construction and Solving Algorithm Oriented to the Cost-Constrained Reliability Optimization Model. Reliab. Eng. Syst. Saf. 2022, 222, 108406. [Google Scholar] [CrossRef]
  9. Wu, G.; Li, M.; Li, Z.S. Resilience-Based Optimal Recovery Strategy for Cyber–Physical Power Systems Considering Component Multistate Failures. IEEE Trans. Rel. 2021, 70, 1510–1524. [Google Scholar] [CrossRef]
  10. Barker, K.; Ramirez-Marquez, J.E.; Rocco, C.M. Resilience-Based Network Component Importance Measures. Reliab. Eng. Syst. Saf. 2013, 117, 89–97. [Google Scholar] [CrossRef]
  11. Jiang, Q.; Cai, B.; Zhang, Y.; Xie, M.; Liu, C. Resilience Assessment Methodology of Natural Gas Network System under Random Leakage. Reliab. Eng. Syst. Saf. 2023, 234, 109134. [Google Scholar] [CrossRef]
  12. Dong, Q.; Cui, L. Reliability Analysis of a System with Two-Stage Degradation Using Wiener Processes with Piecewise Linear Drift. IMA J. Manag. Math. 2021, 32, 3–29. [Google Scholar] [CrossRef]
  13. Li, H.; Sun, Q.; Zhong, Y.; Huang, Z.; Zhang, Y. A Soft Resource Optimization Method for Improving the Resilience of UAV Swarms under Continuous Attack. Reliab. Eng. Syst. Saf. 2023, 237, 109368. [Google Scholar] [CrossRef]
  14. Dong, S.; Gao, X.; Mostafavi, A.; Gao, J.; Gangwal, U. Characterizing Resilience of Flood-Disrupted Dynamic Transportation Network through the Lens of Link Reliability and Stability. Reliab. Eng. Syst. Saf. 2023, 232, 109071. [Google Scholar] [CrossRef]
  15. Zhou, J.; Coit, D.W.; Felder, F.A.; Tsianikas, S. Combined Optimization of System Reliability Improvement and Resilience with Mixed Cascading Failures in Dependent Network Systems. Reliab. Eng. Syst. Saf. 2023, 237, 109376. [Google Scholar] [CrossRef]
  16. Tang, J.; Xu, L.; Luo, C.; Ng, T.S.A. Multi-Disruption Resilience Assessment of Rail Transit Systems with Optimized Commuter Flows. Reliab. Eng. Syst. Saf. 2021, 214, 107715. [Google Scholar] [CrossRef]
  17. Zhang, M.; Yang, X.; Zhang, J.; Li, G. Post-Earthquake Resilience Optimization of a Rural “Road-Bridge” Transportation Network System. Reliab. Eng. Syst. Saf. 2022, 225, 108570. [Google Scholar] [CrossRef]
  18. Tiong, A.; Vergara, H.A. A Two-Stage Stochastic Multi-Objective Resilience Optimization Model for Network Expansion of Interdependent Power–Water Networks under Disruption. Int. J. Crit. Infrastruct. Prot. 2023, 40, 100588. [Google Scholar] [CrossRef]
  19. Dui, H.; Zhang, Y.; Zhang, Y.-A. Grouping Maintenance Policy for Improving Reliability of Wind Turbine Systems Considering Variable Cost. Mathematics 2023, 11, 1954. [Google Scholar] [CrossRef]
  20. Liu, M.; Qi, X.; Pan, H. Optimizing Communication Network Geodiversity for Disaster Resilience through Shielding Approach. Reliab. Eng. Syst. Saf. 2022, 228, 108800. [Google Scholar] [CrossRef]
  21. Feng, Q.; Hai, X.; Sun, B.; Ren, Y.; Wang, Z.; Yang, D.; Hu, Y.; Feng, R. Resilience Optimization for Multi-UAV Formation Reconfiguration via Enhanced Pigeon-Inspired Optimization. Chin. J. Aeronaut. 2022, 35, 110–123. [Google Scholar] [CrossRef]
  22. Schworm, P.; Wu, X.; Klar, M.; Gayer, J.; Glatt, M.; Aurich, J.C. Resilience Optimization in Manufacturing Systems Using Quantum Annealing. Manuf. Lett. 2023, 36, 13–17. [Google Scholar] [CrossRef]
  23. Liu, D.; Li, M.; Ji, Y.; Fu, Q.; Li, M.; Abrar Faiz, M.; Ali, S.; Li, T.; Cui, S.; Imran Khan, M. Spatial-Temporal Characteristics Analysis of Water Resource System Resilience in Irrigation Areas Based on a Support Vector Machine Model Optimized by the Modified Gray Wolf Algorithm. J. Hydrol. 2021, 597, 125758. [Google Scholar] [CrossRef]
  24. Feng, Q.; Hai, X.; Liu, M.; Yang, D.; Wang, Z.; Ren, Y.; Sun, B.; Cai, B. Time-Based Resilience Metric for Smart Manufacturing Systems and Optimization Method with Dual-Strategy Recovery. J. Manuf. Syst. 2022, 65, 486–497. [Google Scholar] [CrossRef]
  25. Dui, H.; Wei, X.; Xing, L. A New Multi-Criteria Importance Measure and Its Applications to Risk Reduction and Safety Enhancement. Reliab. Eng. Syst. Saf. 2023, 235, 109275. [Google Scholar] [CrossRef]
  26. Chen, R.; Zhang, C.; Wang, S.; Zio, E.; Dui, H.; Zhang, Y. Importance Measures for Critical Components in Complex System Based on Copula Hierarchical Bayesian Network. Reliab. Eng. Syst. Saf. 2023, 230, 108883. [Google Scholar] [CrossRef]
  27. Dui, H.; Xu, Z.; Chen, L.; Xing, L.; Liu, B. Data-Driven Maintenance Priority and Resilience Evaluation of Performance Loss in a Main Coolant System. Mathematics 2022, 10, 563. [Google Scholar] [CrossRef]
  28. Zhang, C.; Chen, R.; Wang, S.; Dui, H.; Zhang, Y. Resilience Efficiency Importance Measure for the Selection of a Component Maintenance Strategy to Improve System Performance Recovery. Reliab. Eng. Syst. Saf. 2022, 217, 108070. [Google Scholar] [CrossRef]
  29. Dui, H.; Xu, H.; Zhang, Y.-A. Reliability Analysis and Redundancy Optimization of a Command Post Phased-Mission System. Mathematics 2022, 10, 4180. [Google Scholar] [CrossRef]
  30. Do, P.; Bérenguer, C. Conditional Reliability-Based Importance Measures. Reliab. Eng. Syst. Saf. 2020, 193, 106633. [Google Scholar] [CrossRef]
  31. Chen, L.; Gao, Y.; Dui, H.; Xing, L. Importance Measure-Based Maintenance Optimization Strategy for Pod Slewing System. Reliab. Eng. Syst. Saf. 2021, 216, 108001. [Google Scholar] [CrossRef]
  32. Tong, Q.; Yang, M.; Zinetullina, A. A Dynamic Bayesian Network-Based Approach to Resilience Assessment of Engineered Systems. J. Loss Prev. Process Ind. 2020, 65, 104152. [Google Scholar] [CrossRef]
  33. Hosseini, S.; Barker, K.; Ramirez-Marquez, J.E. A Review of Definitions and Measures of System Resilience. Reliab. Eng. Syst. Saf. 2016, 145, 47–61. [Google Scholar] [CrossRef]
  34. Xing, L.; Amari, S.V.; Wang, C. Reliability of K-out-of-n Systems with Phased-Mission Requirements and Imperfect Fault Coverage. Reliab. Eng. Syst. Saf. 2012, 103, 45–50. [Google Scholar] [CrossRef]
Figure 1. System resilience model.
Mathematics 11 03151 g001
Figure 2. The solution process.
Mathematics 11 03151 g002
Figure 3. The wind turbine system with main components.
Mathematics 11 03151 g003
Figure 4. Loss importance of components.
Mathematics 11 03151 g004
Figure 5. Recovery importance of components.
Mathematics 11 03151 g005
Figure 6. Weighted importance of components.
Mathematics 11 03151 g006
Figure 7. The change process of wind turbine system reliability with different redundancy strategies.
Mathematics 11 03151 g007
Table 1. The main components of the wind turbine system.
Component12345678910
NameBladePitch
system 1
Pitch
system 2
HubStator coil 1Stator coil 2Stator coil 3Rotor 1Rotor 2Yaw system
Table 2. Parameters of each component (unit of Ti: s).
Component12345678910
Parameter
θ 3247257424162150358919772165255023792199
γ 1.651.762.211.962.141.541.481.752.112.36
α i 21.52.32.52.81.72.22.221.8
T i 115140110120100125135150155160
Table 3. Weighted importance value of each component.
Component12345678910
T I i 0.344480.0854420.0854710.369110.713820.101060.119810.131330.100780.15425
Table 4. Resilience loss with different redundancy strategies.
StrategyRedundant Order T R l o s s Average Value
The redundancy strategy
proposed in this paper
4-1-10-8-7-6122.2039122.2039
Random redundancy strategy 15-3-9-10-4-8335.6879314.1650
Random redundancy strategy 24-1-7-8-6-9-5172.5302
Random redundancy strategy 36-3-7-8-5-1-2399.7999
Random redundancy strategy 42-10-8-9-1-5348.6421
Disclaimer/Publisher’s Note: The statements, opinions and data contained in all publications are solely those of the individual author(s) and contributor(s) and not of MDPI and/or the editor(s). MDPI and/or the editor(s) disclaim responsibility for any injury to people or property resulting from any ideas, methods, instructions or products referred to in the content.

