Modeling the Cigarette Consumption of Poor Households Using Penalized Zero-Inflated Negative Binomial Regression with Minimax Concave Penalty
Abstract
:1. Introduction
2. Materials and Methods
2.1. Data
2.2. Zero-Inflated Negative Binomial (ZINB)
2.3. Penalized Zero-Inflated Negative Binomial (ZINB) Regression
- Least absolute shrinkage and selection operator (LASSO). The penalty function is given by [3]:where is the penalty coefficients.
- Smoothly clipped absolute shrinkage (SCAD). The first derivative of the SCAD penalty function on [0, ∞) is given by [8]:For where is the indicator function.
- Minimax concave penalty (MCP). The first derivative of the MCP penalty function on [0, ∞) is given by [13]:
2.4. The EM Algorithm
2.5. Tuning Parameter Selection
3. Results
- ZINB-MCP model in the negative binomial (NB) component
- ZINB-MCP model in the zero component
4. Discussion
5. Conclusions
Author Contributions
Funding
Data Availability Statement
Acknowledgments
Conflicts of Interest
Appendix A
### RCODES ###
rm(list=ls())

library(“mpath”)
library(“zic”)
library(“pscl”)
library(vcdExtra)

data=read.table(file.choose(),header=T,sep=“,”)

y <- data$ciga
x1<- data$Residence
x2<- data$Gender
x3<- data$Single
x4<- data$Divorce
x5<- data$Age
x6<- data$Secondary
x7<- data$Primary
x8<- data$NoEduc
x9<- data$Formal
x10<- data$Informal
x11<- data$Adultmembers
x12<- data$HouseholdInternet
x13<- data$HouseholdWork
x14<- data$SocialAssistance
x15<- data$ToddlerExistence
x16<- data$Rent
x17<- data$FreeRent
x18<- data$Other
x19<- data$HealthExpenditure
x20<- data$EducationExpenditure

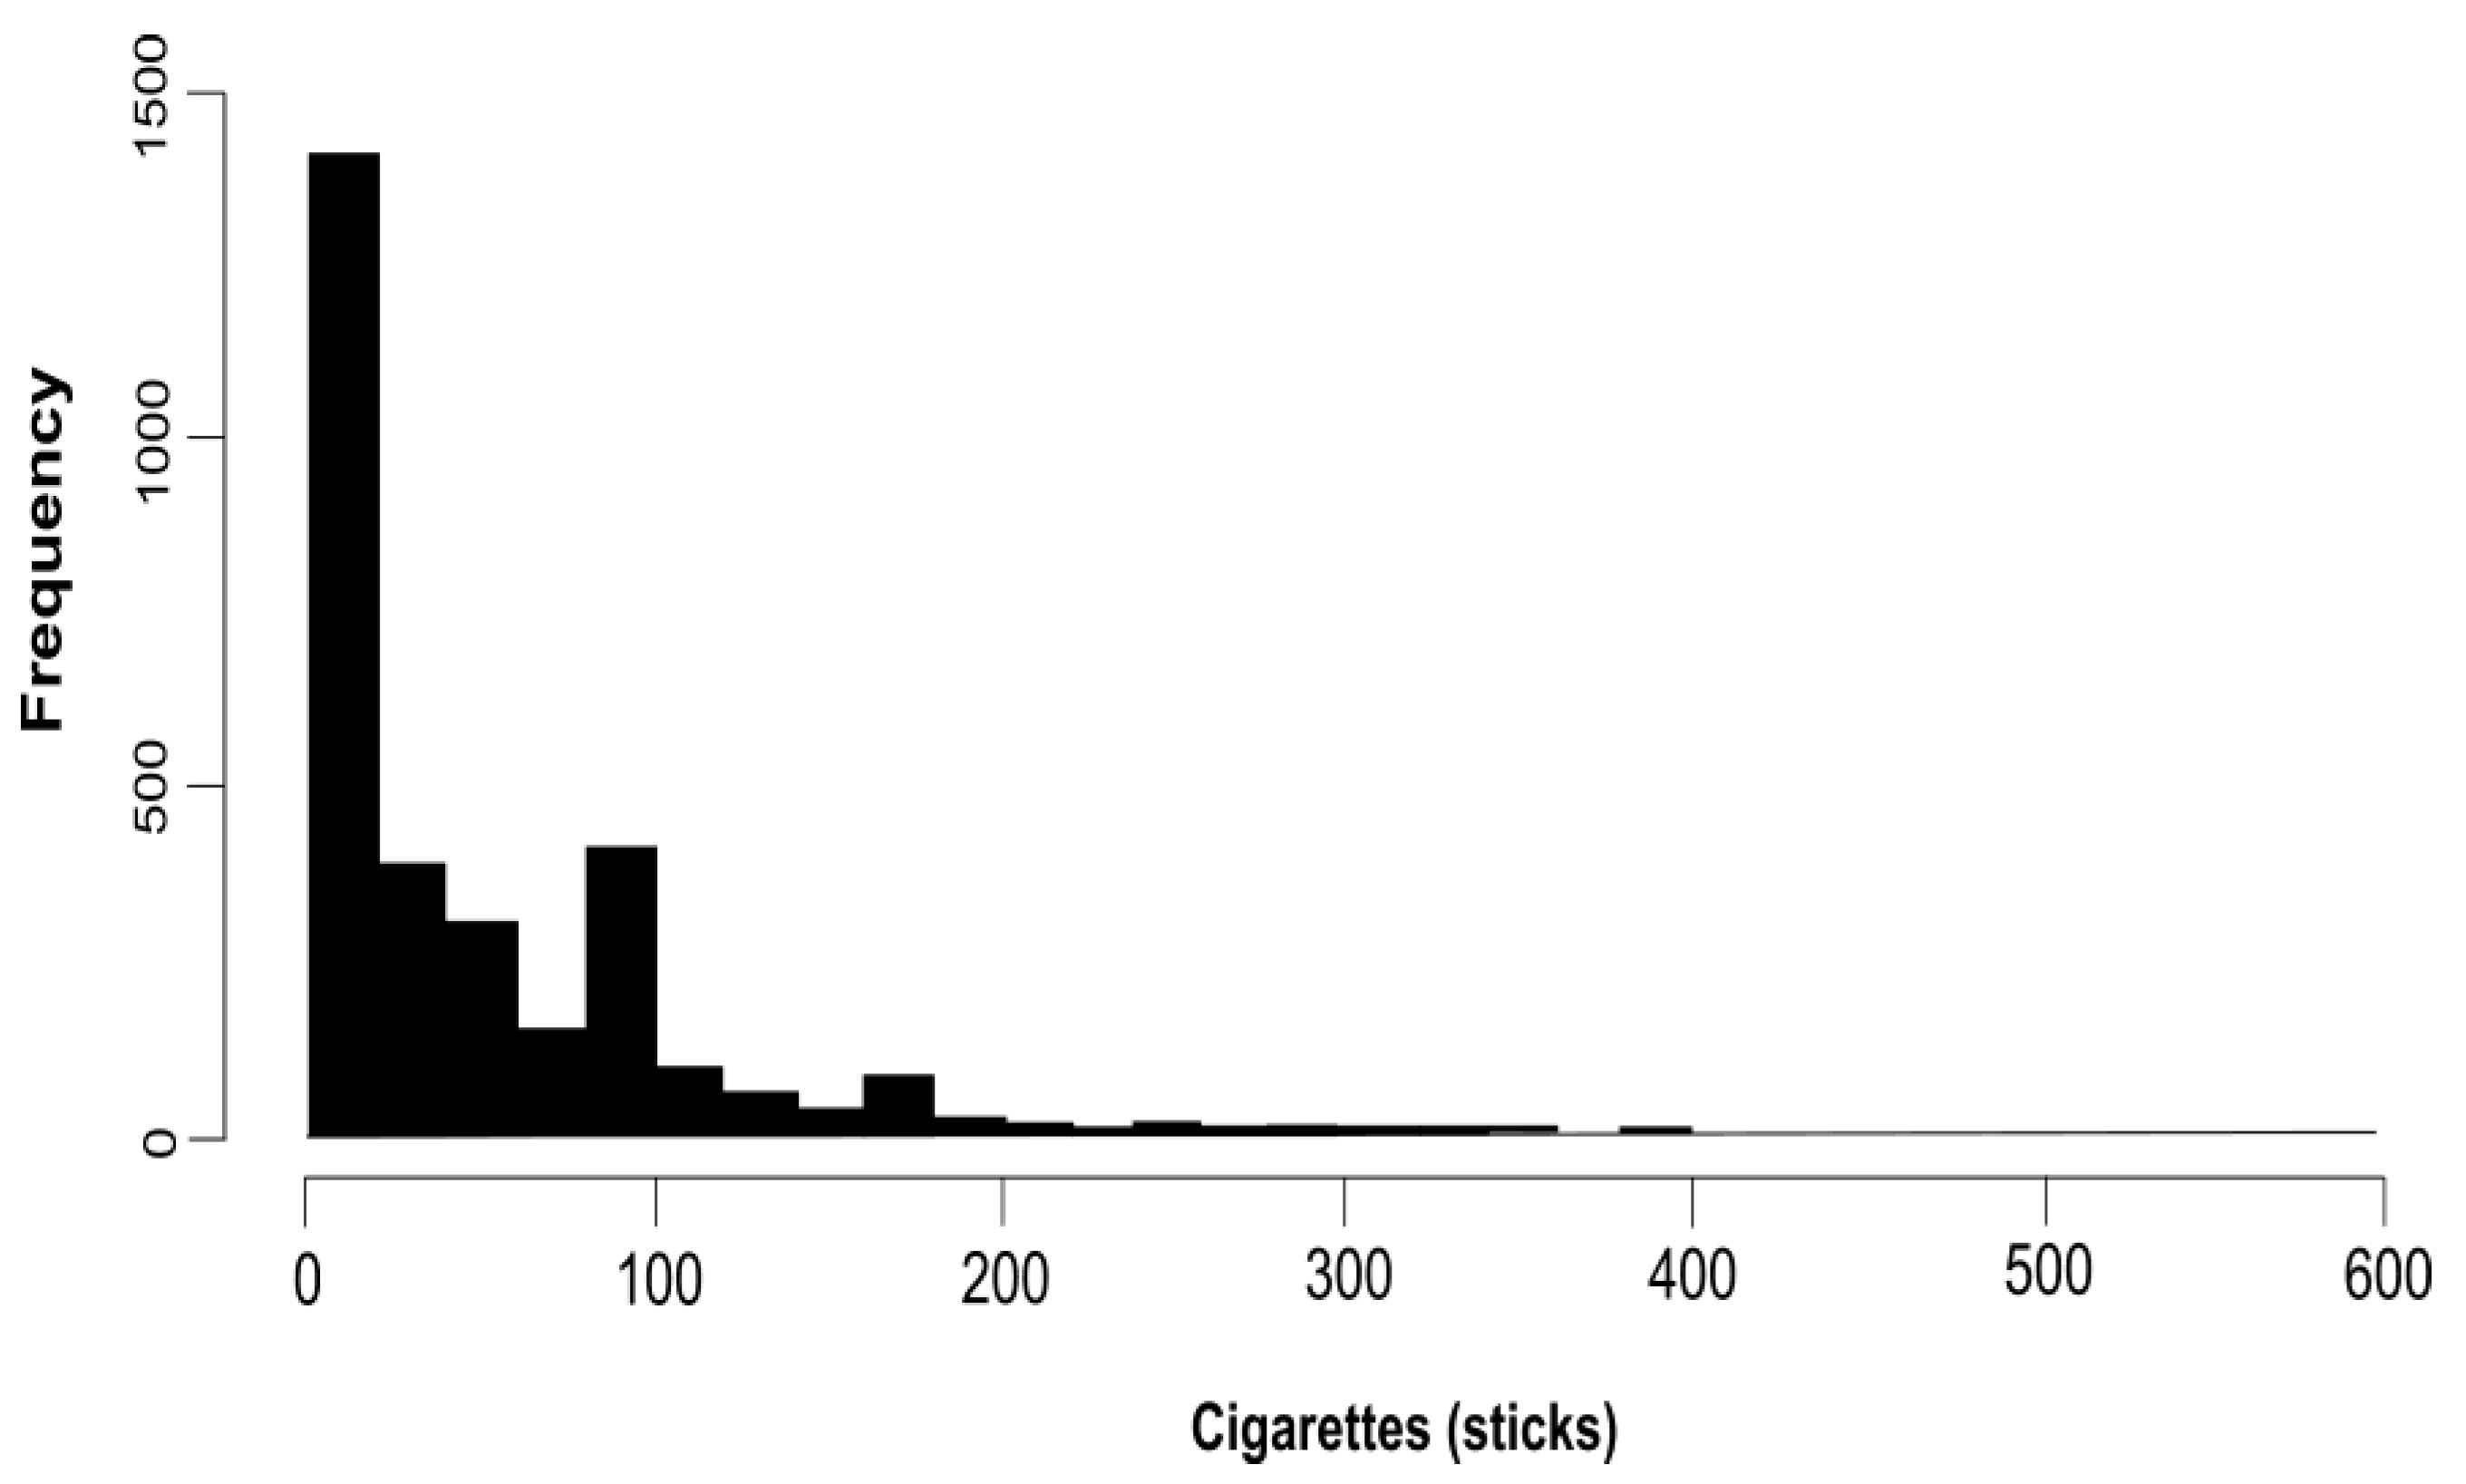
#--------------Histogram for the response variable----------------
h<-hist(y,main=“Histogram of Cigarette Consumption”,
ylab=“Frekuency”,xlab=“Cigarettes (sticks)”,
xlim=c(0,600),ylim=c(0,1500),breaks=50,col=“blue”, freq=T)

#----------Goodness of fit of the Response Variable-----------
# Poisson with KS test
ks.test(y,”ppois”,lambda <- mean(y))

# Poisson Dispersion Test/Variance Test
TCC <-((length(y)-1)*var(y))/mean(y)
qchisq(0.05,length(y)-1)

#------------Overdispersion----------------------
#Model: POISSON
library(MASS)
Pois <-glm(y~x1+x2+x3+x4+x5+x6+x7+x8+x9+x10+x11+x12+x13+x14+x15+
x16+x17+x18+x19+x20, family=poisson)
summary(Pois)


#------------------Zero Excess Test----------------
zero.test(y)

##----------------Estimation Model Using ZINB-----------
dat<-cbind(x1,x2,x3,x4,x5,x6,x7,x8,x9,x10,x11,x12,x13,x14,x15,
x16,x17,x18,x19,x20)
dat<-as.data.frame(dat)
m1<-zeroinfl(y~x1+x2+x3+x4+x5+x6+x7+x8+x9+x10+x11+x12+x13+x14+x15+
x16+x17+x18+x19+x20,dist=“negbin”, data=dat)
summary(m1)

cat(“loglik of zero-inflated model”, logLik(m1))
cat(“BIC of zero-inflated model”, AIC(m1, k=log(dim(dat)[1])))
cat(“AIC of zero-inflated model”, AIC(m1))

res.zinb=m1$residual
rmse.zinb=sqrt(mean((res.zinb)^2))
rmse.zinb

#----Likelihood ratio for simultaneous test----
m2<-zeroinfl(y~1,dist=“negbin”, data=dat)
summary(m2)
l0<- logLik(m2)
lp<- logLik(m1)
G<- -2*(l0-lp)
G
qchisq(0.95,40)

##------------Estimation Model Using ZINB BE(0,05)------
fitbe<-be.zeroinfl(m1,data=dat, dist=“negbin”, alpha=0.05,
trace=FALSE)
summary(fitbe)

cat(“loglik of zero-inflated model with backward selection”,
logLik(fitbe))
cat(“BIC of zero-inflated model with backward selection”,
AIC(fitbe, k=log(dim(dat)[1])))

minBic <- which.min(BIC(fitbe))
AIC(fitbe)[minBic]
BIC(fitbe)[minBic]

res.be=fitbe$residual
rmse.be=sqrt(mean((res.be)^2))
rmse.be

##---------Estimation Model Using Penalized ZINB-LASSO--------
fit.lasso<-zipath(y~x1+x2+x3+x4+x5+x6+x7+x8+x9+x10+x11+x12+x13+
x14+x15+x16+x17+x18+x19+x20,data=dat,family=“negbin”,	nlambda=100, lambda.zero.min.ratio=0.001,
		maxit.em=300, maxit.theta=25, theta.fixed=FALSE,
trace=FALSE, penalty=“enet”, rescale=FALSE)

minBic <- which.min(BIC(fit.lasso))
coef(fit.lasso, minBic)
cat(“theta estimate”, fit.lasso$theta[minBic])
se(fit.lasso, minBic, log=FALSE)

AIC(fit.lasso)[minBic]
BIC(fit.lasso)[minBic]
logLik(fit.lasso)[minBic]


#plot BIC lasso with tuning parameter indexes
BIC.Lasso<-BIC(fit.lasso)
plot(BIC.Lasso)

res.so=fit.lasso$residual [1:3010,22]
rmse.so=sqrt(mean((res.so)^2))
rmse.so

##-------Estimation Model Using Penalized ZINB-SCAD-----
tune.scad<-tuning.zipath(y~x1+x2+x3+x4+x5+x6+x7+x8+x9+x10+x11+
x12+x13+x14+x15+x16+x17+x18+x19+x20,data=dat
standardize=TRUE, family = “negbin”,
penalty = “snet”,lambdaCountRatio = .0001, lambdaZeroRatio = c(.1, .01, .001), maxit.theta=1, gamma.count=3.7, gamma.zero=3.7)

fit.scad <- zipath(y~x1+x2+x3+x4+x5+x6+x7+x8+x9+x10+x11+x12+
x13+x14+x15+x16+x17+x18+x19+x20,data = dat,
family = “negbin”,lambda.count=tune.scad$lambda.count
lambda.zero= tune.scad$lambda.zero, maxit.em=300, maxit.theta=25, theta.fixed=FALSE, penalty=“snet”)

minBic.s <- which.min(BIC(fit.scad))
coef(fit.scad, minBic.s)
cat(“theta estimate”, fit.scad$theta[minBic.s])
se(fit.scad, minBic.s, log=FALSE)

AIC(fit.scad)[minBic.s]
BIC(fit.scad)[minBic.s]
logLik(fit.scad)[minBic.s]


#plot BIC scad dg indeks tuning parameter
BIC.Scad<-BIC(fit.scad)
plot(BIC.Scad)

res.scad=fit.scad$residual [1:3010,26]
rmse.scad=sqrt(mean((res.scad)^2))
rmse.scad


##---------Estimation Model Using Penalized ZINB-MCP----------
tune<-tuning.zipath(y~x1+x2+x3+x4+x5+x6+x7+x8+x9+x10+x11+x12
+x13+x14+x15+x16+x17+x18+x19+x20,data=dat,standardize=TRUE,
family = “negbin”,penalty = “mnet”,lambdaCountRatio = .0001,
	lambdaZeroRatio = c(.1, .01, .001), maxit.theta=1,
gamma.count=2.7, gamma.zero=2.7)

fit.mcp<-zipath(y~x1+x2+x3+x4+x5+x6+x7+x8+x9+x10+x11+x12+x13+x14+
x15+x16+x17+x18+x19+x20,data=dat,family = “negbin”
gamma.count=2.7, gamma.zero=2.7,
		lambda.count=tune$lambda.count,
lambda.zero= tune$lambda.zero,maxit.em=300,
maxit.theta=1, theta.fixed=FALSE, penalty=“mnet”)

minBic <- which.min(BIC(fit.mcp))
coef(fit.mcp, minBic)
cat(“theta estimate”, fit.mcp$theta[minBic])
se(fit.mcp, minBic, log=FALSE)

AIC(fit.mcp)[minBic]
BIC(fit.mcp)[minBic]
logLik(fit.mcp)[minBic]

#plot BIC mcp with tuning parameter
BIC.mcp<-BIC(fit.mcp)
plot(BIC.mcp)

res.mcp=fit.mcp$residual [1:3010,21]
rmse.mcp=sqrt(mean((res.mcp)^2))
rmse.mcp

##---------Residual Checking using ZINB-MCP-------
#Normalitas
#Histogram Residual
res.mcp=fit.mcp$residual [1:3010,21]
hist(res.mcp, freq = FALSE)
curve(dnorm, add = TRUE)

#Normal Probability Plot of the residual
probDist <- pnorm(res.mcp)
plot(ppoints(length(res.mcp)), sort(probDist), main = “PP Plot”, xlab = “Observed Probability”, ylab = “Expected Probability”)
abline(0,1, col=“red”)

#Plot between Residual v.s. Fittedvalue
pearson.res=resid(fit.mcp, type=‘pearson’)[1:3010,21]
miu.hat=predict(fit.mcp,type=‘respon’)[1:3010,21]
plot(miu.hat,pearson.res, main=“ZINB-MCP Regression”,
ylab=“Residuals”, xlab=“Predicted”, col=“blue”)
abline(h=0,lty=1,col=“red”)
lines(lowess(miu.hat,pearson.res),lwd=2, lty=2)

#Independensi Residual
lag.plot(res.mcp)
References
- Said, A. Indonesian Sustainable Development Goals (SDGs) Indicators, BPS RI/BPS-Statistics Indonesia; Indonesian Statistical Bureau: Jakarta, Indonesia, 2019; p. 11. [Google Scholar]
- Kang, K.I.; Kang, K.; Kim, C. Risk factors influencing cyberbullying perpetration among middle school students in Korea: Analysis using the zero-inflated negative binomial regression model. Int. J. Environ. Res. Public Health 2021, 18, 2224. [Google Scholar] [CrossRef]
- Komasari, D.; Helmi, A.F. Faktor-faktor penyebab perilaku merokok pada remaja. J. Psikol. 2000, 27, 37–47. [Google Scholar]
- Wang, Z.; Ma, S.; Wang, C. Variable selection for zero-inflated and overdispersed data with application to health care demand in Germany. Biom. J. 2015, 57, 867–884. [Google Scholar] [CrossRef] [PubMed] [Green Version]
- Hilbe, J.M. Negative Binomial Regression; Cambridge University Press: Cambridge, UK, 2011. [Google Scholar]
- Hosseinpoor, A.R.; Parker, L.A.; Tursan d’Espaignet, E.; Chatterji, S. Social determinants of smoking in low-and middle-income countries: Results from the World Health Survey. PLoS ONE 2011, 6, e20331. [Google Scholar] [CrossRef] [PubMed] [Green Version]
- Tibshirani, R. Regression shrinkage and selection via the lasso: A retrospective. J. R. Stat. Soc. Ser. B Stat. Methodol. 2011, 73, 267–288. [Google Scholar] [CrossRef]
- Fan, J.; Li, R. Variable selection via nonconcave penalized likelihood and its oracle properties. J. Am. Stat. Assoc. 2001, 96, 1348–1360. [Google Scholar] [CrossRef]
- Zhang, C.-H. Nearly unbiased variable selection under minimax concave penalty. Ann. Stat. 2010, 38, 894–942. [Google Scholar] [CrossRef] [Green Version]
- Park, S.; Yang, A.; Ha, H.J.; Lee, J. Measuring the Differentiated Impact of New Low-Income Housing Tax Credit (LIHTC) Projects on Households’ Movements by Income Level within Urban Areas. Urban Sci. 2021, 5, 79. [Google Scholar] [CrossRef]
- Wang, Z.; Ma, S.; Zappitelli, M.; Parikh, C.; Wang, C.-Y.; Devarajan, P. Penalized count data regression with application to hospital stay after pediatric cardiac surgery. Stat. Methods Med. Res. 2016, 25, 2685–2703. [Google Scholar] [CrossRef] [Green Version]
- Wang, Z.; Ma, S.; Wang, C.; Zappitelli, M.; Devarajan, P.; Parikh, C. EM for regularized zero-inflated regression models with applications to postoperative morbidity after cardiac surgery in children. Stat. Med. 2014, 33, 5192–5208. [Google Scholar] [CrossRef] [Green Version]
- Breheny, P.; Huang, J. Coordinate descent algorithms for nonconvex penalized regression, with applications to biological feature selection. Ann. Appl. Stat. 2011, 5, 232. [Google Scholar] [CrossRef] [PubMed] [Green Version]
- Hu, T.W.; Mao, Z.; Liu, Y.; de Beyer, J.; Ong, M. Smoking, standard of living, and poverty in China. Tob. Control 2005, 14, 247–250. [Google Scholar] [CrossRef] [PubMed]
- Siahpush, M. Socioeconomic status and tobacco expenditure among Australian households: Results from the 1998–99 Household Expenditure Survey. J. Epidemiol. Community Health 2003, 57, 798–801. [Google Scholar] [CrossRef] [PubMed] [Green Version]
- Herawati, P.; Afriandi, I.; Wahyudi, K. Determinan Paparan Asap Rokok di Dalam Rumah: Analisis Data Survei Demografi dan Kesehatan Indonesia (SDKI) 2012. Bul. Penelit. Kesehatan. Bul. Penelit. Kesehat. 2019, 47, 245–252. [Google Scholar]
- Van den Broek, J. A score test for zero inflation in a Poisson distribution. Biometrics 1995, 51, 738. [Google Scholar] [CrossRef]
- Cameron, A.C.; Trivedi, P.K. Regression Analysis of Count Data; Cambridge University Press: Cambridge, UK, 2013; Volume 53. [Google Scholar]
- Hirose, Y. Regularization methods based on the Lq-likelihood for linear models with heavy-tailed errors. Entropy 2020, 22, 1036. [Google Scholar] [CrossRef]
- Patil, A.R.; Kim, S. Combination of ensembles of regularized regression models with resampling-based lasso feature selection in high dimensional data. Mathematics 2020, 8, 110. [Google Scholar] [CrossRef] [Green Version]
- Liu, X.; Zhao, B.; He, W. Simultaneous feature selection and classification for data-adaptive Kernel-Penalized SVM. Mathematics 2020, 8, 1846. [Google Scholar] [CrossRef]
- Algamal, Z.Y.; Lee, M.H. Penalized logistic regression with the adaptive LASSO for gene selection in high-dimensional cancer classification. Expert Syst. Appl. 2015, 42, 9326–9332. [Google Scholar] [CrossRef]
- Pampel, F. Tobacco use in sub-Sahara Africa: Estimates from the demographic health surveys. Soc. Sci. Med. 2008, 66, 1772–1783. [Google Scholar] [CrossRef] [Green Version]
- Cendekia, D.G. Keterkaitan Transfer Pemerintah Untuk Perlindungan Sosial Terhadap Perilaku Merokok Pada Rumah Tangga Miskin Di Indonesia (The Influence of Government Transfers for Social Protection on Smoking Behaviour Among Poor Households in Indonesia). J. Kependud. Indones. 2018, 13, 133–142. [Google Scholar]
- John, R.M.; Ross, H.; Blecher, E. Tobacco expenditure and its implications for household resource allocation in Cambodia. Tob. Control 2012, 21, 341–346. [Google Scholar] [CrossRef] [PubMed]


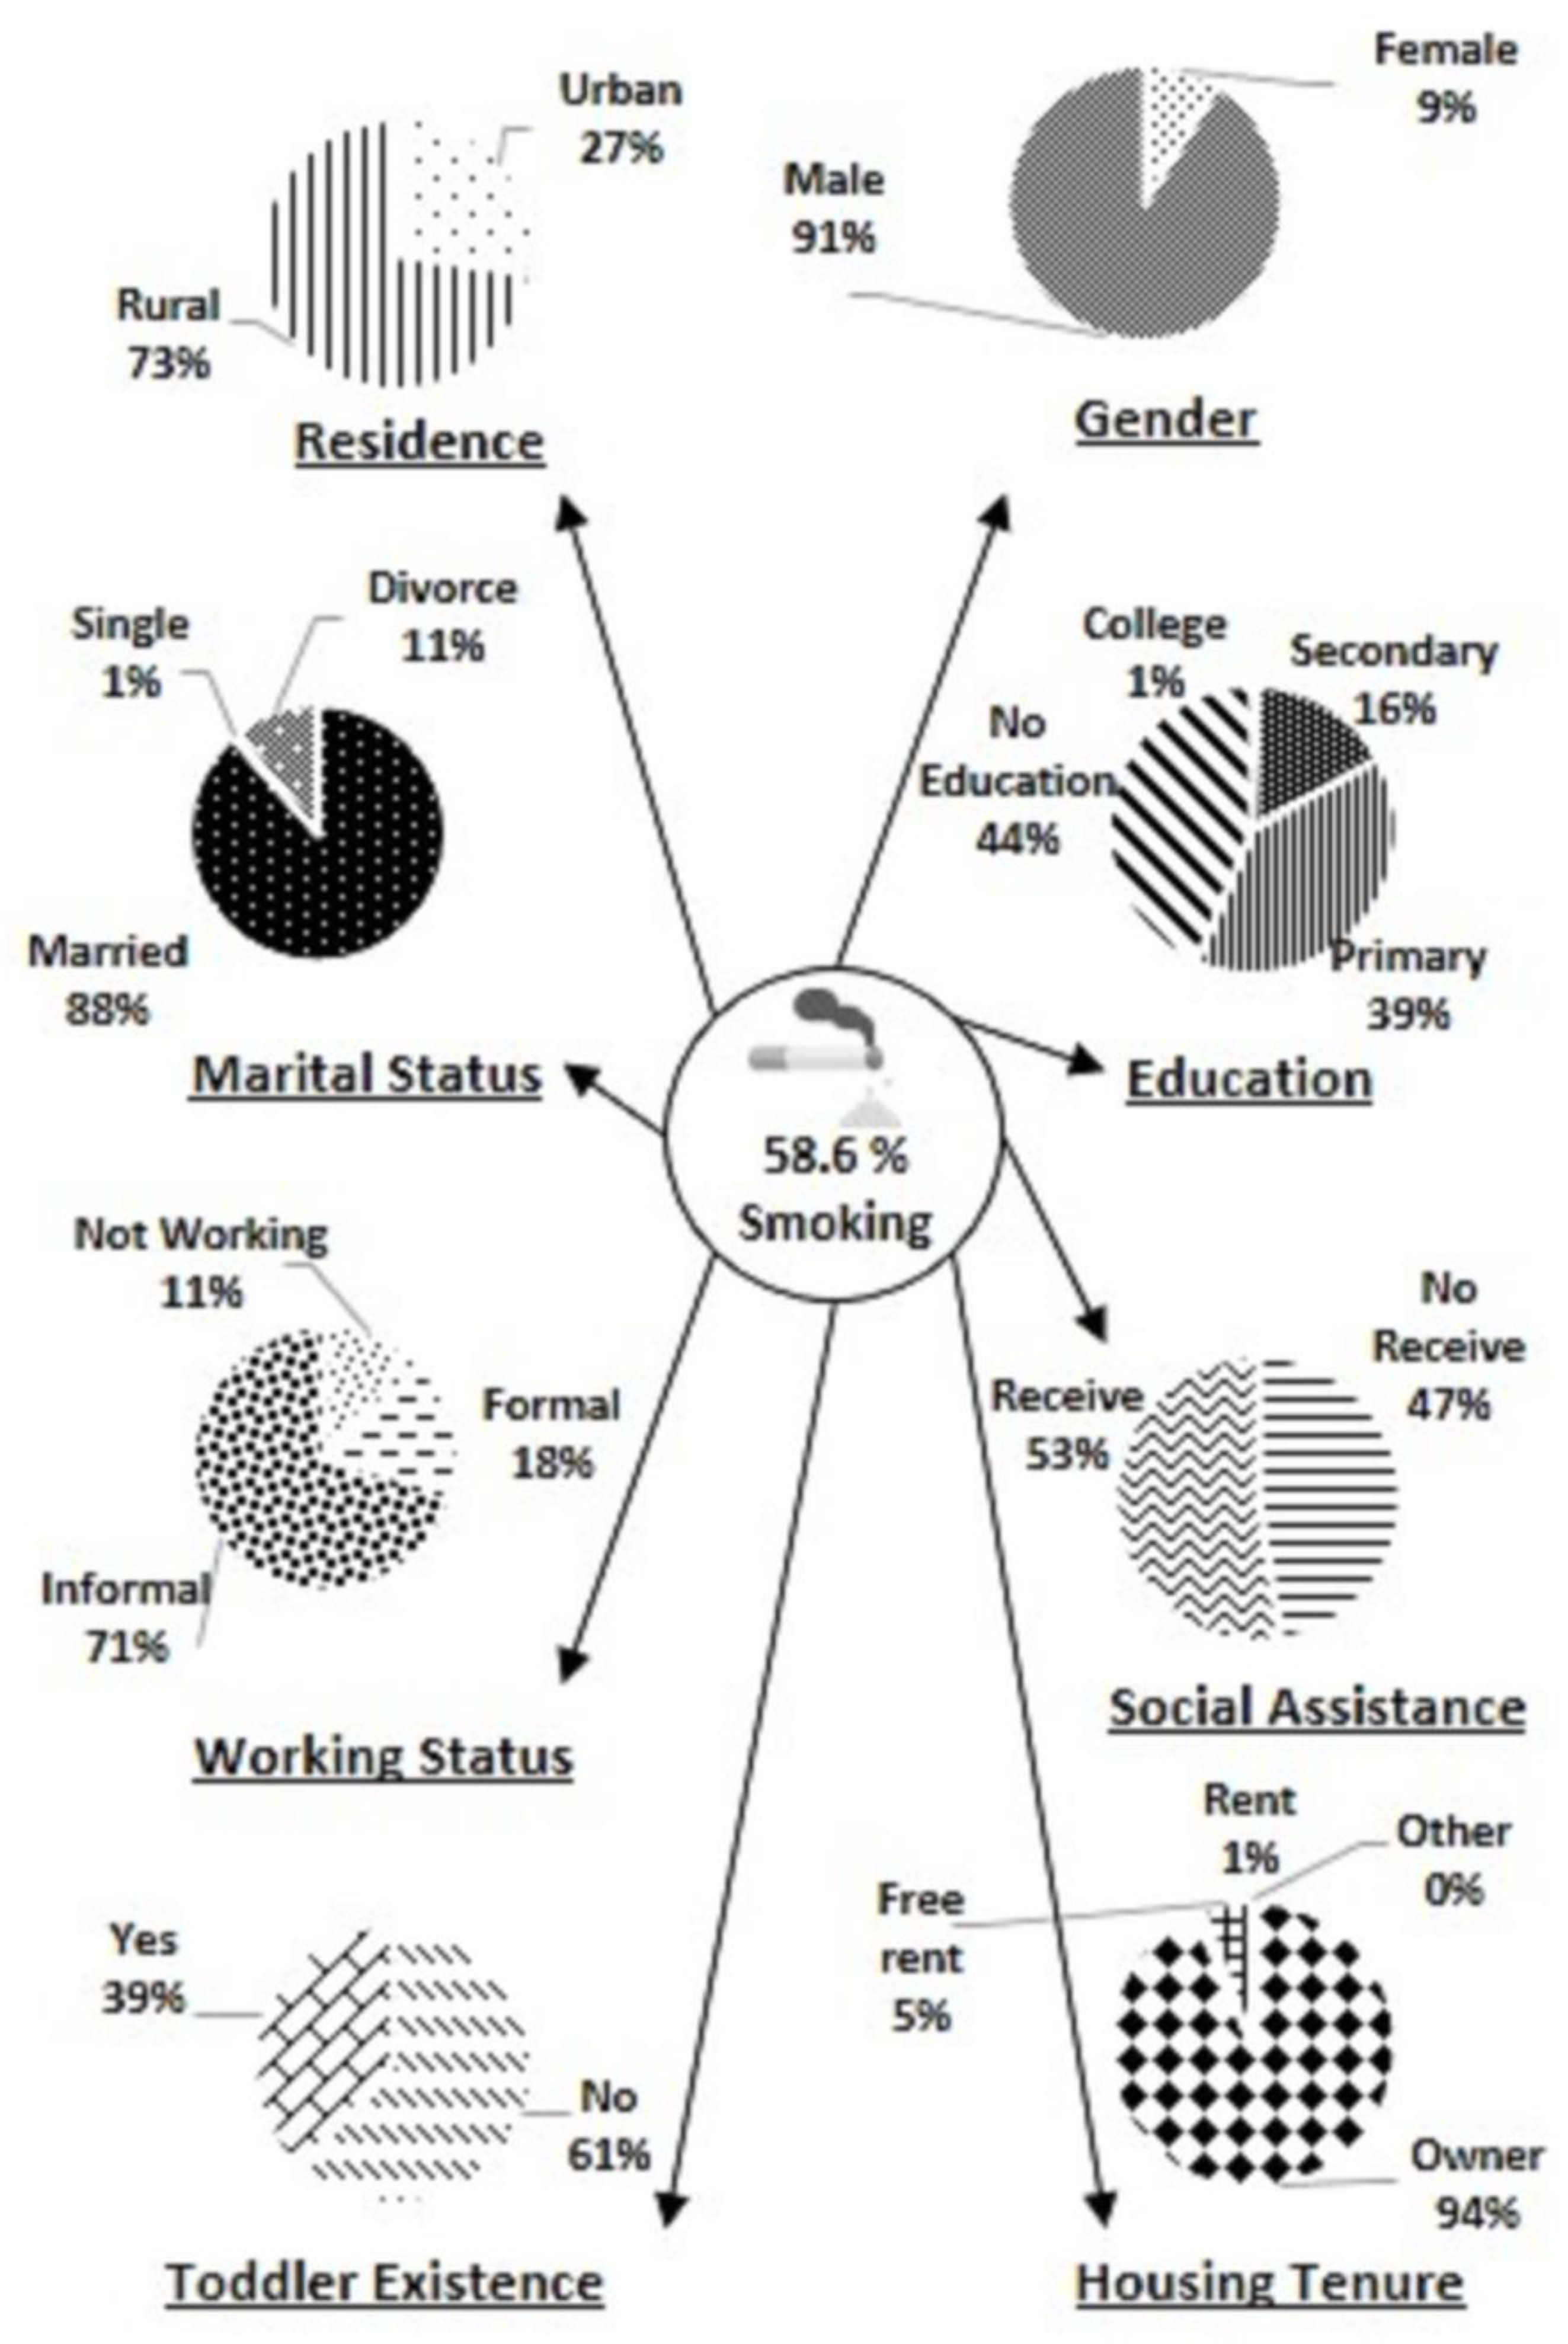
| Variable | Description |
|---|---|
| Residence | 0: rural, 1: urban |
| Gender | 0: female, 1: male |
| Marital status | 0: married, 1: single, 2: divorce |
| Age | |
| Education | 0: college, 1: secondary, 2: primary, 3: no education |
| Working status | 0: not working, 1: formal, 2: informal |
| Adult household members | |
| Household members who use the Internet | |
| Household members who do not work | |
| Social assistance | 0: no receive, 1: receive |
| Toddler existence | 0: no, 1: yes |
| Housing tenure | 0: owner, 1: rent, 2: free rent, 3: other |
| Health expenditure | |
| Education expenditure |
| Variable | Category | Negative Binomial (NB) Component | Zero Component | ||||||
|---|---|---|---|---|---|---|---|---|---|
| BE | LASSO | SCAD | MCP | BE | LASSO | SCAD | MCP | ||
| Intercept | 3.6657 (0.1021) | 3.7446 (0.0838) | 3.8485 (0.082) | 3.7802 (0.078) | 1.7833 (0.2522) | 1.4862 (0.1060) | 1.7264 (0.2086) | 1.8367 (0.2159) | |
| Residence | Rural | ||||||||
| Gender | Male | 0.1262 (0.0585) | −1.3886 (0.1142) | −0.9839 (0.0937) | −1.4053 (0.1091) | −1.3676 (0.1096) | |||
| Marital status | Single | 0.7911 (0.3892) | |||||||
| Divorce | |||||||||
| Age | −0.0062 (0.0014) | −0.0019 (0.0015) | −0.0072 (0.0015) | −0.0052 (0.0015) | 0.0177 (0.0035) | 0.0175 (0.0032) | 0.0173 (0.0033) | ||
| Education | Secondary | −0.0033 (0.0527) | 0.3112 (0.1204) | ||||||
| Primary | |||||||||
| No Educ | 0.2160 (0.0364) | 0.0887 (0.0399) | 0.2088 (0.0418) | 0.1598 (0.0394) | −0.3659 (0.0988) | −0.4156 (0.0950) | −0.4035 (0.0956) | ||
| Working status | Formal | 0.0105 (0.0473) | |||||||
| Informal | −0.2369 (0.0881) | −0.2186 (0.0867) | |||||||
| Adult members | 0.2436 (0.0157) | 0.1976 (0.0186) | 0.2444 (0.0175) | 0.2368 (0.0172) | −0.4990 (0.0468) | −0.3687 (0.0395) | −0.5628 (0.0410) | −0.5599 (0.0410) | |
| Household members who use the internet | |||||||||
| Household members who do not work | 0.0035 (0.0132) | −0.0848 (0.0347) | −0.0078 (0.0290) | ||||||
| Social assistance | Receive | 0.0005 (0.0354) | −0.2975 (0.0826) | −0.3306 (0.0820) | −0.324 (0.0821) | ||||
| Toddler existence | Yes | 0.0807 (0.0380) | |||||||
| Housing tenure | Rent | ||||||||
| Free rent | 0.1522 (0.0737) | 0.0395 (0.0159) | |||||||
| Other | |||||||||
| Health expenditure | −0.0099 (0.0033) | −0.003 (0.0031) | |||||||
| Education expenditure | |||||||||
| Theta | 2.1949 (1.0339) | 2.1476 (0.0814) | 2.181 (0.0812) | 2.17 (0.0813) | |||||
| Model | BIC |
|---|---|
| ZINB-BE | 21,917.3 |
| ZINB-LASSO | 21,992.9 |
| ZINB-SCAD | 21,928.3 |
| ZINB-MCP | 21,899.4 |
Disclaimer/Publisher’s Note: The statements, opinions and data contained in all publications are solely those of the individual author(s) and contributor(s) and not of MDPI and/or the editor(s). MDPI and/or the editor(s) disclaim responsibility for any injury to people or property resulting from any ideas, methods, instructions or products referred to in the content. |
© 2023 by the authors. Licensee MDPI, Basel, Switzerland. This article is an open access article distributed under the terms and conditions of the Creative Commons Attribution (CC BY) license (https://creativecommons.org/licenses/by/4.0/).
Share and Cite
Andriyana, Y.; Fitriani, R.; Tantular, B.; Sunengsih, N.; Wahyudi, K.; Mindra Jaya, I.G.N.; Falah, A.N. Modeling the Cigarette Consumption of Poor Households Using Penalized Zero-Inflated Negative Binomial Regression with Minimax Concave Penalty. Mathematics 2023, 11, 3192. https://doi.org/10.3390/math11143192
Andriyana Y, Fitriani R, Tantular B, Sunengsih N, Wahyudi K, Mindra Jaya IGN, Falah AN. Modeling the Cigarette Consumption of Poor Households Using Penalized Zero-Inflated Negative Binomial Regression with Minimax Concave Penalty. Mathematics. 2023; 11(14):3192. https://doi.org/10.3390/math11143192
Chicago/Turabian StyleAndriyana, Yudhie, Rinda Fitriani, Bertho Tantular, Neneng Sunengsih, Kurnia Wahyudi, I Gede Nyoman Mindra Jaya, and Annisa Nur Falah. 2023. "Modeling the Cigarette Consumption of Poor Households Using Penalized Zero-Inflated Negative Binomial Regression with Minimax Concave Penalty" Mathematics 11, no. 14: 3192. https://doi.org/10.3390/math11143192
APA StyleAndriyana, Y., Fitriani, R., Tantular, B., Sunengsih, N., Wahyudi, K., Mindra Jaya, I. G. N., & Falah, A. N. (2023). Modeling the Cigarette Consumption of Poor Households Using Penalized Zero-Inflated Negative Binomial Regression with Minimax Concave Penalty. Mathematics, 11(14), 3192. https://doi.org/10.3390/math11143192


