Article

Modeling of Viral Infection with Inflammation

by
Anastasia Mozokhina
1,
Latifa Ait Mahiout
2 and
Vitaly Volpert
1,3,*
1
S.M. Nikolskii Mathematical Institute, Peoples’ Friendship University of Russia, 6 Miklukho-Maklaya St, Moscow 117198, Russia
2
Laboratoire D’équations aux Dérivées Partielles non Linéaires et Histoire des Mathématiques, Ecole Normale Supérieure, B.P. 92, Vieux Kouba, Algiers 16050, Algeria
3
Institut Camille Jordan, UMR 5208 CNRS, University Lyon 1, 69622 Villeurbanne, France
*
Author to whom correspondence should be addressed.
Mathematics 2023, 11(19), 4095; https://doi.org/10.3390/math11194095
Submission received: 1 August 2023 / Revised: 16 September 2023 / Accepted: 22 September 2023 / Published: 27 September 2023
(This article belongs to the Special Issue Nonlinear Dynamics Research in Biomedicine)

Abstract

:
Viral infection spreads in cell culture or tissue as a reaction–diffusion wave. It is characterized by three main parameters: virus replication number, R v , which determines whether infection progresses, wave speed, c, which correlates with the virus virulence, and viral load, J ( v ) , which determines the infection transmission rate. In this work, we study how the inflammation triggered by viral infection influences its progression. We obtain analytical expressions for R v , c , and J ( v ) and show how they depend on the intensity of inflammation characterized by one or two parameters. Analytical and numerical results show that inflammation decreases the viral replication number, virus virulence, and infectivity, though there are different cases depending on the parameters of the model.

1. Introduction

1.1. Inflammation in Viral Infections

Viral infections represent a significant global health threat, particularly important in the case of the coronavirus disease (COVID-19) pandemic caused by the severe acute respiratory syndrome coronavirus (SARS-CoV-2). Before SARS-CoV-2, several other viruses have been at the origin of recent epidemics, such as MERS, Ebola, and Zika. Many other infections continue to circulate around the globe, leading to more or less important outbreaks [1].
Viral infection initiates the immune response when it penetrates into the host organism. It starts with the innate immunity, an immediate reaction mechanism aimed to limit virus spread in the infected tissue. It is characterized by broad specificity and mediated by various molecules, such as lymphokines, cytokines, and chemokines [2].
In contrast, the adaptive immune response is pathogen-specific and requires more time to develop. At this stage of the immune response, T and B-lymphocytes are activated by antigen-presenting cells. These cells contribute to the elimination of infected cells and to the secretion of pathogen-specific immunoglobulins and the generation of immunological memory [3].
Upon infection, viral pathogen-associated molecular patterns (PAMPs) interact with pattern recognition receptors (PRRs). PRR detection of viral PAMPs triggers the activation of the innate immune signaling pathways to produce inflammatory cytokines and interferons, mediating the immune response [4].
Activation of PRRs can often lead to diverse forms of cell death [5]. At the cellular level, elimination of infected host cells through programmed cell death (PCD) pathways is crucial to stop viral spread. On the other hand, inflammatory products such as damage-associated molecular patterns (DAMPs), alarmins, additional PAMPs, and inflammatory cytokines released from the dying cells can trigger life-threatening inflammatory cell death, cytokine storms, organ damage, and sepsis [6,7].
The PCD pathways include apoptosis, pyroptosis, and necroptosis, and all of them can be activated by viral infections. Apoptosis is the most studied PCD in viral infections; it can be activated by various extracellular or intracellular events such as lack of nutrients or some growth factors, DNA damage, or other internal cellular stress factors [1].
Inflammation leads to redness, swallow, heat, pain, and tissue disfunction. There is a close connection between the immune response and inflammation. Inflammation is a part of innate immunity, comprising the release of inflammatory cytokines in response to the recognition of viral PAMPs. These cytokines attract cells from the immune response and kill infected cells. They also act to activate the adaptive part of the immune response. Thus, immune response and inflammation are tightly connected during viral infections and other diseases.
There are various models of immune response that take into account cellular kinetics [8,9,10,11,12,13] and different parts of the innate or adaptive immune response. As such, interferon dynamics is taken into account in [8,10,11,13], while some parts of the adaptive immune response are modeled in references [8,9,12,13]. The influence of inflammatory mediators is indirectly considered in model [14] through the death coefficients in equations for the concentrations of virus and infected cells. This work does not directly include concentrations of cytokines and their spatial distributions. The dynamics of inflammatory cytokines and macrophages is considered in [15]. Depending on parameters, three regimes of COVID-19 disease are identified corresponding to mild, moderate, and severe inflammation. Based on the modeling results, possible outcomes of the medical interventions are discussed. The model of the SARS-CoV-2 infection with the innate and adaptive responses is considered in [8], and the conditions of cytokine storm are determined. In the review in [16], the mathematical modeling of acute inflammatory response in considered. Two approaches are discussed based on ordinary differential equations and agent-based models. A comprehensive overview of the mathematical models of the inflammatory response in lung infections and injuries, including COVID-19 infection and immune response, is given in [17]. These models are mostly based on ordinary differential equations and do not account for the spatial distributions of the virus, host, and immune cell concentrations.
In this work, we model viral infection spreading in a cell culture or tissue due to virus replication in the infected cells and virus diffusion in the extracellular space. We study the spatial dynamics of infection progression. We show that infection propagates as a reaction–diffusion wave and how this propagation is influenced by inflammation. We discuss the mathematical model in the next section.

1.2. Mathematical Modeling of Viral Infections

Viral infection spreads in cell culture or tissue as a reaction–diffusion wave [18]. The speed of wave propagation correlates with virus virulence, and the viral load in the upper respiratory tract correlates with virus infectivity in the case of respiratory viral infections [19]. The wave speed and viral load were determined in [19] for the basic model, representing a delayed reaction–diffusion system for the concentrations of uninfected cells, infected cells, and virus. These results were applied for the characterization of different variants of the SARS-CoV-2 infection and of their competition [20]. The influence of the immune response on infection spreading is studied in [21] and the intracellular regulation of virus replication in [22]. Mucus motion and airway obstruction during respiratory viral infections are investigated in [23].
In this work, we study the influence of inflammation on viral infection spreading. We consider the following system of equations:
U t = k 1 ( U 0 U ) k 2 U V ,
W t = k 2 U V k 3 S W σ 1 W ,
V t = D 1 2 V x 2 + b W σ 3 V ,
d S ( t ) d t = k 6 J ( W ) k 7 J ( W ) S σ 4 S ,
where
J ( W ) = + W ( x , t ) d x .
Here, U ( x , t ) is the concentration of uninfected cells, W ( x , t ) is the concentration of infected cells, V ( x , t ) is the concentration of virus particles, and S ( t ) is the concentration of inflammatory cytokines. The first term in the right-hand side of Equation (1) describes the influx of uninfected cells and their death. In the case without infection, these two processes are balanced, and cell concentration reaches some equilibrium value U 0 . The second term describes the rate of infection of uninfected cells by virus. The same term with a plus sign is presented in the right-hand side of Equation (2). The next term characterizes the death of infected cells due to inflammatory cytokines, and the last term describes their death not related to inflammation (e.g., cell exhaustion). Equation (3) for the virus concentration contains the diffusion term, the rate of virus production by infected cells, and the rate of its elimination or neutralization.
We assume that inflammatory cytokines are redistributed in the infected tissue by blood circulation. Therefore, their concentration S ( t ) depends only on time and not on the space variable, contrary to the other concentrations. Equation (4) contains the rate of cytokine production proportional to the total amount of infected cells, cytokine depletion due to their interaction with infected cells, and their degradation.
Let us note that we consider this system of equations on the whole axis in the theoretical analysis of reaction–diffusion waves (Section 2). It is considered on a bounded interval in numerical simulations (Section 3).

2. Analysis of the Model

2.1. Stationary Points

Let us first consider the case where k 1 = 0 ; that is, the influx and death of uninfected cells are neglected. This assumption is biologically justified for relatively short respiratory viral infections (1–2 weeks), since the average life span of epithelial cells is essentially longer (several months). Then, the stationary points of systems (1)–(4), that is, their space-independent stationary solutions, are W = 0 , V = 0 , S = 0 , and any U. Let us note that the integral J ( W ) considered on the whole axis is well defined in this case.
In order to analyze stability of this stationary point, consider the system linearized about it (equations for W and V):
d W d t = k 2 U 0 V σ 1 W ,
d V d t = b W σ 3 V .
Therefore, the condition of stability of this solution is given by the inequality
R v ( 1 ) = k 2 b U 0 σ 1 σ 3 < 1 .
In this case, the virus replication number R v ( 1 ) has the same form as in the previously considered system of three equations [19], and the infection growth occurs for R v 1 > 1 .
If k 1 > 0 , then the system (1)–(5) has the unique stationary point ( U 0 , 0 , 0 , 0 ) . It is also stable if condition (8) is satisfied.
In what follows, we consider a particular case, σ 4 = 0 . In this case, systems (1)–(4) have stationary solutions with coordinates W = 0 , V = 0 , and S and U are arbitrary. Consider the stability of the point ( U 0 , 0 , 0 , S 0 ) , which corresponds to the noninfection state with some amount of anti-inflammatory cytokines. From the linearized system
d W d t = k 2 U 0 V k 3 S 0 W σ 1 W ,
d V d t = b W σ 3 V
we obtain the stability condition:
R v ( 2 ) = k 2 b U 0 σ 3 k 3 S 0 + σ 1 < 1 .

2.2. Wave Propagation

We look for a traveling wave solution of system (1)–(4), that is, a solution of the form U ( x , t ) = u ( ξ ) , W ( x , t ) = w ( ξ ) , V ( x , t ) = v ( ξ ) , where ξ = x c t and c is the wave speed. Since the last equation of the system does not depend on the space variable, then d S / d t = 0 . Assuming that k 1 = 0 according to the biological assumptions, we obtain from system (1)–(4):
c u k 2 u v = 0 ,
c w + k 2 u v k 3 S w σ 1 w = 0 ,
c v + D 1 v + b w σ 3 v = 0 ,
where
S = k 6 J ( w ) k 7 J ( w ) + σ 4 , J ( w ) = + w ( ξ ) d ξ .
We consider the following limits at infinity:
u ( ) = u f , u ( + ) = u 0 , w ( ± ) = v ( ± ) = 0 ,
where u 0 is initial concentration of the uninfected cells, and u f is their unknown final concentration. Along with this final concentration, we determine the integrals J ( w ) and J ( v ) = + v ( ξ ) d ξ , which represent an important characterization of infection waves.
In Equation (12), we separate variables and integrate it on the whole axis using the limits (16):
c ln u 0 u f = k 2 J ( v ) .
Next, integrating the sum of Equations (12) and (13), we obtain the equality
c ( u 0 u f ) = k 3 S + σ 1 J ( w ) ,
or, using (15):
c u 0 ( 1 X ) = ( k 3 k 6 + σ 1 k 7 ) J ( w ) + σ 1 σ 4 k 7 J ( w ) + σ 4 J ( w ) ,
where X = u f / u 0 , 0 < X < 1 . Finally, from Equation (14)
b J ( w ) = σ 3 J ( v ) .
Thus, we obtain the system of three Equations (17)–(19) with respect to the variables X = u f / u 0 , J ( w ) , J ( v ) . We discuss its solution below.
  • Without degradation of inflammatory cytokines.
We begin with a particular case, σ 4 = 0 , for which the analysis of system (17)–(19) becomes simpler. Biologically, this condition means that there is no degradation of anti-inflammatory cytokines. In this case, system (17)–(19) can be reduced to the equation:
ln X = R v ( X 1 ) ,
where the virus replication number R v now has the following form:
R v = k 2 b u 0 σ 3 α + σ 1 ,
where α = k 3 k 6 / k 7 . This formula coincides with the R v ( 2 ) defined in (11), where U 0 = u 0 and α = k 3 S 0 .
Equation (20) has a solution X ( 0 , 1 ) ( 0 < u f < u 0 ) for R v > 1 . In this case, the total viral load J ( v ) can be found from (17). Let us also note that for an R v that is sufficiently large, and this is the case of virulent infections, solution X of Equation (20) is such that X 1 . In this case, we obtain an approximate solution of this equation X = exp ( R v ) .
We can now determine the viral load J ( v ) from (17):
J ( v ) = c ln X k 2 c R v k 2 .
  • With degradation of inflammatory cytokines.
If σ 4 0 , then system (17)–(19) can be reduced to the equation
ln X ( ln X q ) = R v ( X 1 ) ( ln X r )
(Appendix C), where
q = b k 2 σ 1 σ 4 σ 3 c ( k 3 k 6 + k 7 σ 1 ) > 0 , r = b k 2 σ 4 σ 3 c k 7 > 0 .
An important difference in this case in comparison with σ 4 = 0 is that the coefficients of this equation depend on the unknown wave speed c. We determine it in the next section. As we see below, the wave speed depends on X (through the integral J ( w ) ). Hence, we obtain a system of two equations with respect to c and X. Let us also note that q = r = 0 if σ 4 = 0 , and Equation (23) is reduced to Equation (20). Some examples of the graphical solution of Equation (23) are shown in Figure 1.
The existence of the solution of Equation (23) such that 0 < X < 1 is studied in the following proposition.
Proposition 1.
Equation (23) has a solution X ( 0 , 1 ) if and only if R v ( 1 ) > 1 .
Proof. 
Set
f ( X ) = ln X ( ln X q ) , g ( X ) = R v ( X 1 ) ( ln X r ) .
The asymptotic behavior of these functions as X 0 is different, f ( X ) ( ln X ) 2 and g ( X ) R v ln X . Therefore, f ( X ) > g ( X ) for an X that is sufficiently small. Furthermore, f ( 1 ) = g ( 1 ) = 0 , and f ( 1 ) = q , g ( 1 ) = r R v . Thus, Equation (23) has a solution 0 < X < 1 if f ( 1 ) > g ( 1 ) , that is, q < r R v , or R v ( 1 ) > 1 ( U 0 is replaced by u 0 ).
Suppose now that R v ( 1 ) 1 , that is, f ( 1 ) g ( 1 ) . If Equation (23) has a solution 0 < X < 1 , then f ( X ) g ( X ) = 0 for some X in this interval. Let us show that this equation does not have solutions there. It can be written as follows:
2 ln X q = R v ( X 1 ) + R v X ( ln X r ) .
Denote by h ( X ) the left-hand side of this equality and by z ( X ) its right-hand side. Then, h ( 1 ) = q r R v = z ( 1 ) ,
h ( 1 ) = 2 2 R v ( 1 ) > 2 R v r R v = z ( 1 ) .
We use here that 1 R v ( 1 ) > R v . Finally, h ( X ) < 0 , z ( X ) > 0 . Therefore, Equation (24) does not have a solution for 0 < X < 1 . The proposition is proved. □
The total viral load in this case can be determined by Equation (17), where X = u f / u 0 is the solution of the Equation (23).
We can now compare the two cases, with and without degradation of inflammatory cytokines, from the point of view of infection progression, that is, u f < u 0 and the existence of solution X such that 0 < X < 1 . In the case without degradation, such a solution exists for the virus replication number R v > 1 . It contains in the denominator the positive parameter α , which characterizes intensity of inflammation. In the case with degradation, the virus replication number R v ( 1 ) does not contain α in the denominator; that is, strangely enough, it does not depend on inflammation, and R v ( 1 ) > R v . Therefore, inflammation acts against infection progression, and its intensity is characterized by the single parameter α .

2.3. Wave Speed

In order to determine the wave speed, we use the linearization method widely employed for monostable reaction–diffusion systems. The idea of the method is to linearize the system at + and to find the minimal wave speed for which this linear system has a monotonically decreasing solution. In general, this method gives an estimate of the minimal speed from below. In some cases, it is proved that it coincides with the minimal wave speed [24].
We approximate u by its value u 0 at + . Therefore, we obtain the following linearized system of equations for w and v:
c w + k 2 u 0 v k 3 k 6 k 7 J ( w ) + σ 4 J ( w ) + σ 1 w = 0 ,
and
D 1 v + c v + b w σ 3 v = 0 .
Note that J ( w ) is considered here as a given constant determined from (18) when the equation for X is solved. Let us look for the solution of this system in the form w ( ξ ) = p 1 e λ ξ , v ( ξ ) = p 2 e λ ξ . Substituting these expressions into (25), (26), we obtain the following system:
c λ p 1 + k 2 u 0 p 2 k 3 k 6 k 7 J ( w ) + σ 4 J ( w ) + σ 1 p 1 = 0 ,
D 1 λ 2 p 2 c λ p 2 + b p 1 σ 3 p 2 = 0 .
In order to find the minimal wave speed, we should find the minimal value of c for which this system of equations has a positive solution λ . Introducing an independent parameter μ = λ c and excluding p 1 and p 2 from the first equation, we obtain:
p 2 p 1 = 1 k 2 u 0 ( μ + σ 1 ) ( k 7 J ( w ) + σ 4 ) + k 3 k 6 J ( w ) k 7 J ( w ) + σ 4 ,
and we inject it in the second one. We obtain:
( D 1 λ 2 c λ σ 3 ) ( μ + σ 1 ) ( k 7 J ( w ) + σ 4 ) + k 3 k 6 J ( w ) k 7 J ( w ) + σ 4 + b = 0 .
Since c λ = μ and λ 2 = μ 2 / c 2 by the definition of μ , we can write the previous equation as follows:
c 2 = D 1 [ ( μ + σ 1 ) ( k 7 J ( w ) + σ 4 ) + k 3 k 6 J ( w ) ] μ 2 ( μ + σ 3 ) [ ( μ + σ 1 ) ( k 7 J ( w ) + σ 4 ) + k 3 k 6 J ( w ) ] b k 2 u 0 ( k 7 J ( w ) + σ 4 ) .
Let us recall that we need to find the minimal value of c for which this equation has a positive solution μ . After that, we determine λ = μ / c . Denote the right-hand side of Equation (29) by F ( μ ) . This is a positive function for μ > μ 0 , where μ 0 is a positive solution of the equation
( μ + σ 3 ) [ ( μ + σ 1 ) ( k 7 J ( w ) + σ 4 ) + k 3 k 6 J ( w ) ] = b k 2 u 0 ( k 7 J ( w ) + σ 4 )
(zero of the denominator). Therefore, the minimal value of c equals the minimum of the function F ( μ ) for μ > μ 0 . Denote this minimal value by c 0 . Thus, we obtain the following equality:
c 2 = min μ > μ 0 D 1 [ ( μ + σ 1 ) ( k 7 J ( w ) + σ 4 ) + k 3 k 6 J ( w ) ] μ 2 ( μ + σ 3 ) [ ( μ + σ 1 ) ( k 7 J ( w ) + σ 4 ) + k 3 k 6 J ( w ) ] b k 2 u 0 ( k 7 J ( w ) + σ 4 ) .
Let us recall that J ( w ) in the right-hand side of this equality is determined from (18) and it depends on c. Therefore, (30) represents an equation with respect to c. We consider below a simpler particular case where the right-hand side is independent of c, and (30) provides the minimal wave speed.
  • Simplification.
In the particular case σ 4 = 0 , the expression for the wave speed simplifies:
c 2 = min μ > μ 0 D 1 ( μ + σ 1 + α ) μ 2 ( μ + σ 3 ) ( μ + σ 1 + α ) b k 2 u 0 .
Here α = k 3 k 6 / k 7 . Note that μ 0 is a positive root of the denominator, which exists if R v > 1 .
This case is interesting not only because the formula is simpler but also because the right-hand side in expression (31) does not depend on J ( w ) . Therefore, the wave speed and the viral load are decoupled from each other.
Furthermore, all parameters of the model related to inflammation are included in the parameter α . Hence, the influence of inflammation on the wave speed is determined by this single parameter. This parameter adds to the parameter σ 1 , characterizing the rate of infected cell death. Therefore, α can be interpreted as effective cell death due to inflammation.
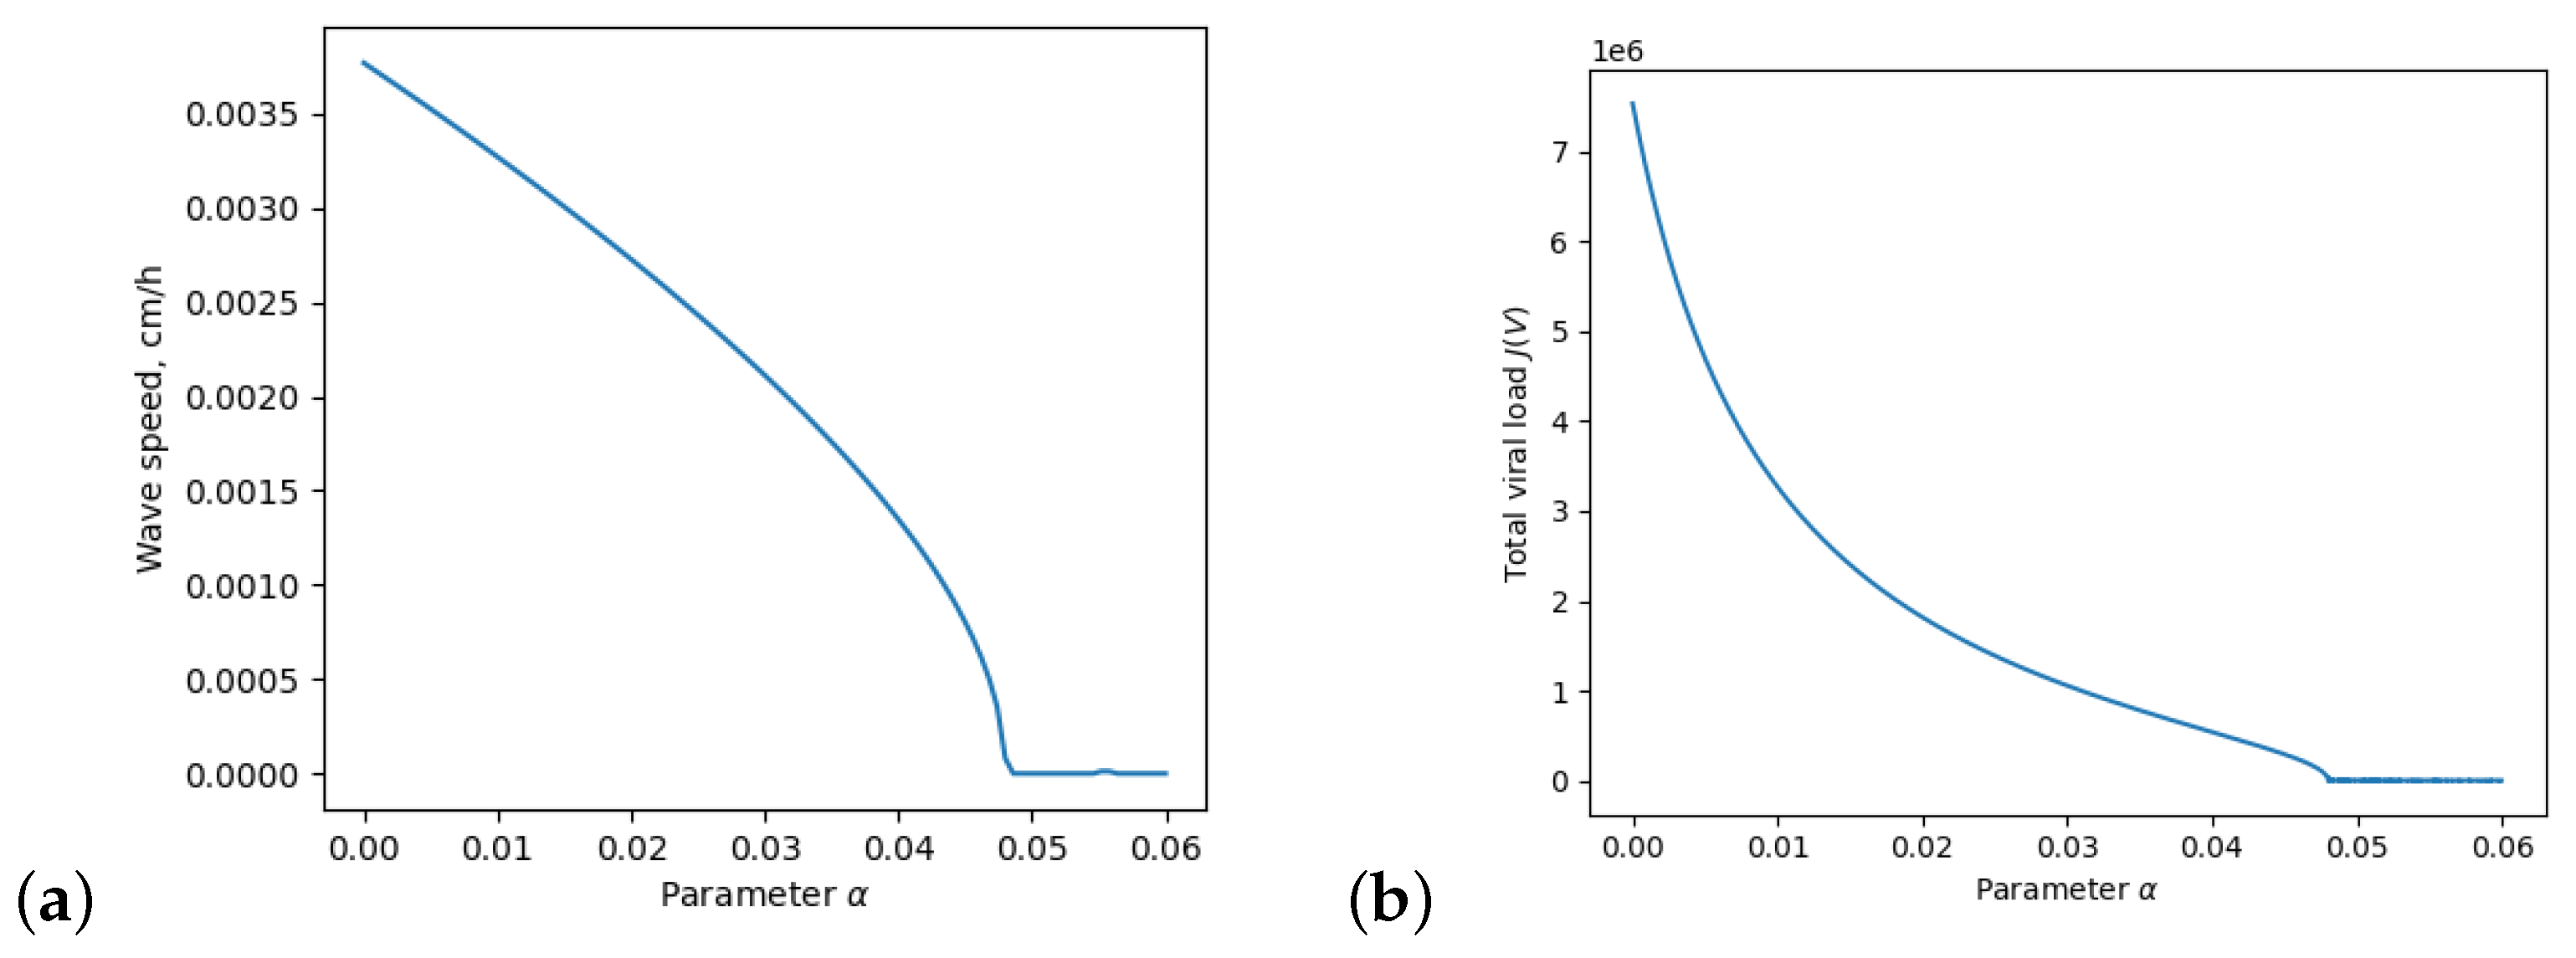
Denote by F ( μ , α ) the right-hand side of (31). Then, for any fixed μ , the derivative F α is negative. Therefore, the minimum of this function with respect to μ decreases with an increase in α . Hence, the wave speed also decreases (Figure 2a).

3. Dependence on the Inflammation Parameters

In this section, we consider the dependence of the wave speed and total viral load on parameters of inflammation in numerical simulations and the analytical estimations obtained in the previous sections.
For the numerical simulations, we consider the system of Equations (1)–(4) on the domain [ 0 , L ] × [ 0 , T ] , with the boundary conditions
x = 0 , L : V x = 0 ,
and initial conditions:
U ( x , 0 ) = u 0 , W ( x , 0 ) = 0 , S ( 0 ) = S 0 = 0 ,
V ( x , 0 ) = v 0 , 0 x x 0 , V ( x , 0 ) = 0 , x 0 < x L .
The algorithm is based on the explicit first-order Euler scheme timestepping procedure with P 1 finite element spatial approximation, where mesh size is equal to L / 10 4 . We use the free software FreeFEM [25] that offers a fast interpolation algorithm and a language for the manipulation of data on multiple meshes.
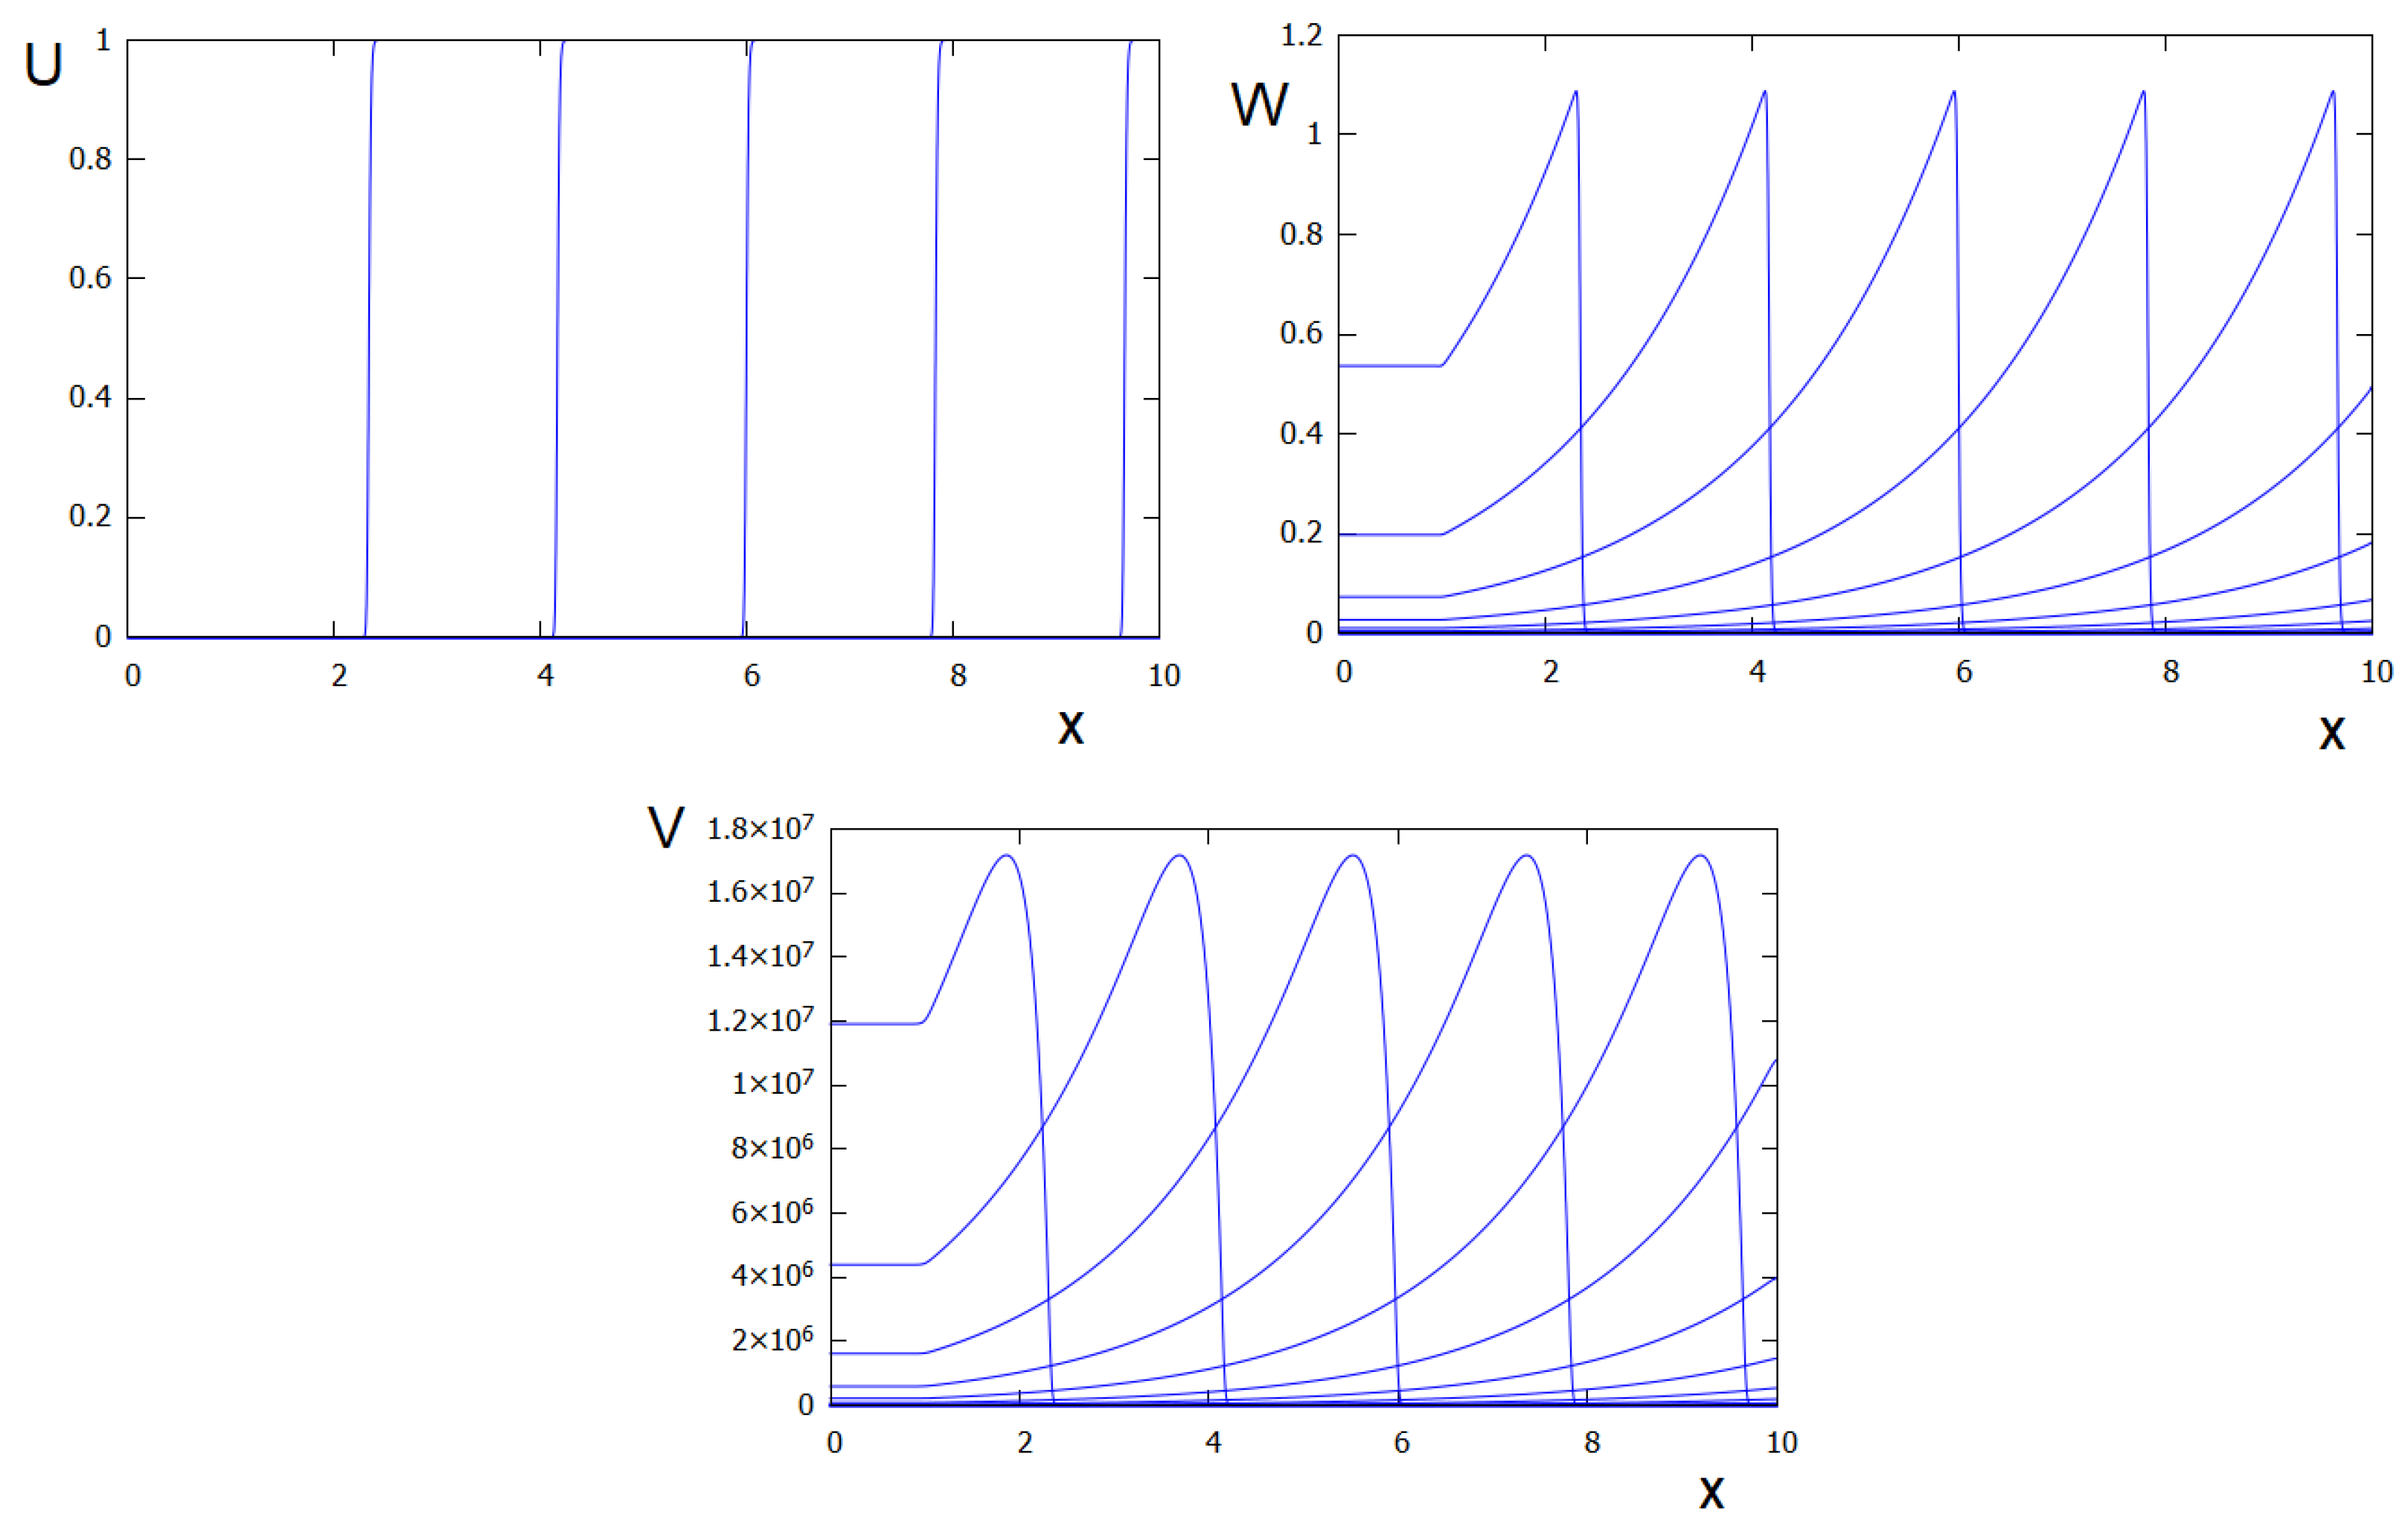
Spatial distributions of the concentrations of uninfected cells U, infected cells W, and virus V at consecutive moments of time (Figure 3) correspond to wave propagation. The wave speed 0.16 cm/h and the total viral load J ( V ) is 3.87 × 10 7 copy / cm 2 are in agreement with the analytical results obtained with Formulas (30) and (22). The values of parameters are indicated in the figure caption.
Next, we investigate the dependence of the total viral load and the wave speed on the parameters of inflammation. In the simplified case, where σ 4 = 0 , the wave speed and, correspondingly, the total viral load depend only on the parameter α = k 3 k 6 / k 7 . These dependencies are presented in Figure 2. Both the wave speed and the total viral load decrease with an increase in the parameter α . For α = 0 , the wave speed and the total viral load are the same as in the system of three equations without inflammation considered in [19] (UIV model); these values provide upper bounds for the wave speed and total viral load in the case with inflammation. For α > ( k 2 b u 0 / σ 3 σ 1 ) , the condition R v > 1 is not satisfied; thus, the wave does not exist for these values. For the considered parameters, the wave exists for α < 0.048 .
Next, consider the case σ 4 0 . We rewrite expressions for coefficients q and r, and the function under minimization in (30) as follows:
q = b k 2 σ 1 β σ 3 c ( α + σ 1 ) , r = b k 2 β σ 3 c ,
F ( μ ) = D 1 [ ( μ + σ 1 ) ( J ( w ) + β ) + α J ( w ) ] μ 2 ( μ + σ 3 ) [ ( μ + σ 1 ) ( J ( w ) + β ) + α J ( w ) ] b k 2 u 0 ( J ( w ) + β ) ,
where α = k 3 k 6 / k 7 as before and β = σ 4 / k 7 . Thus, the total viral load and the wave speed depend on two parameters α and β , characterizing inflammation.
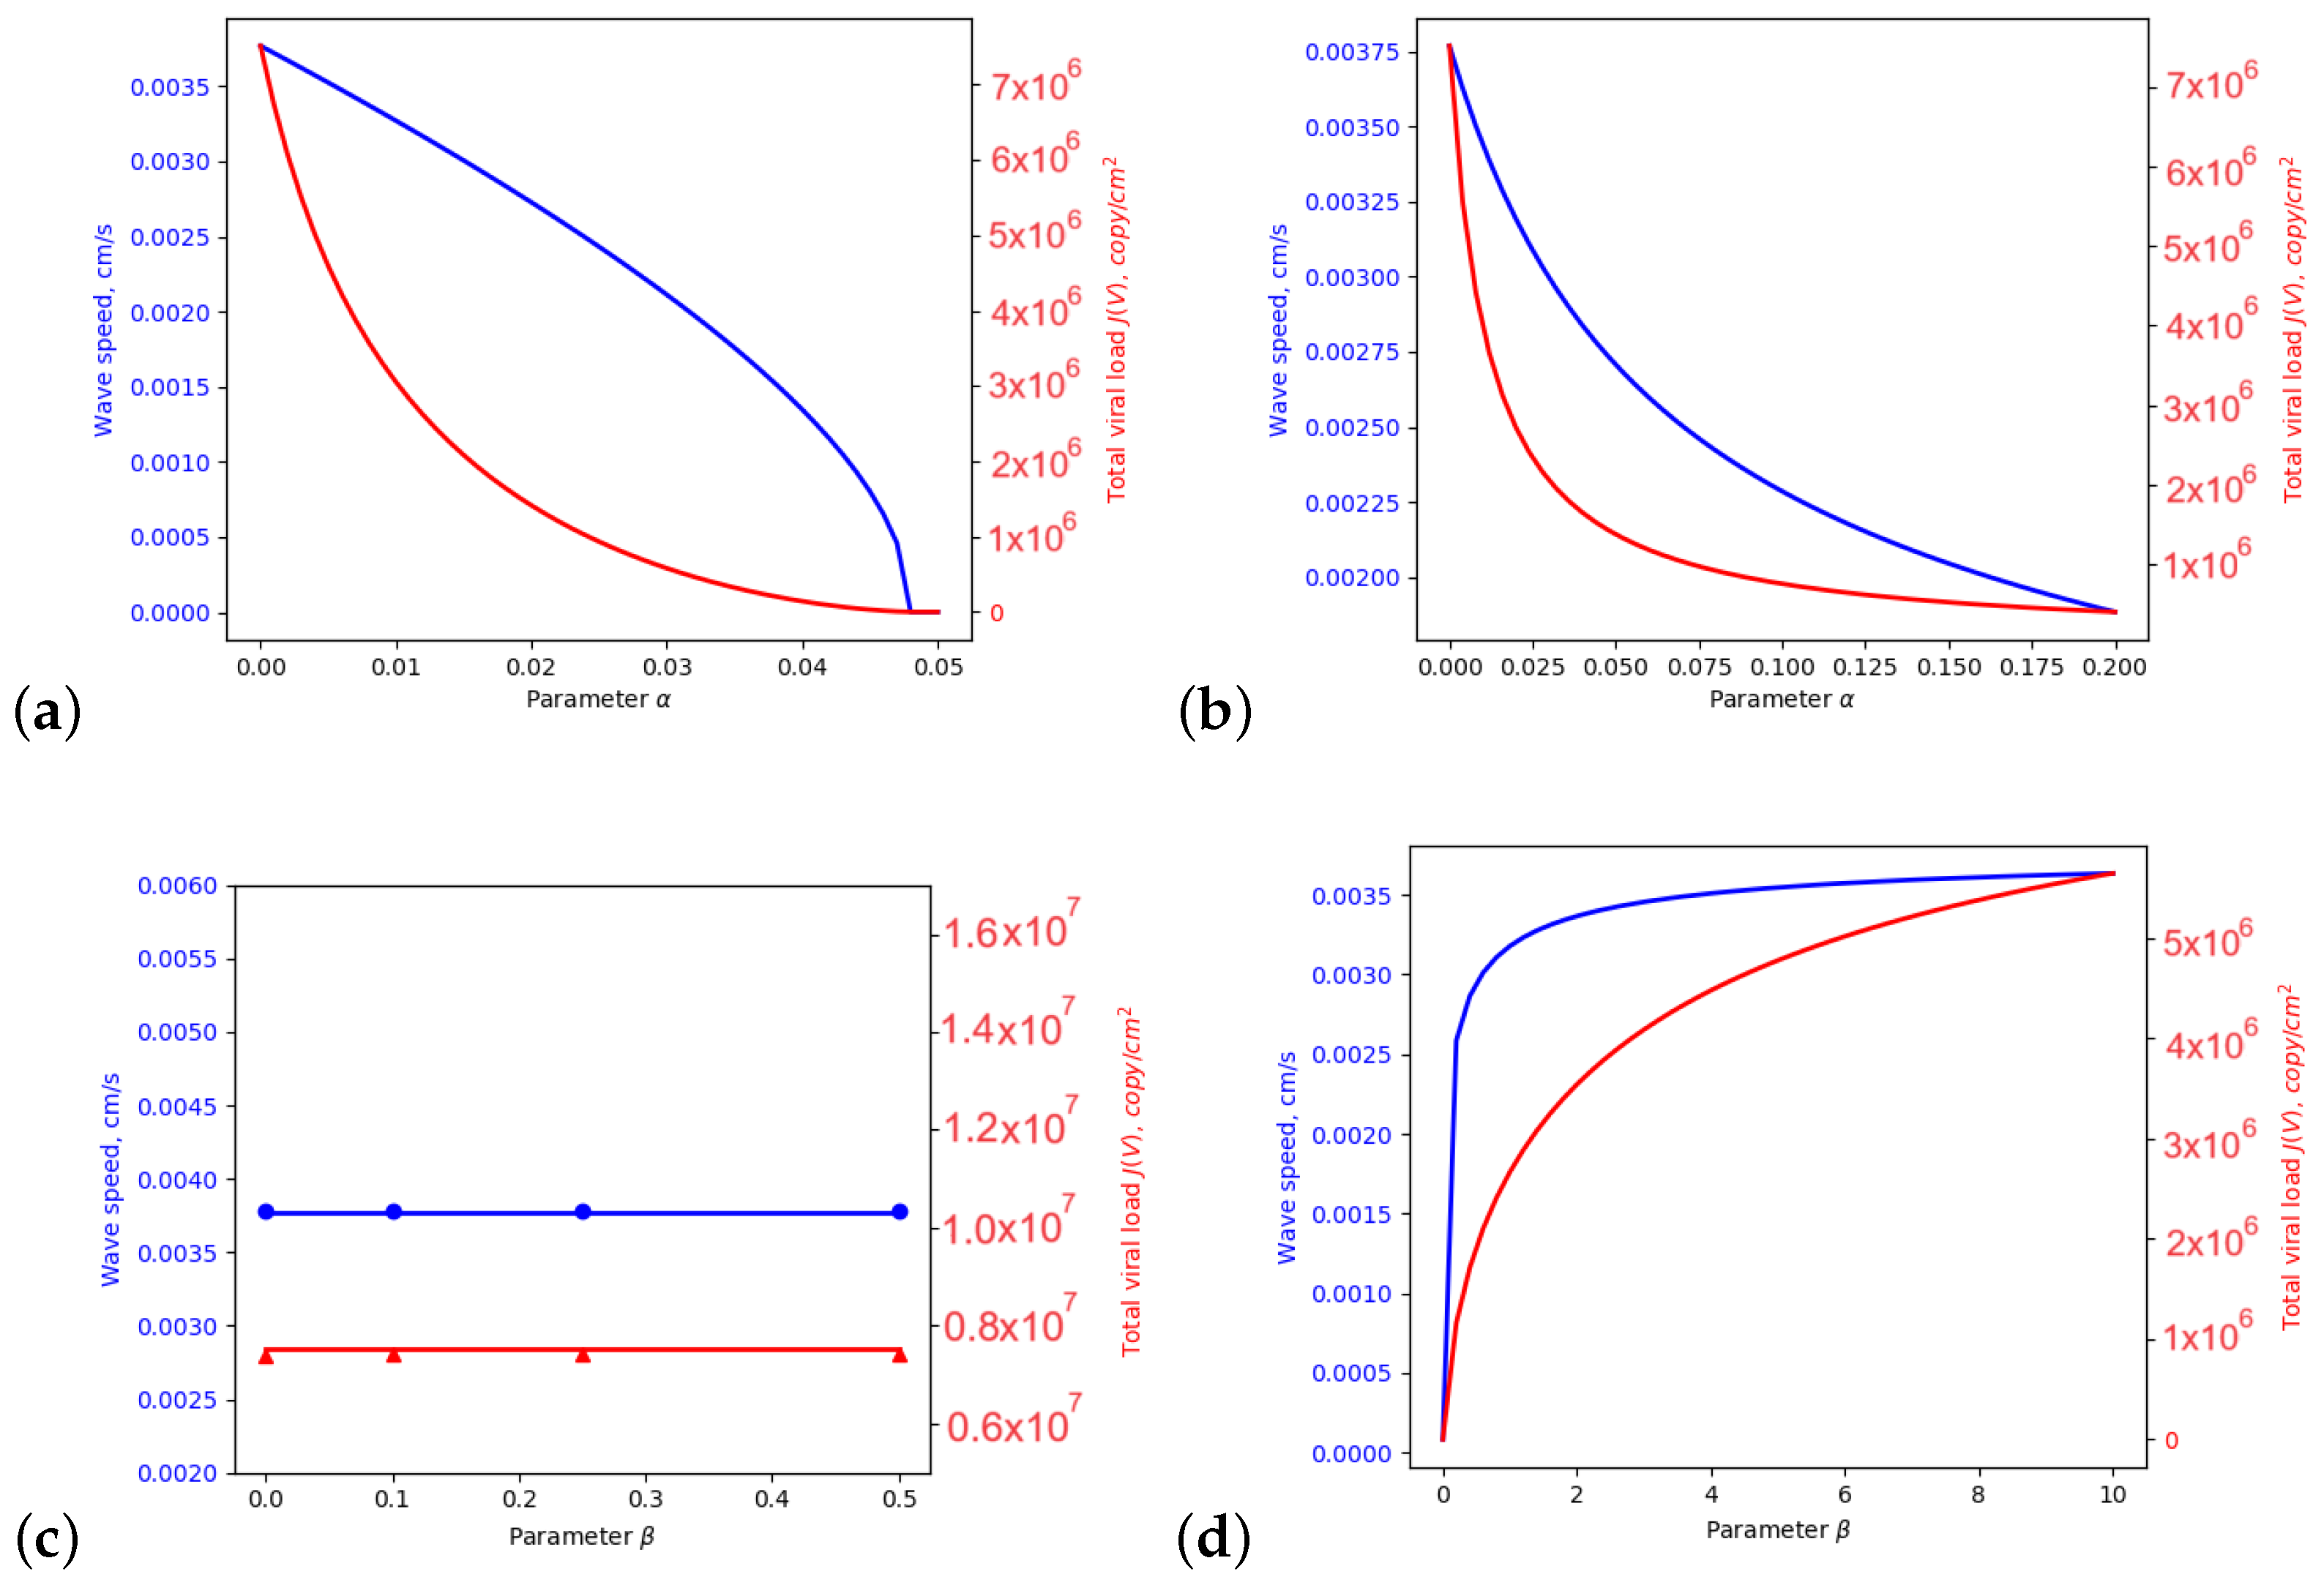
For the fixed β , the wave speed and the total viral load both inversely depend on the parameter α , i.e., the inflammation downregulates the spreading of viral infection (Figure 4b). If β 0 , however, the wave speed is a convex function of parameter α , and in this case, the wave exists for larger values of α (for α < 0.2 in Figure 4b). The values of the wave speed and the total viral load are bounded from above with their values in the UIV model.
In Figure 4c,d, the wave speed and the total viral load are considered as functions of the parameter β . Here, the cases with α = 0 and α 0 are qualitatively different. For α = 0 , the wave speed and the total viral load do not depend on the parameter β , as shown in Figure 4c. The values of the wave speed and the total viral load in this case are the same as in the UIV model. If α 0 , then the wave speed and the total viral load depend on β . These dependencies are also bounded from above with corresponding values from UIV model (Figure 4d). In Figure 4d, there is a horizontal asymptote for both the wave speed and the total viral load. For a larger β , the wave speed and the total viral load tend to the values in the UIV model [19].
The results described above are qualitatively similar for different values of parameters α and β ; thus, these qualitative conclusions remain valid for the approximate evaluation of the value of parameters.

4. Discussion

Viral infection progresses in cell culture or tissue as a reaction–diffusion wave due to virus replication inside infected cells and its transport between the cells [18,19]. This process is characterized by three main parameters: virus replication number, wave speed, and viral load. Infection develops if the virus replication number is larger than 1; otherwise, the virus concentration remains close to the initial value. The wave speed correlates with the virus virulence. Indeed, virus virulence is related to the size of virus plaques in the conventional multiplicity of virus assays [26], but the latter is determined by the wave speed. Finally, viral load in the upper respiratory tract determines infectivity of respiratory viral infections, that is, the rate of their transmission from infected to uninfected individuals [19].
The basic model of infection spreading represents a reaction–diffusion system of equations for the concentrations of uninfected cells, infected cells, and virus [19]. It admits an analytical determination of these three characteristics of infection progression. This analytical representation of the virus replication number, wave speed, and viral load allows us to determine how they depend on parameters of the model. Furthermore, the determination of the parameters of the model from the experimental data permit the comparison of the virulence and infectivity for different variants of the SARS-CoV-2 infection.
Inflammation triggered by viral infection has multiple roles. Inflammatory cytokines produced by infected cells can initiate their death by different mechanisms of programmed cell death, and they also play the role of signaling molecules, attracting and activating immune cells. Excessive production of inflammatory cytokines can initiate cytokine storm and inflammatory cell death.
In this work, we study the influence of inflammation on the three characteristics of infection progression. Parameter α , specifying the intensity of inflammation, depends on the rate of production of inflammatory cytokines and their depletion, as well as on the rate of infected cell death stimulated by inflammatory cytokines. Parameter β depends on the rate of cytokine degradation and their depletion due to interaction with infected cells. It directly depends on the rate of cytokine removal from the infection area, and thus, it can be interpreted as the clearance of cytokines by blood. Results from Section 3 show that an increase in the intensity of inflammation (parameter α ) reduces both the severity and infectivity of the disease, while the effective clearance, i.e., normal blood flow (parameter β ) increases them up to the values in the inflammation absence case. The main conclusion of this work is that the wave speed and the viral load decrease with an increase in α . In the other words, an increase in the intensity of inflammation downregulates virus virulence and infectivity.
If the intensity of inflammation exceeds some critical value, the virus replication number becomes less than 1, and as a consequence, infection does not develop. The corresponding wave speed and virus load equal 0.
The results on the dependence of the severity and infectivity on parameter β , i.e., the increase in characteristics of the viral infection propagation with more effective blood flow, raise a number of questions for further investigations. For example, the role of swelling, which is one of five manifestations of inflammation, in the obstruction of blood flow in the infection region is of interest. The physiological and clinical experience would seem to leave no doubt that the blood obstruction is a pathological state. However, an analysis of the model considered in this work shows that the most effective virus elimination can be achieved for total blood obstruction, or in other words, blood obstruction has a positive effect on the relief of the virus infection. On the other hand, blood flow brings oxygen necessary for tissue survival, immune cells and various molecules. Therefore, the interesting question is whether there exists a level and duration of blood flow reduction for which the positive effect on elimination of infection prevails over its negative effect.
In this first work devoted to the analysis of infection progression with inflammation, we deliberately simplified the model in order to obtain explicit analytical results with clear biological interpretation. Most importantly, we have not taken into account the influence of the immune response on viral infection [21]. The influence of inflammation in this case will be studied in forthcoming works.

Author Contributions

Conceptualization, V.V.; methodology, A.M. and V.V.; software, L.A.M.; formal analysis, A.M.; investigation, A.M. and L.A.M.; writing—original draft preparation, A.M.; writing—review and editing, V.V. All authors have read and agreed to the published version of the manuscript.

Funding

This work is supported by the Ministry of Science and Higher Education of the Russian Federation (project number FSSF-2023-0016).

Data Availability Statement

Data sharing not applicable.

Conflicts of Interest

The authors declare no conflict of interest.

Appendix A. Values of Parameters

We consider the case k 1 = 0 , i.e., the process of division of uninfected cells is neglected, as well as their apoptosis, since these processes are slow in the time scale of infection development. The values of other parameters were partly taken from previous works. As such, the infection rate of uninfected cells k 2 equals 7 × 10 8 mL ( day · copy ) 1 [8] or 0.29 × 10 8 mL ( h · copy ) 1 in the model units. The values of the coefficients of the death rate of infected cells is σ 1 = 0.01 h 1 , virus diffusion coefficient D 1 = 0.001 cm 2 h 1 , the rate of virus production by infected cells b = 2 · 10 7 copy ( h · cell ) 1 , and the rate of virus degradation σ 3 = 1 h 1 are taken from [19] for the Sars-CoV-2 Delta strain.
The rate of production of inflammatory cytokines by infected cells is k 6 = 6.44 × 10 3 pg ( day · cell ) 1 or 0.268 × 10 3 pg ( h · cell ) 1 in model units. We use the cytokine secretion rate from [27]. As a degradation rate of inflammatory cytokines, we take σ 4 = 1.188 day 1 or 0.0495 h 1 . The degradation rate for Il-12 is taken from [28,29].
For the cytokine-induced cell death k 3 = 0.2 mL ( day · pg ) 1 or 0.0083 / L cm 2 ( h · pg ) 1 , we use the value estimated in [30]. We also have different estimates of this parameter: k 3 = 0.00083 mL ( h · ng ) 1 , for three cytokines influence TNF- α + IFN- γ + Il1 β and k 3 = 0.03 mL / ( h · ng ) 1 , for TNF- α influences only [31]. The value of parameter k 3 has large variation in the literature. This is also true for the consumption rate of inflammatory cytokines k 7 (for example, the rate of cytokine binding to the receptors and endocytosis is 1 5 molecule · h 1 [32], the rate of complex Il-2*IL-R endocytosis is ( 15 min ) 1 [33], and the rate of Il-2 consumption by T cells is 1.1 · 10 3 s 1 [33].
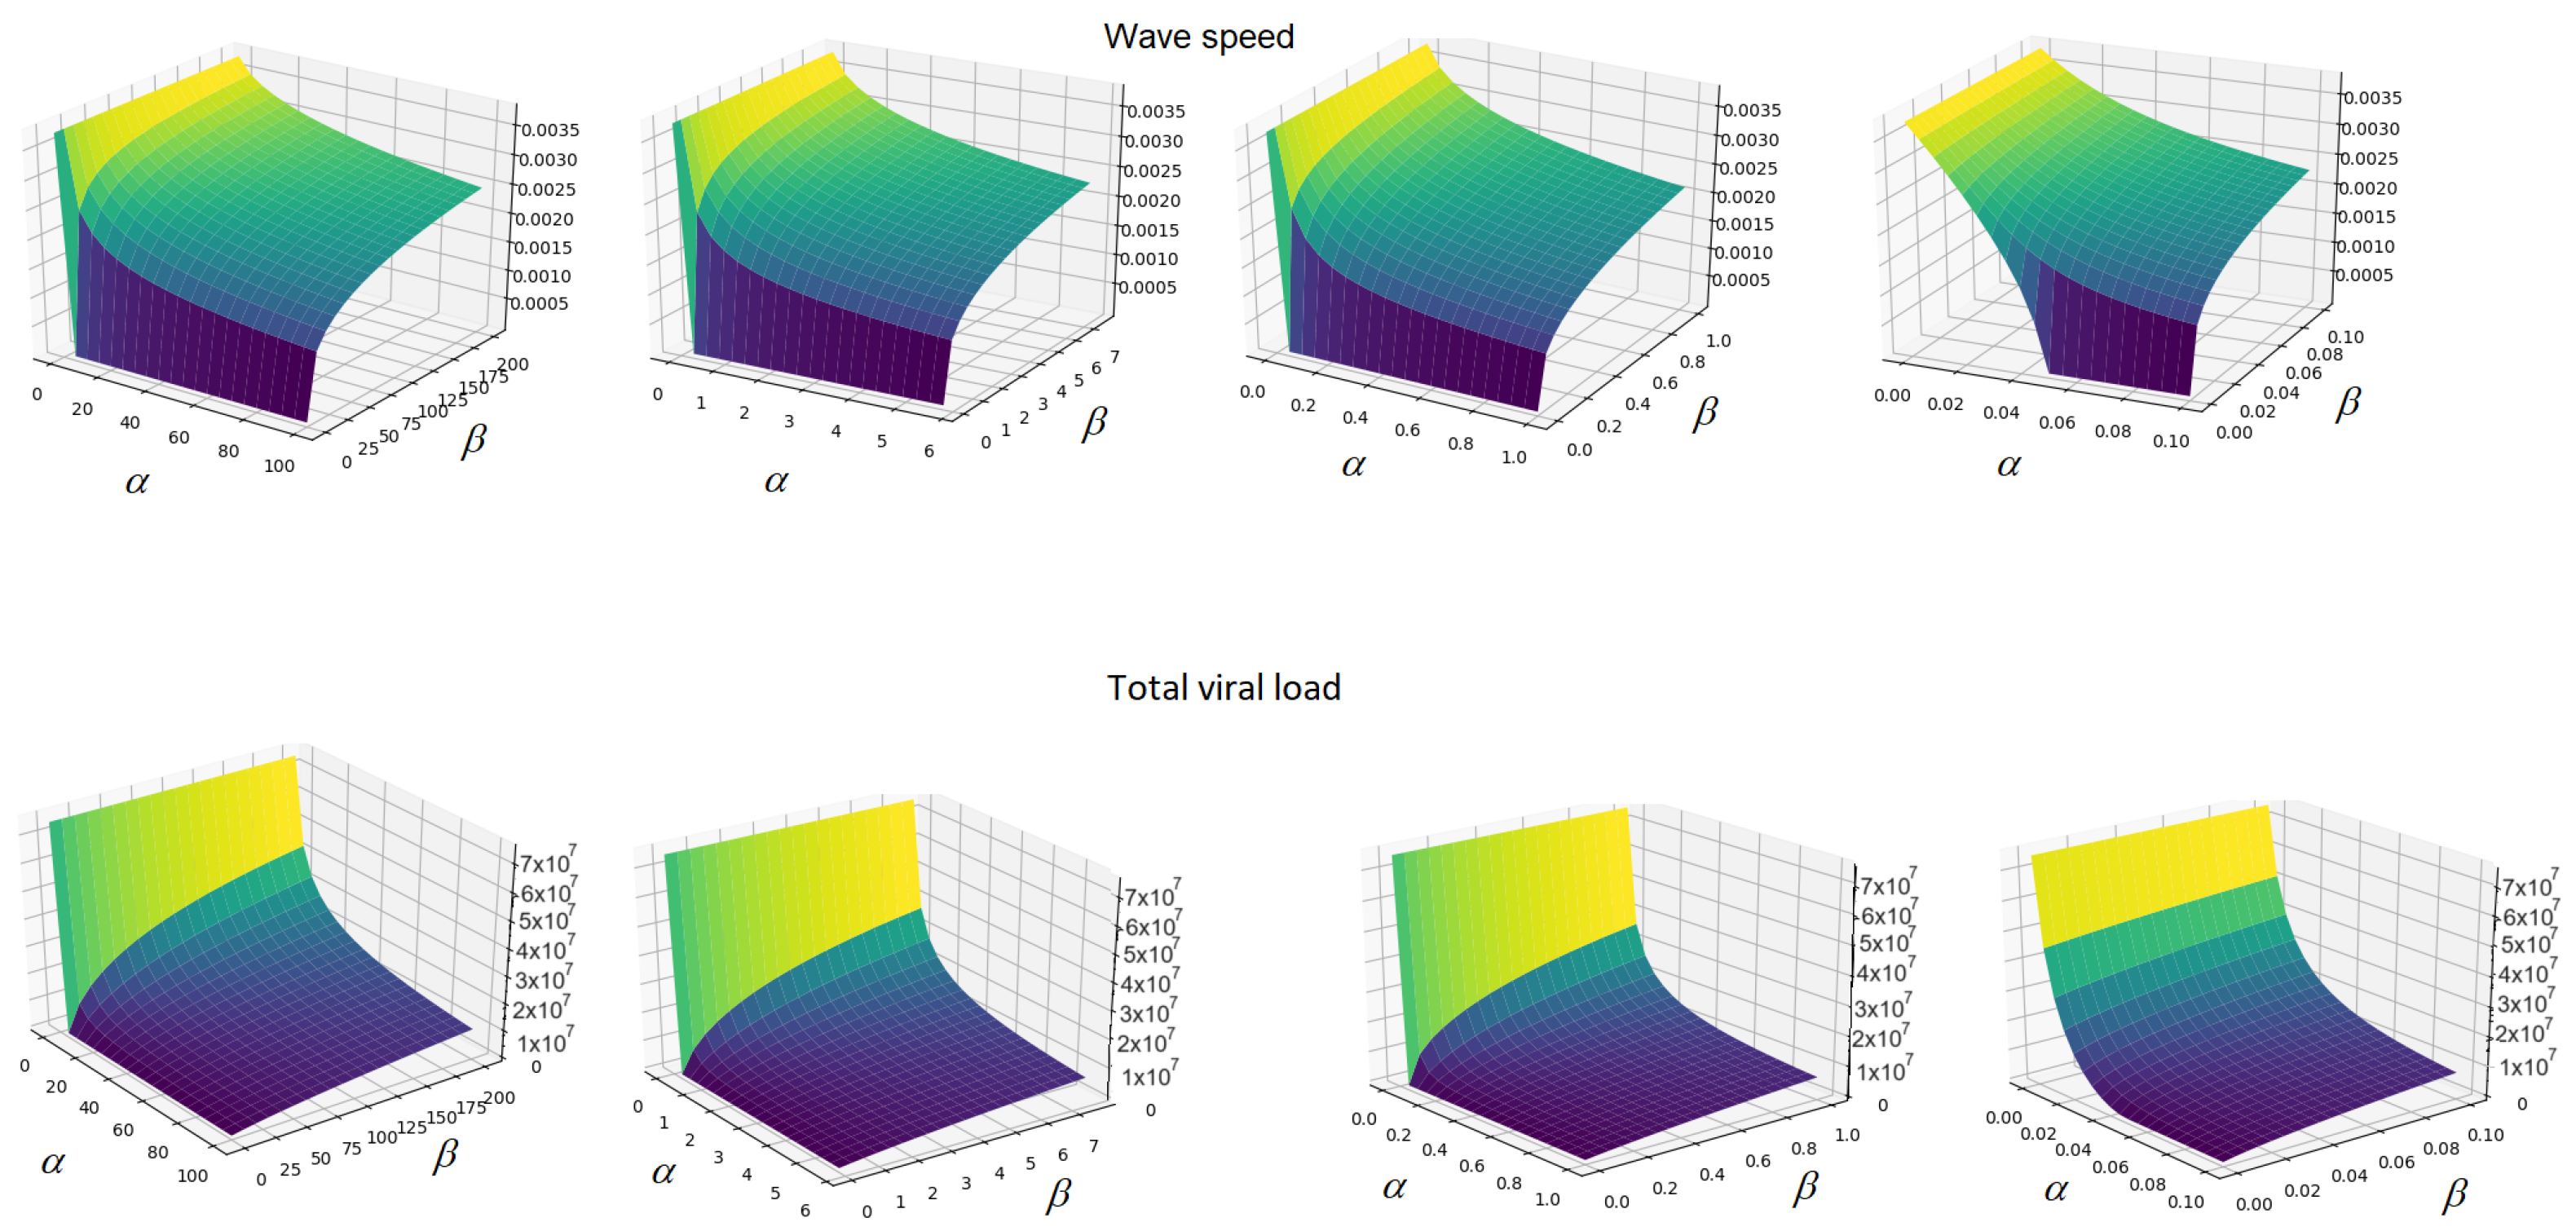
In fact, the influence of inflammation is determined by two cumulative parameters, α = k 3 k 6 / k 7 and β = σ 4 / k 7 . This allows reliable estimation of the wave speed c and total viral load J ( V ) (Figure A1) in spite of the uncertainty in the values of individual parameters.
Figure A1. Dependence of the wave speed (top line) and the total viral load (bottom line) on the inflammation parameters α and β in various intervals of their changing. From left to right: α is in [ 0 , 100 ] , β is in [ 0 , 200 ] ; α is in [ 0 , 5.8 ] , β is in [ 0 , 7.6 ] ; α is in [ 0 , 1.0 ] , β is in [ 0 , 1.0 ] ; α is in [ 0 , 0.1 ] , and β is in [ 0 , 0.1 ] .
Mathematics 11 04095 g0a1
The interval length is L = 10 cm . The initial value for the concentration of uninfected cells U 0 = 1 cell/mL, for virus concentration V 0 = 100 copy / mL for 0 < x < 1 cm, and V 0 = 0 for 1 cm < x < 10 cm .
The units of variables in Equations (1)–(5) are as follows:
[ U ] = c e l l m l , [ V ] = c o p y m l , [ W ] = c e l l m l , [ S ] = p g c m 2 , [ t ] = h , [ x ] = c m .
The units of parameters in Equations (1)–(5):
[ k 1 ] = 1 h , [ k 2 ] = m l c o p y · h , [ k 3 ] = c m 2 p g · h , [ σ 1 ] = 1 h , D 1 = c m 2 h , [ b ] = c o p y c e l l · h ,
σ 3 = 1 h , [ k 6 ] = p g c e l l · h , [ k 7 ] = c m 2 c e l l · h , [ σ 4 ] = 1 h .

Appendix B. Spatial Discretization

Let Ω be a convex, plane domain, and T h be a regular, quasi-uniform triangulation of Ω with triangles of maximum size h < 1 . Setting W h = { v h C 0 ( Ω ¯ ) ; v h | T P 1 ( T ) , T T h } as finite-dimensional, where P 1 is the set of all polynomials of degree 1 with real coefficients, and denoting by · , · the standard L 2 inner product on Ω , we consider the weak formulation of the system: find V h , U h , W h , S h W h such that ϕ h V , ϕ h U , ϕ h W W h , we have
t V h D 1 2 V h x 2 b W h + σ 3 V h ; ϕ h V = 0 ,
t U h + k 2 U h V h ; ϕ h U = 0 ,
t W h k 2 U h V h + k 3 S h W h ; ϕ h W = 0 ,
S h ( t ) = k 6 k 7 J ( W h ) + σ 4 J ( W h ) ,
which, after, gives the integration by parts:
t V h b W h + σ 3 V h ; ϕ h V + D 1 V h x ; ϕ h V x = 0 ,
t U h + k 2 U h V h ; ϕ h U = 0 ,
t W h k 2 U h V h + k 3 S h W h + σ 1 W h ; ϕ h W = 0 ,
S h ( t ) = k 6 k 7 J ( W h ) + σ 4 J ( W h ) .
The numerical method is based on the explicit first-order Euler scheme. Denote by ( V h n + 1 , W h n + 1 , U h n + 1 , S h n + 1 ) and ( V h n , W h n , U h n , S h n ) the approximate value at time t = t n + 1 and t = t n , respectively, and by δ t = 0.01 the time step size. Then, owing the system (A.5), the unknown fields at time t = t n + 1 are determined as the solution of the following system:
V h n + 1 + σ 3 δ t V h n + 1 ; ϕ h V + D 1 δ t V h x ; ϕ h V x = V h n b δ t W h ; ϕ h V ,
W h n + 1 + k 2 δ t U h n + 1 V h n + 1 ; ϕ h U = U h n ; ϕ h U ;
W h n + 1 + k 3 S h n + 1 W h n + 1 + σ 1 δ t W h n + 1 ; ϕ h W = W h n + k 2 δ t U h n + 1 V h n + 1 ; ϕ h W
S h n + 1 ( t ) = k 6 k 7 J ( W h n + 1 ) + σ 4 J ( W h n + 1 ) .

Appendix C. Derivation of Equation (23)

If σ 4 0 , then Equation (18) is quadratic with respect to J ( w ) :
J 2 ( w ) k 3 k 6 + k 7 σ 1 + J ( w ) σ 1 σ 4 c k 7 u 0 ( 1 X ) c σ 4 u 0 ( 1 X ) = 0 .
The positive solution of this equation is defined with:
J ( w ) = 1 2 A σ 1 σ 4 c k 7 u 0 ( 1 X ) + D ( c , X ) ,
where
D ( c , X ) = σ 1 σ 4 c k 7 u 0 ( 1 X ) 2 + 4 A c σ 4 u 0 ( 1 X ) ,
A = k 3 k 6 + k 7 σ 1 > 0 .
If we substitute this into the Equation (17) with respect to (19), we get the equation for X:
B c ln X = σ 1 σ 4 c k 7 u 0 ( 1 X ) + D ( c , X ) , B = 2 A σ 3 b k 2 .
Moving the first term from the right-hand side of this equation to the left, and taking the second power of the resulting equation, we obtain:
B 2 c 2 ln 2 X 2 B c ln X σ 1 σ 4 c k 7 u 0 ( 1 X ) = 4 A c σ 4 u 0 ( 1 X ) .
Dividing all of the terms by c and 4 A , we obtain:
σ 3 b k 2 2 A c ln 2 X σ 3 b k 2 ln X σ 1 σ 4 c k 7 u 0 ( 1 X ) = σ 4 u 0 ( 1 X ) .
Divide all of the terms by σ 1 σ 3 σ 4 / b k 2 and group the terms in the following way:
ln X σ 3 A c b k 2 σ 1 σ 4 ln X 1 = ( 1 X ) u 0 b k 2 σ 1 σ 3 c k 7 u 0 σ 1 σ 4 ln X .
We finally obtain the following equation
ln X ( ln X q ) = p ( X 1 ) ( ln X r ) ,
where
p = b k 2 k 7 u 0 σ 3 A > 0 , q = b k 2 σ 1 σ 4 σ 3 A c > 0 , r = b k 2 σ 4 σ 3 c k 7 > 0 .

References

  1. Nguyen, L.N.; Kanneganti, T.-D. PANoposis in Viral Infection: The Missing Puzzle Piece in the Cell Death Field. J. Mol. Biol. 2021, 434, 167249. [Google Scholar] [CrossRef]
  2. Medzhitov, R. Recognition of microorganisms and activation of the immune response. Nature 2007, 449, 819–826. [Google Scholar] [CrossRef]
  3. Medzhitov, R.; Janeway, C.A. Innate immunity: Impact on the adaptive immune response. Curr. Opin. Immunol. 1997, 9, 4–9. [Google Scholar] [CrossRef] [PubMed]
  4. Carty, M.; Guy, C.; Bowie, A.G. Detection of viral infections by innate immunity. Biochem. Pharmacol. 2020, 183, 114316. [Google Scholar] [CrossRef] [PubMed]
  5. Place, D.E.; Lee, S.; Kanneganti, T.D. PANoptosis in microbial infection. Curr. Opin. Microbiol. 2021, 59, 42–49. [Google Scholar] [CrossRef]
  6. Fajgenbaum, D.C.; June, C.H. Cytokine Storm. N. Engl. J. Med. 2020, 383, 2255–2273. [Google Scholar] [CrossRef] [PubMed]
  7. Karki, R.K. The ‘cytokine storm’: Molecular mechanisms and therapeutic prospects. Trends Immunol. 2021, 42, 681–705. [Google Scholar] [CrossRef] [PubMed]
  8. Leon, C.; Tokarev, A.; Bouchnita, A.; Volpert, V. Modelling of the Innate and Adaptive Immune Response to SARS Viral Infection, Cytokine Storm and Vaccination. Vaccines 2023, 11, 127. [Google Scholar] [CrossRef]
  9. Funk, G.A.; Jansen, V.A.A.; Bonhoeffer, S.; Killingback, T. Spatial models of virus-immune dynamics. J. Theor. Biol. 2005, 233, 221–236. [Google Scholar] [CrossRef]
  10. Labadie, M.; Marciniak-Czochra, A. A Reaction-Diffusion Model for Viral Infection and Immune Response. Preprint, 2011, fhal-00546034v2. Available online: http://hal.archives-ouvertes.fr (accessed on 1 August 2023).
  11. Rodriguez-Brenes, I.A.; Hofacre, A.; Fan, H.; Wodarz, D. Complex Dynamics of Virus Spread from Low Infection Multiplicities: Implications for the Spread of Oncolytic Viruses. PLoS Comput. Biol. 2017, 13, e1005241. [Google Scholar] [CrossRef] [PubMed]
  12. Graziano, F.M.; Kettoola, S.Y.; Munshower, J.M.; Stapleton, J.T.; Towfic, G.J. Effect of spatial distribution of T-Cells and HIV load on HIV progression. Bioinformatics 2008, 24, 855–860. [Google Scholar] [CrossRef] [PubMed]
  13. Grebennikov, D.; Karsonova, A.; Loguinova, M.; Casella, V.; Meyerhans, A.; Bocharov, G. Predicting the Kinetic Coordination of Immune Response Dynamics in SARS-CoV-2 Infection: Implications for Disease Pathogenesis. Mathematics 2022, 10, 3154. [Google Scholar] [CrossRef]
  14. Chhetri, B.; Bhagat, V.M.; Vamsi, D.K.K.; Ananth, V.S.; Prakash, B.D.; Mandale, R.; Muthusamy, S.; Sanjeevi, C.B. Within-host mathematical modeling on crucial inflammatory mediators and drug interventions in COVID-19 identifies combination therapy to be most effective and optimal. Alex. Eng. J. 2021, 60, 2491–2512. [Google Scholar] [CrossRef]
  15. Fadai, N.T.; Sachak-Patwa, R.; Byrne, H.M.; Maini, P.K.; Bafadhel, M.; Nicolau, D.V. Infection, inflammation and intervention: Mechanistic modelling of epithelial cells in COVID-19. J. R. Soc. Interface 2021, 18, 175. [Google Scholar] [CrossRef]
  16. Vodovotz, Y.; Clermont, G.; Chow, C.; An, G. Mathematical models of the acute inflammatory response. Curr. Opin. Crit. Care 2004, 10, 383–390. [Google Scholar] [CrossRef]
  17. Minucci, S.B.; Heise, R.L.; Reynolds, A.M. Review of Mathematical Modeling of the Inflammatory Response in Lung Infections and Injuries. Front. Appl. Math. Stat. 2020, 6, 36. [Google Scholar] [CrossRef]
  18. Ait Mahiout, L.; Bessonov, N.; Kazmierczak, B.; Sadaka, G.; Volpert, V. Infection spreading in cell culture as a reaction-diffusion wave. ESAIM Math. Model. Numer. Anal. 2022, 56, 791–814. [Google Scholar] [CrossRef]
  19. Ait Mahiout, L.; Mozokhina, A.; Tokarev, A.; Volpert, V. Virus Replication And Competition In A Cell Culture: Application to the SARS-CoV-2 Variants. Appl. Math. Lett. 2022, 133, 108217. [Google Scholar] [CrossRef]
  20. Tokarev, A.; Mozokhina, A.; Volpert, V. Competition of SARS-CoV-2 Variants in Cell Culture and Tissue: Wins the Fastest Viral Autowave. Vaccines 2022, 10, 995. [Google Scholar] [CrossRef]
  21. Ait Mahiout, L.; Mozokhina, A.; Tokarev, A.; Volpert, V. The Influence of Immune Response on Spreading of Viral Infection. Lobachevskii J. Math. 2022, 43, 2699–2713. [Google Scholar] [CrossRef]
  22. Bessonov, N.; Bocharov, G.; Mozokhina, A.; Volpert, V. Viral Infection Spreading in Cell Culture with Intracellular Regulation. Mathematics 2023, 11, 1526. [Google Scholar] [CrossRef]
  23. Bessonov, N.; Volpert, V. Airway obstruction in respiratory viral infections due to impaired mucociliary clearance. Int. J. Numer. Methods Biomed. Eng. 2023, e3707. [Google Scholar] [CrossRef] [PubMed]
  24. Volpert, A.; Volpert, V.; Volpert, V. Traveling Wave Solutions of Parabolic Systems; American Mathematical Society: Providence, RI, USA, 1994. [Google Scholar]
  25. Hecht, F.; Auliac, S.; Pironneau, O.; Morice, J.; Le Hyaric, A.; Ohtsuka, K. Freefem++ (Manual). 2007. Available online: www.freefem.org (accessed on 10 September 2023).
  26. Nathanson, N.; Gonzalez-Scarano, F. Chapter 7 Patterns of Infection. In Viral Pathogenesis, 3rd ed.; Academic Press: Boston, MA, USA, 2016; p. 81. [Google Scholar] [CrossRef]
  27. Reis, R.F.; Pigozzo, A.; Bonin, C.R.B.; Quintela, B.M.; Pompei, L.T.; Vieira, A.C.; de Lima e Silva, L.; Xavier, M.P.; dos Santos, R.W.; Lobosco, M. A Validated Mathematical Model of the Cytokine Release Syndrome in Severe COVID-19. Front. Mol. Biosci. 2021, 8, 639423. [Google Scholar] [CrossRef] [PubMed]
  28. Friedman, A.; Turner, J.; Szomolay, B. A model on the influence of age on immunity to infection with Mycobacterium tuberculosis. Exp. Gerontol. 2008, 43, 275–285. [Google Scholar] [CrossRef]
  29. Abi Younes, G.; El Khatib, N. Mathematical modeling of inflammatory processes of atherosclerosis. Math. Model. Nat. Phenom. 2022, 17, 5. [Google Scholar] [CrossRef]
  30. El Hajj, W.; El Khatib, N.; Volpert, V. Inflammation propagation modeled as a reaction–diffusion wave. Math. Biosci. 2023, 365, 109074. [Google Scholar] [CrossRef]
  31. de Klaver, M.; Manning, L.; Palmer, L.; Rich, G. Isoflurane pretreatment inhibits cytokine-induced cell death in cultured rat smooth muscle cells and human endothelial cells. Anesthesiology 2002, 97, 24–32. [Google Scholar] [CrossRef]
  32. Altan- Bonnet, G.; Mukherjee, R. Cytokine- mediated communication: A quantitative appraisal of immune complexity. Nat. Rev. Immunol. 2019, 19, 205–217. [Google Scholar] [CrossRef]
  33. Höfer, T.; Krichevsky, O.; Altan-Bonnet, G. Competition for IL-2 between regulatory and effectorT cells to chisel immune responses. Front. Immunol. 2012, 3, 268. [Google Scholar] [CrossRef]
Figure 1. Graphical solutions of Equation (23) depending on the values of parameters: Black lines are the left-hand side of Equation (23), and red lines represent the right-hand side of Equation (23). (a) p = 0.8 , q = 0.14 , r = 1.56 ( R v ( 1 ) > 1 ), (b) p = 0.8 , q = 1.25 , r = 1.56 ( R v ( 1 ) = 1 ), (c) p = 0.8 , q = 1.96 , r = 1.56 ( R v ( 1 ) < 1 ).
Mathematics 11 04095 g001
Figure 2. The dependence of (a) the wave speed and (b) the total viral load on parameter α for σ 4 = 0 (i.e., β = 0 ); values of other parameters are listed in Appendix A. The maximal wave speed c α = 0 = 0.003768 cm / h and the maximal total viral load J ( V ) α = 0 = 7 , 513 , 498 copy / cm 2 .
Mathematics 11 04095 g002
Figure 3. Concentrations of uninfected cells U ( t , x ) , infected cells W ( x , t ) , and virus V ( x , t ) as a function of x in consecutive moments of time t = 10 , 40 , 70 , 100 , 130 . Values of parameters: k 2 = 10 5 mL ( h · copy ) 1 , b = 2 × 10 7 copy ( h · cell ) 1 , σ 3 = 1 h 1 , D 1 = 0.001 cm 2 h 1 , σ 1 = 0.1 h 1 , k 3 = 0.2 cm 2 ( h · pg ) 1 , k 6 = 6 . 10 3 pg ( h · cell ) 1 , k 7 = 6.5 . 10 12 cm 2 ( h · cell ) 1 , σ 4 = 1.188 h 1 , L = 10 cm, v 0 = 100 (copy/mL), u 0 = 1 (cell/mL).
Mathematics 11 04095 g003
Figure 4. The dependence of the wave speed (blue) and the total viral load (red) as a function of α for (a) β = 0 , (b) β = 0.1 : The same as a function of β for (c) α = 0 , (d) α = 0.1 . In figures (ad) σ 4 0 . Values of other parameters are listed in Appendix A. The numerical results for the wave speed are shown with blues dots, and the numerical results for the total viral load are shown with red triangles. The difference between the numerical calculations and analytical estimations are less that 1%.
Mathematics 11 04095 g004
Disclaimer/Publisher’s Note: The statements, opinions and data contained in all publications are solely those of the individual author(s) and contributor(s) and not of MDPI and/or the editor(s). MDPI and/or the editor(s) disclaim responsibility for any injury to people or property resulting from any ideas, methods, instructions or products referred to in the content.