Article

WT-CNN: A Hybrid Machine Learning Model for Heart Disease Prediction

1
Center of Excellence and Information Assurance (CoEIA), King Saud University, Riyadh 11543, Saudi Arabia
2
Department of Computer Science, College of Computer and Information Sciences, King Saud University, Riyadh 11543, Saudi Arabia
*
Author to whom correspondence should be addressed.
Mathematics 2023, 11(22), 4681; https://doi.org/10.3390/math11224681
Submission received: 7 October 2023 / Revised: 6 November 2023 / Accepted: 9 November 2023 / Published: 17 November 2023
(This article belongs to the Section Fuzzy Sets, Systems and Decision Making)

Abstract

:
Heart disease remains a predominant health challenge, being the leading cause of death worldwide. According to the World Health Organization (WHO), cardiovascular diseases (CVDs) take an estimated 17.9 million lives each year, accounting for 32% of all global deaths. Thus, there is a global health concern necessitating accurate prediction models for timely intervention. Several data mining techniques are used by researchers to help healthcare professionals to predict heart disease. However, the traditional machine learning models for predicting heart disease often struggle with handling imbalanced datasets. Moreover, when prediction is on the bases of complex data like ECG, feature extraction and selecting the most pertinent features that accurately represent the underlying pathophysiological conditions without succumbing to overfitting is also a challenge. In this paper, a continuous wavelet transformation and convolutional neural network-based hybrid model abbreviated as WT-CNN is proposed. The key phases of WT-CNN are ECG data collection, preprocessing, RUSBoost-based data balancing, CWT-based feature extraction, and CNN-based final prediction. Through extensive experimentation and evaluation, the proposed model achieves an exceptional accuracy of 97.2% in predicting heart disease. The experimental results show that the approach improves classification accuracy compared to other classification approaches and that the presented model can be successfully used by healthcare professionals for predicting heart disease. Furthermore, this work can have a potential impact on improving heart disease prediction and ultimately enhancing patient lifestyle.

1. Introduction

Heart disease is a leading cause of premature death worldwide, affecting millions of people each year [1]. Cardiovascular diseases are of diverse nature and may affect the heart’s structure and function, including coronary artery disease, arrhythmias, heart valve disease, and heart failure [2]. These conditions can lead to serious health complications, including heart attack, stroke, and even death. Therefore, an accurate and timely diagnosis of heart disease is crucial and requires a fast diagnosis mechanism to treat the critical condition effectively [3].
The traditional approach to heart disease diagnosis involves clinical assessment, medical history, and a physical examination. However, these methods may not always be sufficient to diagnose heart disease accurately, especially in the early stages [4]. In recent years, data mining and machine learning techniques have been used to analyze large amounts of data to help healthcare professionals predict and diagnose heart disease more effectively [5].
Prominent machine learning techniques include hybrid and ensemble methods [6]. The use of hybrid machine learning models in the prediction of heart disease offers several distinct advantages over traditional methods or the use of a single machine learning algorithm [7]. Hybrid models typically combine two or more algorithms to capitalize on the strengths of each, thereby overcoming the limitations that single models may present [8]. For instance, decision trees might offer interpretability and easy identification of the most significant variables, whereas neural networks may offer higher predictive accuracy for complex relationships that are non-linear [9]. Combining these methods can yield a model that not only has high accuracy but is also interpretable by healthcare professionals. This multifaceted approach allows for more robust generalization across different datasets and populations, reducing the likelihood of overfitting [10]. Furthermore, hybrid models can integrate disparate types of data, such as numerical, categorical, and even image data, providing a more holistic view of a patient’s risk profile [11]. Therefore, in the critical domain of heart disease prediction, hybrid machine learning models offer a synergistic approach that can significantly enhance both the accuracy and the utility of predictive analytics.
Despite of the fact that hybrid machine learning models for heart disease prediction offer numerous advantages, they may have certain limitations. One major drawback is the increased complexity and computational overhead associated with combining multiple algorithms, which can make the model difficult to implement and maintain in resource-constrained healthcare settings [12]. Additionally, the interpretability of these models can be compromised when highly complex algorithms like neural networks are involved, making it challenging for clinicians to understand the underlying decision-making process and thus trust the predictions [13]. The data needed to train these hybrid models can also be extensive, requiring not just large sample sizes but also diverse types of data, which may not always be readily available or easily integrated [14]. Ethical considerations, such as data privacy and fairness, can also become more complicated when multiple types of algorithms and data sources are used. Furthermore, the risk of overfitting can still exist if the model is not carefully validated, leading to optimistic estimates of performance that do not generalize well to new or unseen data. Therefore, although hybrid models hold great promise for improving heart disease prediction, these limitations need to be carefully addressed to make them viable for widespread clinical adoption.
From the above discussion, it has been concluded that there is a need to define a more refined model that overcomes the above-stated limitations. This research introduces a hybrid model based on data balancing, wavelet transformation-based feature extraction, and CNN for predicting heart disease. Wavelet transformation allows for the effective decomposition of signals into different frequency components (features), making it possible to extract hidden patterns in ECG. On the other hand, CNN brings the optimization power of artificial neural networks, fine tuning the network’s parameters to enhance its predictive capabilities. The integration of these methods can result in a model with exceptional predictive accuracy due to the synergistic effect of the diverse algorithms.
The key contribution of the proposed work is summarized as:
  • The proposed work introduces a new hybrid model that combines continuous wavelet transform (CWT), CNN, and random undersampling boost (RUSBoost) that could make a significant contribution to improving the early diagnosis of cardiac issues.
  • An accurate and automated diagnostic tool could potentially be more cost effective than manual diagnosis, leading to broader access to cardiac care.
  • The experimental evaluation concealed that the performance of the proposed work surpassed the existing benchmark methods by yielding 97.2% accuracy.
The rest of the paper is organized as follows: Section 2 delves into the literature review. Section 3 explores the proposed methodology. In Section 4, we provide an in-depth look at the experimental setup and evaluations. Section 5 outlines the conclusion, with a discussion on future avenues for research.

2. Literature Review

Heart disease is a significant health concern worldwide, affecting millions of people each year [15]. There is a bulk of literature that includes machine learning-based techniques to diagnose and predict heart disease. In this section, we review some of the existing literature that is based on machine learning algorithms and data mining techniques used for heart disease prediction.
Ref. [16] highlighted that the decision tree is a popular machine learning algorithm used for heart disease prediction. They claimed that a decision tree is constructed by recursively partitioning the data into subsets based on the most informative attribute until a stopping criterion is met. The final result is a tree-like structure, where each node represents a decision based on the attribute value and each leaf node represents a class label. The work predicted coronary artery disease (CAD) for diabetic patients. The study achieved an accuracy of 82.25% and showed that decision trees can be an effective tool for predicting CAD in diabetic patients. Chaurasia et al. [17] performed a comparative analysis on different data mining-based techniques that were used to detect heart disease. In their research, the WEKA tool was used for implementation, which used multiple algorithms of data mining, like J48, Naïve Bayes, and bagging. They used a heart disease dataset with 313 attributes for true prediction and 13 attributes for false prediction.
Islam et al. [18] discussed that neural networks are a type of machine learning algorithm that produces better diagnoses and is inspired by the structure and function of the human brain. They specified that neural networks consist of interconnected nodes or neurons that process information and make predictions. Neural networks have been used in several studies to predict heart disease. The authors proposed a neural network-based algorithm to predict heart disease for Bangladeshi patients. Their study achieved an accuracy of 88.3% and showed that neural networks can be an effective tool for predicting heart disease. Hussain et al. [19] also used an SVM algorithm to predict heart disease for Pakistani patients. Their study achieved an accuracy of 89.38% and showed that SVMs can be an effective tool for predicting heart disease.
Tan et al. [20] suggested a multi-disease hybrid method using two machine learning algorithms: are SVM (support vector machine) and GA (genetic algorithm). They claimed that SVM and GA can be effectively combined to achieve more optimized results. In their work, they used different data mining tools like LIBSVM and WEKA for their analysis, using different datasets from the IUC repository. Another research [21] also proposed a random forest-based ensemble learning algorithm that combines the predictions of multiple decision trees to improve the model’s accuracy and robustness. In their work, they used a random forest algorithm for the prediction of heart disease in Indian patients. From the experimental evaluations, they showed an accuracy of 90.16%.
The study in [22] used a hybrid model based on random forest along with correlation-based feature selection and principal component analysis (PCA) for predicting heart disease. They achieved an accuracy of 93.39% and showed that random forest with PCA-based feature selection can be an effective tool for predicting heart disease. Furthermore, the study by Iqbal et al. [23] proposed a hybrid model using random forest and ReliefF feature selection to predict heart disease in Pakistani patients. Their proposed work achieved an accuracy of 91.23%.
Another study [24] presented a new technique, where the feature selection was performed by using a genetic algorithm to predict heart disease with an accuracy of 91.67%. Similarly, a comparative study [25] used GA-based feature selection with k-nearest neighbor (k-NN) and SVM algorithms to predict heart disease. Their results showed an accuracy of 88.67% with k-NN and 90.33% with SVM and showed that GA-based feature selection can improve the accuracy of heart disease prediction. Another study [26] used an ensemble of three convolution kernel-based methods for fault detection and achieved an accuracy of 98.8%. The study by Salem and El-Horbaty [27] used a hybrid feature selection approach with Chi-square feature selection and a genetic algorithm to predict heart disease in Egyptian patients. They achieved an accuracy of 92.81% and showed that the hybrid approach can improve the accuracy of heart disease prediction.
The authors of [28] used a combination of Chi-square feature selection and the SVM algorithm to predict heart disease in Vietnamese patients. Their study resulted in an accuracy of 88.95%. Hussain et al. [29] proposed a similar method for detecting congestive heart failure (CHF) using machine learning classifiers, achieving improved detection performance compared to unbalanced data. Furthermore, Iqbal et al. [30] proposed a hybrid machine learning approach that integrates the artificial bee colony algorithm with a support vector machine, random forest, and multivariate adaptive regression splines to predict the mature weight of camels using biometric measurements, achieving improved accuracy compared to traditional machine learning models.
Reddy et al. [31] demonstrated that feature extraction and selection using PCA and correlation-based feature selection, combined with hyper-parameter optimization of ensemble classifiers, resulted in an efficient prediction system for coronary heart disease risk with an accuracy of 97.91% and an AUC of 0.996, outperforming related works. R. Sharmila et al. [8] suggested enhancing the prediction of a heart diseases dataset using SVM, which provided an accuracy of 85%.
In conclusion, there are many machine learning algorithms and data mining techniques that have been used to predict heart disease [32,33]. Most of them have significant limitations in terms of the complexity and computational burden that usually come with integrating multiple algorithms. Furthermore, these complex models, particularly those incorporating neural networks, can be less interpretable, posing challenges for medical professionals to fully grasp the rationale behind the predictions and thereby trust the model. Additionally, there is a persistent risk of overfitting if rigorous validation is not performed, potentially resulting in overly optimistic performance metrics that fail to extend to new or different datasets. Thus, despite the substantial potential of hybrid models to enhance heart disease prediction, these drawbacks must be meticulously managed for successful clinical application. The proposed research combines RUSBoost, CWT, and CNN for heart disease prediction to overcomes the above-stated issues.

3. Proposed Method

In this section, a detailed description of a hybrid machine learning model that combines wavelet transformation with a convolutional neural network (CNN) for heart disease prediction is provided. The key phases of the proposed model are data collection, feature extraction, feature scaling, and fusion-based final classification. The graphical representation of the proposed model is depicted in Figure 1.
The methodology begins with the collection and preprocessing of relevant medical data, which are then subjected to wavelet transforms to extract pertinent features and reduce noise. These transformed features are fed into a meticulously designed CNN, with its architecture tailored to capture the complex patterns and relationships inherent in heart disease data. The model is trained on a substantial dataset, with careful partitioning into training, validation, and test sets to ensure robustness and prevent overfitting. Performance metrics such as accuracy, precision, recall, and F1 score are employed to rigorously evaluate the model, with comparisons made against established baseline models to underscore the efficacy of the WT-CNN approach. The paper elucidates the benefits of integrating wavelet transforms with CNNs, providing a comprehensive analysis of the results, discussing potential limitations, and suggesting avenues for future research to further refine and validate the proposed model in diverse clinical settings.

3.1. Preprocessing and Data Blancing

Preprocessing is a crucial component in the heart disease prediction pipeline, as it involves preparing the raw input data for effective analysis. Focus was placed on data acquisition and cleaning, because the ECG recordings were obtained from various sources that have issues of noise and data imbalance. Initially, the raw ECG signals were carefully reviewed for the detection and removal of motion artifacts, electrode drift, and baseline wander. For this purpose, bandpass filters were adapted [29]. ECG signals can exhibit variations in amplitude due to differences in recording conditions or hardware settings. In order to address this issue, Z-score normalization was used, which helps scale the signals to a common range. Equation (1) shows the mathematical formulation of Z-score normalization for the scaling of ECG signals.
v = v A ¨ α
Here v′, v are the new and old data entries, respectively, and α , A are the standard deviation and the mean of A, respectively. To handle the temporal variability in ECG signal duration, the signals are segmented into smaller, fixed-length chunks. This allows the focus to be placed on specific cardiac cycles and the temporal dynamics associated with heart disease to be captured. The segment length is determined based on the average duration of a typical cardiac cycle, ensuring that essential information is preserved while maintaining computational efficiency. After that, random rotations are introduced to both the original input data and the wavelet-transformed data in order to create variations in viewpoints. Additionally, the input images and their corresponding wavelet representations are flipped horizontally. This augmentation technique is employed to mitigate the risk of overfitting in the model.
The imbalance in ECG datasets for heart disease prediction poses substantial challenges to developing robust and reliable predictive models, with one class (e.g., normal heart activity) being significantly more prevalent in the dataset than the other(s) (e.g., various types of heart disease or arrhythmias). In such scenarios, the proposed WT-CNN may tend to be biased towards the majority class due to the disproportionate distribution of data. This bias compromises the model’s ability to accurately identify and classify instances of the minority class, which, in the context of heart disease prediction, can lead to potential misdiagnoses or missed diagnoses of critical conditions.
To address data imbalances, especially in the context of electrocardiogram (ECG) datasets, RUSBoost (random undersampling boost) was designed. It combines the principles of random undersampling (RUS) and the AdaBoost algorithm to create a more balanced dataset and boost the performance of a given classifier. In this process, RUS involves randomly eliminating instances from the majority class to reduce its overwhelming influence on the classifier.
Where
  • N: total number of instances;
  • Nmin: number of minority class instances;
  • Nmaj: number of majority class instances.
RUS aims to decrease Nmaj to create a more balanced dataset. Typically, instances are removed randomly, but intelligent undersampling [29] is also be applied to preserve potentially informative instances. In order to refine the previous phase, the AdaBoost algorithm focuses on instances that are hard to classify by giving them more weight in successive training rounds, such as:
  • Dt(i): the weight of instance i in round t;
  • αt: amount of say of weak classifier t (calculated based on its error rate);
  • ht(x): weak classifier at round t.
AdaBoost adjusts the weights of misclassified instances, increasing them to emphasize their importance in subsequent rounds. Algorithm 1 shows the mathematical calculation of the above-defined parameters, along with the work of the proposed RUSBoost for balancing the imbalance data. When applied to ECG data for heart disease prediction, RUSBoost helps to maintain the crucial information contained in the minority class (instances of heart disease).
Algorithm 1 RUSBoost for Data Balancing
Initialize instance weights: D 1 (i) = 1 N  for i = 1, 2, …, N.
For t = 1 to T (where T is the total number of boosting rounds):
Apply RUS to create a balanced subset of the data using the current instance weights  D t ( i ) . This typically involves undersampling the majority class according to D t ( i )  without replacement.
Train weak classifier  h t ( i )  using the balanced subset.
Compute error of  h t ( i ) : e r r t i = 1 N D t i I   h t x i y t i = 1 N D t i  where I is the indicator function, x i  is instances, and  y i  is true labels.
Compute classifier weight  t = 1 2 ln   ( 1 e r r t   e r r t )
Update instance weights
The final model is  H ( x ) = sign   ( t = 1 T t h t ( x ) )

3.2. Feature Extraction

There are many methods to extract the relevant features from ECG signals, but they may have the problems. However, CWT is considered to be the most powerful signal processor due to its simultaneous analysis in both the time and frequency domains, making it suitable for capturing the non-stationary characteristics of ECG signals [22]. CWT evaluates constant signals f(t) by using a mother wavelet function ψ(a,b), which is given by the integral:
W x a , b = 1 a x ( t ) φ ( t b a ) d t
where
  • W x a , b represents the wavelet coefficient at scale a and shift b;
  • φ is the wavelet function (mother wavelet);
  • a,b are the scale and translation parameters, repectively.
where
  • Wx(a,b) represents the wavelet coefficients at scale a and shift b, respectively;
  • ψ(t) denotes the complex conjugate of the mother wavelet function;
  • A, b are the scale and translation parameters, respectively.
The kurtosis K of the wavelet coefficient distribution for a particular scale can be computed as follows:
K = n i = 1 n ( W x a , b W x ) ( n 1 ) ( n 2 ) ( n 3 ) s   3
where n is the number of coefficients at scale a, Wx is the mean of the wavelet coefficients at scale a, and s is the standard deviation of the wavelet coefficients at scale a. Kurtosis is especially valuable in ECG analysis because it measures the “tailedness” and sharpness of the distribution peak, which can indicate irregularities in the ECG signal. A higher kurtosis value indicates a more peaked and long-tailed distribution of wavelet coefficients, suggesting potential abnormalities or non-linearity in the original ECG signal, which could be indicative of heart disease. Afterwards, the scalogram of the CWT coefficients are formed, which optionally highlights the regions of interest identified by high kurtosis values. The scalogram provides a time–frequency representation of the signal, where time is represented along the x-axis and frequency along the y-axis. The intensity or color of each point in the scalogram indicates the strength or magnitude of the frequency component at that specific time point and frequency scale. The scalogram formation helps with the extraction of relevant features that capture essential characteristics of ECG signals related to heart disease. The final potential features from the scalogram are been selected on the basis of the following criteria:
  • Peak amplitudes: The local maxima in the scalogram are identified to extract the corresponding peak amplitudes. Peaks in the scalogram often correspond to specific frequency components that carry important information about heart diseases.
  • Wavelet energy: The energy distribution across different scales and time intervals is computed in the scalogram, which represents the strength of various frequency components present in the ECG signals. This provides insights into their contribution to heart disease patterns.
  • Frequency band power: The power within specific frequency bands of interest, such as the low-frequency (LF) and high-frequency (HF) bands, are also computed. This enables the spectral characteristics associated with heart diseases to be captured that potentially differentiate between different stages of heart disease.
On the basis of above criteria, the extracted features serve as the input to the proposed fusion-based hybrid machine learning model.

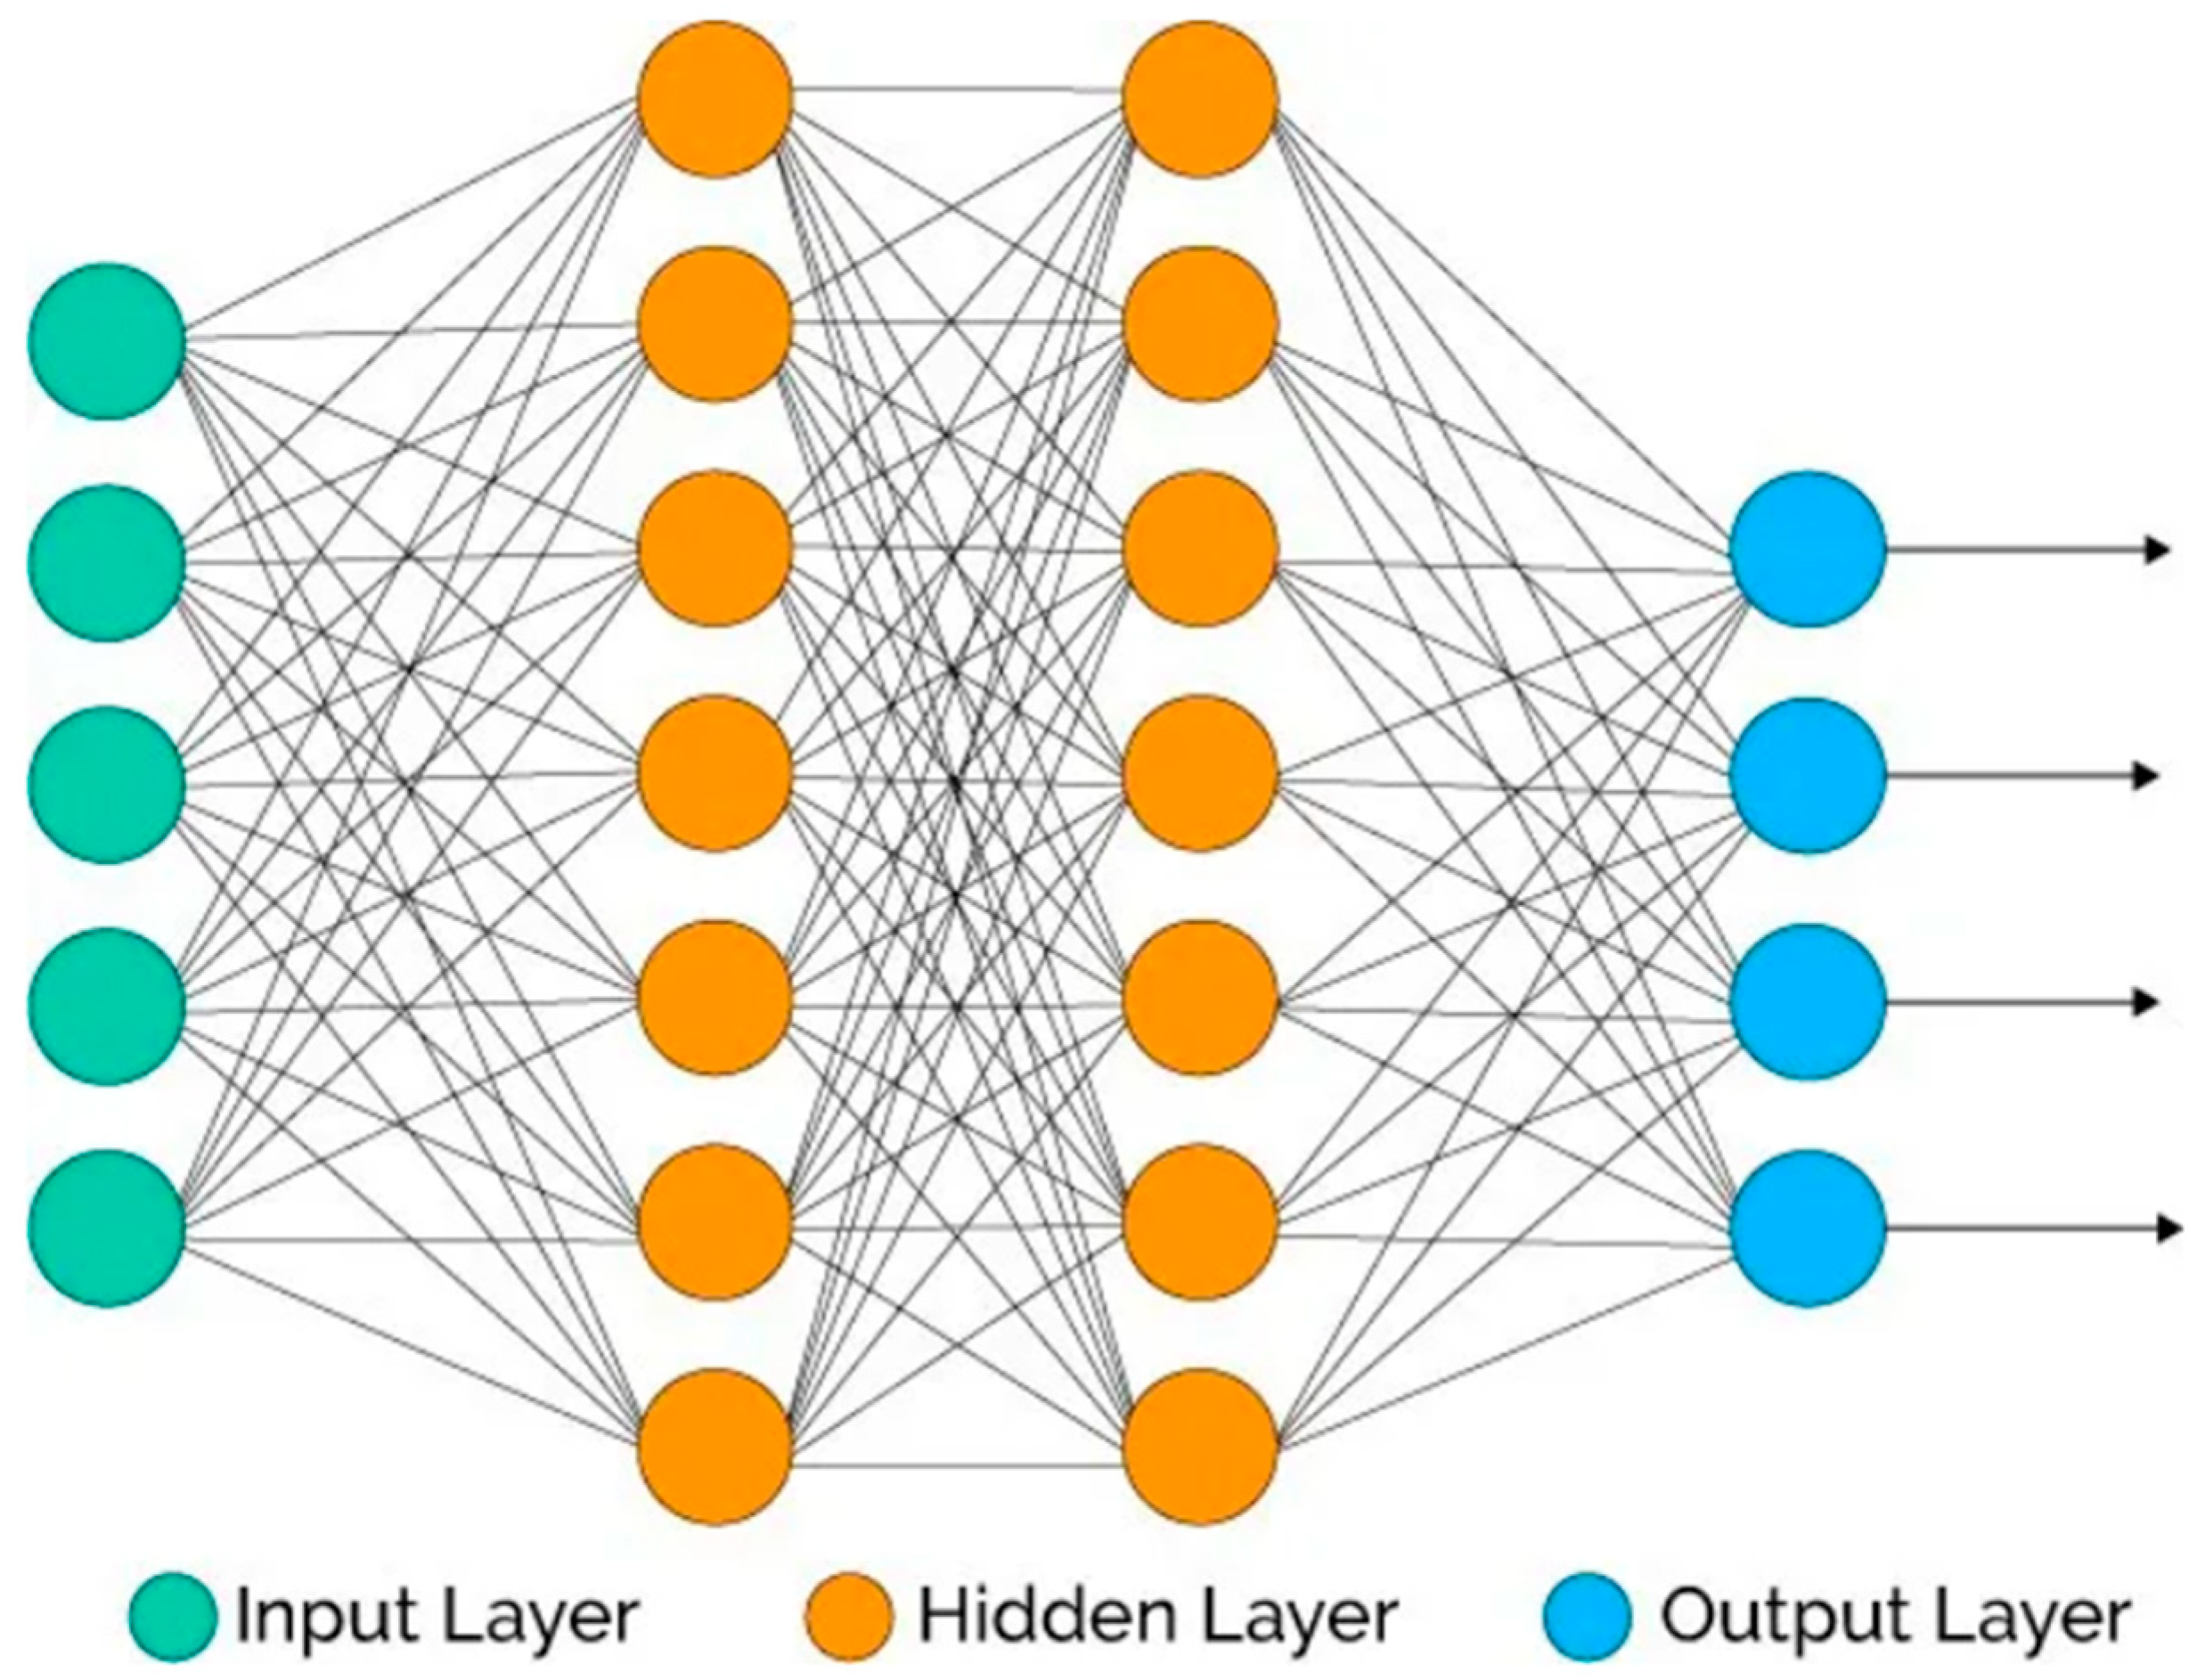
3.3. Disease Prediction

CNN leverages the features extracted by CWT and comprises several layers to progressively learn hierarchical representations useful for classification. The proposed CNN model is based on an input layer, a convolutional layer, a rectified linear unit (ReLU)-based activation layer, a pooling layer, and a fully connected softmax-based layer. The description of each of the defined layers is as follows.
  • Input Layer:
This layer is responsible for input to the network data that are ECG features that have been extracted via CWT. This layer takes the obtained scalogram as input and passes it to the next layer. The formation of the input is as follows: If E(t) represents a segment of the scalogram with N wavelet coefficients, then the input layer takes Ń nodes, each representing a coefficient.
  • Convolutional Layer
This layer is responsible for the detection of local patterns from a scalogram, such as R-peaks, Q-waves, S-waves, and wavelet energy from the ECG signal. Each neuron in this layer is connected to a local region in the input data and convolves a small filter (kernel) across the input data to extract features like edges and textures.
For a given input X and filter K, the convolution operation is given by:
C(i,j)=∑m∑nX(m,n)⋅K(i − m,j − n)
where the sum is computed over m and n within the receptive field.
  • Activation Layer Using ReLU
The ReLU-based activation layer introduces a non-linearity that enables the network to learn complex patterns. However, in this work, the ReLU activation function is applied element-wise such that, for a given input Z, ReLU is defined as:
A = max(0,Z)
where A represents the activated feature that is passed on to the next layer.
  • Pooling Layer
The pooling layer reduces spatial dimensions such as the width and height of the input volume, reducing computational complexity and minimizing overfitting. In this work, max-pooling, which takes the maximum value from a set of values extracted from the input feature map, is applied to perform spatial dimensionality reduction. In this work, max-pooling with a 2 × 2 filter and stride 2 is applied for input matrix M, such that:
P(i,j) = max(M2i:2i+1,2j:2j+1)
where P represents the pooled feature map.
  • Fully Connected (FC) Layer Using Softmax
To perform a prediction based on the input features, a softmax-based FC layer is applied. In this layer, all of the neurons are fully connected to all activations in the previous layer, as seen in the traditional neural networks shown in Figure 2. The final FC layer utilizes a softmax function for the final prediction. If Z represents the input to the softmax layer and Zi represents the ith element of Z, then the softmax function S(Z) is defined as:
S Z i = e z i e z i
where S(Z)i is the output of the softmax function, representing the probability of the input belonging to the i-th class. The result produced by the last fully connected layer is forwarded to an activation function that predicts the disease and no-disease classes.

4. Experimental Results

This section presents the evaluation and experimental outcomes of the proposed hybrid model designed for predicting heart disease. The section encompasses a description of the dataset, details of the performance metrics used for comparison, an overview of the baseline methods, and the final results.

4.1. Dataset

Data collection is an essential phase for a research study. The purpose of data collecting is to obtain precise and trustworthy data that can be employed to construct prediction models for heart disease. Table 1 shows the description of the dataset, in the first of which was obtained from Kaggle. This dataset comprises heartbeat signal collections sourced from two renowned datasets in heartbeat classification: the MIT-BIH Arrhythmia Dataset and the PTB Diagnostic ECG Database. Both collections offer a substantial number of samples suitable for deep neural network training. The signals represent electrocardiogram (ECG) patterns of standard heartbeats and those impacted by various arrhythmias and myocardial infarction. Each signal is pre-processed and segmented, with every segment representing a single heartbeat. The other dataset is an ECG image dataset for cardiac patients, curated by the Ch. Pervaiz Elahi Institute of Cardiology in Multan, Pakistan, which was established to assist the scientific community with cardiovascular disease research. This dataset is composed of four files, of which 2880 records were about myocardial infarction patients, 2796 records were about patients that had abnormal heartbeat, 2064 records were about abnormal patients, and 3408 records were about normal persons.

4.2. Performance Matrices

The following performance matrices were used to measure the performance of the proposed method.
  • The confusion matrix: A 2 × 2 table that contained four outputs from the implemented classifier consisted of the following elements: (1) true positive (tp), which shows that the predicted results indicate “yes” and that subjects have heart disease; (2) true negative (tn), which shows that the predicted results indicate “no” and that subjects do not have heart disease; (3) false positive (fp), which shows that the predicted results indicate “yes” and that subjects do not actually have heart disease; and (4) false negative (fn), which shows that the predicted results indicate “no” and that subjects have heart disease. Other measures like model accuracy, model specificity, model sensitivity, model precision, and f-measure are calculated using this.
  • Accuracy: this is the ratio of the number of truly classified samples to the total number of samples.
A c c u r a c y = t p + t n t p + t n + f p + f n
  • Specificity (P): This is the fraction of the total number of true positive samples predicted as true to the total number of sample predicted as true.
S p e c i f i c i t y = t p t p + f p
  • Sensitivity (S): This is the fraction of the number of correctly classified positive samples to the total number of positive examples.
S e n s i t i v i t y = t p t p + f n
  • F-measure (F): This is used for algorithm comparison, and it consists of the harmonic mean of sensitivity and precision.
f m e a s u r e = 2 P S P + S
  • The ROC curve: The ROC curve is a graphical representation that illustrates the discriminatory ability of a binary classification model by plotting the true positive rate (sensitivity) against the false positive rate (1-specificity) across various probability thresholds. This visualization allows for an in-depth assessment of the model’s capability to distinguish between positive and negative cases.
  • Matthews correlation coefficient (MCC): MCC is a single-value classification metric that helps to summarize a confusion matrix or an error matrix.
MCC = T N × T P F N × F P ( T P + F P ) ( T P + F N ) ( T N + F P ) ( T N + F N ) )

4.3. Baseline Method

The following baseline methods were used to compare the performance and efficiency of the proposed method.
Hussain et al. [29]: They significantly addressed congestive heart failure through a robust method. In addition to this, their work also focused on data balancing, multimodal feature extraction, and oversampling strategies to improve heart condition detection.
Iqbal et al. [23]: This work presented an optimized machine learning algorithm with an artificial bee colony technique. The utilization of optimization techniques offered insights into improving algorithmic performance.
Reddy et al. [31]: They presented a new prediction system for coronary heart disease risk using principal component analysis and hyper-parameter optimization.
Machine learning models [34,35,36]: All of these models encompass SVM, AdaBoost, and decision tree-based models for heart disease prediction.

4.4. Results

Figure 3 shows a demonstration of the proposed model on different datasets in terms of accuracy, specificity, sensitivity, the F-measure, and MCC. Specifically, on the MIT-BIH Arrhythmia Dataset, it showcased impressive results, with a specificity of 90.21%, a sensitivity of 89.25%, and an accuracy of 91.25%. Similarly, for the PTB diagnostic dataset, the proposed model achieved even higher scores, with a specificity of 88.89%, a sensitivity of 88.02%, and an accuracy of 89.14%, illustrating its effectiveness. Additionally, the proposed technique performed well on the Ch. Pervaiz Elahi Institute of Cardiology dataset, securing a specificity of 89.45%, a sensitivity of 89.13%, and an accuracy of 90.47%. These outcomes collectively indicate the superior and efficient performance of the proposed approach in heart disease prediction across various metrics.
The efficiency of the proposed model was further assessed through the true positive rate (TPR) and false positive rate (FPR) using ROC curves. For each dataset, the TPR and FPR values are illustrated in Figure 4. The ROC curve encompassed an area of 0.81 for the MIT-BIH Arrhythmia Dataset, 0.83 for the PTB Diagnostic ECG Dataset, and 0.72 for the Ch. Pervaiz Elahi Institute of Cardiology dataset. Two of the three datasets exhibited ROC curves covering more than 80% of the area, whereas the third covered more than 72%, reflecting high precision and underscoring the effectiveness of the proposed approach.
Table 2 presents a comparison between the effectiveness of WT-CNN and a baseline methodology, employing multiple evaluative metrics such as specificity, sensitivity, the F-score, and accuracy. The proposed framework exhibited remarkable precision, registering at 97.29%, which indicates that the ratio of true positive occurrences to all instances was anticipated to be positive. It also demonstrated a specificity rate of 95.68%, symbolizing the fraction of accurately identified positive events out of all actual positive instances. The model’s proficiency in accurately identifying positive events was holistically evaluated with an F-score of 95.99%, a metric amalgamating specificity and sensitivity. In conclusion, the proposed method’s accuracy stood at 97.29%, reflecting the percentage of accurately identified examples (encompassing both positive and negative) out of all instances examined.
Finally, as depicted in Figure 5, the suggested method was juxtaposed with all previously revealed traditional benchmark strategies [36,37,38] across diverse datasets to evaluate its accuracy. The findings indicate that the proposed technique exhibited commendable performance in every aspect when contrasted with various existing approaches.

5. Conclusions

This study introduces a new model, WT-CNN, which combines the power of continuous wavelet transformation and a convolutional neural network to improve the prediction and diagnosis of heart disease using ECG data. WT-CNN not only demonstrated an exemplary predictive accuracy of 97.2% but also showcased a substantial improvement in classification accuracy in comparison with alternative approaches. The experimental outcomes underscore the efficacy of the WT-CNN model, thereby asserting its applicability as a viable tool to be utilized by healthcare professionals. In the future, the proposed work can be further enhanced by utilizing more advanced models like deep learning. Another possible direction could be the generalization of this model for the diagnosis of other fatal diseases.

Author Contributions

Conceptualization, F.M.; methodology, S.A.-A.; software, F.M.; formal analysis, F.M.; writing—original draft, F.M.; Writing—review & editing, S.A.-A. All authors have read and agreed to the published version of the manuscript.

Funding

This research was funded by Deputyship for Research & Innovation, Ministry of Education in Saudi Arabia (IFKSUOR-3-404-2).

Data Availability Statement

Data is contained within the article.

Acknowledgments

The authors extend their appreciation to the Deputyship for Research & Innovation, Ministry of Education in Saudi Arabia for funding this research (IFKSUOR-3-404-2).

Conflicts of Interest

The authors declare no conflict of interest.

References

  1. Fekih, R.T.; Atri, P.M. Electrocardiogram heartbeat classification based on a deep convolutional neural network and focal loss. Comput. Biol. Med. 2020, 123, 103866. [Google Scholar]
  2. Chao, C.; Peiliang, Z.; Min, Z.; Qu, Y.; Bo, J. Constrained transformer network for ecg signal processing and arrhythmia classification. BMC Med. Inf. Decis. Mak. 2021, 21, 184. [Google Scholar] [CrossRef]
  3. Jabbar, M.A.; Deekshatulu, B.L.; Chandra, P. Intelligent heart disease prediction system using random forest and evolutionary approach. J. Netw. Innov. Comput. 2016, 4, 175–184. [Google Scholar]
  4. Jabbar, M.A.; Deekshatulu, B.L.; Chandra, P. Computational intelligence technique for early diagnosis of heart disease. In Proceedings of the 2015 IEEE International Conference on Engineering and Technology (ICETECH), Coimbatore, India, 20–20 March 2015; IEEE: Piscataway, NJ, USA, 2015; pp. 1–6. [Google Scholar]
  5. Lichman, M. UCI Machine Learning Repository. 2013. Available online: https://archive.ics.uci.edu/ (accessed on 11 August 2023).
  6. John, M.; John, M.; Flora, M.; Daphne, K. Classification techniques for cardio-vascular diseases using supervised machine learning. Med. Arch. 2020, 74, 39. [Google Scholar]
  7. Shah, S.M.S.; Shah, F.A.; Hussain, S.A.; Batool, S. Support vector machines-based heart disease diagnosis using feature subset, wrapping selection, and extraction methods. Comput. Electr. Eng. 2020, 84, 106628. [Google Scholar] [CrossRef]
  8. Sharmila, R.; Chellammal, S. A conceptual method to enhance the prediction of heart diseases using the data and Engineering. Int. J. Comput. Sci. Eng. 2018, 6, 21–25. [Google Scholar]
  9. Beyene, C.; Kamat, P. Survey on prediction and analysis the occurrence of heart disease using data mining techniques. Int. J. Pure Appl. Math. 2018, 118, 165–174. [Google Scholar]
  10. Ahsan, M.M.; Siddique, Z. Machine learning-based heart disease diagnosis: A systematic literature review. Artif. Intell. Med. 2022, 128, 102289. [Google Scholar] [CrossRef] [PubMed]
  11. Ramesh, T.R.; Lilhore, U.K.; Poongodi, M.; Simaiya, S.; Kaur, A.; Hamdi, M. Predictive analysis of heart diseases with machine learning approaches. Malays. J. Comput. Sci. 2022, 1, 132–148. [Google Scholar]
  12. Yahaya, L.; Oye, N.D.; Garba, E.J. A comprehensive review on heart disease prediction using data mining and machine learning techniques. Am. J. Artif. Intell. 2020, 4, 20–29. [Google Scholar] [CrossRef]
  13. Ali, S.; Heasoo, H. A robust deep convolutional neural network withbatch-weighted loss for heartbeat classification. Expert Syst. Appl. 2019, 122, 75–84. [Google Scholar]
  14. Aya, A.; Mohamed, B.-E.-D.; James, M.; Jim, B. Early hospital mortality prediction of intensive care unit patients using an ensemble learning approach. Int. J. Med. Inf. 2017, 108, 185–195. [Google Scholar]
  15. Sakr, S.; Elshawi, R.; Ahmed, A.M.; Qureshi, W.T.; Brawner, C.A.; Keteyian, S.J.; Blaha, M.J.; Al-Mallah, M.H. Comparison of machinelearning techniques to predict all-cause mortality using fitness data: The henry fordexercise testing (fit) project. BMC Med. Inform. Decis. Mak. 2017, 17, 174. [Google Scholar] [CrossRef] [PubMed]
  16. Ejaz, A.S.; Mohammed, B.; Ferdous, S.; Mario, S.F.; Girish, D. Machine learning-based prediction of heart failure readmission ordeath: Implications of choosing the right model and the right metrics. ESC Heart Fail. 2019, 6, 428–435. [Google Scholar]
  17. Chaurasia, V.; Pal, S. Data mining approach to detect heart diseases. Int. J. Adv. Comput. Sci. Inf. Technol. (IJACSIT) 2014, 2, 56–66. [Google Scholar]
  18. Islam, M.A.; Jia, S.; Bruce, N.D. How much position information do convolutional neural networks encode? arXiv 2020, arXiv:2001.08248. [Google Scholar]
  19. Dan, G.; Jiang, S.; Bang, A.; Xu, M.; Na, L. Integrating tanbn with cost sensitive classification algorithm for imbalanced data in medical diagnosis. Comput. Ind. Eng. 2020, 140, 106266. [Google Scholar]
  20. Tan, K.C.; Teoh, E.J.; Yu, Q.; Goh, K.C. A hybrid evolutionary algorithm for attribute selection in data mining. Expert Syst. Appl. 2009, 36, 8616–8630. [Google Scholar] [CrossRef]
  21. Dileep, K.M.; Ramana, K.V. Cardiovascular disease prognosis and severity analysis using hybrid heuristic methods. Multimed. Tools Appl. 2021, 80, 7939–7965. [Google Scholar]
  22. Samit, B.; Abeer, A.; Prasad, P.W.C.; Al, A.S.; Hisham, A.O. A novel solution of using deep learning for early prediction cardiac arrestin sepsis patient: Enhanced bidirectional long short-term memory (lstm). Multimed. Tools Appl. 2021, 80, 32639–32664. [Google Scholar]
  23. Iqbal, F.; Raziq, A.; Tirink, C.; Fatih, A.; Yaqoob, M. Using the artificial bee colony technique to optimize machine learning algorithms in estimating the mature weight of camels. Trop. Anim. Health Prod. 2023, 55, 86. [Google Scholar] [CrossRef]
  24. Shivam, D.; Rahul, K. Early detection of heart diseases using a low-cost compact ecg sensor. Multimed. Tools Appl. 2021, 80, 32615–32637. [Google Scholar]
  25. Devansh, S.; Samir, P.; Kumar, B.S. Heart disease prediction using machine learning techniques. SN Comput. Sci. 2020, 1, 345. [Google Scholar]
  26. Lee, X.Y.; Kumar, A.; Vidyaratne, L.; Rao, A.R.; Farahat, A.; Gupta, C. An ensemble of convolution-based methods for fault detection using vibration signals. arXiv 2023, arXiv:2305.05532. [Google Scholar]
  27. Kemal, F. Similarity-based attribute weighting methods via clusteringalgorithms in the classification of imbalanced medical datasets. Neural Comput. Appl. 2018, 30, 987–1013. [Google Scholar]
  28. Alberto, F.; Salvador, G.; Francisco, H. Addressing theclassification with imbalanced data: Open problems and new challenges on class distribution. In International Conference on Hybrid Artificial Intelligence System; Springer: Berlin/Heidelberg, Germany, 2011; pp. 1–10. [Google Scholar]
  29. Houda, B.; Ali, I.; Fernandez-Aleman, J.L. Data preprocessing for heart disease classification: A systematic literature review. Comput. Methods Programs Biomed. 2020, 195, 105635. [Google Scholar]
  30. Adyasha, R.; Debahuti, M.; Ganapati, P.; Chandra, S.S. An exhaustive review of machine and deep learning based diagnosis of heart diseases. Multimed. Tools Appl. 2021, 81, 36069–36127. [Google Scholar]
  31. Reddy, K.V.V.; Elamvazuthi, I.; Aziz, A.A.; Paramasivam, S.; Chua, H.N.; Pranavanand, S. An Efficient Prediction System for Coronary Heart Disease Risk Using Selected Principal Components and Hyperparameter Optimization. Appl. Sci. 2023, 13, 118. [Google Scholar] [CrossRef]
  32. Simran, V.; Abhishek, G. Effective prediction of heart disease using datamining and machine learning: A review. In Proceedings of the 2021 International Conference on Artificial Intelligence and Smart Systems (ICAIS), Coimbatore, India, 25–27 March 2021; IEEE: Piscataway, NJ, USA, 2021; pp. 249–253. [Google Scholar]
  33. Hussain, L.; Lone, K.J.; Awan, I.A.; Abbasi, A.A.; Pirzada, J.U.R. Detecting congestive heart failure by extracting multimodal features with synthetic minority oversampling technique (SMOTE) for imbalanced data using robust machine learning techniques. Waves Random Complex Media 2022, 32, 1079–1102. [Google Scholar] [CrossRef]
  34. Anggoro, D.A.; Kurnia, N.D. Comparison of accuracy level of support vector machine (SVM) and K-nearest neighbors (KNN) algorithms in predicting heart disease. Int. J. 2020, 8, 1689–1694. [Google Scholar] [CrossRef]
  35. Kavitha, M.; Gnaneswar, G.; Dinesh, R.; Sai, Y.R.; Suraj, R.S. Heart disease prediction using hybrid machine learning model. In Proceedings of the 2021 6th International Conference on Inventive Computation Technologies (ICICT), Coimbatore, India, 20–22 January 2021; IEEE: Piscataway, NJ, USA, 2021; pp. 1329–1333. [Google Scholar]
  36. Mahesh, T.R.; Dhilip Kumar, V.; Vinoth Kumar, V.; Asghar, J.; Geman, O.; Arulkumaran, G.; Arun, N. AdaBoost ensemble methods using K-fold cross validation for survivability with the early detection of heart disease. Comput. Intell. Neurosci. 2022, 2022, 9005278. [Google Scholar] [CrossRef] [PubMed]
  37. Nancy, A.A.; Ravindran, D.; Raj Vincent, P.M.D.; Srinivasan, K.; Gutierrez Reina, D. IoT-Cloud-Based Smart Healthcare Monitoring System for Heart Disease Prediction via Deep Learning. Electronics 2022, 11, 2292. [Google Scholar] [CrossRef]
  38. Ahmad, A.A.; Polat, H. Prediction of Heart Disease Based on Machine Learning Using Jellyfish Optimization Algorithm. Diagnostics 2023, 13, 2392. [Google Scholar] [CrossRef] [PubMed]
Figure 1. Proposed WT-CNN model for heart disease prediction.
Mathematics 11 04681 g001
Figure 2. The workflow of a neural network for heart disease [12].
Mathematics 11 04681 g002
Figure 3. Experimental results in terms of sensitivity, specificity, the F-measure, accuracy, and MCC; (a) experimental results of the MIT-BIH Arrhythmia Dataset; (b) experimental results of the PTB Diagnostic; (c) experimental results of the Ch. Pervaiz Elahi Institute of Cardiology dataset, (d) Matthews correlation coefficient of the MIT-BIH Arrhythmia, PTB Diagnostic, and Ch. Pervaiz Elahi Institute of Cardiology datasets.
Mathematics 11 04681 g003aMathematics 11 04681 g003b
Figure 4. The ROC curve of the WT-CNN on the mentioned dataset: (a) MIT-BIH Arrhythmia, (b) PTB Diagnostic, (c) Ch. Pervaiz Elahi Institute of Cardiology.
Mathematics 11 04681 g004
Figure 5. Comparison of WT-CNN with machine learning algorithms [36,37,38] on all datasets.
Mathematics 11 04681 g005
Table 1. Dataset description.
S. No.NameNo. of RecordsWeblink
1MIT-BIH Arrhythmia Dataset22,275https://www.physionet.org/content/mitdb/1.0.0/ (accessed on 5 July 2023)
2PTB Diagnostic ECG Database21,445https://www.physionet.org/content/ptbdb/1.0.0/ (accessed on 10 August 2023)
3Ch. Pervaiz Elahi Institute of Cardiology11,148https://data.mendeley.com/datasets/gwbz3fsgp8/2 (accessed on 22 July 2023)
Table 2. Comparative analysis of WT-CNN with baseline [23,29,31].
AccuracySpecificitySensitivityF-Score
Iqbal et al. [23]85.2584.8583.5283.69
Hussain et al. [29]86.2585.8584.52%84.69
Reddy et al. [31]88.1486.3686.0286.79
CNN84.6584.0283.6283.36
WT-CNN97.0295.6894.895.99
Disclaimer/Publisher’s Note: The statements, opinions and data contained in all publications are solely those of the individual author(s) and contributor(s) and not of MDPI and/or the editor(s). MDPI and/or the editor(s) disclaim responsibility for any injury to people or property resulting from any ideas, methods, instructions or products referred to in the content.

