Article

Dynamic Optimization Method of Knowledge Graph Entity Relations for Smart Maintenance of Cantilever Roadheaders

1
School of Mechanical Engineering, Xi’an University of Science and Technology, Xi’an 710054, China
2
Shaanxi Key Laboratory of Mine Electromechanical Equipment Intelligent Detection and Control, Xi’an 710054, China
3
Xi’an Coal Mining Machinery Co., Ltd., Xi’an 710032, China
4
Institute of Smart Manufacturing Systems, Chang’an University, Xi’an 710054, China
*
Author to whom correspondence should be addressed.
Mathematics 2023, 11(23), 4833; https://doi.org/10.3390/math11234833
Submission received: 18 October 2023 / Revised: 22 November 2023 / Accepted: 27 November 2023 / Published: 30 November 2023
(This article belongs to the Special Issue Mathematical Techniques and New ITs for Smart Manufacturing Systems)

Abstract

:
The fault maintenance scenario in coal-mine equipment intelligence is composed of videos, images, signals, and repair process records. Text data are not the primary data that reflect the fault phenomenon, but rather the secondary processing based on operation experience. Focusing on the difficulty of extracting fault knowledge from the limited textual maintenance process records, a forward static full-connected topology network modeling method based on domain knowledge from four dimensions of physical structure, internal association, condition monitoring, and fault maintenance, is proposed to increase the efficiency of constructing a fault-maintenance knowledge graph. Accurately identifying the intrinsic correlation between the equipment anomalies and the faults’ causes through only domain knowledge and loosely coupled data is difficult. Based on the static full-connected knowledge graph of the cantilever roadheader, the information entropy and density-based DBSCAN clustering algorithm is used to process and analyze many condition-monitoring historical datasets to optimize the entity relationships between the fault phenomena and causes. The improved DBSCAN algorithm consists of three stages: firstly, extracting entity data related to fault information from the static fully connected graph; secondly, calculating the information entropy based on the real dataset describing the fault information and the historical operating condition, respectively; and thirdly, comparing the entropy values of the entities and analyzing the intrinsic relationship between the fault phenomenon, the operating condition data, and the fault causes. Based on the static full-connected topology storage in the Neo4j database, the information entropy and density-based DBSCAN algorithm is computed by using Python to identify the relationship weights and dynamically display optimized knowledge graph topology. Finally, an example of EBZ200-type cantilever roadheader for smart maintenance is studied to analyze and evaluate the forward and four-mainlines knowledge graph modeling method and the dynamic entity relations optimization method for static full-connected knowledge graph.

1. Introduction

Coal mine face intelligence is the core technology for achieving high-quality developments of the coal industry, and mining equipment intelligence is the key to the standard coal mine face intelligence system [1]. The cantilever roadheader is a heavy-duty complex electromechanical system, which is the primary equipment used in coal mine excavation [2,3]. It works safely and efficiently, and directly impacts the mining and production efficiency. In the face of the complexity of electromechanical equipment, excavation work continues to improve, and the repair and maintenance requirements of excavation equipment are also constantly improving. Furthermore, as tunneling intelligence develops, the condition-monitoring and fault-diagnosis technology of cantilever roadheaders is also progressing [4].
The cantilever roadheader consists of a mechanical system, a hydraulic system, and an electrical system. The fault diagnosis of mechanical systems focuses on gear and bearing [5,6] faults in the cutting transmission system, while hydraulic system faults mainly revolve around pressure fluctuations, unstable cylinder action, high oil temperature, and other faults. The occurrence of these fault phenomena is caused by a single factor or the coupling of multiple factors [7,8]. In recent years, an increasing number of methods have been oriented to the fault cause analysis of cantilever roadheaders, including diagnosis based on the improved decision tree algorithm in data mining technology [9], a fault diagnosis reasoning method based on the PSO-BPNN (Particle Swarm Optimization-Back Propagation Neural Network) [10], and a composite network topology diagnostic method based on the of PSO-BPNN, fault tree and fault Petri nets [11].
From the data perspective, practical industrial equipment accumulates a large amount of data, using data mining or machine learning technology to extract information and mine data, and then completing fault diagnosis, intelligent maintenance, and other work [12,13]. For research on roadheader health management, Liu & Liu [14] used a large amount of monitoring data to analyze, process, monitor, diagnose, and maintain the roadheader and dynamically grasp its operating conditions, thus enriching the fault diagnosis path. Due to the complex structure of the roadheader, each component is interrelated with its fault maintenance and involves many static and dynamic data. Correlations exist between the data, such as equipment components and various fault maintenance methods, which are closely linked to each other. Identifying a variety of faults is difficult when considering knowledge about the potential relationship between these faults [15,16,17,18,19].
The knowledge graph is a semantic network that represents relationships between entities and describes the process of forming a graph from data or knowledge through modeling. Knowledge graphs are represented through triples. Entities represent real-world objects or abstract concepts, relationships represent connections between entities, entities have labels and attributes, relationships have types and attributes, and so on [20,21]. Equipment in production and manufacturing accumulates a large amount of knowledge and data [22]. As troubleshooting equipment failure becomes more difficult, applying knowledge graph technology in the equipment manufacturing and fault maintenance field can improve the efficiency of fault maintenance through the construction of a fault maintenance knowledge graph and enable rapid decision-making for technical engineers [23,24,25,26,27,28]. In recent years, many scholars have applied knowledge graph technology to the coal mining field. Cai et al. [29] introduced knowledge graph technology to provide support for large-scale fault data analysis, management, and application in response to the lack of systematic management and application of the historical fault data of comprehensive mining equipment. Qiu et al. [30] used mine construction data with knowledge mapping technology to comprehensively describe the process of the construction of the mapping of unstructured data, using knowledge mapping technology to analyze and explore the use of knowledge mapping technology in the mine construction field. Li et al. [31] introduced knowledge mapping technology to improve the efficiency of coal mine electromechanical accident processing, combined machine learning and rule templates to extract entities, relationships, and attributes, and deposited these extractions into the mapping database using Python + Neo4j technology to construct and update the mapping. Cao et al. [32] defined the concepts, relations, and attributes of coal mine equipment maintenance, performed ontology modeling, and used Neo4j to store the knowledge for forming a coal mine equipment maintenance knowledge graph, which provides strong support for coal mine equipment intelligence. The above research results utilize discrete data and experience in the coal mining field to construct and partially explore the knowledge graph. However, many entities and relationships are present in the graph. The topology structure of these knowledge graph models is static and confused, thus making the entire knowledge graph more complex and removing the ability to precisely query the entity relationships between fault phenomenon and causes.
Cantilever roadheaders generate large amounts of data during operation, especially real data describing fault information, which is particularly important. Various methods for fault recognition, including supervised classification methods and unsupervised clustering methods, exist [33]. Among these methods, clustering is a widely used technique in data mining and pattern recognition applications. Clustering divides the dataset into clusters, with the highest data similarity within the clusters and the lowest similarity between different clusters [34]. Methods of clustering include the division method, hierarchical method, density method, and graph theory method. Density-based clustering algorithms can recognize clusters of arbitrary shapes, irregular distributions, noise, and outliers, and they are relatively robust to parameter selection [35,36].
In this paper, a dynamic optimization method of entity relations in the knowledge graph of a cantilever roadheader is proposed. This method uses the historical dataset of condition-monitoring, processes the data through a clustering method based on information entropy and density in data mining, and then dynamically optimizes the entity relations based on the entropy value and clustering results combined with the simplified network topology of the knowledge graph. First, the static full-connected knowledge graph model of cantilever roadheaders is abstracted from four dimensions of physical structure, internal association, condition monitoring, and fault maintenance by utilizing graph theory and complex network theory. The Neo4j database is used to construct the static full-connected knowledge graph for cantilever roadheader. Second, the information entropy and density-based DBSCAN (Density-Based Spatial Clustering of Applications with Noise) clustering algorithm is used to process and analyze many condition-monitoring historical datasets to optimize the network topology relationship. Based on the static full-connected topology storage in the Neo4j database, the information entropy and density-based DBSCAN algorithm is computed by using Python to identify the relationship weights, and dynamically display optimized knowledge graph topology. Finally, an example of an EBZ200-type cantilever roadheader for smart maintenance is studied to analyze and evaluate the forward and four-mainlines knowledge graph modeling method and the dynamic entity relations optimization method for a static full-connected knowledge graph.
The rest of this paper is arranged as follows. The logic framework and the construction process of fault maintenance knowledge graph models are put forward in Section 2. In Section 3, the static full-connected knowledge graph model is established. In Section 4, the knowledge graph entity relations of the cantilever roadheaders is optimized based on information entropy and density-based DBSCAN algorithm. Section 5 provides a case study to demonstrate the availability of the above proposed methods. Finally, the discussions and conclusions of this paper are presented in Section 6 and Section 7, respectively.

2. Smart Maintenance Knowledge Graph Model for Fault Cause Analysis

As complex electromechanical equipment, cantilever roadheaders generate large amounts of discrete knowledge and loosely coupled data during work, which accumulates experience for the fault maintenance of the equipment, utilizes a large amount of fault knowledge to mine the internal potential correlation, forms a fault logic chain, and further precisely analyzes the faults to simplify the internal correlation by using the historical monitoring data of cantilever roadheaders. Using graph theory and topological structure knowledge to abstract the fault information of each dimension for modeling, a static full-connected cantilever roadheader fault maintenance knowledge graph is constructed, and a local clustering model is constructed based on the local network using the historical data of condition monitoring. The entity-relationship of the knowledge graph is then optimized to dynamically update the map.
Figure 1 depicts the cantilever roadheader fault maintenance knowledge graph construction process. The specific construction steps are as follows:
(1)
Data collection
The data primarily includes information such as equipment information, technical documents, expert experience knowledge, literature, and historical data. Organize and summarize all the information to clearly delineate the scope of information involved, and customize the process and strategy for constructing the knowledge graph of cantilever roadheader fault maintenance.
(2)
Identification of a core set of concepts
Clarify the domain scope and construction requirements of fault information, abstract the core concept set, define the core concept type, normalize the terminology to express the fault knowledge of the core concept class, and define the entity type, attribute, and relationship type.
(3)
Fault maintenance knowledge graph modeling
Using the theory of graph theory and topological structure knowledge to model the knowledge graph for each part of the core set of concepts, define and extract the entities and attributes of each part of the fault information and their relationships between the entities, respectively, to form the topology subnetwork model of various components. Merge each part of the entity-relationship subnetwork using entity disambiguation and coreferential disambiguation techniques to form a static, fully connected knowledge graph of faults of cantilever roadheaders.
(4)
Dynamic optimization of graphical entity relationships
On the basis of the static full-connected knowledge graph, traverse the network using filtering conditions to find the local subnetwork that needs to be optimized. Start from any node in the subnetwork, find all of the data nodes associated with it, extract the local dataset, and calculate the information entropy of the fault information and associated data nodes using the clustering algorithm to construct the local data model. Repeat the above steps until all the data nodes have been traversed, compare the entropy value and clustering results with the associated nodes in the local graph to simplify the entity relationship in the static graph and to weighting, and finally complete the dynamic optimization of graph entity relations.
(5)
Knowledge graph visualization display
Based on the graphical database Neo4j, construct the static cantilever roadheader fault maintenance knowledge graph. Based on the clustering results and the entropy value, use the improved DBSCAN algorithm developed by Python to connect Neo4j to add weight attributes to the relationships and visually display the results before and after the optimization.
Figure 1. Logic framework of fault maintenance knowledge graph for cantilever roadheader.
Mathematics 11 04833 g001

3. Modeling the Static Full-Connected Fault Maintenance Knowledge Graph of Cantilever Roadheader
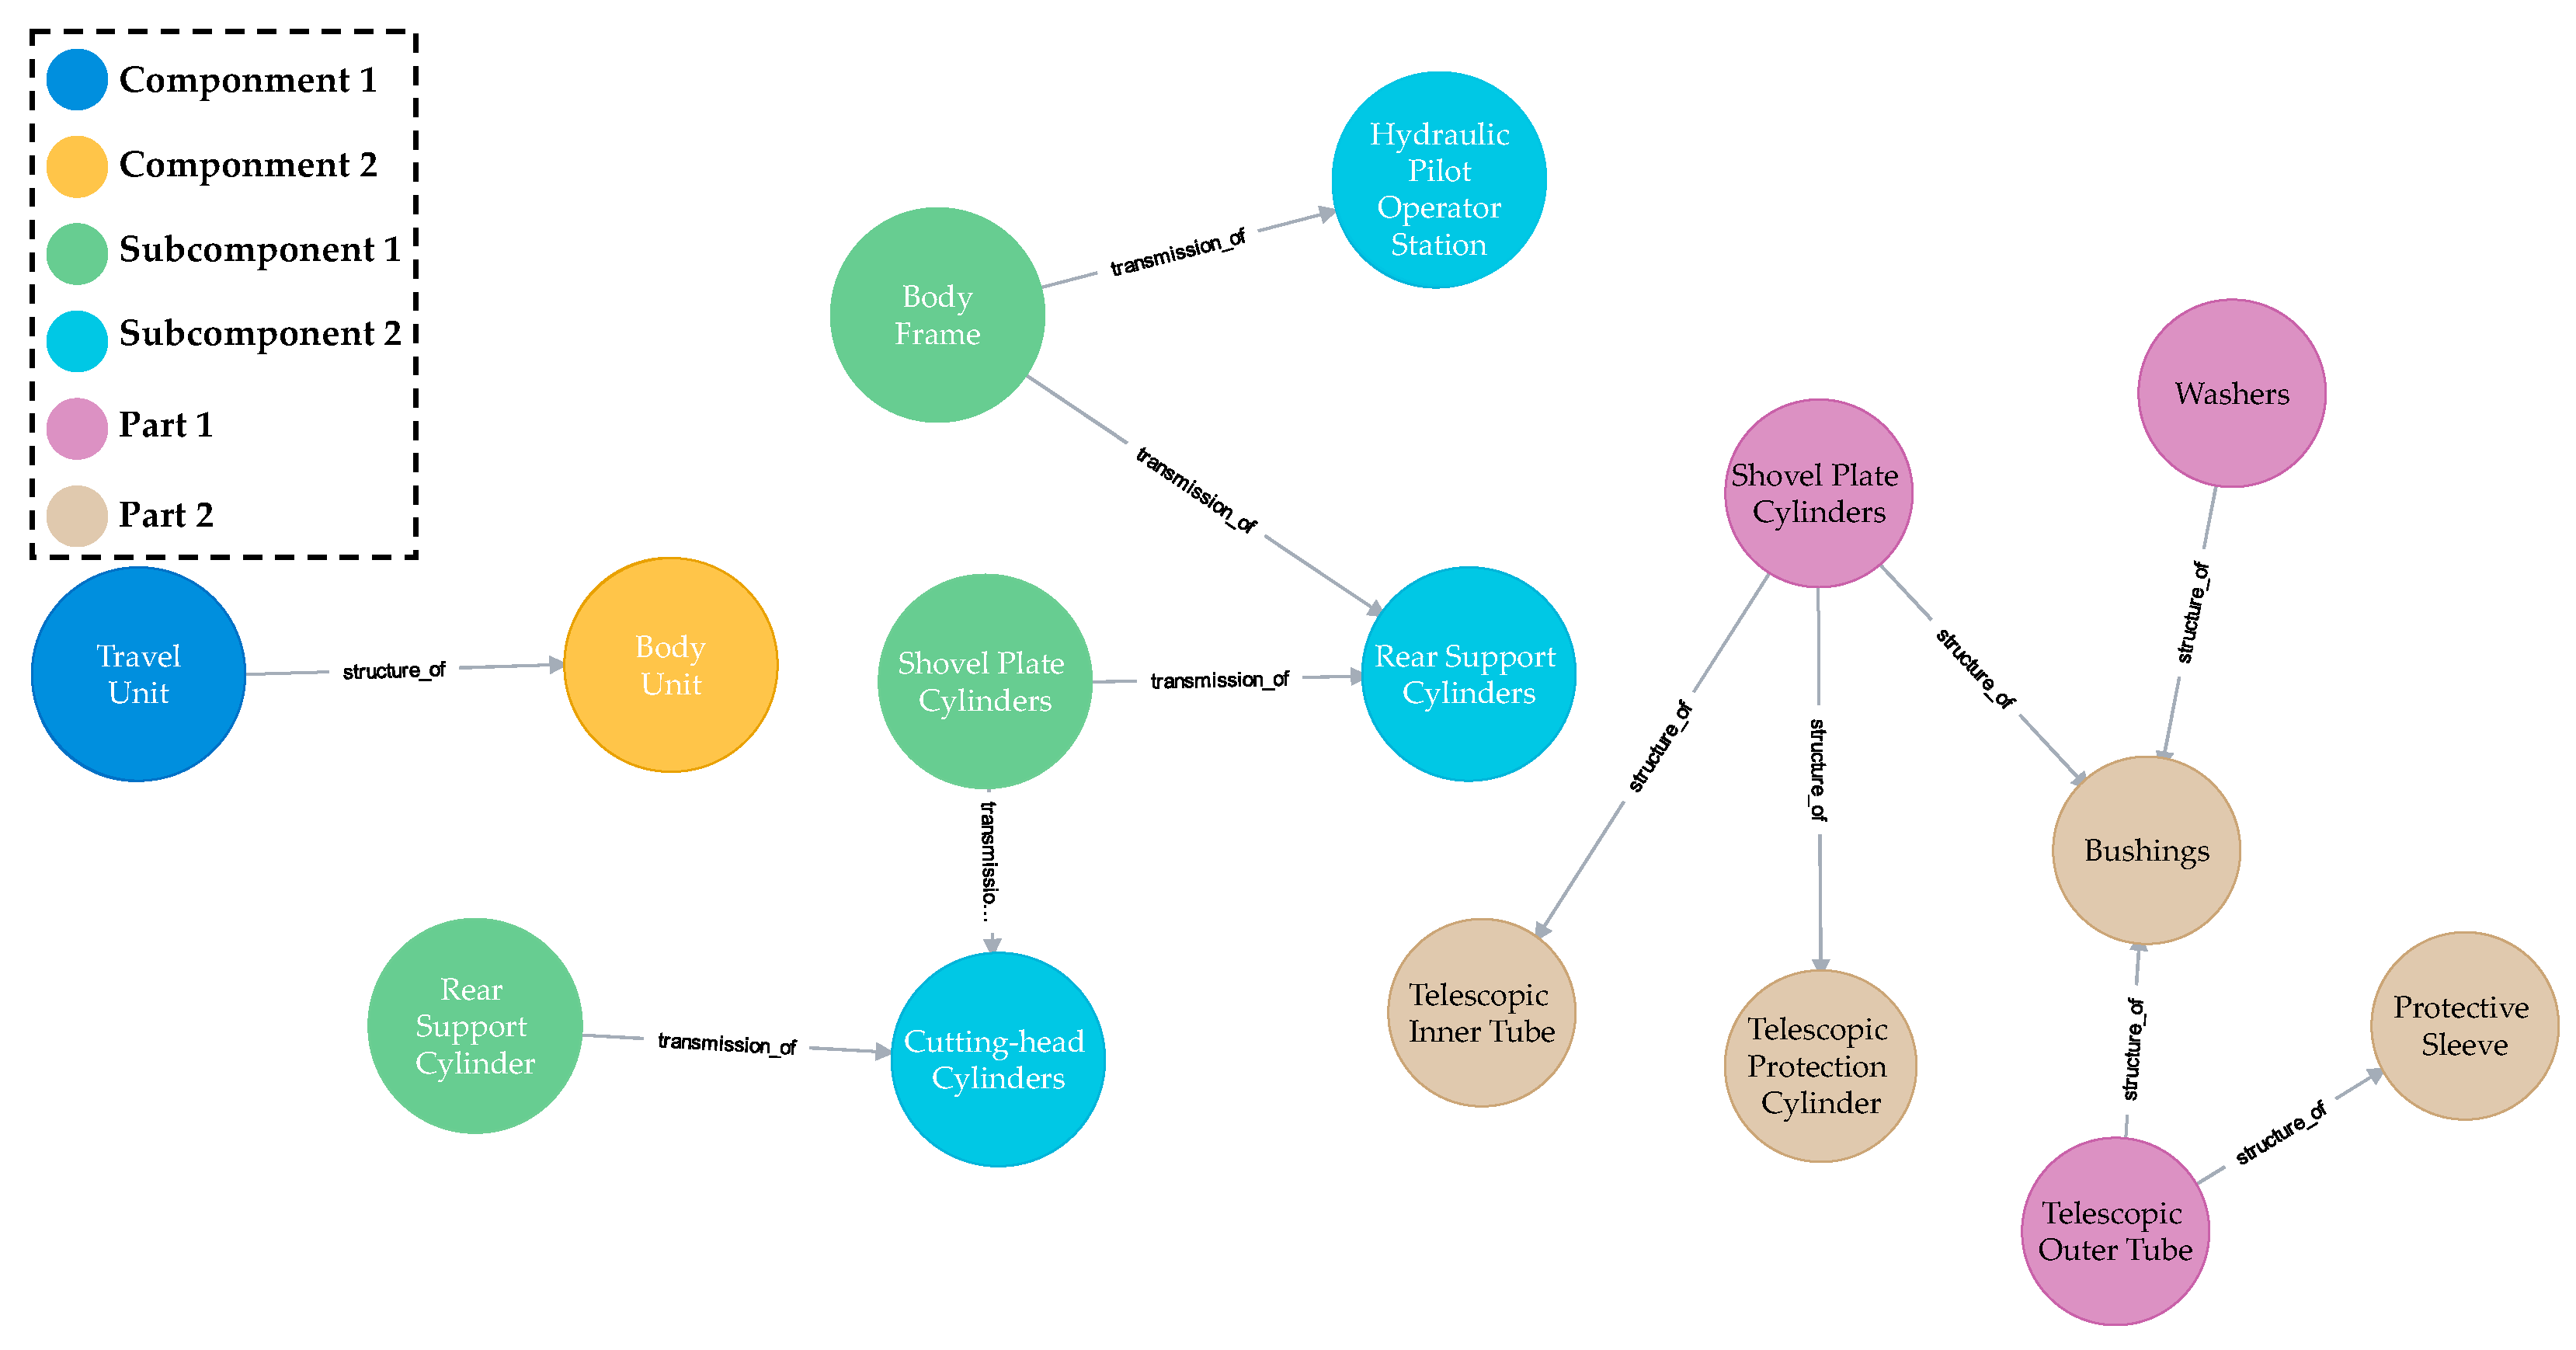
Graph theory is used to represent and store entities, attributes, and relations as directed graphs and combine them with topology to construct a static model of knowledge graphs for fault maintenance of cantilever roadheaders, where abstract entities are “points” that are independent of the size and shape of the entity, abstract lines connecting the entities as “edges”, and graphically describe the specific relations between these points and edges [37,38,39,40]. Based on the approach of multilayer knowledge graph modeling for achieving knowledge fusion [41], the static fault maintenance knowledge graph of cantilever roadheaders is constructed from four mainlines of physical structure, internal association, condition monitoring, and fault maintenance. The entity disambiguation and coreference resolution techniques are utilized to fuse the four dimensions into the static full-connected fault maintenance knowledge graph with a complete logic chain.
(1)
Mainline of physical structure
The mainline of the physical structure is the core backbone of the entire knowledge graph, which is constructed from the real hardware topology of the roadheader, and the entity types are named as the entire machine, components, subcomponents, part entity types, and relationships between entities according to the mechanical, hydraulic, electrical and water system aspects.
The mainline of physical structure Gst can be described as:
G s t = { V s t , E s t , W s t }
V s t = { V e q u i p , V c o m p , V s c o m p , V p a r t }
where Vst denotes the set of all entity nodes of the mainline of the physical structure; Est denotes the set of relationships between the three types of entity nodes; Wst denotes the strength of the relationship quantization in Est, which can be described by using the attributes of the relationship; Vequip denotes the entity node of the whole machine, i.e., cantilever roadheader; Vcomp denotes the entity node of the component, e.g., cutoff section and hydraulic system; Vscomp denotes the entity node of the subcomponent, e.g., the cutoff arm of the cutoff section and the cutoff motor; and Vpart denotes the entity node of the part, e.g., pins and bolts.
The mainline of the physical structure includes a total of four types of entities and three types of relationships, which are described using the triple group <entity, relationship, entity>. Relationships between the whole machine and components are represented by ‘component’, e.g., the cutting section of a cantilever roadheader is represented as <cantilever type roadheader, component, cutting section>. Relationships between components and subcomponents are denoted by ‘subcomponent’, e.g., a cutting head in a cutting section is denoted as <cutting section, subcomponent, cutting head>. Finally, the relationship between a subcomponent and a component is denoted by ‘part_of’, e.g., a cutting tooth in a cutting head is denoted as <cutting head, part_of, cutting tooth>.
(2)
Mainline of internal correlation
The internal association principle is a refinement and supplement to the physical structure principle, which describes the cooperative working relationships between components, between subcomponents, and between parts within the same hierarchical subsystems of a device. The entities of the internal association mainline belong to the physical structure mainline; they do not need to be renamed but do need to be analyzed in terms of the relationships between the internal entities.
The internal association mainline entities include components, subassemblies, and parts; the type of relationship must be determined based on the specific component structure within the device, which can be roughly categorized into two types: structural relationship and transmission relationship.
The mainline of internal correlation Gin can be described as:
G i n = { V i n , E i n , W i n }
V i n = { V c o m p , V s c o m p , V p a r t }
where Vin denotes the set of all entities in the mainline of internal correlation, Ein denotes the set of relationships between all entities in the mainline of internal correlation, and Win denotes the strength of quantification of the relationship in Ein, which can be described using the relationship properties.
(3)
Mainline of condition monitoring
The mainline of condition monitoring utilizes sensors installed at the monitoring location, generates raw data based on the sensors, and analyzes the data using the implicit features in the characteristic indicators of the data. Hidden relationships are generated between the data and the fault phenomena, and the characteristic indicators of the data are also fed back to the fault phenomena and causes, thus associating the fault phenomenon node of the equipment with the raw data node and the cause of the fault node with the raw data and characteristic indicator nodes.
Condition monitoring mainline entity nomenclature includes the monitoring position, sensor, raw data, characteristic indicator, fault phenomenon and fault cause. The relationship types include monitoring location and sensor installation relationships, sensor and data generation relationships, implicit relationships between data and feature indicators, regular relationships between feature indicators and failure causes, reflection relationships between fault phenomena and data, and mapping relationships between data and fault causes. In the three sublines of data and fault phenomena, data and fault causes, feature indicators and fault cause data have great influence on the relationship between entities. In this paper, the process of mapping relationship optimization is mainly considered from the data perspective.
The mainline of Gse condition monitoring can be described as:
G s e = { V s e , E s e , W s e }
V s e = { V s e n , V l o c a , V d a t a , V p h e n , V c a u s e }
where Vse denotes the set of all entities in the condition monitoring mainline; Ese denotes the set of all entity relationships in all condition monitoring mainlines; and Wse denotes the strength of quantization of the relationships in Ese, which can be described using the relationship properties. Vsen denotes a sensor node; Vloca denotes a monitoring location node; Vdata denotes a raw data node; Vphen denotes a fault phenomenon node; and Vcause denotes a fault cause node. There are a total of six types of entities and seven types of relationships in the condition monitoring mainline. The mainline is described using <entity, relationship, entity> or <entity, attribute, value>, which can be expressed as <sensor, monitoring_of, monitoring location>, <sensor, generation_of, data>, <data, implication_of, characteristic indicator>, <data, feedback_of, fault cause>.
(4)
Mainline of fault maintenance
The fault maintenance mainline is the core of the knowledge graph. It uses the skeleton of type–location–phenomenon–cause–solution to accumulate empirical knowledge and reuse it. This knowledge can be ranked from the occurrence of the fault to the final solution.
Based on empirical knowledge, the mainline of fault maintenance is divided into four parts: mechanical systems, hydraulic systems, electrical systems, and water systems. The entities are named, and the type of relationship is determined. The fault maintenance mainline of the entity names fault type, fault location, fault phenomenon, fault causes, and solutions. The fault types are categorized according to common tunneling machine faults into mechanical faults, hydraulic faults, electrical faults, and water system faults; the fault location uses the four parts of the fault type to specifically check the location of the fault and then standardize the naming; and the fault phenomenon may correspond to multiple fault locations. For example, a mechanical failure occurs where the cutoff section does not rotate, and the cutoff section includes the cutoff head, cutoff teeth, cutoff arm, etc. The fault causes allow the analysis of specific fault phenomena; a fault phenomenon may include a variety of fault causes; for example, overheating of the tank may be due to overflow of the overflow valve or insufficient cooling water, among other reasons. A fault cause may correspond to one solution or multiple solutions, phenomena, and causes. The relationship between the phenomenon, the cause, and the solution has many possibilities, incudes a probability problem, and does not greatly influence the fault information itself.
The mainline of fault maintenance Gft can be described as:
G f t = { V f t , E f t , W f t }
V f t = { V t y p e , V l o c a , V p h e n , V c a u s e , V s o l u }
where Vft denotes the set of all entities in the fault maintenance mainline, including five types of entities; Eft denotes the set of all relationships in the fault maintenance mainline; Wft denotes the strength of the relationship quantization in Eft, which can be described by using the attributes of the relationship; Vtype denotes the node of the fault type; Vloca denotes the node of the fault location; Vphen denotes the node of the fault phenomenon; Vcause denotes the node of the fault cause; and Vsolu denotes the node of the solution method. The fault maintenance mainline includes a total of five types of entities and four types of relationships, which are described using the <entity, relationship, entity> triad, denoted as <fault type, location_of, fault location>, <fault location, phenomenon_of, fault phenomenon>, <fault phenomenon, cause_of, fault cause>, <fault cause, solution_of, solution>.
(5)
Merging Networks to Construct a Knowledge Graph Model for Fault Maintenance of Roadheaders
The physical structure, internal correlation, condition monitoring, and fault maintenance mainlines constructed according to different types of knowledge are merged under the same model framework. This results in the fusion problem between heterogeneous data, such as different names referring to the same part problem, e.g., the part location in the mainline of physical structure may be the fault location in the fault maintenance mainline and the monitoring location in the condition monitoring mainline. This is addressed by utilizing the entity disambiguation and the co-referring disambiguation duplication or redundancy, as well as by more accurately establishing entity links [42,43].
By merging the same nodes in the network of the four mainlines, a static fault maintenance knowledge graph model of a cantilever-type roadheader consisting of 11 entities, namely the equipment, component, subcomponent, part, fault type, fault phenomenon, fault cause, fault solution, sensor, original data, and characteristic indicator, is finally formed [41]:
G = { V , E , W } = G s t l     G s t A   G i n 1   G i n B   G f t 1   G f t C   G s e 1     G s e D
V = V s t   V i n   V f t   V s e
E = E s t   E i n   E f t   E s e
W = W s t   W i n   W f t   W s e
In Equations (9)–(12), V denotes the set of nodes in each mainline network; E denotes the set of all edges in each mainline network; and W denotes the quantization intensity of each edge. The merged static knowledge graph model of the cantilever roadheader is shown in Figure 2, where N denotes the total number of all components of the roadheader I = 1, 2, …, N; M is the total number of all subcomponents of component i, j = 1, 2, …, M; and L is the total number of all parts of subcomponent k, k = 1, 2, …, L.

4. Dynamic Optimization of Knowledge Graph Entity Relationships

4.1. Optimization Process Based on Information Entropy and Density-Based DBSCAN Algorithm

Because the fault graph constructed in this paper is static and fully connected, mining fault information and related entity data is difficult. When the traditional DBSCAN algorithm handles large-scale high-dimensional datasets, the data in the high-dimensional space are usually sparser than the data in the low-dimensional space, which increases the difficulty of density-based clustering. The use of only the DBSCAN algorithm cannot directly uncover the strong or weak relationship between the fault information and the data. Considering the heterogeneity of the high-dimensional time-series complex data, the information entropy is combined with the DBSCAN algorithm by calculating the true entropy value of the entity with fault information and the entropy value of the entity data associated with it and then utilizing the absolute difference between the two entropy values to assess the degree of proximity between them [44]. Finally, a threshold is set to assess the strength of the relationship between them.

4.1.1. Sample Information Entropy

Entropy is a measure of the degree of uncertainty or random variable disorder in a system and is used to characterize the rate at which data produce information [45]. The entity data can be reviewed as a probability distribution from which entropy can then be calculated. In this paper, information entropy can be used to judge the degree of discreteness between internal data and to calculate information entropy based on the real data of fault information. The degree of proximity between the entropy value of the entity data related to the fault information and the entropy value of the real data in the network can then be judged. For example, suppose there are n fault information entities, each of which may belong to a certain category, the true entropy value can be calculated by using Equation (13):
H ( X ) = i = 1 n p ( x i ) l o g 2 ( p ( x i ) )
where p(xi) denotes the probability that the ith fault information entity belongs to a certain category.
After the true entropy value of the fault information entity is calculated, the entropy value of the entity data associated with it must be calculated. Similarly, a set of data from the associated entity can be used to calculate its entropy value.
Assuming that the associated entity dataset is also an n-dimensional vector, with each dimension representing the probability of the value of an attribute or feature, the entropy value can be calculated by using Equation (14):
H ( Y ) = i = 1 n q ( y i ) l o g 2 ( q ( y i ) )
where q(yi) denotes the probability of the attribute or feature of the ith associated entity data.

4.1.2. Similarity Measures and Threshold Setting

After calculating the entropy value of two entities, mathematical methods such as the absolute difference method, the relative difference method, the Euclidean distance method, and the cosine similarity method, are generally used to determine the degree of proximity between the two entities. Considering that the entropy value of the specific data of the calculation in this paper cannot be solved by the vector method, the absolute difference method was used to calculate the entropy value of the two values. The equation of the absolute difference method is shown in Equation (14). The setting of the threshold value usually needs to be adjusted according to the specific situation, and no fixed rule exists for this setting. Generally, the threshold is determined based on the practical application requirements and the characteristics and experience of the dataset.
a b s D i f f = | H ( X ) _ 1 H ( Y ) _ 1 | + | H ( X ) _ 2 H ( Y ) _ 2 | + + | H ( X ) _ n H ( Y ) _ n |
where H ( X ) _ i denotes the value of the ith element in the entropy vector of the fault information entity, H ( Y ) _ i denotes the value of the ith element in the entropy vector of the associated entity data, and n denotes the length of the entropy vector.
Based on the information entropy and density-based DBSAN algorithm optimization analysis process shown in Figure 3, the specific steps are shown below:
(1)
Select the dataset X = {x1, x2, …, xn} to normalize the data.
Use data with different characteristics, such as current, voltage, and temperature, to eliminate the difference in magnitude between them and improve the convergence speed, robustness, and comparability of the model.
(2)
Determine the number of clusters M = {M1, M2, …, Mn} based on the normalized data obtained in the first step.
(3)
Calculate each cluster’s clustering results and the center coordinate position (xt, yt, zt) using a Python program.
There are more methods to find the center coordinate position; here, to simplify the operation, the mean value technique is used to calculate the average value of each one-dimensional data point as the center coordinate.
(4)
Calculate the distances from each data point to the hyperplane in the clustered data and form a distance matrix.
(5)
Discretize the data and count the number of sample labels.
For high-dimensional continuous data, the discretization method is used to convert constant numerical features into discrete category features to exclude the interference of abnormal data and to facilitate the rapid improvement of the execution efficiency of the algorithm.
(6)
Calculate the probability p(xi) and q(yi) of the occurrence of the data sample, and then calculate the information entropy of each data point in the hyperplane projection according to Equations (13) and (14).
(7)
Calculate the information entropy of the real dataset of the fault information and the information entropy of the data of the associated entities. Utilize the absolute difference method for comparison.
(8)
Based on the entropy value of the real data, calculate the absolute difference between the two entities. If the information entropy of the sample data and the real entropy value are close, the output results are generated directly, otherwise, return to the first step, and continue to optimize the judgment of the other data. Through this result, the relationship between the entities in the graph is dynamically optimized.
Figure 3. Optimization analysis process based on the improved DBSCAN algorithm.
Mathematics 11 04833 g003

4.2. Analysis Process of Information Entropy and Density-Based DBSCAN Clustering Algorithm Based on a Static Graph
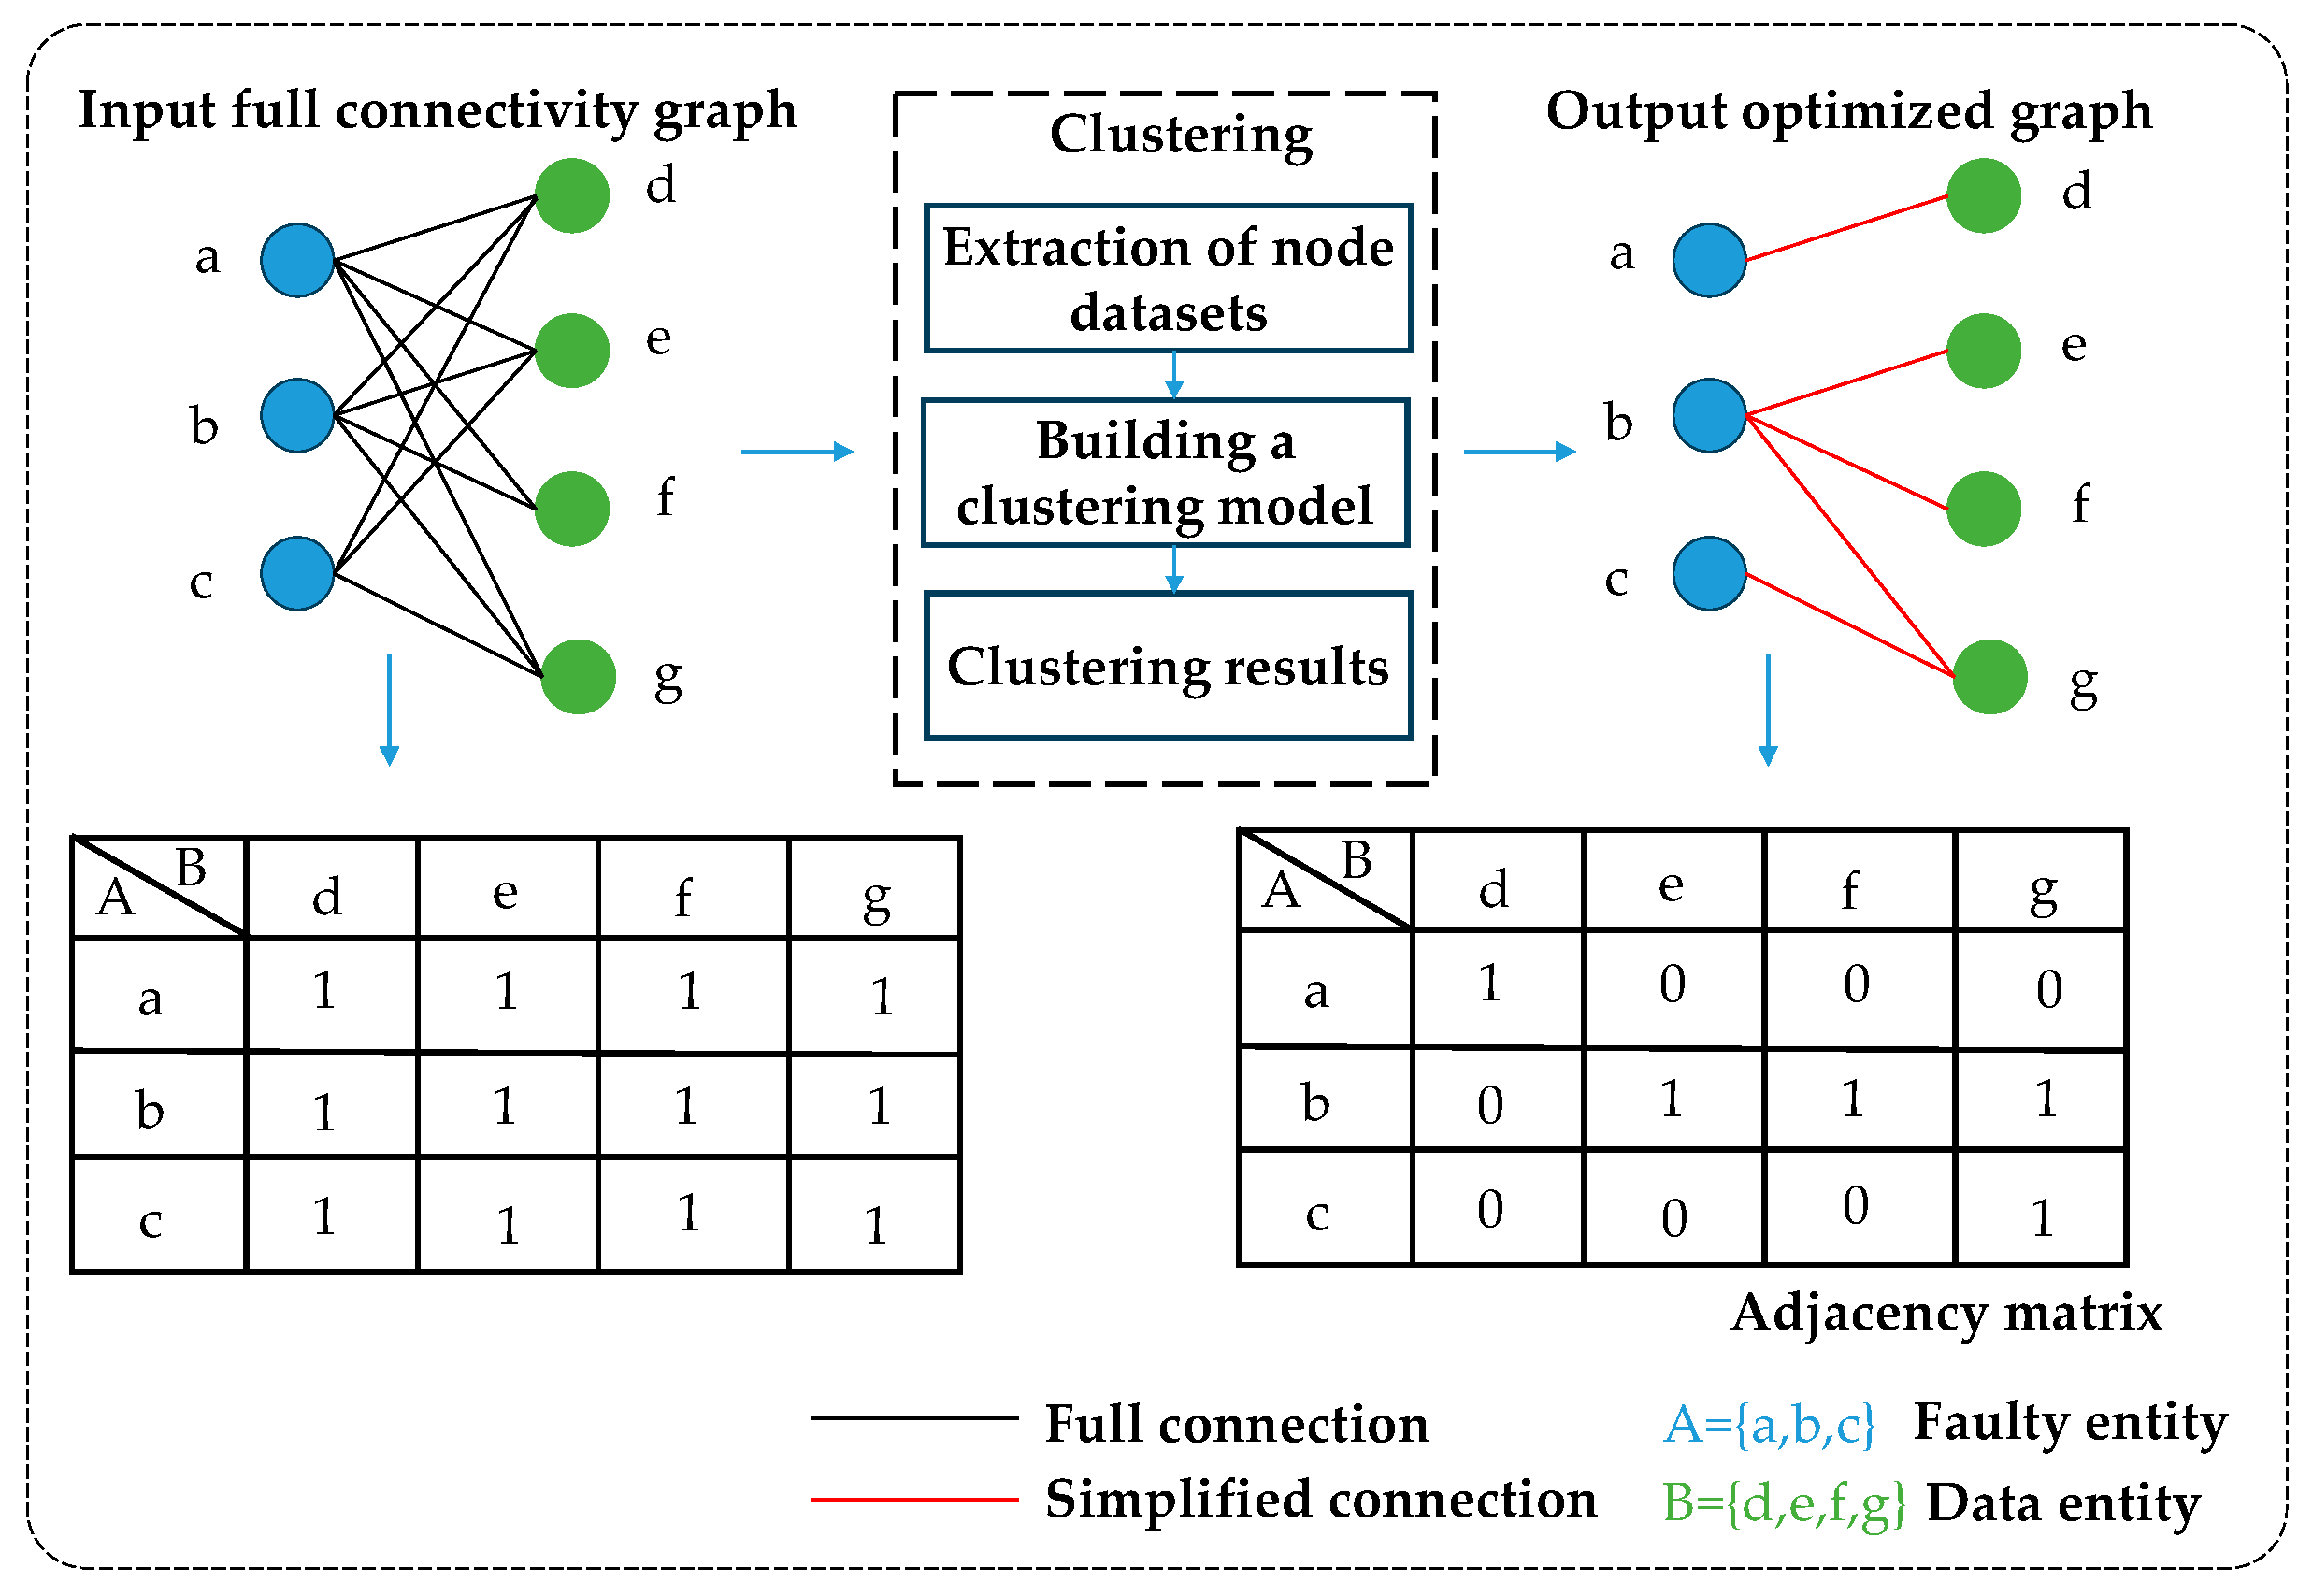
To solve the dynamic optimization problem of entity relations in a static graph, four mainlines in the mapping must be analyzed. The entity relations in the physical structure and internal correlation are related to the structure of the equipment itself; the entity relations in the fault maintenance mainline are obtained by using empirical knowledge, and the correlation relations between fault information are more of a probabilistic problem reflecting the reasoning process of fault occurrence [46]. In the condition monitoring mainline, historical data such as temperature, voltage, current, vibration, etc., are collected through the sensors, the data are utilized to relate the fault phenomenon and fault causes to generate relationships, and the data dynamics directly affect the fault information.
Based on the information entropy and density-based DBSCAN clustering algorithm, the monitoring data in the mainline of condition monitoring and the fault entities in the mainline of fault maintenance are extracted, and the local model is established. Taking the entropy value of the real fault data as the benchmark, the entropy and clustering results of the associated entity data are judged, and finally, the association strength between the data and the fault phenomenon is determined to optimize the local network. For example, to establish the connection between data entities and fault phenomena, local small clustering models are established using data entities. The information entropy of the entity data and the dispersion of each data point in the clustering results on the projection plane (information entropy) are compared with the dispersion of the data associated with the real fault phenomenon on the projection plane to determine the strength of the connection between the requested data and the fault phenomenon. The clustering analysis process based on static graphs is shown in Figure 4. The black lines indicate the original static fully connected network, the red lines indicate the simplified network connection, and the adjacency matrix indicates whether a relationship exists between two entities, with 1 indicating a relationship and 0 indicating no relationship.
Specifically, the clustering analysis process based on the static graph is as follows:
(1)
First, the network connected by the input condition monitoring mainline and the fault maintenance mainline is the neighbor matrix corresponding to the static full-connected network, where A = {a, b, c} denotes the fault node set and B = {d, e, f, g} denotes the original data node set, and a link set exists between A and B.
(2)
Extract the monitoring history dataset, establish a local clustering model based on data entities, determine the information entropy of the data in each dimension on the projection plane, and compare the requested information entropy with the information entropy of the data known to be absolutely related to the fault phenomenon. Finally, determine the weight size of the relationship between entities using the comparison results.
(3)
Output the optimization graph (output the optimization adjacency matrix).

4.3. Dynamic Optimization Process of Entity Relationships Based on Condition Monitoring Dataset
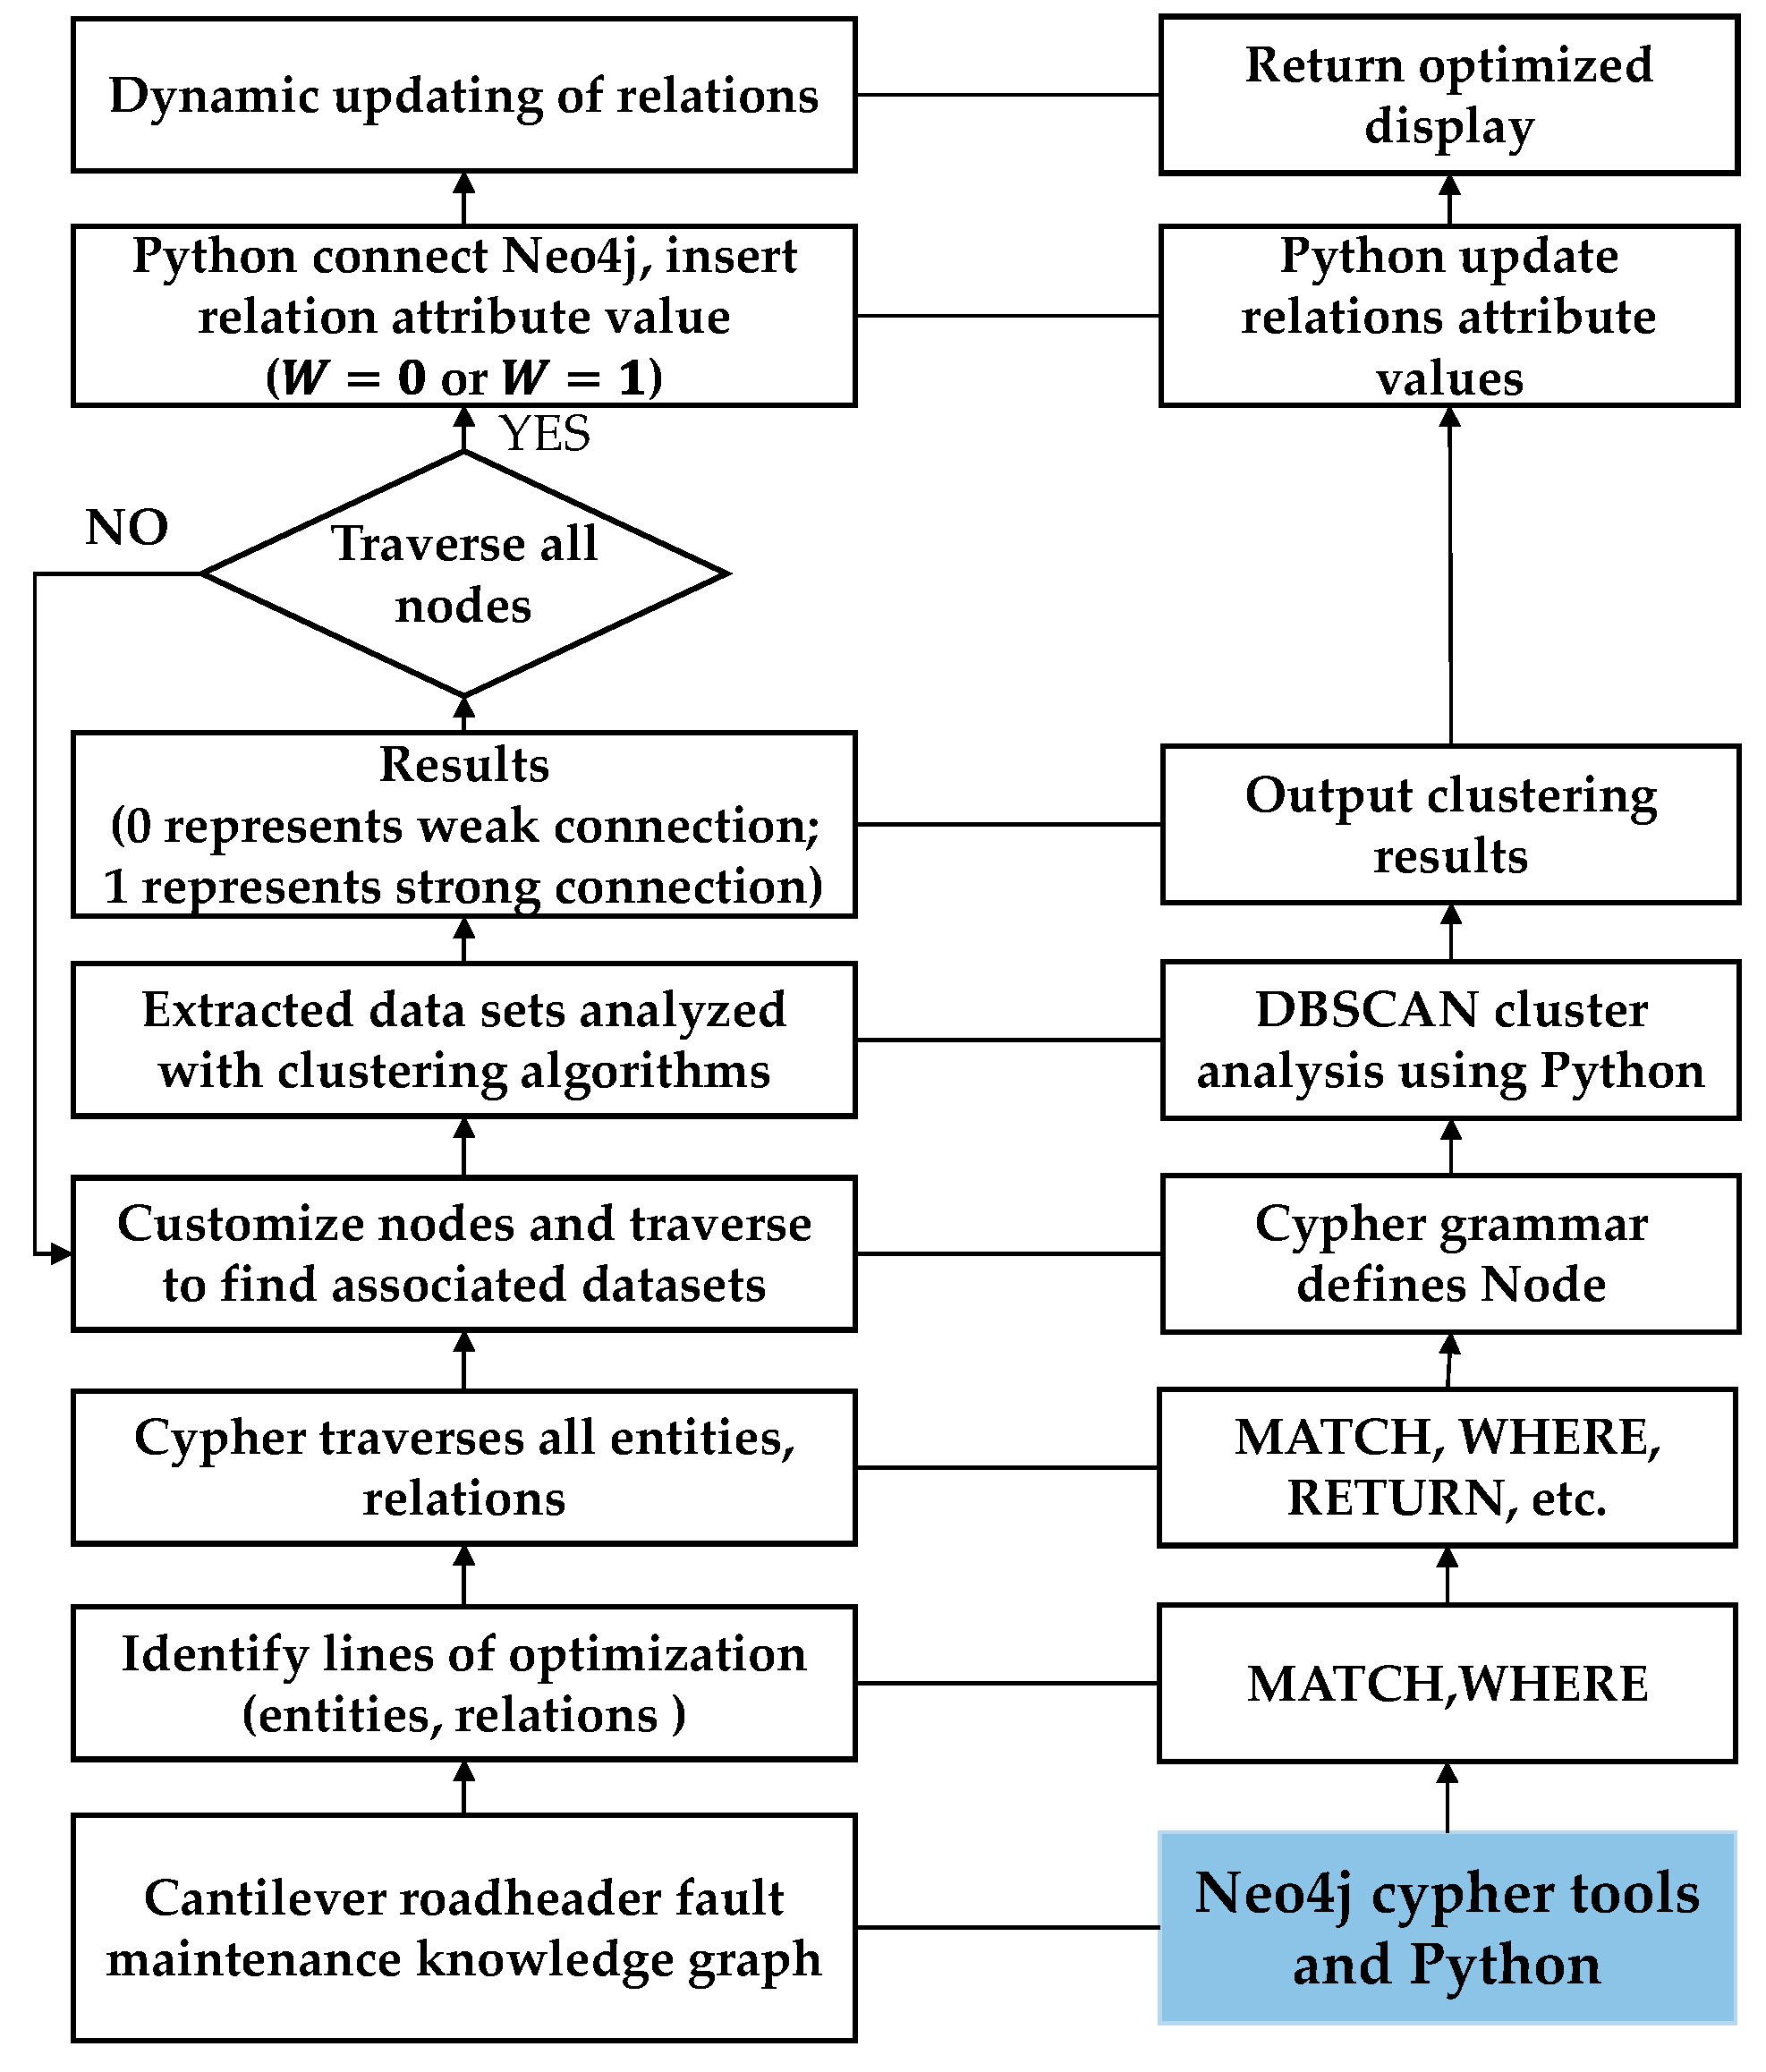
The accuracy of entity relationships based on the mainline network of condition monitoring is fuzzy. On this basis, the results are obtained by comparing the entropy values of fault information and associated entities using absolute differences and thresholds to determine the strengths of the relationships between entities in the graph. According to graph theory knowledge, the edges in the mainline graph of condition monitoring are given a weight value. If the relationship between two entities is strong, the weight value is 1; otherwise, it is 0.
Based on the cantilever static fault maintenance knowledge graph, the Cypher tool of Neo4j is used to quickly query all the nodes and relationships that must be optimized according to the filtering conditions and optimization paths, and all the raw data and feature index nodes related to the faulty entities are extracted by traversal. After the local data of each part are extracted, the entropy value and DBSCAN clustering algorithm are used to establish the local clustering model. After all the datasets are clustered, the Python program and the Cypher tool are used to correlate the fault phenomena with the data, the cause of the fault with the data, and the feature indexes with the cause of the fault and to add weight attributes to the relationships of each local optimization graph, dynamically updating the graphs.
Figure 5 shows the dynamic optimization analysis process of the entity relationship based on the static full-connected graph. This process is conducted as follows.
(1)
Determine the analysis object according to the optimization objective, narrow down the relationship optimization path, and use Neo4j-based Match and Where statements to find all nodes and relationships in the condition monitoring mainline global graph.
(2)
Use the Cypher tool to find the specific nodes and relationships in the local graph that must be optimized, such as the three subnetworks of fault phenomena and data, data, and fault causes, and characteristic indicators and fault causes.
(3)
Select the starting point of any subnetwork, customize the starting point node, query the relevant dataset nodes, traverse all the fault nodes, and repeat the above steps for the remaining lines until all the fault nodes are traversed. N represents the total number of fault nodes.
(4)
Extract the node dataset and data feature index node set associated with each fault node, analyze and model the data according to the data characteristics, analyze the data using information entropy and density-based DBSCAN clustering algorithm by using Python tools, output the analysis results, and cycle through all the local dataset nodes, where S represents the total number of datasets.
(5)
Use information entropy and clustering results to judge the strength of the relationship by further calculating the absolute difference and threshold setting. Determine whether all nodes and clustered datasets have been traversed; if so, proceed to the next step; otherwise, return to step 3 and repeat.
(6)
Use Python to connect to the Neo4j database and use the results to add weight value attributes to each relationship to dynamically optimize the relationship. Return to step 2, select the faulty nodes again, and repeat the previous steps until all the relationships between the faulty nodes are optimized.
Figure 5. Flow of dynamic optimization analysis of entity relationships based on knowledge graphs.
Mathematics 11 04833 g005

5. Implementation of Cantilever Roadheader Smart Maintenance Knowledge Graph

5.1. Neo4j-Based Knowledge Graph Visualization Display

Based on the technical documents, maintenance experience knowledge, and fault information of the EBZ200-type cantilever roadheader, the hydraulic and electrical fault knowledge is displayed. To better display the entities, relationships, and attributes as well as update the data, the graph database Neo4j is used to store the data [22] by connecting to the Neo4j database through Python’s Py2neo library, creating nodes using a Python program that reads the CSV file dataset, and constructing relationships and attributes in sequence according to the cantilever roadheader fault maintenance knowledge graph modeling process [47,48]. Figure 6 shows some entities and relationships in the static fault maintenance knowledge graph, where different entities are distinguished by color. A total of 447 nodes and 814 relationships are established in the static full-connected fault maintenance knowledge graph, which contains 1 whole machine node, 11 component nodes, 76 subcomponent nodes, 141 part nodes, 3 fault type nodes, 28 fault phenomenon nodes, 83 faults cause nodes, 83 fault solution nodes, 3 sensor nodes, 17 raw data nodes, and 1 feature indicator node.
According to the modeling process of the static full-connected graph of cantilever roadheaders, the mapping is visualized along four mainlines, namely, physical structure, internal correlation, condition monitoring, and fault maintenance.
Figure 7 shows the mainline of the physical structure. Here, the red nodes belong to the whole machine entities, the blue nodes belong to the component entities, the dark green nodes belong to the subcomponent entities, and the light green nodes belong to the part entities.
Figure 8 shows the mainline of internal correlation, where dark blue and yellow nodes belong to component entities, green and light blue belong to subcomponent entities, and purple and gray belong to part entities.
Figure 9 shows some of the mainline of condition monitoring. Red nodes belong to the sensor entity, yellow nodes belong to the raw data entity, dark blue nodes belong to the monitoring location entity, orange nodes indicate the characteristic indicator entity, light blue nodes belong to the fault cause entity, and gray nodes belong to the fault phenomenon entity.
Figure 10 shows the mainline of fault maintenance, where dark gray belongs to the fault type entity, dark blue belongs to the fault location entity, light gray belongs to the fault phenomenon entity, light blue belongs to the fault cause entity and purple belongs to the fault solution entity.

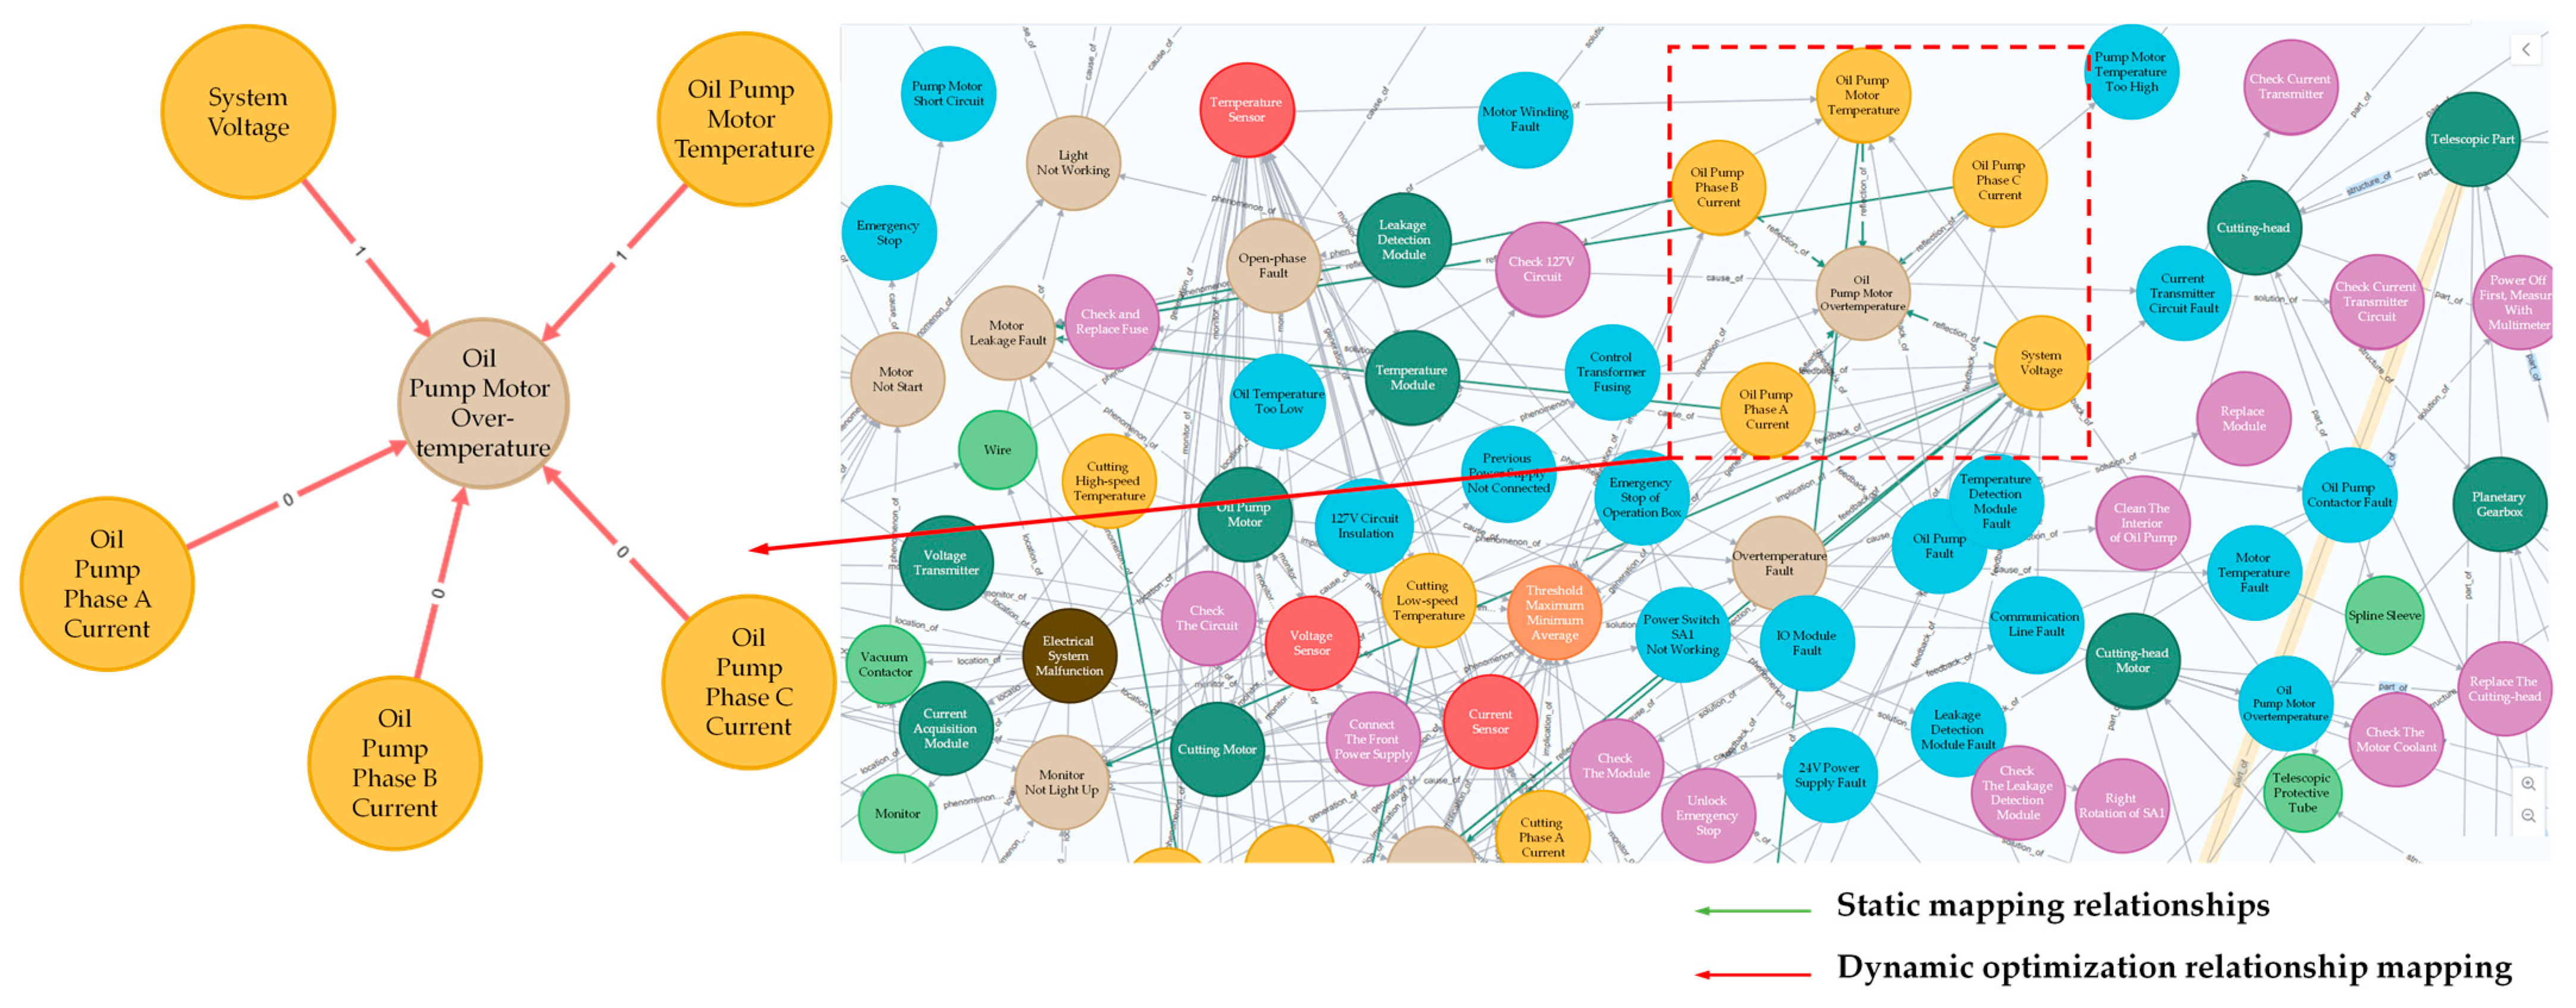
5.2. Visualization after Dynamic Optimization of Entity Relations

The cantilever roadheader condition monitoring historical dataset is selected from the data collected on 4 June 2023. This is a typical high-dimensional complex time series dataset, and all of the historical datasets are extracted from the entity data nodes in the condition monitoring mapping about the association of the oil pump motor over-temperature fault phenomenon. The size of the dataset is provided in Table 1. Using clustering training, the historical data are first preprocessed and imported using to_csv() in Panda’s library, and the imported data are then cleaned by removing useless empty columns and data with a 0 value. The MinMaxScaler class in the sci-kit-learn library is called to normalize the historical dataset to eliminate different features and compare and analyze the data within the same range. DBSCAN clustering analysis is performed on the cleaned standard data to calculate the information entropy of each one-dimensional data point in its corresponding hyperplane, and the real entropy is calculated by using real data of the phenomenon of the overtemperature failure of the oil pump motor. The information entropy of each one-dimensional dataset in its corresponding hyperplane is calculated, and the real entropy value of the oil pump motor over-temperature failure phenomenon is solved by utilizing the real data. The information entropy of all the entity datasets associated with the over-temperature failure phenomenon of the oil pump motor in the static graph constructed based on the empirical knowledge is compared with this value.
The judgment of information entropy adopts the absolute difference method, using this method to calculate the absolute difference between the information entropy of the oil pump motor over-temperature fault phenomenon and the information entropy of the associated entity data, to judge the degree of proximity of the two, to compare the distributions of the real fault data and the associated entity data in the plane, and to set thresholds for further judging the strength of the associations of all the entity data nodes associated with the fault phenomenon and to determine the strength of the association of all entity data nodes associated with the fault phenomenon. The specific information entropy data and the judgment results are shown in Table 2. The four sets of information entropy of the real fault data are obtained through the results of the clustering center point. To obtain the accurate results, calculate the average entropy value in the three dimensions of the system voltage, oil pump current and oil pump motor temperature and take the average information entropy as the real entropy value of the fault. Based on the dataset, an empirical threshold of 0.2 is preset using previous experience. To judge the accuracy of the results, the difference method is used to calculate the information entropy. If the absolute difference between the entropy value of the associated entity data and the true entropy value is less than or equal to the threshold value of 0.2, then the similarity between the associated entity data and the entity of the fault phenomenon is assumed to be higher, i.e., the data entity has a closer relationship with the fault phenomenon. If the absolute difference in the value of the information entropy is greater than 0.2, then the data associated with the fault phenomenon can be judged to have a weak association with the fault phenomenon node.
Figure 11 shows the clustering results of comparing the real fault data of the oil pump motor over-temperature fault phenomenon with the data of the fault-associated entity, as well as the projection results on the corresponding hyperplane. Figure 11a shows the projection results of the clustering of the real fault data, and Figure 11b shows the results of the data of the fault-associated entity of the fault phenomenon. Using the clustering results, the sample points are divided according to the cluster labels, and the sample points that do not fit the cluster labels (e.g., noise) are labelled as 0. Through the absolute difference between the entropy values of the two, as well as the set thresholds and the results of the clustering analysis for the optimization of the entity relations in the knowledge graph, the results of the dynamic optimization of the relations of some entities in the static knowledge graph of cantilever roadheader are shown in Figure 12. Among these, the influences of the oil pump phase A current, oil pump phase B current and oil pump phase C current on the oil pump motor over-temperature fault are weak. The Python connection graph database Neo4j combined with Cypher syntax is used to add attribute values with weight w = 0 to the relationships. Among these, the relationship between the system voltage and oil pump motor temperature and the oil pump motor over-temperature fault is strong, and the attribute values with weight w = 1 are incorporated into the relationships.

6. Discussion

To verify the accuracy of the information entropy and density-based clustering algorithm proposed in this paper, the historical dataset of the roadheader was compared with the traditional DBSCAN algorithm for the comparison test, and the accuracy of the clustering algorithm comparison is shown in Table 3. The Eps represents the neighborhood radius of the sample points. Mints represents the minimum number of sample points in the optimal neighborhood. The optimal Mints value of Traditional DBSCAN algorithm is 7, while the improved DBSCAN algorithm has an optimal Mints value of 6. However, due to the increased information entropy and recognition calculation of noisy data, the running time of the improved DBSCAN algorithm has increased.
Figure 13 shows the comparison of clustering results, where Figure 13a shows the results of the traditional DBSCAN clustering algorithm, and Figure 13b shows the results of the information entropy and DBSCAN-based clustering proposed in this paper. The traditional DBSCAN algorithm does not consider the data anomalies and data prediction processing methods and simply sets the neighborhood radius (ε) and the minimum number of neighbors (minutes), whereas the DBSCAN algorithm based on information entropy and density introduces the information entropy and threshold value. Through the processing of noisy data and the calculation of data distribution entropy, the accuracy of the improved DBSCAN algorithm is 97.8%, which is 11.9% higher than the traditional DBSCAN algorithm. The algorithm proposed in this paper has more accuracy in classifying clusters of data nodes associated with fault information.
In order to verify the efficiency and accuracy of entity relationship retrieval, the entities of the over-temperature failure phenomenon of the oil pump motor in the knowledge graph were retrieved using the Cypher-based statement, the traditional DBSCAN algorithm, and the clustering algorithm based on information entropy and density. The retrieval results and the size of the relationship weights were analyzed by using the research results, as shown in Figure 14.
Figure 14a is the result of all data entities around the phenomenon of oil pump motor over-temperature failure obtained by Cypher query, Figure 14b is the result of data node clustering obtained by querying using the traditional DBSCAN algorithm, and Figure 14c is the result obtained by querying the method proposed in this paper and comparing the accuracy rate of these three methods in the relational query result, judging by using the weight of the relational attributes in the query result and the complexity of the network The comparison of the relationship retrieval results obtained using information entropy and density clustering algorithms has the highest accuracy rate, as shown in Table 4.

7. Conclusions

To investigate the potential correlation between fault phenomena and causes, a method of constructing fault maintenance knowledge graph using four mainlines and based on forward modeling was studied. This graph structure can effectively precipitate the domain knowledge hidden in fault maintenance experience and status monitoring data. The static fully connected topology structure of this knowledge graph is oriented towards all operating conditions, and different fault phenomena occur due to different usage environments, workloads, and product quality in actual operating conditions. Therefore, in order to explore the direct connection between fault phenomena and causes under specific operating conditions, an information entropy and density-based DBSCAN clustering algorithm by introducing a corresponding historical dataset is proposed to optimize entity relationships in static fully connected networks. By using cluster analysis technology, this method improves the efficiency and accuracy of fault source analysis under specific operating conditions, while the static fully connected graph structure of specific equipment can be reused for fault source analysis under other operating conditions. The static fully connected graph modeling method and graph entity relationship optimization method for fault source analysis proposed in this paper can be extended to the equipment maintenance process in other fields. In addition, the mathematical model and method proposed in this paper can be applied to the maintenance of more complex mining equipment. However, this paper is only a simple preliminary validation of this research, and future research will focus on the identification of labels on historical datasets, fine-grained weighted analysis, and automated map spectrum construction, to assist in the intelligent process of coal mining equipment.

Author Contributions

Ideas, writing—review and editing, Y.W., Y.L. and K.D.; derivation and simulation experiments, writing—original draft, Y.W., Y.L. and S.W.; funding acquisition, Y.W., X.Z. and Y.Z. All authors have read and agreed to the published version of the manuscript.

Funding

This research was funded by the National Natural Science Foundation of China (No. 52204176, No. 51834006, No. 52074210), the China Postdoctoral Science Foundation (No. 2023MD734221), and the Natural Science Foundation of Shaanxi Province (No. 2019JQ-101).

Data Availability Statement

The data presented in this study are available on request from the corresponding author.

Conflicts of Interest

Yan Wang has received research grants from Xi’an Coal Mining Machinery Co., Ltd. Youjun Zhao is the postdoctoral supervisor of Author Y.W. The Xi’an Coal Mining Machinery Co., Ltd. had no role in the design of the study; in the collection, analyses, or interpretation of data; in the writing of the manuscript, or in the decision to publish the results.

References

  1. Wang, G.F. Discussion on the latest technological progress and problems of coal mine intelligentization. Coal Sci. Technol. 2022, 50, 1–27. [Google Scholar]
  2. Li, E.L.; Wen, B.G. Development trend of cantilever roadheader in China. Coal Min. Mach. 2013, 34, 4–7. [Google Scholar]
  3. Tian, W.Q.; Tian, Y.; Jia, Q.; Zhang, K. Research status and development trend of navigation technology of cantilever type roadheader. Coal Sci. Technol. 2022, 50, 267–274. [Google Scholar]
  4. Zhang, X.H.; Liu, Y.W.; Mao, Q.H.; Yang, W.J. Research and progress of intelligent control technology of coal mine cantilever roadheader. Heavy Mach. 2018, 342, 22–27. [Google Scholar]
  5. Li, Y.; Zhang, X.; Chen, Z.; Yang, Y.; Geng, C.; Zuo, M.J. Time-frequency ridge estimation: An effective tool for gear and bearing fault diagnosis at time-varying speeds. Mech. Syst. Signal Process. 2023, 189, 110108. [Google Scholar] [CrossRef]
  6. Li, Y.; Geng, C.; Zuo, M.J.; Liang, X. Use of vibration signal to estimate instantaneous angular frequency under strong nonstationary regimes. Mech. Syst. Signal Process. 2023, 200, 110571. [Google Scholar] [CrossRef]
  7. Duan, Y.; Cao, X.; Zhao, J.; Xu, X. Health indicator construction and status assessment of rotating machinery by spatio-temporal fusion of multi-domain mixed features. Measurement 2022, 205, 112170. [Google Scholar] [CrossRef]
  8. Duan, Y.; Cao, X.; Zhao, J.; Li, M.; Yang, X. A Spatio-temporal Fusion Autoencoder-based Health Indicator Automatic Construction Method for Rotating Machinery Considering Vibration Signal Expression. IEEE Sens. J. 2023, 23, 24822–24838. [Google Scholar] [CrossRef]
  9. Zhang, T.R.; Yu, T.B.; Zhao, H.F.; Wang, W.S. Application of data mining technology in fault diagnosis of full-section roadheading machine. J. Northeast. Univ. (Nat. Sci. Ed.) 2015, 36, 527–531+541. [Google Scholar]
  10. Yang, J.J.; Tang, Z.W.; Wang, Z.R.; Wu, M. Fault diagnosis of cutoff section of roadheader based on PSO-BP neural network. Coal Sci. Technol. 2017, 45, 129–134. [Google Scholar]
  11. Yin, T.Z. Fault Diagnosis Method of Cantilever Type Roadheader Based on Composite Network Topology; China University of Mining and Technology: Xuzhou, China, 2017. [Google Scholar]
  12. Jin, X.H.; Wang, Y.; Zhang, B. Industrial big data-driven fault prediction and health management. Comput. Integr. Manuf. Syst. 2022, 28, 1314–1336. [Google Scholar]
  13. Suo, M. Research and Application of Data-Driven Fault Detection Technology. Ph.D. Thesis, Harbin Institute of Technology, Harbin, China, 2018. [Google Scholar]
  14. Liu, S.; Liu, Q. Research status and prospect of health management of roadway boring machine. Ind. Min. Autom. 2021, 47, 32–37. [Google Scholar]
  15. Yang, C.Y.; Cao, B.S.; Zhang, X.; Ji, M.J. A review of fault diagnosis methods for belt conveyor systems. Ind. Min. Autom. 2023, 49, 149–158. [Google Scholar]
  16. Liu, Q.; Zhang, C.; Wei, M.; Chen, Q.; Li, N.W. Fault diagnosis of cut-off arm of roadheader based on optimized BP neural network. Coal Mine Mach. 2020, 41, 146–149. [Google Scholar]
  17. Bei, Y.J.; Zhou, Y.; Gao, K.W. Knowledge quiz technology for CNC machine tool equipment maintenance. Comput. Integr. Manuf. Syst. 2022, 28, 2881–2893. [Google Scholar]
  18. Xu, Z.L.; Sheng, Y.P.; He, L.R.; Wang, Y.F. An overview of knowledge graph technology. J. Univ. Electron. Sci. Technol. 2016, 45, 589–606. [Google Scholar]
  19. Chai, Z.; Liu, C.; Zhu, M.; Han, Y. Fault detection method for power plant equipment based on correlation analysis of multi-source sensing data. Comput. Digit. Eng. 2019, 47, 682–688. [Google Scholar]
  20. Ji, S.; Pan, S.; Cambria, E.; Marttinen, P.; Philip, S.Y. A Survey on Knowledge Graphs: Representation, Acquisition, and Applications. IEEE Trans. Neural Netw. Learn. Syst. 2022, 33, 494–514. [Google Scholar] [CrossRef]
  21. Honga, A.; Blomqvist, E.; Cochez, M.; D’amato, C.; Melo, D.G.; Gutierrez, C.; Kirrane, S.; Gayo, L.E.; Navigli, R.; Ngomo, N.A.C.; et al. Knowledge Graphs. ACM Comput. Surv. 2022, 54, 1–37. [Google Scholar]
  22. Zhang, Y.Q.; Ding, K.; Hui, J.Z.; Liu, S.C.; Guo, W.J.; Wang, L.H. Skeleton-RGB integrated highly similar human action prediction in human–robot collaborative assembly. Robot. Cim-Int. Manuf 2024, 86, 102659. [Google Scholar] [CrossRef]
  23. Tao, L.F.; Liu, H.F.; Zhang, J.K.; Su, X.Y.; Li, S.Y.; Jie, H.; Chen, L.; Suo, M.L.; Wang, C. Associated Fault Diagnosis of Power Supply Systems Based on Graph Matching: A Knowledge and Data Fusion Approach. Mathematics 2022, 10, 4306. [Google Scholar] [CrossRef]
  24. He, L.L.; Jiang, P.Y. Manufacturing Knowledge Graph: A Connectivism to Answer Production Problems Query With Knowledge Reuse. IEEE Access 2019, 7, 101231–101244. [Google Scholar] [CrossRef]
  25. Yahya, M.; Breslin, J.G.; Ali, M.I. Semantic Web and Knowledge Graphs for Industry 4.0. Appl. Sci. 2021, 11, 5110. [Google Scholar] [CrossRef]
  26. Lou, P.; Yu, D.; Jiang, X.; Hu, J.; Zeng, Y.; Fan, C. Knowledge Graph Construction Based on a Joint Model for Equipment Maintenance. Mathematics 2023, 11, 3748. [Google Scholar] [CrossRef]
  27. Chen, C.; Wang, T.; Yu, Z.; Liu, Y.; Xie, H.J.; Deng, J.F.; Liang, L.C. Reinforcement Learning-Based Distant Supervision Relation Extraction for Fault Diagnosis Knowledge Graph Construction under Industry 4.0. Adv. Eng. Inform. 2023, 55, 101900. [Google Scholar] [CrossRef]
  28. Wang, Y.; Zhang, X.H.; Cao, X.G.; Zhao, Y.J.; Yang, W.J.; Du, Y.Y.; Shi, S. Construction of digital twin and parallel intelligent control method for excavation face. J. China Coal Soc. 2022, 47, 384–394. [Google Scholar]
  29. Cai, A.J.; Zhang, Y.; Ren, Z.G. Construction of fault knowledge map for coal mining equipment. Ind. Min. Autom. 2023, 49, 46–51. [Google Scholar]
  30. Qiu, Y.F.; Xing, H.R.; Li, G. A review of research on the construction of knowledge graph for mine construction. Comput. Eng. Appl. 2023, 59, 64–79. [Google Scholar]
  31. Li, Z.; Zhou, B.; Li, W.H.; Li, X.Y.; Zhou, Y.; Feng, Z.K.; Zhao, H. Construction and application of knowledge mapping of coal mine electromechanical equipment accidents. Ind. Min. Autom. 2022, 48, 109–112. [Google Scholar]
  32. Cao, X.G.; Zhang, M.Y.; Lei, Z.; Duan, X.Y.; Chen, R.H. Construction and application of knowledge mapping for coal mine equipment maintenance. Ind. Min. Autom. 2021, 47, 41–45. [Google Scholar]
  33. Sharma, K.K.; Seal, A.; Yazidi, A.; Krejcar, O. A New Adaptive Mixture Distance-Based Improved Density Peaks Clustering for Gearbox Fault Diagnosis. IEEE Trans. Instrum. Meas. 2022, 71, 3528716. [Google Scholar] [CrossRef]
  34. Liu, M.; Zhang, B.; Li, X.; Tang, W.; Zhang, G. An Optimized k-means Algorithm Based on Information Entropy. Comput. J. 2021, 64, 1130–1143. [Google Scholar] [CrossRef]
  35. Zhao, S.Z. Research and application of clustering algorithm based on relative density. Mod. Comput. 2013, 13, 3–7+20. [Google Scholar]
  36. Lin, T.; Ma, T.; Qin, D.Y.; Dong, S. Research on fault diagnosis of wind turbine based on improved DBSCAN algorithm. Mod. Electron. Technol. 2018, 41, 146–149+155. [Google Scholar]
  37. Chen, G.; Wen, G.H.; Yu, W.W. A review of research on urban public transportation network based on complex network. J. Nanjing Univ. Inf. Eng. (Nat. Sci. Ed.) 2018, 10, 401–408. [Google Scholar]
  38. Li, J.; Huang, T. Research on the evaluation of fault diagnosis effect of optical communication system based on graph theory. Laser J. 2022, 43, 136–140. [Google Scholar]
  39. Bales, M.E.; Johnson, S.B. Graph Theoretic Modeling of Large-Scale Semantic Networks. J. Biomed. Inform. 2006, 39, 451–464. [Google Scholar] [CrossRef] [PubMed]
  40. Xu, X.S.; Xiao, G.; Meng, H.C.; Zhuang, C.B.; Zhang, Y.M.; Cheng, Z.B. Design-oriented computing multi-layer knowledge graph construction method and application. Computer Integrated Manufacturing Systems. Comput. Integr. Manuf. Syst. 2023, 29, 1–20. [Google Scholar]
  41. Wang, Y.; Cao, X.G.; Zhang, X.H.; Fan, H.W.; Duan, Y.; Huo, X.Q. Construction of knowledge base for intelligent maintenance of coal mining machine based on knowledge graph. Ind. Min. Autom. 2021, 47, 29–36. [Google Scholar]
  42. Bouarroudj, W.; Boufaida, Z.; Bellatreche, L. Named Entity Disambiguation in Short Texts over Knowledge Graphs. Knowl. Inf. Syst. 2022, 64, 325–351. [Google Scholar] [CrossRef]
  43. Al-Moslmi, T.; Ocana, M.G.; Opdahl, A.L.; Veres, C. Named Entity Extraction for Knowledge Graphs: A Literature Overview. IEEE Access 2020, 8, 32862–32881. [Google Scholar] [CrossRef]
  44. Weng, Y.; Zhang, N.; Yang, X. Improved Density Peak Clustering Based on Information Entropy for Ancient Character Images. IEEE Access 2019, 7, 81691–81700. [Google Scholar] [CrossRef]
  45. Lu, R.; Shen, H.; Feng, Z.; Li, H.; Zhao, W.; Li, X. HTDet: A Clustering Method using Information Entropy for Hardware Trojan Detection. Tsinghua Sci. Technol. 2021, 26, 48–61. [Google Scholar] [CrossRef]
  46. Jun-Jie, X.U.; Chen, R. Probabilistic Diagnosis Approach to Diagnosing Multiple-fault Programs with Fault Correlation. Comput. Sci. 2017, 44, 124–130. [Google Scholar]
  47. Wang, X.; Liu, M.; Liu, C.H.; Ling, L.; Zhang, X. Data-driven and Knowledge-based predictive maintenance method for industrial robots for the production stability of intelligent manufacturing. Expert Syst. Appl. 2023, 234, 121136. [Google Scholar] [CrossRef]
  48. Xia, L.; Liang, Y.; Leng, J.; Zheng, P. Maintenance planning recommendation of complex industrial equipment based on knowledge graph and graph neural network. Reliab. Eng. Syst. Saf. 2023, 232, 109068. [Google Scholar] [CrossRef]
Figure 2. Static full-connected knowledge graph model of cantilever roadheaders.
Mathematics 11 04833 g002
Figure 4. Process of clustering analysis based on static full-connected graphs.
Mathematics 11 04833 g004
Figure 6. Visualization of some cantilever roadheader fault maintenance knowledge graphs.
Mathematics 11 04833 g006
Figure 7. Mainline of the physical structure.
Mathematics 11 04833 g007
Figure 8. Mainline of the internal correlation.
Mathematics 11 04833 g008
Figure 9. Mainline of condition monitoring.
Mathematics 11 04833 g009
Figure 10. Mainline of fault maintenance.
Mathematics 11 04833 g010
Figure 11. Comparative analysis of the clustering projection results based on the real fault data and the associated entity data.
Mathematics 11 04833 g011
Figure 12. Demonstration of local entity relationship optimization of cantilever roadheader.
Mathematics 11 04833 g012
Figure 13. Comparison of clustering results.
Mathematics 11 04833 g013
Figure 14. Comparison of entity relationship retrieval results.
Mathematics 11 04833 g014
Table 1. Scale of historical dataset for roadheaders.
NameSamplesDimensionsAggregate Data
System voltage100031000
Oil pump a-phase current100031000
Oil pump b-phase current100031000
Oil pump c-phase current100031000
Oil pump motor temp100031000
Historical data100035000
Table 2. Fault information, real information entropy and associated entity information, entropy settlement results, and judgment methods.
NameSystem VoltageFuel Pump
Current
Temperature of
Fuel Pump Motor
Information entropy of real entities1.73586882.077103151.12312751
1.987805571.707441281.36216711
1.969207761.914780881.04663344
1.936310291.363186441.59836601
Real entities average entropy value1.90729811.765297421.28749876
Information entropy of related entities1.712999562.082100181.32193058
Absolute difference0.194298540.316805980.03443182
Table 3. Comparative accuracy of clustering algorithms.
DatasetDimensionsClustering AlgorithmsEpsMintsRunning Time/sAccuracy
Historical dataset for roadhead-ers3Traditional DBSCAN0.175.7799385.9%
Information entropy and density-based DBSCAN0.1566.9935597.8%
Table 4. Comparison of accuracy of entity relationship query methods.
MethodResultRelationship Weight
Static fault knowledge graph
cypher query
System voltage1
Oil pump phase a current1
Oil pump phase b current1
Oil pump phase c current1
Temperature of fuel pump motor1
Traditional DBSCAN algorithm querySystem voltage1
Oil pump phase c current1
Temperature of fuel pump motor1
Information entropy and density-based DBSCAN querySystem voltage1
Temperature of fuel pump motor1
Disclaimer/Publisher’s Note: The statements, opinions and data contained in all publications are solely those of the individual author(s) and contributor(s) and not of MDPI and/or the editor(s). MDPI and/or the editor(s) disclaim responsibility for any injury to people or property resulting from any ideas, methods, instructions or products referred to in the content.

