Abstract
In the face of the increasing complexity of risk factors in the coal mining transportation system (CMTS) during the process of intelligent transformation, this study proposes a method for analyzing accidents in CMTS based on fault tree analysis (FTA) combined with Bayesian networks (BN) and preliminary hazard analysis (PHA). Firstly, the fault tree model of CMTS was transformed into a risk Bayesian network, and the inference results of the fault tree and Bayesian network were integrated to identify the key risk factors in the transportation system. Subsequently, based on the preliminary hazard analysis of these key risk factors, corresponding rectification measures and a risk control system construction plan are proposed. Finally, a case study was carried out on the X coal mine as a pilot mine to verify the feasibility of the method. The application of this method effectively identifies and evaluates potential risk factors in CMTS, providing a scientific basis for accident prevention. This research holds significant importance for the safety management and decision making of coal mine enterprises during the process of intelligent transformation and is expected to provide strong support for enhancing the safety and reliability of CMTS.
Keywords:
coal mining transportation system; accident analysis and prevention; preliminary hazard analysis; smart mining process MSC:
82D99
1. Introduction
Accident risk assessment and management are crucial for the coal mining transportation system (CMTS), which aims to investigate and predict the failure of mining processes and, further, to ensure the well-being of humans, no harm to the environment, and asset integrity [1]. Given the hazardous underground mining environment, dynamic and operational risk assessment and management are crucial processes for coal mining enterprises to identify, evaluate [2], and mitigate risks associated with their operations and activities of CMTS [3]. At the same time, the intelligentization of the coal mine working face is the core technology to achieve high-quality development in the coal industry; building a model for coal mine transportation accidents is beneficial for the intelligent development of coal mines [4]. Therefore, it is of great significance to systematically analyze the accidents of CMTS and establish a risk pre-control system for intelligent transformation and efficient mining of coal mines [5].
To deal with the increasingly complex dynamic and operational risk and safety for the coal mining process industry [6], previous research has tried to identify the chance in exploring the solely state-of-the-art methods and models from the view of risk assessment and management for CMTS, such as failure mode and effects analysis (FMEA) [7], risk matrix (RM) [8], statistical process control (SPC) [9], hierarchical analysis [10], and grey relational analysis (GRA) [11]. Specifically, Bayesian network (BN), with the ability of bidirectional inference and efficient analysis of the impact of complex influencing factors on accidents, has been widely applied in the field like hydrogen-doped pipelines [12], offshore drilling operations [13], and so on. Obviously, all the above forerunner research has important significance. Nevertheless, it ignores the system-level issues (i.e., accident data set, interaction, initial assumptions, and construction of knowledge base [14]) and few works have been dedicated to the issue of integration and fusion of multiple methods at the same time for CMTS.
Therefore, to address the limitations of traditional analysis methods in meeting practical needs, this study proposes a comprehensive qualitative and quantitative analysis of the risks of CMTS by combining fault tree analysis (FTA) with BN and preliminary hazard analysis (PHA). The aim is to identify the risk Bayesian accident nodes that are most likely to cause transportation accidents in coal mines. Furthermore, in order to analyze the risk Bayesian accident nodes and take corresponding preventive measures, it is necessary to identify the causes of accidents in the CMTS and the potential consequences through PHA. This allows for the formulation of risk prevention and control measures and the construction of a pre-control system to minimize the likelihood of accidents.
The rest of this paper is organized as follows: Section 2 defines methodology for accident analysis in CMTS. Section 3 details the risk assessment process for coal mine accidents. The case study validation at X coal mine is presented in Section 4. The conclusion and future work are concluded in Section 5.
2. Related Work
2.1. Risk and Safety Assessment and Management Techniques
Process systems are subject to deterioration over time due to natural and human-made causes [15]. C-RISE of Memorial University, a professional risk and safety research group, has systematically summarized various methods and models to investigate and predict risk in different domains. Based on structures, accuracy, and independency, these risk analysis methods and modes can be categorized into static (i.e., FTA, event tree analysis [16], reliability block diagrams, and PHA [17]) and dynamic (i.e., dynamic event tree [18] and Markov-process-based fault tree [19]), where the latter is an improvement of the former type to deal with more complex dynamic process systems [20]. Feature- and function-based categories of risk and safety assessment and management techniques encompass risk identification and analysis, assessment, management, and control, which will be comprehensively reviewed in detail [21].
To identify and evaluate the hazards and risk, FTA is a typical analytical method utilizing logical reasoning and representing the logical relationships between potential accidents and causes through a tree-like diagram [22]. Based on a random number, Zhang et al. [23] proposed a safety static fault tree model to quantitatively analyze the potential risk of inerting systems with a large number of minimal cut sets. Based on FTA-AHP, Ren et al. [24] proposed a collapse accident safety decision analysis method to qualitatively and quantitatively evaluate risk factors related to collapse accidents and determine the primary causes. To improve the accuracy and interpretability of the milling fault detection model, Cheng et al. [25] introduced a milling fault detection method combined with FTA and hierarchical confidence rule base.
To analyze and assess key factors, BN is an ideal network model with the function of bidirectional inference and efficient analysis of the influence of each variable on the final node and the interpretation of the correlations between variables based on Bayesian theory and graphical theory [26]. Combined with association rules, Li et al. [27] utilized BN to explore chemical explosion accidents, revealing accident pathways and the sensitivity of direct causes. Mohammed et al. [28] proposed a formalized modeling tool, named Bayesian Stochastic Petri Nets (BSPN), for dynamic safety and reliability analysis. For medical device risk assessment and management, Hunte et al. [29] propose a novel approach using hybrid Bayesian networks to handle uncertainty and incorporate causal knowledge and incorporate relevant factors from the medical device safety and risks. Cenk et al. [30] mapped fault trees to BN for dynamic analysis of pilot transition accidents, greatly improving the accuracy of determining accident factors. By dividing risk factors into multiple states, Yang et al. [31] introduced the concept of accuracy and relied on BN to calculate risk probabilities and distributions in real time, providing targeted preventive measures. Wang et al. [32] conducted simulations, analysis, and evaluations using the accident causality model System-Theoretic Accident Model and Processes (STAMP) and the Bayesian network model to accurately assess the traffic safety risks associated with the penetration of autonomous driving technology.
To analyze and control potential risk before engineering activities, PHA is one of the methods applied to analyze triggering conditions, hazard types and levels, consequences, and prevention measures of accidents [29]. To determine key influencing factors and identify accident causal event chains of autonomous surface ships, Zhang et al. [33] proposed a PHA-based causal logic method to provide references for maritime autonomous surface ship design and safety assessment processes. Combined with inversion temperature charts, Zhu et al. [34] proposed an OCTEM-PHA analysis model to analyze and predict five risk factors present in Guangxi mine and propose corresponding safety measures. To identify hazardous scenarios, Nicolau et al. [35] developed a PHA-based quantitative analysis method for the radioactive and chemical risks in uranium isotope enrichment facilities and defining the characteristics of each hazard and their causes and consequences.
2.2. Coal Mine Transportation Accidents Analysis
Efficient transportation is one of the keys to efficient coal production [36]. While the development of intelligent transformation and the improvement of management levels, the occurrence rate of transportation accidents and associated risk continue to increase [37] due to the complex nature of the coal industry [38]. For effective accident prevention and risk assessment in CMTS, a scientific method is to analyze the causes of historical transportation accidents and understand the mechanisms and patterns of accidents and design an effective analysis indicator and rational foundations [39]. Currently, scholars are conducting relevant research on CMTS accidents. Based on statistical patterns of the past five years (2017–2021) of nationwide coal mine accidents, Zhang et al. [37] described the accident information from four dimensions, accident level, type, region, and time, and proposed preventive measures for transportation accidents. Wang et al. [39] proposed a modeling approach called mine accident unsafe behavior network (MAUAN) to analyze the interrelationships and potential behavioral patterns of unsafe behaviors from a network modeling perspective. Wei et al. [40] proposed a quantitative risk assessment method based on the bow-tie model to reduce the occurrence rate of underground vehicle accidents. Pandey et al. [41] propose a method that utilizes fuzzy decision-making trial evaluation laboratory (DEMATEL) to conduct a comprehensive assessment of the key factors leading to truck mining accidents and the relationships between these factors are illustrated with a causal diagram.
The current application research shows that extensive studies have been conducted both domestically and internationally on safety risk analysis and accident prevention in CMTS, resulting in significant achievements in technology and management. However, there are also some drawbacks that need to be addressed. Firstly, the data in case studies often represent specific cases with poor representativeness. Secondly, the analysis of accident causes is not comprehensive enough, lacking inferences about risk evolution, and the provided recommendations for risk prevention are relatively general and not specific enough.
To address these issues, this study will select coal mine transportation accident cases from the past 20 years and utilize fault tree analysis, Bayesian network methods, and preliminary hazard analysis for risk analysis and prevention. The following sections will provide a detailed introduction to the relevant methods used in this study and their applications in the field of accident analysis, exploring their potential application in the domain of coal mine transportation accidents.
3. A Framework of CMTS Accident Analysis and Prevention Based on FTA-BN-PHA
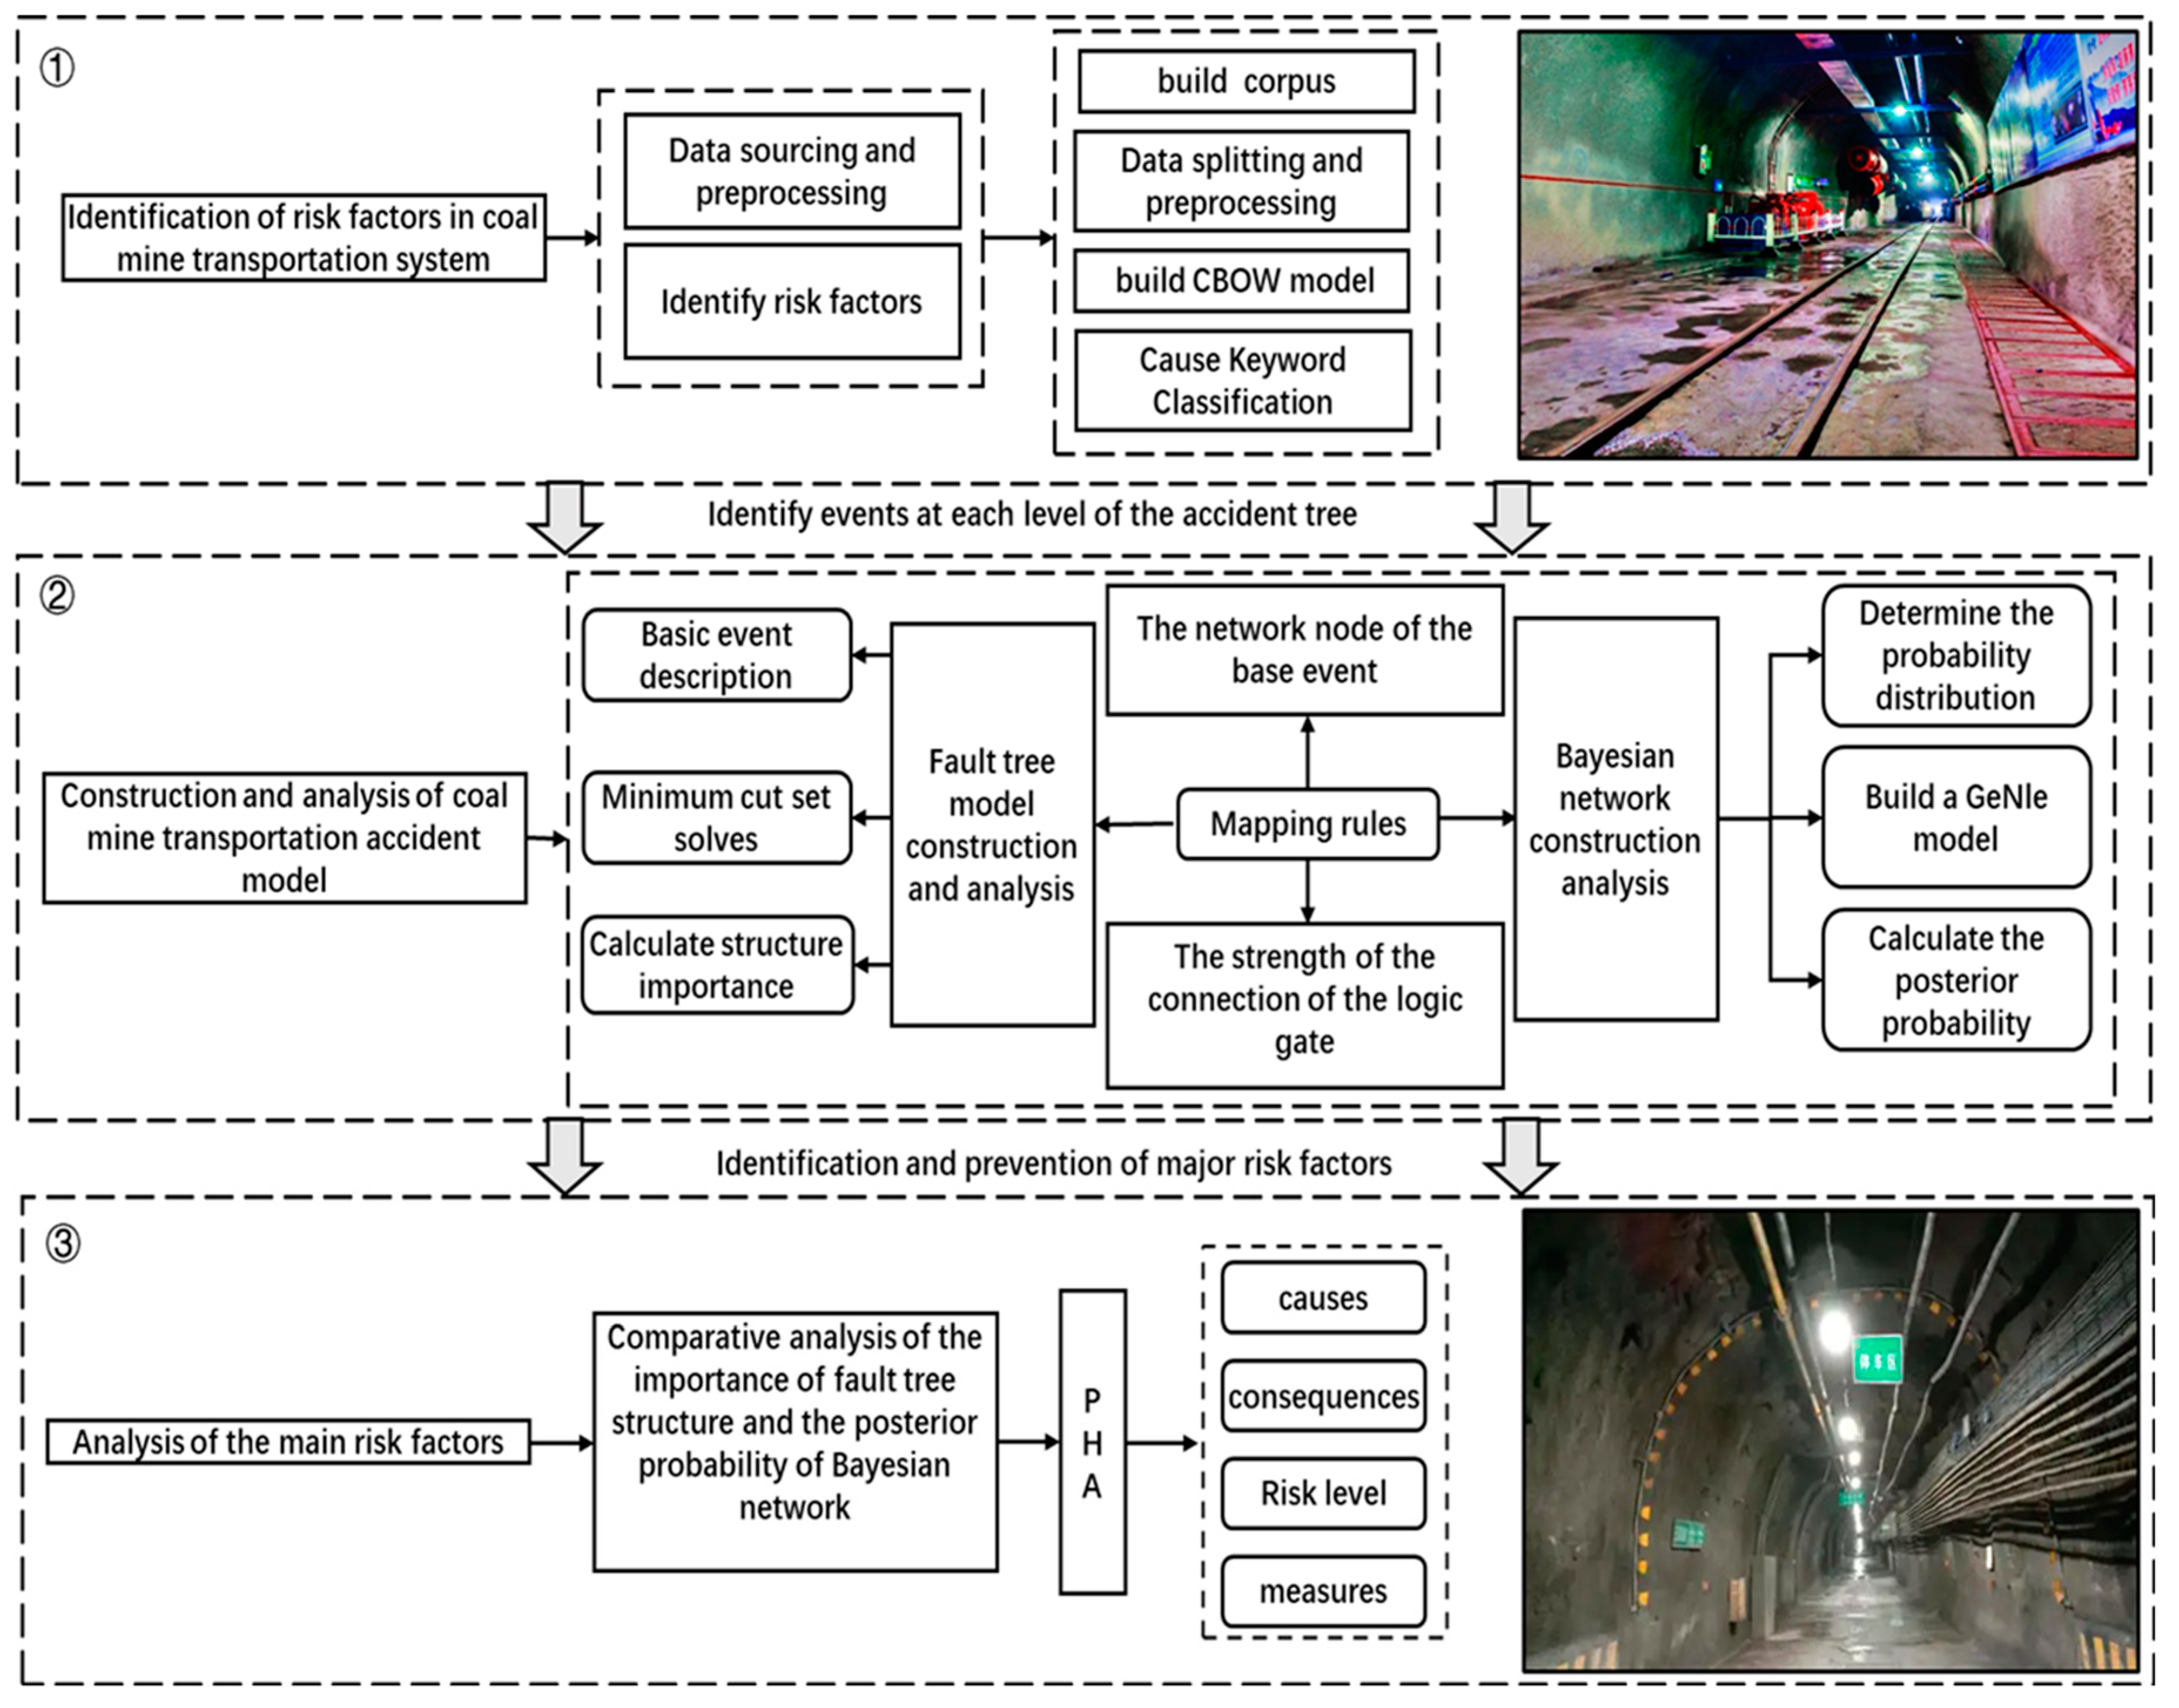
This study proposes a framework of accident analysis and prevention based on FTA-BN-PHA for CMTS. Firstly, according to the classic CTMS, an FTA model is constructed. Then, the accident tree is mapped to a BN model for performing bidirectional inference and enabling analysis of the importance of each basic event. Finally, a PHA model is conducted on the main risk factors to establish an accident pre-control system. The framework of the proposed accident analysis method in this study is illustrated in Figure 1.
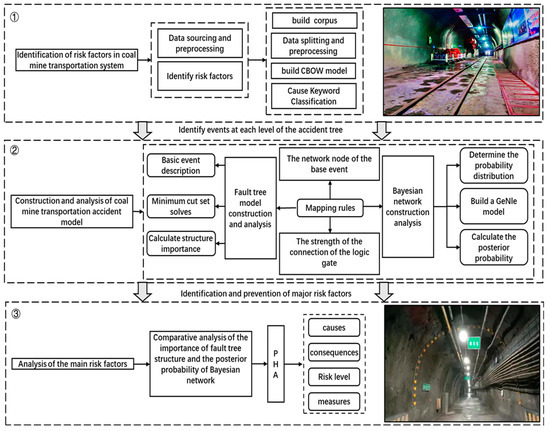
Figure 1.
Analysis process of coal mine transportation accidents based on FTA-BN-PHA.
3.1. Identification of Factors in Coal Mine Transportation Accidents
There are two channels for knowledge acquisition; one is that it only needs simple preprocessing that can be used as input for subsequent AI and the other is that it needs to extract structured information with the help of natural language processing and other technologies [14]. So, this study is no exception.
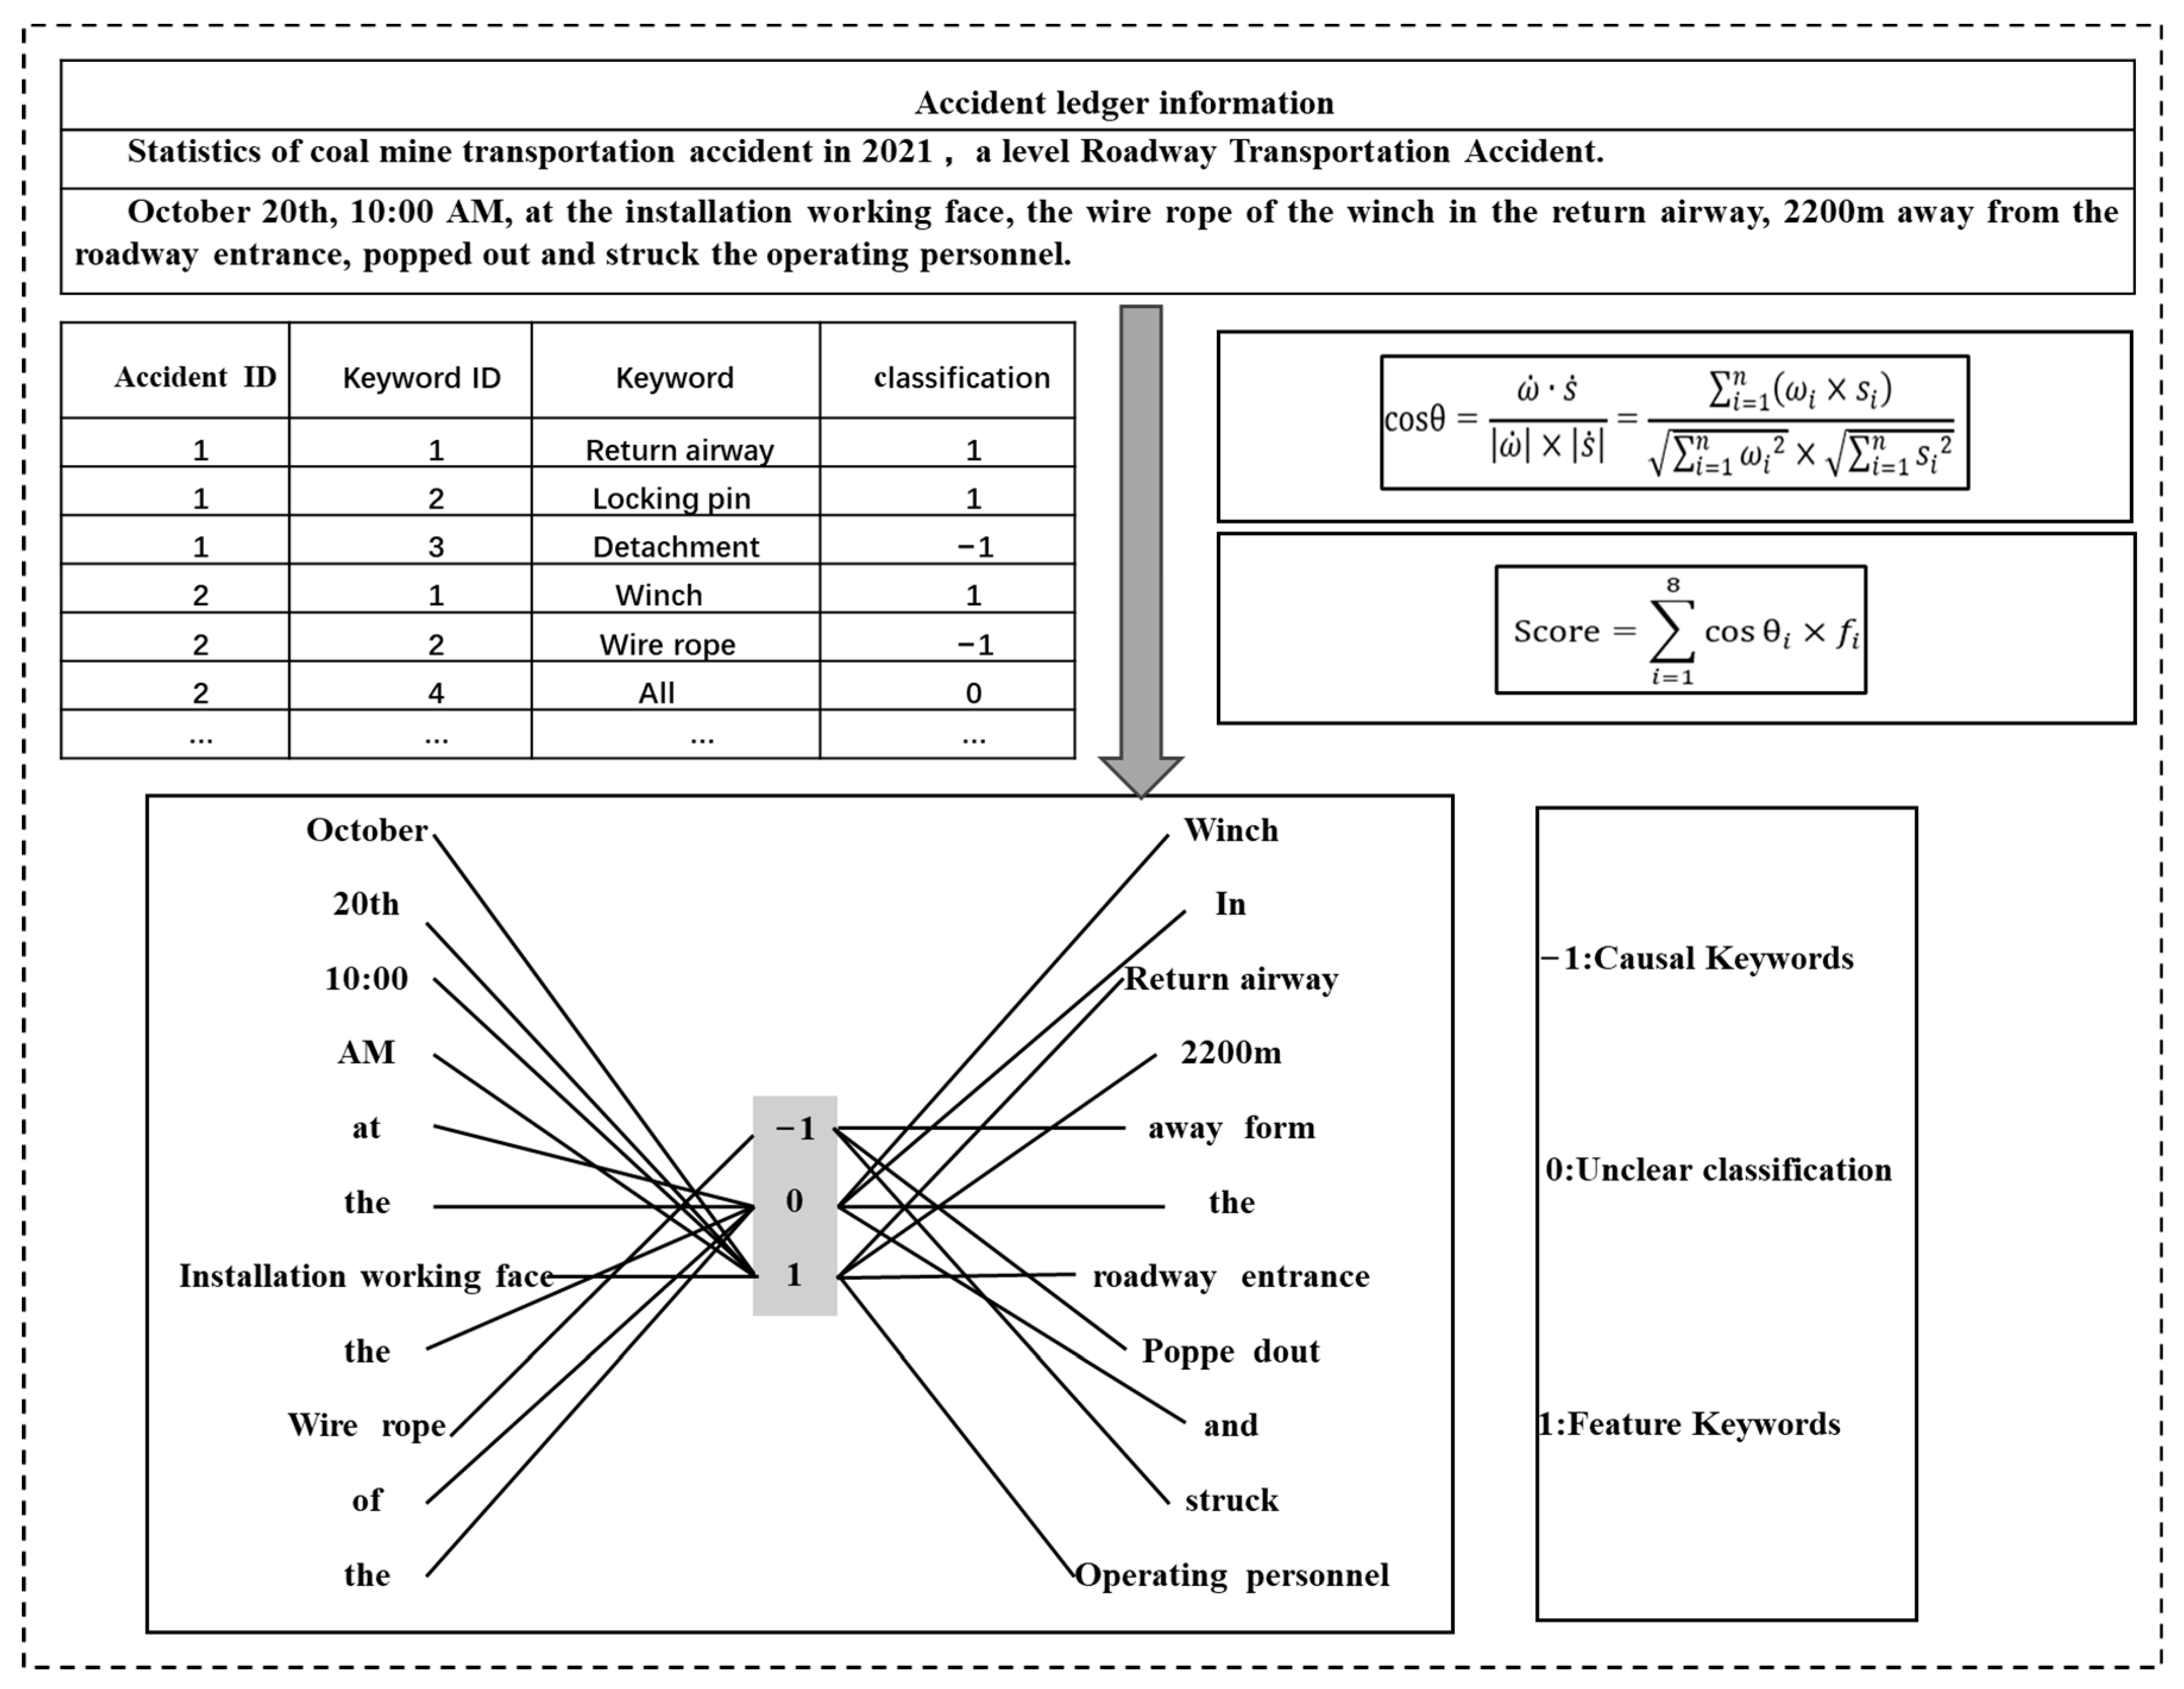
Firstly, this study used Python web-scraping techniques to select and compile a total of coal mining transportation accidents from websites such as the Coal Mine Safety Network, National and Local Mine Safety Supervision Bureaus, etc. Next, in this study, R 3.6.1 and corresponding programs were used to perform mining analysis on accident reports to obtain textual data on risk factors in CMTS. To enhance the analysis results and minimize the impact of irrelevant phrases, only three sections of the accident reports were chosen for text mining. These sections are the “accident category or nature”, “accident process”, and “accident causes”. For instance, an accident description could be condensed as follows: “On 20 October, at 10:00 AM, at the installation working face, the wire rope of the winch in the re-turn airway, which was 2200 m away from the roadway entrance, popped out and struck the operating personnel”. Additionally, any erroneous information in the accident reports was corrected. The selected data were then stored in a text file to form a corpus for mining. To handle the abundance of specialized terms in the accident reports, Python 3.8 was utilized to implement jieba word segmentation programmatically. Following this, a stop-word dictionary and a user dictionary were created, adhering to the specific guidelines within the coal industry’s transportation safety domain. The stop-word dictionary, along with regular expressions, aided in the elimination of irrelevant conjunctions and punctuation from the accident text. Additionally, the user dictionary pattern was employed for effective segmentation of the report data.
Afterwards, the textual data were transformed into a vector format that can be recognized by computers. Using Python programming, a Word2Vec word-embedding model was trained based on the preprocessed set of accident words. The trained model represents key words as multidimensional vectors, and the relationship between key words is determined by analyzing the distances between the vectors’ dimensions. The Continuous Bag-of-Words (CBOW) model in Word2vec is used to distinguish words with similar content but different meanings. For example, “mine car”, “electric locomotive”, and “drive” all contain the word “car”, while words that appear in “Ore car” and “electric locomotive” are noun-like feature words for transportation equipment, while “drive” is an operation verb-like feature word, which can well distinguish professional vocabulary in the field of transportation systems. Since the word vector model only contains keywords and vector space after training, it is necessary to establish a classification corpus that can provide a classification basis for the computer. A keyword classification corpus is constructed based on expert knowledge. The classification attribute value of “1” indicates that the keyword is a feature-class keyword, while a value of “−1” indicates a causative-class keyword. A classification attribute value of “0” indicates that the classification of the keyword is unclear.
The principle of the keyword classification algorithm is based on the concept that, in the same vector space, the smaller the angle between two keyword vectors, the larger the cosine value, indicating that the two keywords have a similar composition and contextual environment. The algorithm selects the eight most similar keywords to the target keywords. The formula for calculating cosine similarity is as follows:
In Equation (1), stands for cosine similarity between two keyword vectors, is the word vector of the target word, is the word vector of the matching word, and and are the values of word vectors in the i-th dimension.
After calculating the cosine similarity and obtaining the eight most similar words, the target word can be classified using the score. The formula for calculating the score is as follows:
In Equation (2), Score represents the word classification score, is the cosine similarity of word vectors, and represents the classification attribute value of the ith similar word.
After calculating the Score using the Python programming language, keywords can be automatically classified. When Score >1, it indicates a high cosine similarity between the target word and feature-class keywords, assigning a classification attribute value of 1. Conversely, when Score <−1, it indicates a higher cosine similarity between the target word and causative-class keywords, assigning a classification attribute value of −1. Finally, the causative-class keywords can be stored in an Excel spreadsheet, categorized by their attributes, to obtain data on coal mining transportation accident factors. Using the corpus to display accidents as an example, text mining is used to determine accident keywords and classify them, as shown in Figure 2.
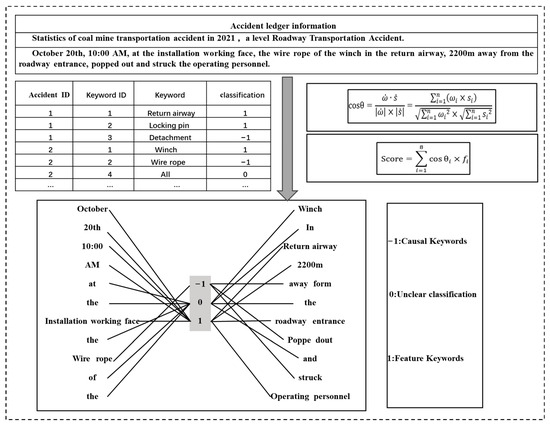
Figure 2.
Text mining example.
3.2. Theoretical Analysis and Process of FTA
According to the traffic accident risk factors and accident-report-related data, the specific process of constructing the coal mine traffic accident tree model is as follows:
Step 1: Establishment and module decomposition of CMTS accident tree. Firstly, the accident of the CMTS is determined to be the top event of the fault tree analysis, which is represented by “T”. According to the type, the CMTS can be divided into level roadway transportation system accidents, inclined roadway transportation system accidents, and vertical shaft lifting transportation system accidents, and the above three events are represented by “T1, T2, and T3”, respectively, as the first intermediate events.
Due to the complexity of the fault tree model for the CMTS, a simplification and decomposition approach is adopted to analyze its causes. Each first-level intermediate event is treated as a module, leading to the decomposition of the system into three sub-fault trees. Each sub-fault tree will be subject to individual qualitative analysis and quantitative calculations.
Step 2: Qualitative analysis of accident trees in CMTS. Qualitative analysis is used to obtain the minimum cut sets of each sub-fault tree, thereby reducing the probability of failure in the CMTS. The occurrence of the top event is not established unless all the basic events have occurred. If a simultaneous occurrence of certain basic events can lead to the occurrence of the top event, then the set of these basic events is known as the cut set of the fault tree. Structural importance analysis, from a qualitative perspective, examines the importance of each basic event. The structural importance can be determined using the minimum cut sets. In this study, the structural function and the downset method are employed to calculate the minimum cut sets of the fault tree model and rank the structural importance of the basic events for the analysis of the CMTS accident tree model. The structural function of the fault tree is essentially a Boolean function associated with logic gates. When the values of the basic events are either 0 or 1, the calculation formula is as follows [42]:
In Equation (3), represents that the top event will occur only when all n basic events occur simultaneously. Conversely, if any of the basic events does not occur, the top event will not occur [42]. In the formula, represents the basic event.
In Equation (4), represents that the top event will occur when any one of the n basic events occurs. Conversely, if none of the basic events occur, the top event will not occur.
The downset method applies the rules of Boolean algebra to replace the upper-level and lower-level events. The AND gate is represented by multiplication and the OR gate is represented by addition. This process continues until all events in the equation are replaced by basic events. Finally, the results of the minimum cut sets are accumulated.
Step 3: Quantitative analysis of accident trees in CMTS. The quantitative calculation of the fault tree is to find out the key failure modes in the fault tree by calculating the importance of each bottom event in the fault tree. The structural importance of the basic events in the CMTS is ranked based on the results of the minimum cut sets and the related basic events. The formula for calculating the structural importance is as follows [43]:
In Equation (5), represents the structural importance of the basic event I, represents the j-th minimum cut set, and represents the number of basic events in.
3.3. Build BN Model
Given the sample dataset, BN analysis typically involves two types of learning: parameter learning and structure learning. This study maps the accident tree model into a Bayesian network structure and then carries out parameter learning.
The node states in the Bayesian network are represented as:
In Equation (6), denotes the Bayesian network node state and.
The structural function φ(X) of the top event is:
In Equation (7), denotes the structure function of the top event and .
When constructing a Bayesian network based on the accident tree model, the steps are as follows:
Step 1: Mapping the incident tree to a Bayesian network. Determining the directed acyclic graph of the Bayesian network is as follows: each node of BN is mapped to the events in the accident tree and directed edges are used to connect the corresponding nodes. The logic gates in the accident tree are expressed as conditional probability distributions of the nodes in the BN. The specific process algorithm for mapping the accident tree model to the Bayesian network model is shown in Algorithm 1.
| Algorithm 1. Algorithm for mapping FTA to BN. |
| Input: Accident tree model and related nodes, relationships Output: Bayesian network model and related nodes, relationships Begin // 1.Define the fault tree node class class Fault Tree Node: def __init__(self, name): self.name = name self.parents = [] self.children = [] self.probability = 0.0 //2. Define the BN node class class Bayesian Node: def __init__(self, name): self.name = name self.parents = [] self.children = [] // 3.Define a function to convert the fault tree model to a BN model def convert_fault_tree_to_bayesian(fault_tree_root): bayesian_network_nodes = {} visited_nodes = set() def dfs(node): if node in visited_nodes: return visited_nodes.add(node) //4. Create BN nodes bayesian_node = BayesianNode(node.name) bayesian_network_nodes[node.name] = bayesian_node for parent in node.parents: // 5.Convert the parent nodes of the fault tree nodes to the parent nodes of the BN parent_bayesian_node = bayesian_network_nodes.get(parent.name) if parent_bayesian_node is None: parent_bayesian_node = Bayesian Node(parent.name) bayesian_network_nodes[parent.name] = parent_bayesian_node bayesian_node.parents.append(parent_bayesian_node) parent_bayesian_node.children.append(bayesian_node) // 6.Handle the parent node recursively dfs(parent) dfs(fault_tree_root) return bayesian_network_nodes end |
As shown in the algorithm in Algorithm 1, using mapping techniques from FTA to BN, the conditional dependencies and uncertainties of important variables can be represented and analyzed using BN. The correspondence is established to maintain the logical relationships and structural consistency of the fault tree model in the Bayesian network.
Step 2: Calculation of the prior probability of risk factors P(A). For a comprehensive BN risk analysis, it is necessary to determine the prior probabilities of the root node and the conditional probabilities of the leaf nodes. Equation (8) can be utilized along with the frequency of risk factors to obtain the prior probabilities P(A) for the risk factors in the coal mining haulage system [44].
In Equation (8), represents the a priori probability of the risk factor, x represents the frequency of the risk factor, and n represents the total number of accident occurrences.
Step 3: Calculate the posterior probability of coal mine transportation accidents. The GeNle 2.1 is chosen to build the BN model of the CMTS in order to update the prior probabilities of the root node and the logical relationships between nodes. This allows for backward reasoning to obtain the posterior probabilities of the nodes. The BN model’s backward reasoning can be used to predict the outcome factors based on the certain occurrence of the causal factors or to infer the key factors leading to the occurrence of the outcome based on the known outcome factors. In this study, the target node is set as a leaf node and its probability is set to 100% in the software. By updating the posterior probabilities, the risks of the coal mining haulage systems under accident conditions, including the horizontal haulage, inclined haulage, and vertical shaft hoisting systems, can be obtained. The posterior probability plays a crucial role in the Bayesian formula. It updates our probability estimates of events by considering both the prior probability and the observed data, providing more accurate and reliable risk assessment results. The expression of the posterior probability can be seen in Equation (9).
In Equation (9), P(A|B) represents the posterior probability of event A, P(B|A) represents the conditional probability, also known as the likelihood, P(B) represents the marginal probability of event B, and P(A) represents the prior probability. From Equation (9), we can derive the Bayesian theorem, which states that:
In Equation (10), are pairwise mutually exclusive events,, which constitute a complete event. There exists an event A that occurs simultaneously with events B1…Bn. represents the prior probability and P(Bi|A) represents the posterior probability.
Step 4: Identify key risk factors. In order to improve the accuracy of determining key factors, this study also involves determining the ranking of the importance of posterior probabilities of BN nodes. The calculation formula for the node importance in BN is as shown in Equation (11).
In Equation (11), represents the difference between the posterior probability and the prior probability of a BN node. The larger the value of, the lower the ranking of node importance, indicating a higher probability of triggering hazards. This is used to determine the primary risk factors. represents the prior probability and represents the posterior probability.
Finally, based on the division of the coal mining transportation subsystem and a comparative analysis using the importance ranking of fault tree structure and posterior probability, the five key risk factors for each sub-transportation system are determined.
3.4. Risk Factor Analysis Based on PHA
To delve deeper into the main risk factors identified through the integrated analysis of fault trees and Bayesian networks, the method of pre-hazard analysis is introduced. PHA is a systematic and scientific method for identifying and analyzing key risk factors associated with a particular activity or project. It aims to assess potential hazards, evaluate their likelihood and severity, and propose appropriate control measures to mitigate risks.
This paper presents PHA as a theoretical framework and methodological approach for risk factor analysis, and propose preventive measures. The specific steps of pre-hazard analysis are as follows:
Step 1: Determining the Likelihood of Risk Occurrence (L). Referring to Table 1, the likelihood of an adverse event occurring is evaluated based on four aspects: deviation frequency, safety inspection, operating procedures, and employee competency. The highest score among the four factors is taken as the final “L” value.

Table 1.
Likelihood of risk occurrence.
Step 2: Determining the Severity Level of Risk Consequences (S). Referring to the China Measures for Reporting and Investigating Mining Production Safety Accidents (https://www.chinaminesafety.gov.cn/zfxxgk/fdzdgknr/tzgg/202301/t20230118_440874.shtml, accessed on 16 March 2024) shown in Table 2, the severity of the consequences will be evaluated based on four aspects: personnel fatalities, personnel serious injuries, property damage, and workplace environment destruction. The highest score among the four items will be taken as the final “S” value.
Table 2.
Severity levels of risk consequences.
Step 3: Construction of Risk Matrix (RM). This research adopts the matrix analysis method, with the likelihood of risk events as the rows and the severity of risk event consequences as the columns, forming a matrix analysis table. The calculation formula for the risk matrix is shown in Equation (12) as follows:
In Equation (12), R represents the risk value, which is the combination of the likelihood of an accident occurring and the severity of its consequences. L denotes the likelihood of the accident occurring, while S represents the severity of the accident consequences. A higher value of R indicates a greater level of risk, implying that the CMTS has a higher level of danger or hazard.
Based on the risk value R, an RM can be constructed to assess and classify risk factors according to the levels shown in Table 3.
Table 3.
Risk matrix (RM).
Step 4: Risk Level Classification. According to the magnitude of the risk value R, the risk levels can be divided into four categories, as shown in Table 4.
Table 4.
Risk level classification.
Step 5: Develop relevant preventive measures. Finally, for the causes and consequences of the accident, corresponding preventive measures are developed for each risk event.
4. Example
4.1. Example Illustration
To illustrate the effectiveness of the FTA-BN-PHA method in accident analysis, we will provide an example of how to apply this method.
X coal mine was established in December 1992 and commenced production in December 1996. The mining field of the mine currently covers an area of approximately 7.27 square kilometers, occupying 442.89 acres. It has geological reserves of 174.62 million tons and recoverable reserves of 10,026.76 million tons. The current production capacity is 1.5 million tons per year and the remaining service life of the mine is 50 years. The transportation tasks at X coal mine include the main transportation tasks for the working face, transportation roadway, and main transportation shaft, as well as auxiliary transportation tasks for personnel and materials. The specific transportation tasks and distribution of transportation tools are shown in Figure 3.
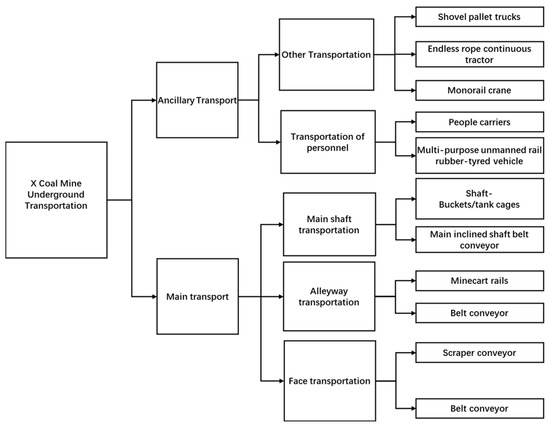
Figure 3.
X distribution of coal mine transportation tasks.
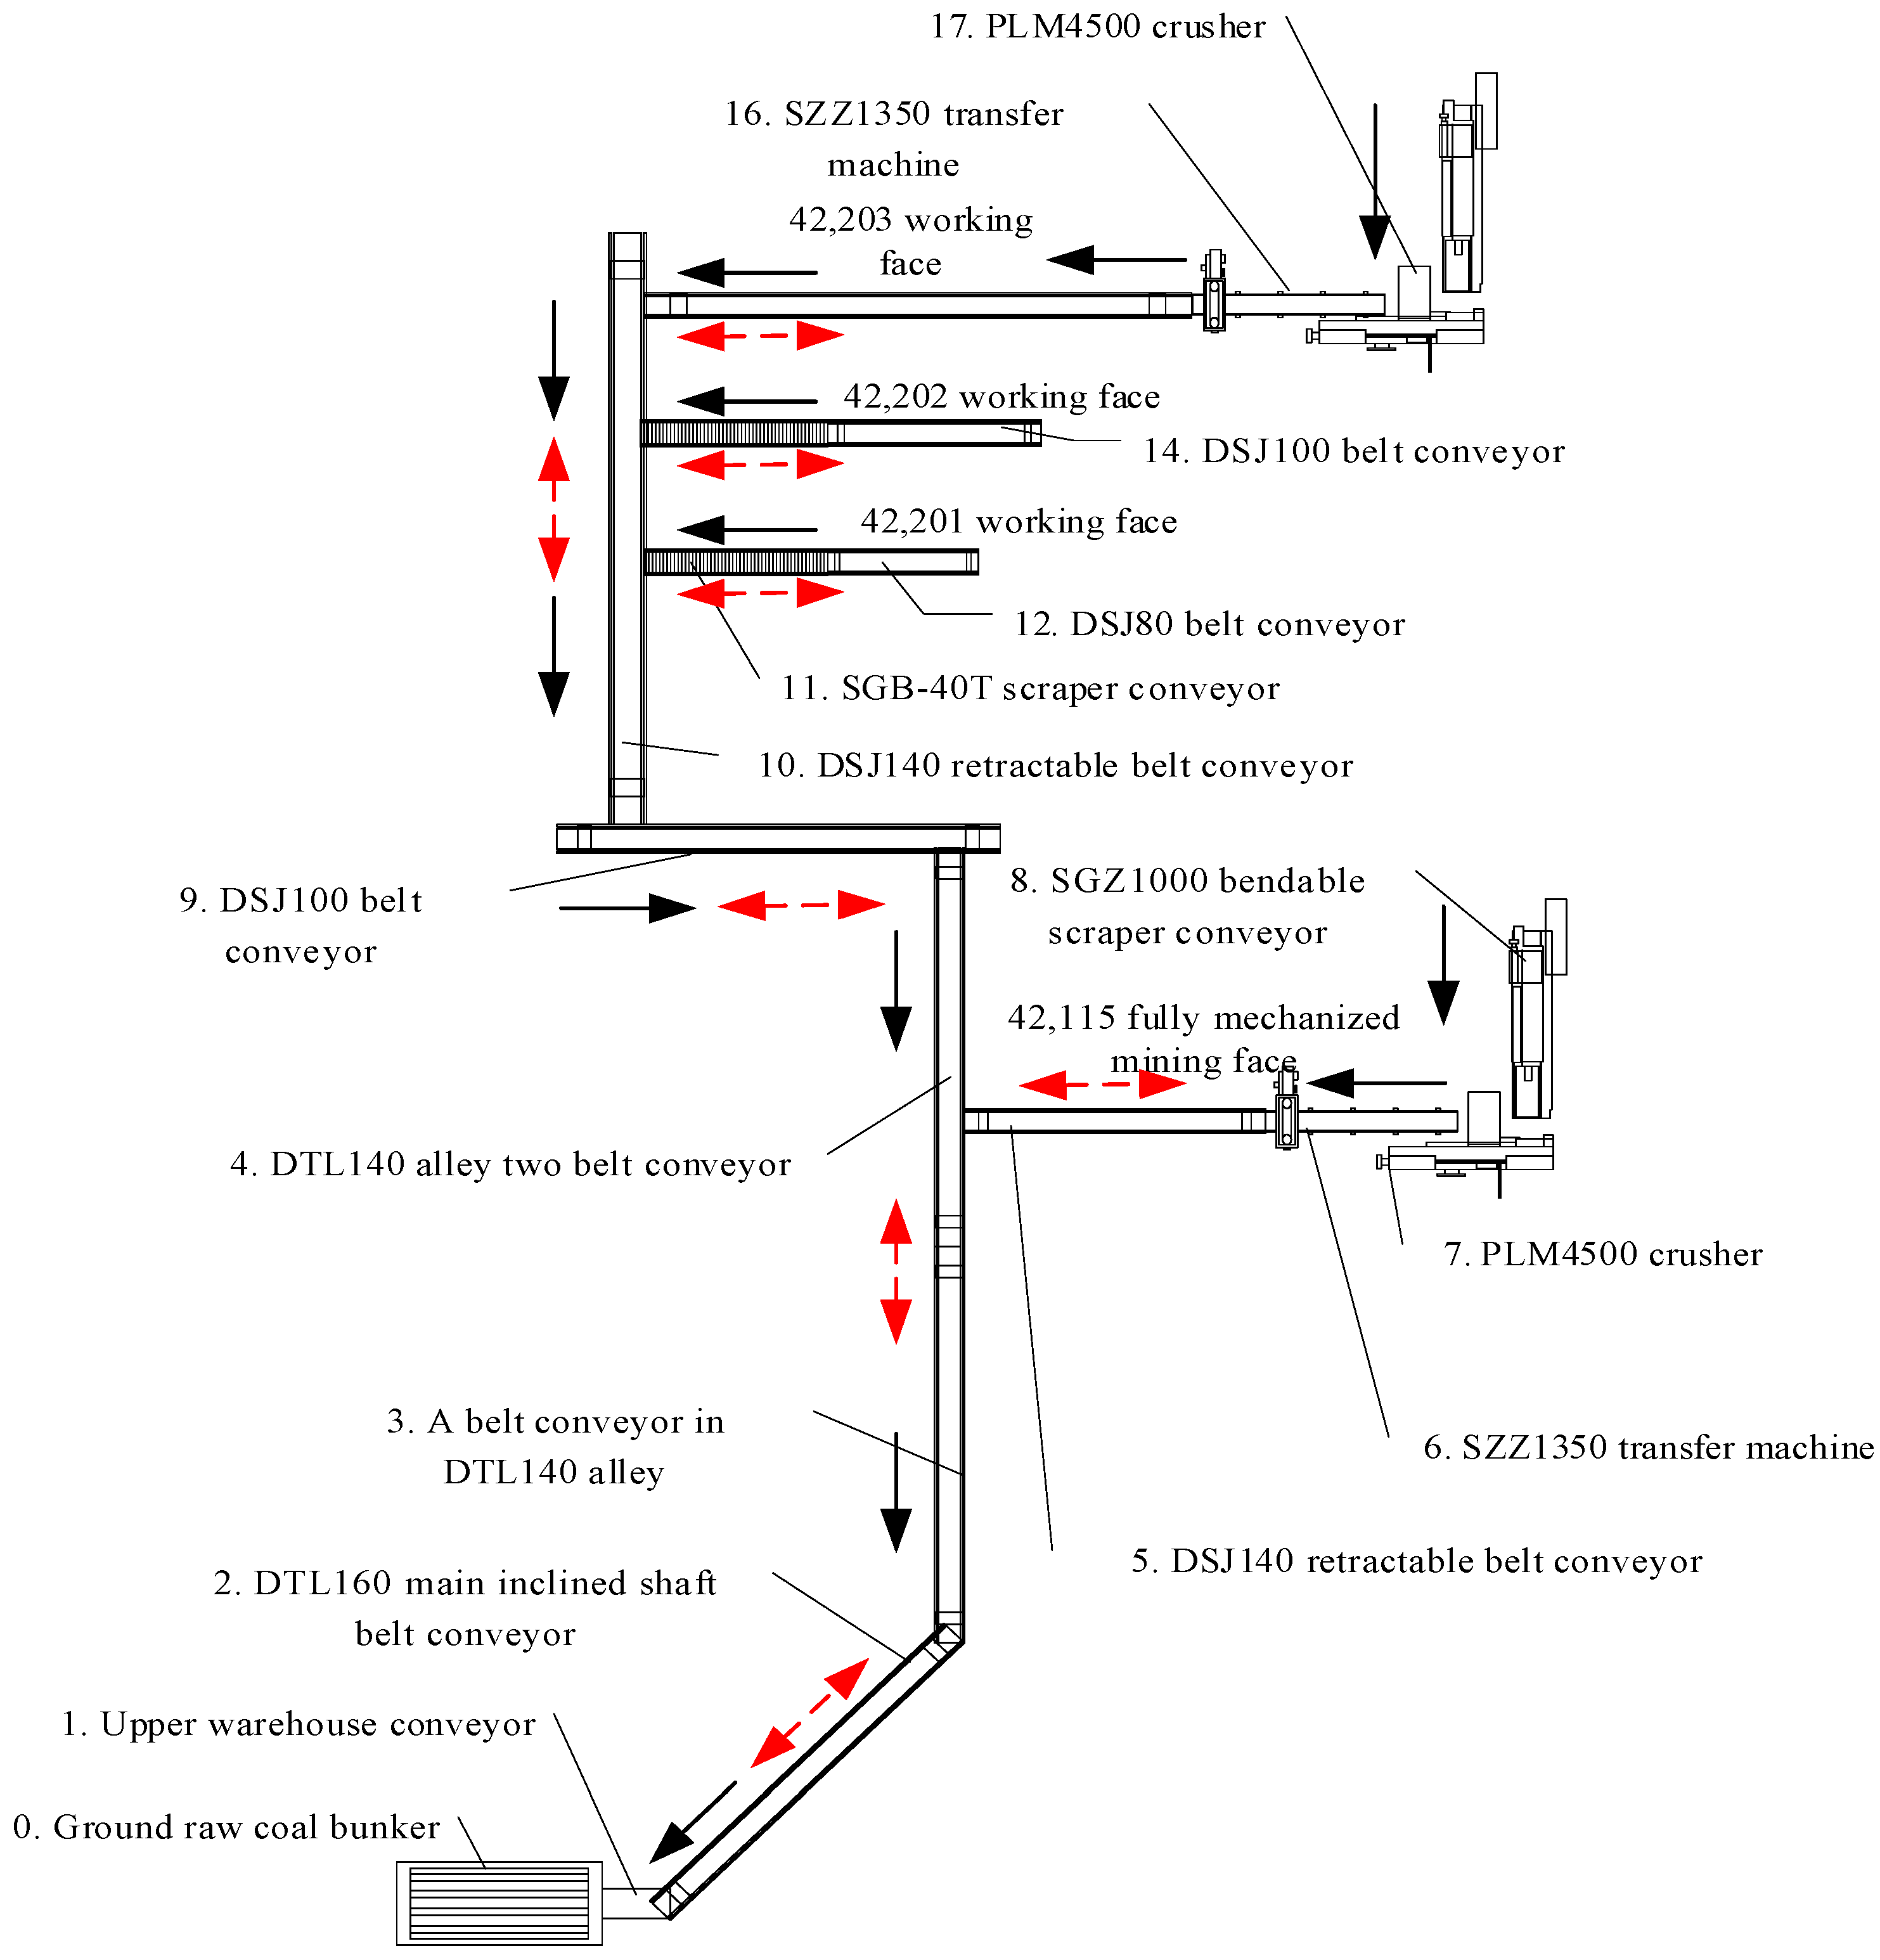
Figure 4 illustrates the main transportation system at X coal mine, which consists of production equipment such as belt conveyors, scraper conveyors, crushers, and loaders, as well as tunnels and coal bunkers. The black arrows represent the flow of coal in the CMTS, while the red arrows represent the flow of materials. According to the distribution of transportation tasks and the knowledge related to coal mine transportation, the related transportation systems of X coal mine are divided into the following categories (as shown in Table 5).

Figure 4.
Components and layout of X CMTS.
Table 5.
Components of X CMTS.
4.2. Constructing Fault Tree Model-CMTS
According to the aforementioned methodology, fault tree model-CMTS is constructed.
Step 1: Using the X coal mine transportation system accident as the top event, represented by “T,” the flat roadway transportation system, inclined roadway transportation system, and lifting transportation system of the X coal mine are represented as intermediate events in the first layer of the accident tree. Take the first-level intermediate events of the CMTS accident as the top events of the accident sub-trees, denoted as “T1, T2, T3,” respectively, to establish the accident sub-tree model of the X coal mine. The risk events for each transportation system, categorized by attribute, are presented in Table 6, Table 7 and Table 8. Next, we will construct FTA models for the CMTS based on the three different types of accidents. Following the accident tree analysis process, a fault tree model of the CMTS is established, as shown in Figure 5. With the help of the expert system and the field investigation in the X coal mine, the risk factors of the coal mine transportation system were determined by the method of Chinese excavation in Section 3.1, as shown in Table 6, Table 7, and Table 8, respectively.
Table 6.
Risk events of the coal mine level roadway transportation system.
Table 7.
Risk events of the coal mine inclined roadway transportation system.
Table 8.
Risk events of the coal mine vertical shaft lifting transportation system.
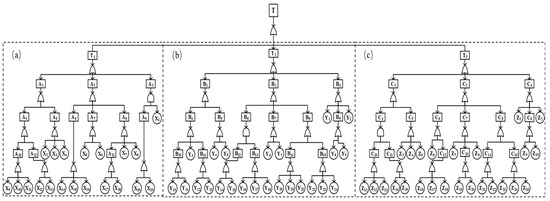
Figure 5.
Construction of fault tree model-CMTS. (a) represents the accident tree of the coal mine level roadway transportation system, (b) represents shows the accident tree of an inclined roadway transportation system in the coal mine, (c) represents shows the accident tree of the coal mine vertical hoisting transportation system.
Figure 5a shows the accident tree of the coal mine level roadway transportation system, in which T1 is the top event, namely the coal mine level transportation accident, and the intermediate event Ai and the basic event Xi are shown in Table 6.
Figure 5b shows the accident tree of an inclined roadway transportation system in the coal mine. The top event is T2, namely the coal mine inclined roadway transportation accident. The main construction process of the fault tree is consistent with the drift transportation accident. The factors represented by the intermediate event Bi and the basic event Yi are shown in Table 7.
Figure 5c shows the accident tree of the coal mine vertical hoisting transportation system, T3 shows the hoisting transportation accident of the top event, and the factors represented by the intermediate event Ci and the basic event Zi are shown in Table 8.
Step 2: In this step, it is necessary to find the structural function of the fault sub-trees of a coal mine transportation accident first. According to Equations (3) and (4), the instantiated Equations (12)–(14) can be expressed as follows, respectively.
The structure function of the fault tree for the level roadway transportation accidents in coal mines is given by Equation (12):
The structure function of the fault tree for the inclined roadway transportation accidents in coal mines is given by Equation (13):
The structure function of the fault tree for the vertical shaft hoisting transportation accidents in coal mines is given by Equation (14):
Next, by using the bottom-up method to simplify the equations mentioned above, the first-order minimal cut sets and second-order minimal cut sets of the CMTS accident tree are obtained as shown in Table 9.
Table 9.
The first-order minimal cut sets and second-order minimal cut sets.
Based on Table 9, it is evident that the coal mine level roadway transportation system has a total of 19 minimal cut sets, comprising 17 first-order minimal cut sets and 2 s-order minimal cut sets. Similarly, the coal mine inclined roadway transportation system exhibits 25 minimal cut sets, including 19 first-order minimal cut sets and 6 s-order minimal cut sets. In the case of the coal mine vertical shaft hoisting transportation system, there are 26 minimal cut sets, with 20 first-order minimal cut sets and 6 s-order minimal cut sets. These findings emphasize that even a single or dual occurrence of basic events can pose significant risks of transportation accidents in coal mines.
Step 3: According to the obtained minimum cut set and the structural importance formula in Section 2.1, the basic event structural importance of coal mine transportation accidents is obtained and ranked. The resulting structural importance of the basic events is presented and ranked in Table 10, Table 11 and Table 12.
Table 10.
Importance of basic event structure of the coal mine level roadway transportation system.
Table 11.
Importance of basic event structure of the coal mine inclined roadway transportation system.
Table 12.
Importance of basic event structure of the coal mine vertical shaft lifting transportation system.
As shown in Table 13, the structural importance of the fault tree is divided into three levels. The higher the importance level, the greater the impact on coal mine transportation accidents.
Table 13.
The classification of structural importance levels for fault tree analysis.
4.3. Mapping the FTA to BN
Step1: the accident tree model obtained in Section 4.2 is transformed into a BN structure using mapping techniques. The resulting mapped Bayesian network structure is shown in Figure 6.
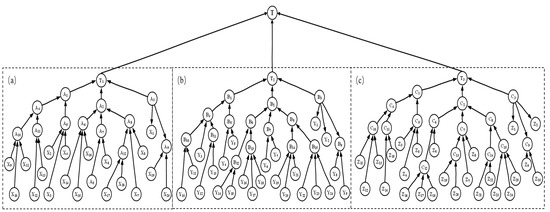
Figure 6.
Bayesian network structure of CMTS. (a) represents the BN structure for the level roadway transportation system in coal mining, (b) represents the BN structure for the inclined roadway transportation system in coal mining, (c) represents the BN structure for the vertical shaft lifting transportation system in coal mining.
Step2: the risk probability frequency of each root node in the transportation systems is calculated using the risk probability frequency formula. Subsequently, the prior probability P(A) of each risk factor in the CMTS is determined using the prior probability calculation formula. The calculated risk probability frequency and prior probabilities P(A) for the CMTS are presented in Table 14, Table 15 and Table 16.
Table 14.
Prior probabilities of risk factors in the coal mine level roadway transportation system.
Table 15.
Prior probabilities of risk factors in the coal mine inclined roadway transportation system.
Table 16.
Prior probabilities of risk factors in the coal mine vertical shaft hoisting transportation system.
Figure 6a shows the BN structure for the level roadway transportation system in coal mining. The risk factor frequencies and prior probabilities can be found in Table 14.
Figure 6b shows the BN structure for the inclined roadway transportation system in coal mining. The risk factor frequencies and prior probabilities can be found in Table 15.
Figure 6c shows the BN structure for the vertical shaft lifting transportation system in coal mining. The risk factor frequencies and prior probabilities can be found in Table 16.
Step 3: Prior probabilities and node logical relationships are updated using GeNIe 2.1 to establish the GeNIe model for the CMTS as shown in Figure 7. In Figure 7, (a) represents the GeNIe model for the level roadway transportation system in coal mining, (b) represents the GeNIe model for the inclined roadway transportation system, and (c) represents the GeNIe model for the vertical shaft lifting transportation system.
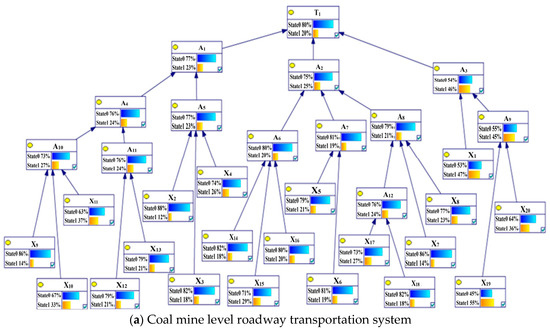
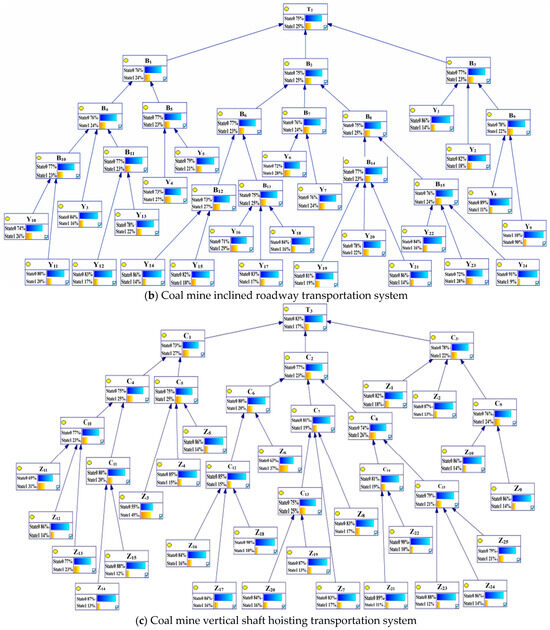
Figure 7.
GeNIe model of CMTS.
Then, using the probability update of the BN, the target node is set as the leaf nodes and, in GeNIe 2.1, its probability is set to 100% for backward reasoning (as shown in Figure 8a). This allows for the determination of the posterior probabilities and importance ranking of each network node under the accident conditions. The analysis results are presented in Table 17, Table 18 and Table 19.

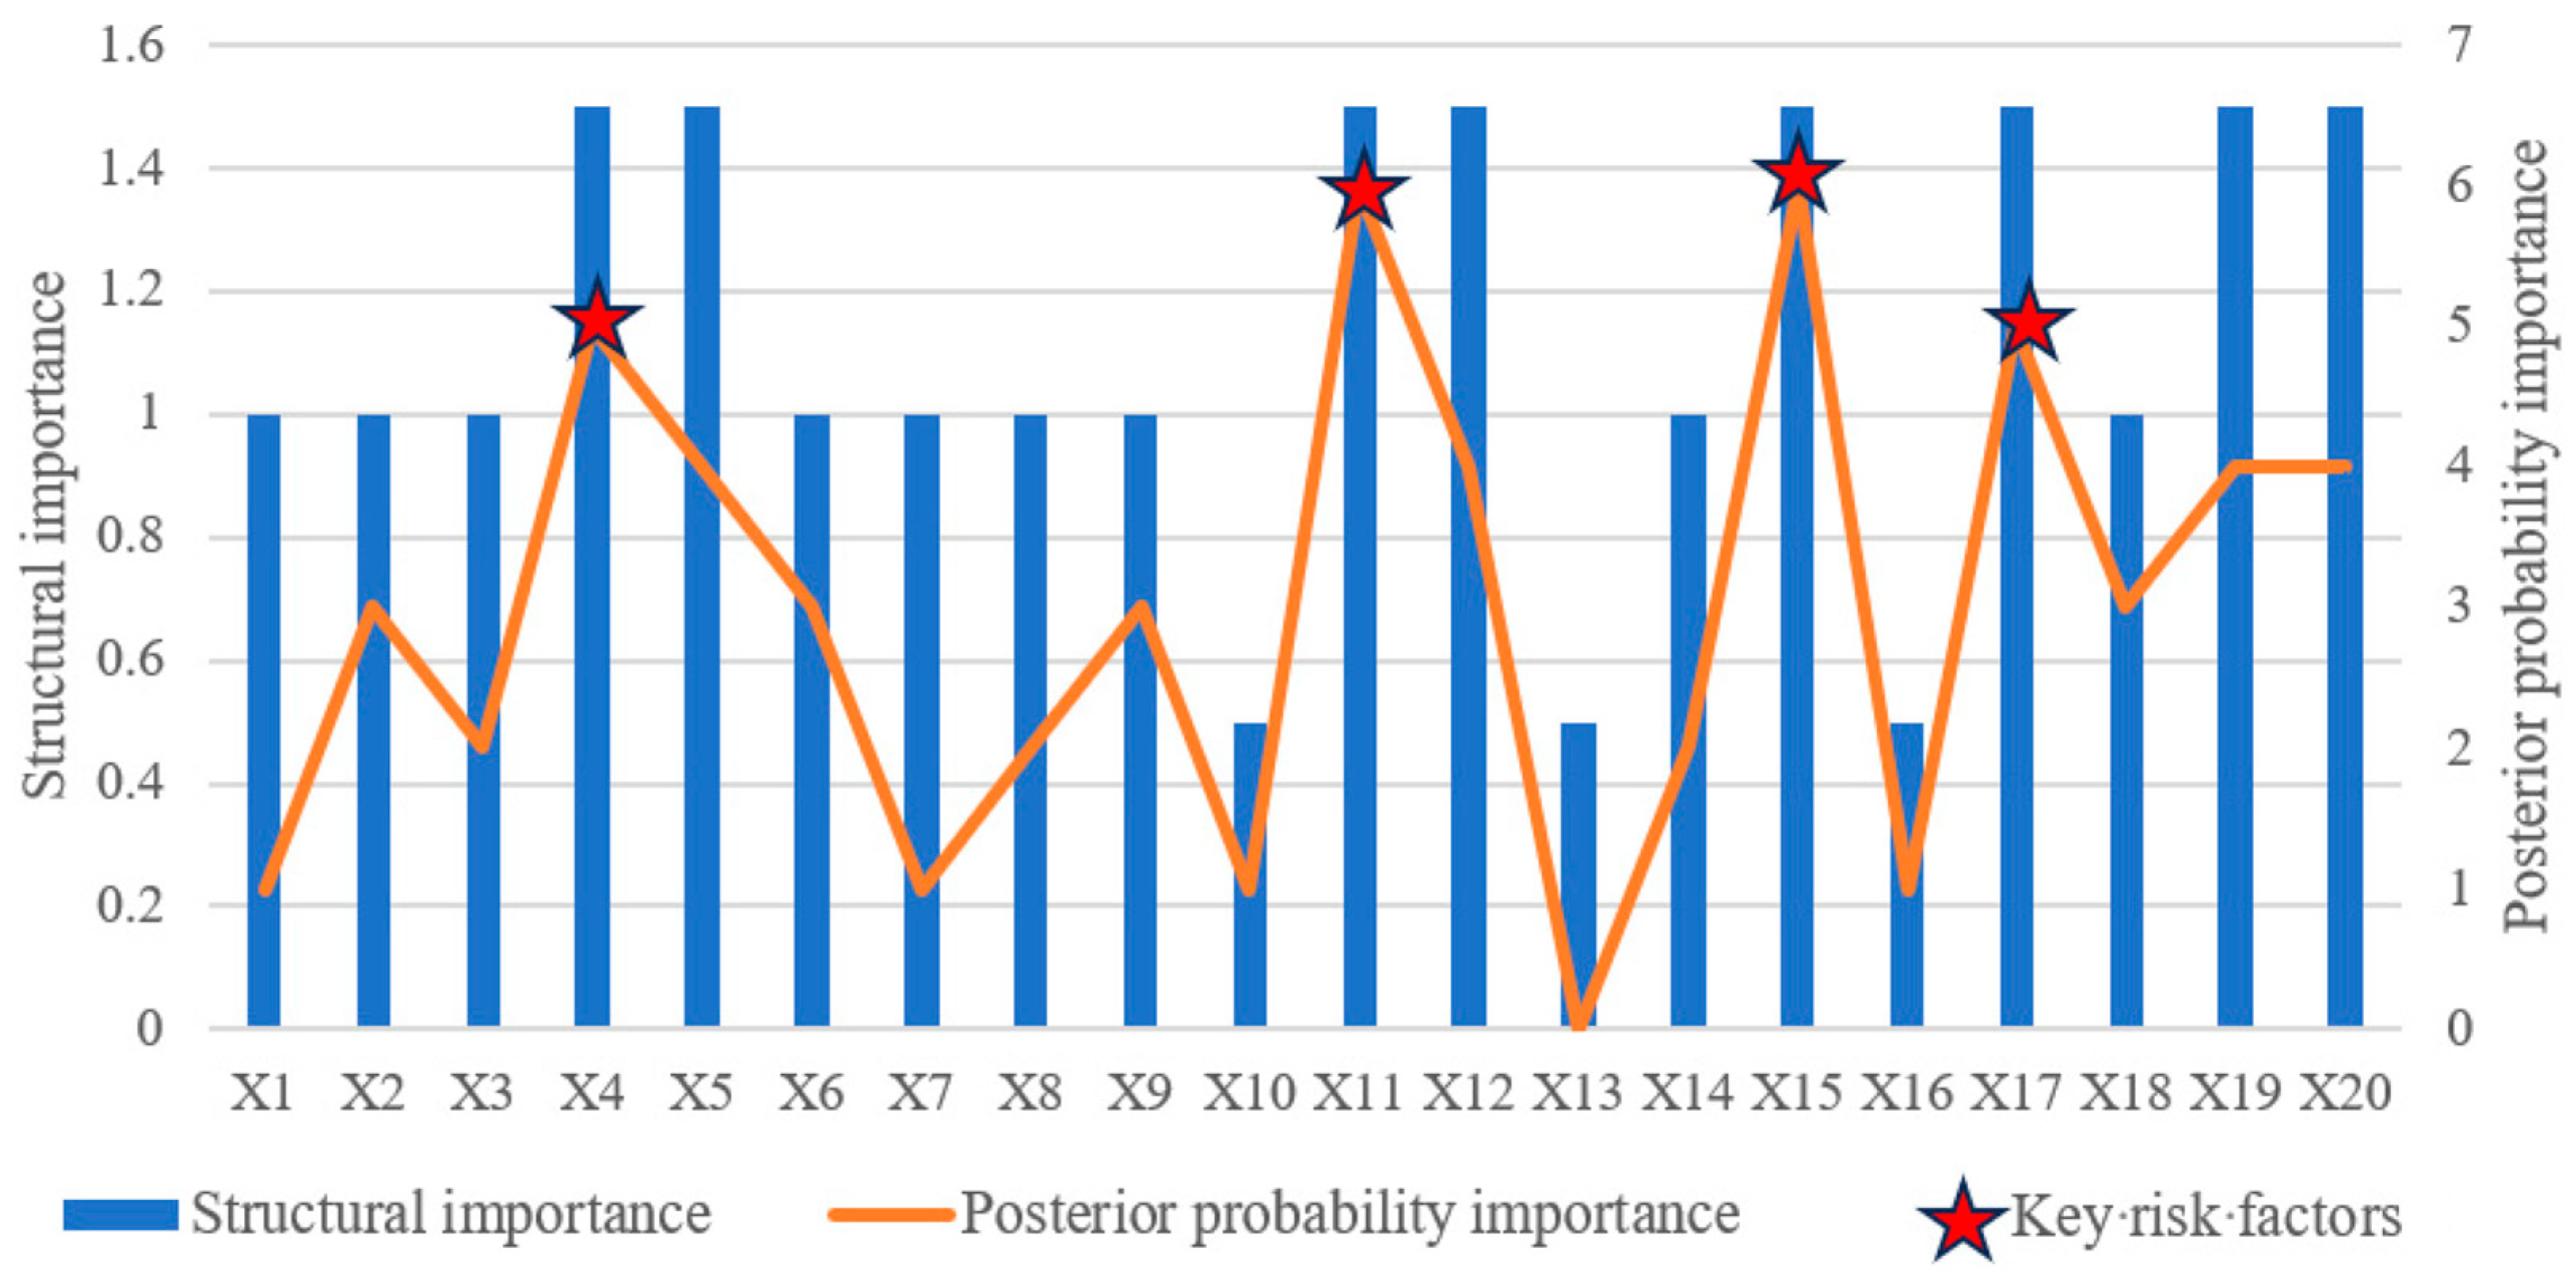
Figure 8.
Comparison of the risk analysis results of the coal mine level roadway transportation system.
Table 17.
Posterior probability of risk factors in the coal mine level roadway transportation system.
Table 18.
The posterior probability of risk factors in the coal mine inclined roadway transportation system.
Table 19.
The posterior probability of risk factors in the coal mine vertical shaft hoisting transportation system.
Analysis of Table 17 reveals that the posterior probabilities of each network node have increased compared to the prior probabilities. Based on the magnitude of the increase, the importance ranking of the posterior probabilities for the nodes is as follows: (X11 Violation of Scraping Vehicle Regulations, X15 Belt Conveyor Belt Breakage) > (X4 Inadequate Information Communication, X17 Controller Failure) > (X5 Improper Equipment Protection, X12 Failure to Pay Attention to Warning Signals, X19 Limited Space, X20 Presence of Obstacles) > (X2 Inappropriate Deployment, X6 Delayed Maintenance, X9 Inappropriate Job Assignment, X18 Rusting of Parts) > (X3 Inadequate Supervision, X8 Failure of Audio-Visual Signals, X14 Deviation of Transporter) > (X1 Insufficient Tunnel Lighting, X7 Failure of Sand Spraying Device, X10 Violation of Roof Support Regulations, X16 Abnormal Speed).
A lower ranking indicates a higher probability of causing risks. Therefore, nodes X11 (Violation of Scraping Vehicle Regulations), X15 (Belt Conveyor Belt Breakage), X4 (Inadequate Information Communication), and X17 (Controller Failure) have a higher probability of causing accidents in the coal mining level roadway transportation system compared to the other factors.
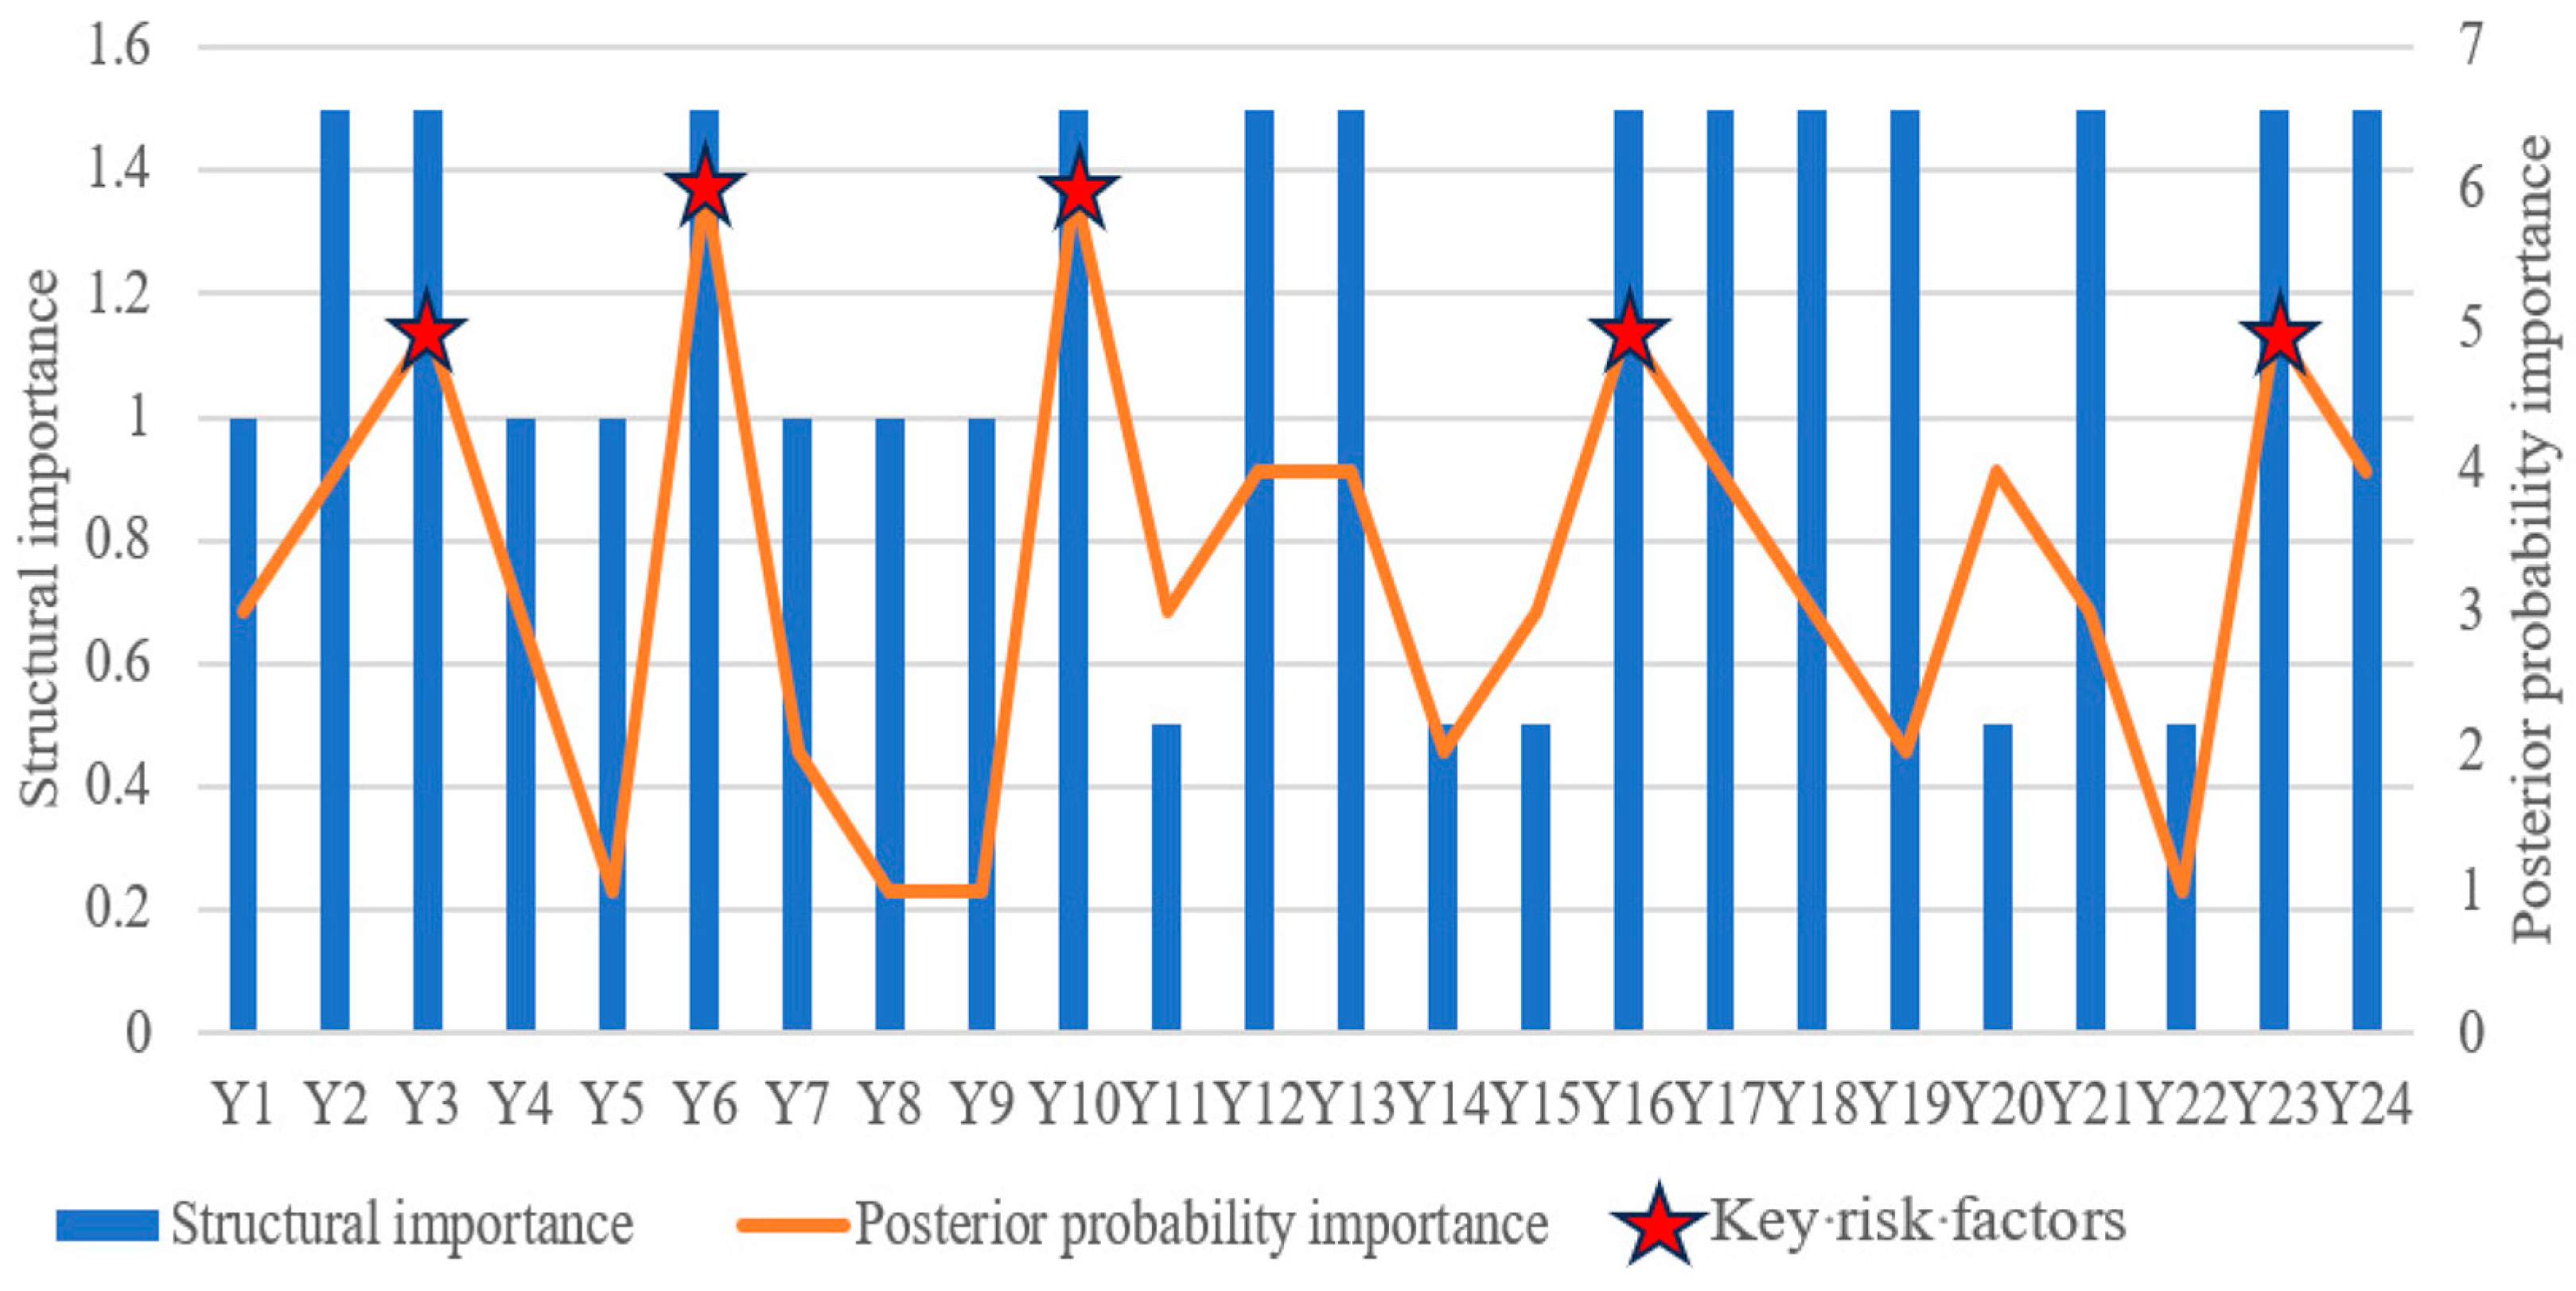
Analysis of Table 18 indicates that the importance ranking of posterior probabilities for nodes in the BN model of the inclined roadway transportation system is as follows:
(Y6 Mine Car Wheel Dislodgment, Y10 Pedestrians during Vehicle Operation) > (Y3 Failure to Issue Warning Signals, Y16 Wear or Corrosion, Y23 Pin Ejection or Fracture) > (Y2 Severe Noise Pollution, Y12 Unauthorized Leave from Post, Y13 Overspeed or Overload Driving, Y17 Insufficient Strength, Y20 Uninserted or Partially Inserted Pins, Y24 Hook, Chain, or Rope Buckle Failure) > (Y1 Uncomfortable Temperature, Y4 Inadequate Staffing, Y11 Failure to Evade Timely, Y15 Sudden Interruption of Operation, Y18 Knotting, Y21 Failure to Hang Hook, Chain) > (Y7 Axle Breakage, Y14 Excessive Acceleration, Y19 Failure to Use Safety Rope) > (Y5 Poor Emergency Response, Y8 Hazardous Gases, Y9 Dust Pollution, Y22 Chain Link Fracture).
This indicates that the risk factors of Y6 (Mine Car Wheel Dislodgment), Y10 (Pedestrians during Vehicle Operation), Y3 (Failure to Issue Warning Signals), Y16 (Wear or Corrosion), and Y23 (Pin Ejection or Fracture) have a significant impact on accidents in the inclined roadway transportation system.
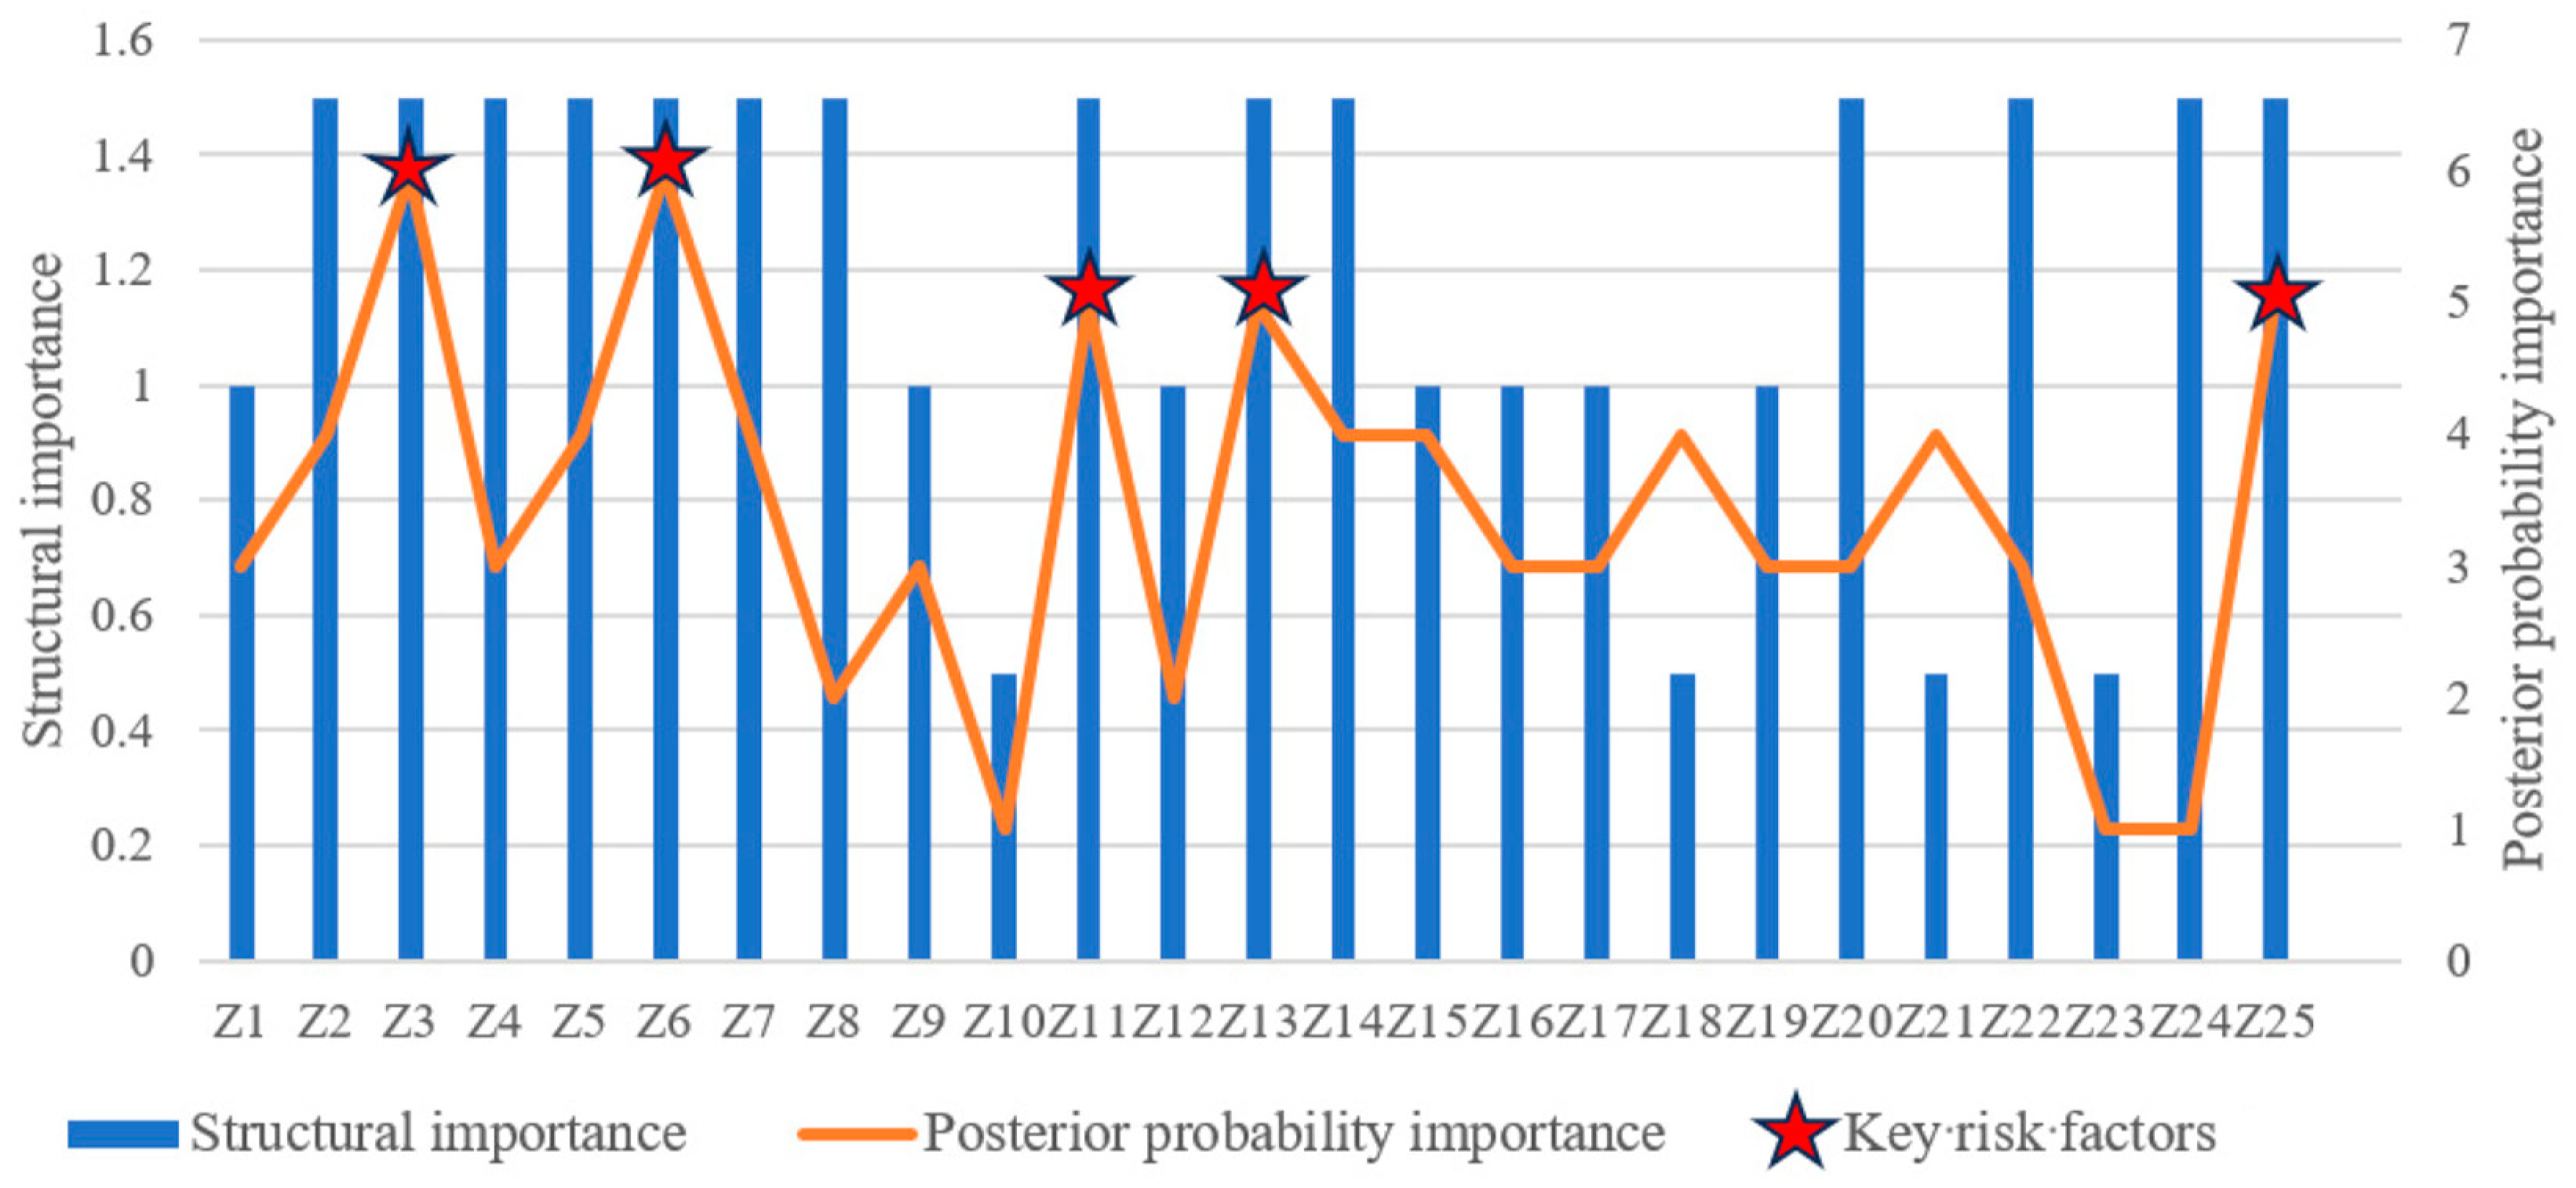
Analysis of Table 19 reveals that the importance ranking of posterior probabilities for nodes in the BN model of the vertical shaft lifting transportation system is as follows: (Z3 Violation of Passage Regulations, Z6 Signal Device Failure) > (Z11 Driver Violation, Z13 Overspeed, Overload, Z25 Connector Failure) > (Z2 Inappropriate Mining Depth, Z5 Violation of Operations, Z7 Equipment Deterioration, Z14 Failure to Provide Warning Alerts, Z15 Failure to Handle Hazards as Required, Z18 Spring Fatigue, Z21 Wear) > (Z1 Inadequate Lighting, Z4 Unauthorized Riding, Z9 Excessive Inclination, Z20 Failure of Leakage Protection, Z22 Corrosion) > (Z8 Overwinding of Container, Z12 Driver Fatigue, Z16 Brake Disc Misalignment, Z17 Brake Shoe Wear, Z19 Leakage) > (Z10 Narrow Passage, Z23 Pin Fracture, Z24 Connector Failure).
This indicates that the risk factors of Z3 (Violation of Passage Regulations), Z6 (Signal Device Failure), Z11 (Driver Violation), Z13 (Overspeed, Overload), and Z25 (Connector Failure) have a significant impact on accidents in the vertical shaft lifting transportation system.
Step 4: in this step, to enhance the accuracy of key factor determination, this study conducted a comparative analysis between the results of structural importance calculation in the fault tree and posterior probability analysis in the Bayesian network. The aim was to identify the top five risk factors with higher probability for subsequent detailed analysis. The comparative analysis results are presented in Figure 8, Figure 9 and Figure 10.
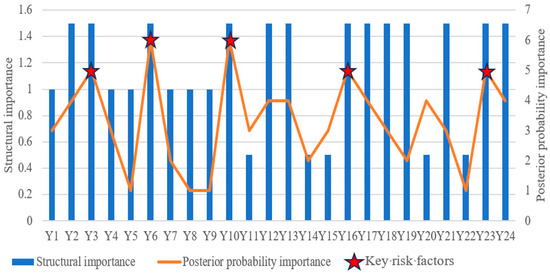
Figure 9.
Comparison of the risk analysis results of the coal mine inclined roadway transportation system.
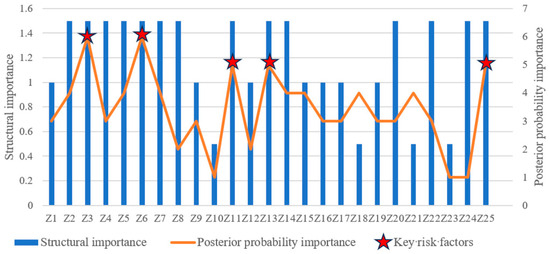
Figure 10.
Comparison of risk analysis results of the coal mine vertical shaft hoisting transportation system.
The analysis results in Figure 8 indicate that X4 (Delayed Communication), X11 (Unauthorized Riding), X15 (Belt Conveyor Belt Breakage), and X17 (Controller Failure) are the major risk factors of the coal mine level roadway transportation system.
The analysis results in Figure 9 indicate that Y6 (Mine Car Wheel Dislodgment), Y10 (Pedestrians during Vehicle Operation), Y3 (Failure to Issue Warning Signals), Y16 (Wear or Corrosion), and Y23 (Pin Ejection or Fracture) are the major risk factors of the coal mine inclined roadway transportation system.
The analysis results in Figure 10 show that Z3 (illegal traffic), Z6 (Signal Device Failure), Z11 (driver violation), Z13 (overspeed and overweight), and Z25 (connector failure) are the main risk factors of the coal mine vertical shaft hoisting transportation system.
4.4. PHA and Pre-Control Measures
Finally, based on the comparative analysis results, a preliminary hazard analysis and relevant countermeasures are proposed for the key risk factors in the coal mine level roadway transportation system (refer to Table 20), inclined roadway transportation system (refer to Table 21), and vertical shaft transportation system (refer to Table 22).
Table 20.
Pre-hazard analysis of the coal mine level roadway transportation system.
Table 21.
Pre-hazard analysis of the coal mine inclined roadway transportation system.
Table 22.
Pre-hazard analysis of the coal mine vertical shaft hoisting transportation system.
5. Conclusions and Future Work
This paper presents a coal mine transportation system accident analysis method based on FTA-BN-PHA, which utilizes FTA, BN, and PHA to identify major risk factors and reduce the probability of transportation accidents. The main innovations and usability regarding ensuring the safe operation of the CMTS are as follows:
- (1)
- This paper introduces an integrated risk analysis model for CMTS by combining the principles of FTA, BN, and PHA. Its execution logic can be summarized as follows: a CMTS risk and safety assessment FTA model is transformed into a BN-based CMTS accident network model by calculating the posterior probabilities of various risk factors and determining the main risk factors. Then, a risk-matrix-based PHA method is used to classify the levels of danger and provide effective pre-control measures for CMTS.
- (2)
- The usability of our study holds significant practical value in the field of coal mine risk management. Through the analysis of real-world case studies, our study provides valuable insights into effective strategies and practices for mitigating risks in SMTS, which can be directly applied by coal mine operators to enhance safety measures and reduce potential hazards. Furthermore, our research offers engineering guidance by providing recommendations and guidelines for implementing risk management techniques in CMTS, which can also assist engineers and decision makers in making informed decisions to ensure the safety and efficiency of coal mining operations.
- (3)
- Due to the complex and special working environment of the coal mine conveying system, there are many types of factors that affect the safety of production, and there are various differences between different coal mines, which have the characteristics of unobserved heterogeneity [45] and ambiguity. Therefore, the risk analysis method that does not take into account the above characteristics has certain limitations in determining the degree of risk, and it is debatable whether this method can be applied to most coal mine transportation systems. In the follow-up system research, the polymorphism of risk nodes should be considered and the concepts of fuzzy state, digital twin, and game model [46] should be introduced to make the calculation of risk probability more accurate.
Author Contributions
Conceptualization, L.H.; Methodology, Y.W. (Yue Wu); Data curation, Y.W. (Yafei Wang), J.G., T.X. and N.Z.; Writing—original draft, R.P.; Supervision, X.Z. All authors have read and agreed to the published version of the manuscript.
Funding
This research is supported by the China National Natural Science Foundation 52204174, 52074210, China Postdoctoral Science Foundation 2022MD723828, Shaanxi Postdoctoral Science Foundation 2023BSHTBZZ44, and Shaanxi University Youth Innovation Team Foundation 23JP096.
Data Availability Statement
The data presented in this study are available on request from the corresponding author.
Conflicts of Interest
The authors declare no conflict of interest.
References
- Martyushev, N.V.; Malozyomov, B.V.; Filina, O.A.; Sorokova, S.N.; Efremenkov, E.A.; Valuev, D.V.; Qi, M. Stochastic Models and Processing Probabilistic Data for Solving the Problem of Improving the Electric Freight Transport Reliability. Mathematics 2023, 11, 4836. [Google Scholar] [CrossRef]
- Miao, D.; Lv, Y.; Yu, K.; Liu, L.; Jiang, J. Research on coal mine hidden danger analysis and risk early warning technology based on data mining in China. Process Saf. Environ. Protect. 2023, 171, 1–17. [Google Scholar] [CrossRef]
- Xie, C.; Li, H.; Chen, L. A Three-Party Decision Evolution Game Analysis of Coal Companies and Miners under China’s Government Safety Special Rectification Action. Mathematics 2023, 11, 4750. [Google Scholar] [CrossRef]
- Wang, Y.; Liu, Y.; Ding, K.; Wei, S.; Zhang, X.; Zhao, Y. Dynamic Optimization Method of Knowledge Graph Entity Relations for Smart Maintenance of Cantilever Roadheaders. Mathematics 2023, 11, 4833. [Google Scholar] [CrossRef]
- Guofa, W.; Shixin, G.; Kai, S. Intelligent security control technology system and high-quality development countermeasures for coal mines. Mining Saf. Environ. Protect. 2023, 50, 1–8. [Google Scholar]
- Zhang, Y.; Wang, S.; Yao, J.; Tong, R. The impact of behavior safety management system on coal mine work safety: A system dynamics model of quadripartite evolutionary game. Resour. Policy 2023, 82, 103497. [Google Scholar] [CrossRef]
- Tang, Y.; Tan, S.; Zhou, D. An improved failure mode and effects analysis method using belief Jensen–Shannon divergence and entropy measure in the evidence theory. Arab. J. Sci. Eng. 2023, 48, 7163–7176. [Google Scholar] [CrossRef]
- Li, J.; Wang, Y.; Chen, A.; Wang, G.; Yao, X.; Wang, T. Construction and empirical testing of comprehensive risk evaluation methods from a multi-dimensional risk matrix perspective: Taking specific types of natural disasters risk in China as an example. Nat. Hazards 2023, 117, 1245–1271. [Google Scholar] [CrossRef]
- Li, X.; Hao, S.; Wu, T.; Zhou, W.; Zhang, J. Data Mining Technology and Its Applications in Coal and Gas Outburst Prediction. Sustainability 2023, 15, 11523. [Google Scholar] [CrossRef]
- Lei, K.; Qiu, D.; Zhang, S.; Wang, Z.; Jin, Y. Coal mine fire emergency rescue capability assessment and emergency disposal research. Sustainability 2023, 15, 8501. [Google Scholar] [CrossRef]
- Tutak, M.; Brodny, J. Progress towards the innovation potential of the European union member states using grey relational analysis and multidimensional scaling methods. Decis. Mak. Appl. Manag. Eng. 2023, 6, 186–218. [Google Scholar] [CrossRef]
- Cui, J.; Kong, Y.; Liu, C.; Cai, B.; Khan, F.; Li, Y. Failure probability analysis of hydrogen doped pipelines based on the Bayesian network. Eng. Fail. Anal. 2024, 156, 107806. [Google Scholar] [CrossRef]
- Wang, C.; Liu, Y.; Lian, X.; Luo, J.; Liang, C.; Ma, H. Dynamic risk assessment of plugging and abandonment operation process of offshore wells based on Dynamic Bayesian Network. Ocean. Eng. 2023, 270, 113625. [Google Scholar] [CrossRef]
- Wang, Y.; Wang, Y.; Ren, W.; Jiang, Z. Knowledge driven multiview bill of material reconfiguration for complex products in the digital twin workshop. Int. J. Adv. Manuf. Technol. 2024, 130, 3469–3480. [Google Scholar] [CrossRef]
- Roy, P.; Pal, S.C.; Chakrabortty, R.; Saha, A.; Chowdhuri, I. A systematic review on climate change and geo-environmental factors induced land degradation: Processes, policy-practice gap and its management strategies. Geol. J. 2023, 58, 3487–3514. [Google Scholar] [CrossRef]
- Chen, F.; Wang, C.; Wang, J.; Zhi, Y.; Wang, Z. Risk assessment of chemical process considering dynamic probability of near misses based on Bayesian theory and event tree analysis. J. Loss Prev. Process Ind. 2020, 68, 104280. [Google Scholar] [CrossRef]
- Mateusz, P.; Marek, M. Preliminary Risk Analysis of Low Pressure Railway Transport. J. KONBiN 2021, 51, 97–122. [Google Scholar]
- Amin, M.T.; Khan, F.; Ahmed, S.; Imtiaz, S. A data-driven Bayesian network learning method for process fault diagnosis. Process Saf. Environ. Protect. 2021, 150, 110–122. [Google Scholar] [CrossRef]
- Zeng, Z.; Fang, Y.; Zhai, Q.; Du, S. A Markov reward process-based framework for resilience analysis of multistate energy systems under the threat of extreme events. Reliab. Eng. Syst. Saf. 2021, 209, 107443. [Google Scholar] [CrossRef]
- Kabir, S. A fuzzy data-driven reliability analysis for risk assessment and decision making using Temporal Fault Trees. Decis. Anal. J. 2023, 8, 100265. [Google Scholar] [CrossRef]
- Zio, E.; Miqueles, L. Digital Twins in safety analysis, risk assessment and emergency management. Reliab. Eng. Syst. Saf. 2024, 246, 110040. [Google Scholar] [CrossRef]
- Yazdi, M.; Mohammadpour, J.; Li, H.; Huang, H.Z.; Zarei, E.; Pirbalouti, R.G.; Adumene, S. Fault tree analysis improvements: A bibliometric analysis and literature review. Qual. Reliab. Eng. Int. 2023, 39, 1639–1659. [Google Scholar] [CrossRef]
- Zhang, R.; Geng, L.; Liu, W. Research on static fault tree analysis method for inerting system safety based on random number generation. Aircr. Eng. Aerosp. Technol. 2023, 95, 649–657. [Google Scholar] [CrossRef]
- Ren, X.; Du, Z.; Wang, J.; Yang, F.; Su, T.; Wei, W. Safety decision analysis of collapse accident based on “accident tree–analytic hierarchy process”. Nonlinear Eng. 2023, 12, 20220295. [Google Scholar] [CrossRef]
- Cheng, X.; Long, M.; He, W.; Zhu, H. Milling Fault Detection Method Based on Fault Tree Analysis and Hierarchical Belief Rule Base. Comput. Syst. Sci. Eng. 2023, 46, 2821. [Google Scholar] [CrossRef]
- He, L.; Tang, T.; Hu, Q.; Cai, Q.; Li, Z.; Tang, S.; Wang, Y. Integration of interpretive structural modeling with fuzzy Bayesian network for risk assessment of tunnel collapse. Math. Probl. Eng. 2021, 2021, 1–14. [Google Scholar] [CrossRef]
- Li, X.; Chen, C.; Yang, F. Exploring hazardous chemical explosion accidents with association rules and Bayesian networks. Reliab. Eng. Syst. Saf. 2023, 233, 109099. [Google Scholar] [CrossRef]
- Dao, U.; Sajid, Z.; Khan, F.; Zhang, Y. Safety analysis of blended hydrogen pipelines using dynamic object-oriented bayesian network. Int. J. Hydrogen Energy 2024, 52, 841–856. [Google Scholar] [CrossRef]
- Hunte, J.L.; Neil, M.; Fenton, N.E. A hybrid Bayesian network for medical device risk assessment and management. Reliab. Eng. Syst. Saf. 2024, 241, 109630. [Google Scholar] [CrossRef]
- Sakar, C.; Sokukcu, M. Dynamic analysis of pilot transfer accidents. Ocean. Eng. 2023, 287, 115823. [Google Scholar] [CrossRef]
- Yang, J.; Zhao, J.; Shao, L. Risk Assessment of Coal Mine Gas Explosion Based on Fault Tree Analysis and Fuzzy Polymorphic Bayesian Network: A Case Study of Wangzhuang Coal Mine. Processes 2023, 11, 2619. [Google Scholar] [CrossRef]
- Wang, Y.; Zhang, J.; Wu, G. Bayesian-based traffic safety evaluation study for driverless infiltration. Appl. Sci. 2023, 13, 12291. [Google Scholar] [CrossRef]
- Zhang, D.; Han, Z.; Zhang, K.; Zhang, J.; Zhang, M.; Zhang, F. Use of Hybrid Causal Logic Method for Preliminary Hazard Analysis of Maritime Autonomous Surface Ships. J. Mar. Sci. Eng. 2022, 10, 725. [Google Scholar] [CrossRef]
- Zhu, T.; Hu, J.; Wen, G.; Zhou, T. Research on Detection and Safety Analysis of Unfavorable Geological Bodies Based on OCTEM-PHA. Remote Sens. 2023, 15, 3888. [Google Scholar] [CrossRef]
- Dos Santos Nicolau, A.; Souto, E.J.; Melo, P.F.F. A Radiological and Chemical Fuzzy Risk Analysis of a Uf6 Enrichment Facility. SSRN 2024, 4686113. [Google Scholar] [CrossRef]
- Xing, Z.; Zhao, S.; Guo, W.; Meng, F.; Guo, X.; Wang, S.; He, H. Coal resources under carbon peak: Segmentation of massive laser point clouds for coal mining in underground dusty environments using integrated graph deep learning model. Energy 2023, 285, 128771. [Google Scholar] [CrossRef]
- Zhang, C.; Wang, P.; Wang, E.; Chen, D.; Li, C. Characteristics of coal resources in China and statistical analysis and preventive measures for coal mine accidents. Int. J. Coal Sci. Technol. 2023, 10, 22. [Google Scholar] [CrossRef] [PubMed]
- Wu, B.; Wang, J.; Zhong, M.; Xu, C.; Qu, B. Multidimensional Analysis of Coal Mine Safety Accidents in China–70 Years Review. Min. Metall. Explor. 2023, 40, 253–262. [Google Scholar] [CrossRef]
- Wang, Y.; Fu, G.; Lyu, Q.; Li, X.; Chen, Y.; Wu, Y.; Xie, X. Modelling and analysis of unsafe acts in coal mine gas explosion accidents based on network theory. Process Saf. Environ. Protect. 2023, 170, 28–44. [Google Scholar]
- Wei, B.; Li, Y.; Liu, G.; Zhao, Y. Risk Assessment for Vehicle Injury Accidents in Non-Coal Mines Based on Bow-Tie Model. Int. J. Wire. Mob. Comput. 2023, 24, 101–111. [Google Scholar] [CrossRef]
- Pandey, B.P.; Mishra, D.P. Developing an Alternate Mineral Transportation System by Evaluating Risk of Truck Accidents in the Mining Industry—A Critical Fuzzy DEMATEL Approach. Sustainability 2023, 15, 6409. [Google Scholar] [CrossRef]
- Andrews, J.; Tolo, S. Dynamic and dependent tree theory (D2T2): A framework for the analysis of fault trees with dependent basic events. Reliab. Eng. System Saf. 2023, 230, 108959. [Google Scholar] [CrossRef]
- Shi, D.; Gan, S.; Zurada, J.; Wang, F.; Wang, Y.; Guan, J. Research on the causes of earthwork foundation pit collapse based on Fault tree and Bayesian network. In Proceedings of the 57th Hawaii International Conference on System Sciences, Waikiki, HI, USA, 3–6 January 2024. [Google Scholar]
- Xiao, Q.; Li, Y.; Luo, F.; Liu, H. Analysis and assessment of risks to public safety from unmanned aerial vehicles using fault tree analysis and Bayesian network. Technol. Soc. 2023, 73, 102229. [Google Scholar] [CrossRef]
- Hamed, M.M.; AlShaer, A. Analysis of duration between crashes using a hazard-based duration approach with heterogeneity in means and variances: Some new evidence. Anal. Methods Accid. Res. 2023, 39, 100283. [Google Scholar] [CrossRef]
- Wang, Y.; Wang, Y.; Zhang, J.; Li, J.; Wu, Y. Research on the decision-making method of coal order price and coal purchase quantity based on prediction. Comput. Ind. Eng. 2024, 188, 109885. [Google Scholar] [CrossRef]

Disclaimer/Publisher’s Note: The statements, opinions and data contained in all publications are solely those of the individual author(s) and contributor(s) and not of MDPI and/or the editor(s). MDPI and/or the editor(s) disclaim responsibility for any injury to people or property resulting from any ideas, methods, instructions or products referred to in the content. |
© 2024 by the authors. Licensee MDPI, Basel, Switzerland. This article is an open access article distributed under the terms and conditions of the Creative Commons Attribution (CC BY) license (https://creativecommons.org/licenses/by/4.0/).