Abstract
Severe acute respiratory syndrome coronavirus 2 (SARS-CoV-2) is a novel respiratory virus that causes coronavirus disease 2019 (COVID-19). Symptoms of COVID-19 range from mild to severe illness. It was observed that disease progression in COVID-19 patients depends on their immune response, especially in elderly patients whose immune system suppression may put them at increased risk of infection. Human T-cell lymphotropic virus type-I (HTLV-I) attacks the CD4+ T cells (T cells) of the immune system and leads to immune dysfunction. Co-infection with HTLV-I and SARS-CoV-2 has been reported in recent studies. Modeling HTLV-I and SARS-CoV-2 co-infection can be a helpful tool to understand the in-host co-dynamics of these viruses. The aim of this study was to construct a model that characterizes the in-host dynamics of HTLV-I and SARS-CoV-2 co-infection. By considering the mobility of the viruses and cells, the model is represented by a system of partial differential equations (PDEs). The system contains two independent variables, time t and position x, and seven dependent variables for representing the densities of healthy epithelial cells (ECs), latent SARS-CoV-2-infected ECs, active SARS-CoV-2-infected ECs, SARS-CoV-2, healthy T cells, latent HTLV-I-infected T cells and active HTLV-I-infected T cells. We first studied the fundamental properties of the solutions of the system, then deduced all steady states and proved their global properties. We examined the global stability of the steady states by constructing appropriate Lyapunov functions. The analytical results were illustrated by performing numerical simulations. We discussed the effect of HTLV-I infection on COVID-19 progression. The results suggest that patients with HTLV-I have a weakened immune response; consequently, their risk of COVID-19 infection may be increased.
MSC:
35B35; 37N25; 92B05
1. Introduction
In recent years, several types of viruses that target the human body have spread, some of which cause serious diseases and may even lead to death. The spread of these diseases has a significant effect on the global health burden. Examples of such viruses are human immunodeficiency virus class-1 (HIV-1), human T-cell lymphotropic virus class-I (HTLV-I), hepatitis B (and C) viruses, influenza virus, Ebola virus, chikungunya virus, dengue virus, Zika virus, and Middle East Respiratory Syndrome coronavirus. On December 2019, a novel respiratory virus appeared, severe acute respiratory syndrome coronavirus 2 (SARS-CoV-2). SARS-CoV-2 is the causative agent of coronavirus disease 2019 (COVID-19). This pandemic swept around the world and caused the death of millions of people [1]. Since the beginning of this pandemic, the efforts of researchers and scientists from several disciplines have been directed to find different ways to confront this pandemic, such as the synthesis of vaccines and antiviral drugs [2]. On the other hand, governments implemented several measures to reduce the spread of the pandemic.
SARS-CoV-2 is an RNA virus from the Coronaviridae family. This virus is transmitted to individuals when exposed to the fluids of the respiratory system that contain viruses. After entering the human body, the virus targets epithelial cells (ECs) in the respiratory tract [3]. the symptoms of COVID-19 include rhinitis, headache, myalgia, cough, dyspnea, fever, and sore throat. The body’s immunity is an important element in confronting emerging viruses. The progression of the infection in COVID-19 patients depends on the response of the immune system to the virus, especially in elderly patients, whose immunosuppression may predispose them to an increased risk of infection [4].
HTLV-I is a fetal virus that attacks humans. It is a blood-borne virus and sexually transmitted infection [5]. HTLV-I retrovirus attacks CD4T cells (T cells,) which are one the most effective components of the adaptive immune response. This leads to immune dysfunction in HTLV-I patients [6]. Infection by HTLV-I can cause a variety of symptoms that lead to fatal diseases; the most well-known diseases associated with HTLV-I infection are HTLV-I-associated myelopathy/tropical spastic paraparesis (HAM/TSP) and adult T-cell leukemia (ATL). Asquith and Bangham [7] presented an experimental study explaining how HTLV-I infection occurs and persists. T cells infected with HTLV-I are, in fact, divided into two distinct compartments, latent and active. Latent HTLV-I-infected cells involve the viral DNA but are incapable of generating it, so until they are activated, they cannot infect susceptible T cells. Active HTLV-I-infected T cells may then convert to ATL cells.
B cells, cytotoxic T lymphocytes (CTLs), and T cells are central elements of adaptive immunity. B cells and CTLs are both detected in the blood of COVID-19 patients about one week after the onset of symptoms [8]. B cells produce antibodies to neutralize SARS-CoV-2 [9]. CTL is an essential component controlling HTLV-I related diseases by killing viral-infected cells [7,10]. T cells are essential for the processing of both CTLs and B cells [8]. Sajjadi et al. [11] provided an overview of the pathogenesis of both HTLV-I and SARS-CoV-2 infections and on their similarities in stimulating the immune response.
Co-infections of COVID-19 and other diseases have become the interest of many scientists and researchers. Zhu et al. [12] reported that 94.2% of individuals infected with COVID-19 were also co-infected with many other types of micro-organisms, such as viruses, bacteria, and fungi. Co-infections with HTLV-I and SARS-CoV-2 were reported [6,13,14,15].
1.1. Mathematical Models of In-Host HTLV-I and SARS-CoV-2 Single Infections
Mathematical modeling of in-host viral dynamics has attracted the attention of researchers. Mathematical models and their analyses are useful tools for better understanding in-host virus dynamics, enabling the prediction of viral progression and the development of anti-viral treatment strategies.
1.1.1. SARS-CoV-2 Single-Infection Model
Hernandez-Vargas and Velasco-Hernandez [16] presented a SARS-CoV-2 single-infection model with limited target cells as:
where t is the time; , , and are the densities of healthy, latent, and active ECs, respectively; and is the concentration of SARS-CoV-2 particles. In [17], the death and reproduction of healthy ECs were considered. Formulated models [16,17] were modified and extended by taking into account the influence of the immune response [18,19,20,21,22,23,24], drug therapies [25,26,27], and time delay [28]. The stability of in-host COVID-19 single-infection models was investigated [22,23,24,28,29].
1.1.2. HTLV-I Single-Infection Models
The latent HTLV-I single-infection model (ignoring the ATL) is given as [30,31]:
where , , and are the densities of healthy, latent, and active T cells, respectively. Different biological processes were included in the modeling of the infection of HTLV-I by incorporating (i) CTL immunity [32,33,34,35,36], (ii) active T cells mitosis [37,38,39,40,41], and (iii) time delay [33,42,43,44,45].
1.1.3. HTLV-I and SARS-CoV-2 Co-Infection Model
From 2020 to 2022, some epidemiological models were developed to describe the between-host transmission of COVID-19 co-infection with other diseases such as bacteria/COVID-19 [46], tuberculosis/COVID-19 [47], Dengue/COVID-19 [48], Dengue/HIV/COVID-19 [49], ZIKV/COVID-19 [50], HIV/COVID-19 [51], and influenza/COVID-19 [52]. On the other hand, virological models that describe the in-host dynamics of SARS-CoV-2 with co-infection with other micro-organisms have been investigated in recent studies: influenza A virus/SARS-CoV-2 [53,54], malaria/SARS-CoV-2 [55], HIV/SARS-CoV-2 [56], and bacteria/ SARS-CoV-2 [57]. To formulate an HTLV-I and SARS-CoV-2 co-infection model, Elaiw et al. [58] considered the following factors:
- Factor 1
- The model contains seven interplaying populations: healthy ECs (X), latent SARS-CoV-2-infected ECs (N), active SARS-CoV-2-infected ECs (Y), SARS-CoV-2 particles (V), healthy T cells (U), latent HTLV-I-infected T cells (L), and active HTLV-I-infected T cells (A).
- Factor 2
- The healthy T cells and ECs are the targets of HTLV-I and SARS-CoV-2, respectively [16,30].
- Factor 3
- The healthy T cells help the CTLs to destroy the active SARS-CoV-2-infected ECs at rate , which expand at rate [56].
- Factor 4
- The active HTLV-I-infected cells are replicated with rate , some of which are converted into latent infected, and the remainder stay active, where, [40,59].
Based on these factors, the HTLV-I and SARS-CoV-2 co-infection model was described by a system of ODEs as [58]:
The above models are based on the assumption that the T cells and viruses are homogeneously distributed in the body. It was reported [60,61,62] that T cells move from high-concentration to low-concentration places. The movement of epithelial cells was reported [63]. Therefore, spatial structure is important when describing the dynamics of SARS-CoV-2 and HTLV-I co-infection in a host. Wang and Ma [64] formulated a diffusive HTLV-I single-infection model with time delay, mitosis, and CTL response. SARS-CoV-2 infection dynamics models with reaction–diffusion were studied [65,66].
The aim of this study was to construct and analyze a mathematical model for the in-host dynamics of HTLV-I and SARS-CoV-2 co-infection with diffusion. The co-infection model is described by a set of PDEs. We established the fundamental properties of the system’s solutions, computed all steady states, and proved their global asymptotic stability. Furthermore, we performed numerical simulations to support the theoretical findings. We discussed the effect of HTLV-I infection on the progression of COVID-19 infection.
2. Model Formulation
We developed an HTLV-I and SARS-CoV-2 co-infection model by considering Factors 1–4; in addition, we assumed that cells and viruses are mobile in the environment. The model is then given by a system of PDEs as follows:
where The spatial domain is connected and bounded by a smooth boundary and . is the Laplacian operator, while is the diffusion coefficient corresponding to compartment of the system. All the parameters given in model (12)–(18) are positive.
The initial conditions are given by
Functions are continuous. Furthermore, the following homogeneous Neumann boundary conditions are considered:
where is the outward normal derivative on the boundary .
3. Properties of Solutions
Lemma 1.
Proof.
Let be the set of all bounded and uniformly continuous functions from to and let Then, the positive cone induces a partial order on . Suppose that the norm is defined by where is the Euclidean norm on . This implies that the space is a Banach lattice [67,68].
For any initial data , we define by
Clearly, is locally Lipschitz on . We can rewrite system (28)–(34) with initial and boundary conditions (19) and (20), respectively, as the following abstract functional DE:
where and Ð It is possible to show that dist for all It follows from [67,68,69] that, for any , system (21)–(27) with initial and boundary conditions (19)–(20), has a unique, non-negative, and mild solution defined on , where is the maximal existence time interval.
To prove the boundedness of all state variables, we define
We have . Hence,
where . Hence, satisfies
Let be a solution of the ODE:
This yields Applying the comparison principle [70], we have Hence, we obtain
which ensures the boundedness of , and on . From the standard theory for semi-linear parabolic PDEs, we obtain [71]. □
4. Steady States and Thresholds
To find the steady states, we use
and solve this algebraic system. We found that the system admits four steady states:
(i) Healthy steady state: where and .
(ii) HTLV-I single-infection steady state, where
where
Here, is the basic HTLV-I single-infection reproduction number. It decides the establishment of HTLV-I single infection. Clearly, is always positive. Additionally, because , and are always positive, while and are positive if Therefore, exists when
(iii) SARS-CoV-2 single-infection steady state, where
and satisfies the following equation:
where
Now, we show that Equation (37) has a positive solution. Let us define
We have
where
Hence, when Moreover,
where . Furthermore,
This shows that for all . Then, there exists a unique , such that . From Equation (36), we have and . As a result, exists when Here, denotes the basic SARS-CoV-2 single-infection reproduction number, and it decides the occurrence of SARS-CoV-2 single infection.
(iv) HTLV-I and SARS-CoV-2 co-infection steady state , where
It follows that because , then and are always positive, while and if . On the other hand, and when .
Therefore, we can rewrite the components of as
where
Thus, exists when and At this point, and are threshold numbers that determine the HTLV-I and SARS-CoV-2 coexistence.
Now we summarize the above results in the following Lemma.
Lemma 2.
There exist four threshold numbers , such that:
- (a)
- The healthy steady state, , always exists;
- (b)
- if , then, in addition to , there is an HTLV-I single-infection steady state, ;
- (c)
- If , then, in addition to , there is a SARS-CoV-2 single-infection steady state, ;
- (d)
- If and then, in addition to , there is anHTLV-I and SARS-CoV-2 co-infection steady state .
5. Global Stability
In this section, we examine the global stability of the four steady states , . We followed [72] to design Lyapunov function and used LaSalle’s invariance principle (LIP) [73]. We used the following geometric mean–arithmetic mean inequality:
Next, we denote . Let and define
Let be the largest invariant subset of
Theorem 1.
If and , then, the healthy steady state is globally asymptotically stable (GAS).
Proof.
We define as:
Clearly, for all , we have ; moreover, . We calculate as:
Collecting the terms of (40), we obtain
Because and then
Consequently, we calculate the derivative of with respect to t as:
Divergence theorem and Neumann boundary conditions imply that
Hence,
Therefore, if and then for all and when , and The solutions of system (21)–(27) converge to , which includes elements with , and then, , Equations (23) and (27) yield
Furthermore, Equation (22) yields
Therefore, We deduce from LIP that is GAS [73]. □
The result of Theorem 1 shows that if there exist control parameters (e.g., drug therapies), which make and , then both HTLV-I and SARS-CoV-2 are removed from the body regardless of the initial states.
Theorem 2.
If and , then the HTLV-I single-infection steady state is GAS.
Proof.
Let be defined as:
Clearly, for all , we have and . We calculate as:
Equation (44) is simplified as:
Using the steady-state conditions for :
we obtain
Collect the terms as:
Equation (45) can be written as:
Then, is calculated as:
Therefore, if , then for all , where at , and . The solutions to system (21)–(27) tend to , which has elements such that and then Equation (23) yields
Equation (22) gives
Then, , and LIP confirms the global stability of . □
Theorem 2 suggests that if the model’s parameters are adjusted such that and , then the SARS-CoV-2 infection will be extinct, and the patient will have chronic HTLV-I single infection.
Theorem 3.
If and , then the SARS-CoV-2 single-infection steady state, , is GAS.
Proof.
We define as:
Clearly, for all , we have and . Calculate as:
Collect the terms as:
Using the steady-state conditions for :
we obtain
Collect the terms as:
We have
Then, we obtain
Hence, if , then does not exist because and Because both the ODE system (5)–(11) and the PDE system (21)–(27) have the same steady states, then does not exist for system (5)–(11). This implies that
It follows that for all ; thus, . By using inequality (39), we obtain
Thus, for all and at and The solutions of the model tend to for which It follows that , and Equation (27) becomes
Therefore, . LIP implies the global stability of . □
Theorem 3 suggests that if the model’s parameters are controlled such that and , then the HTLV-I infection will be extinct, and the patient will have SARS-CoV-2 single infection.
We define
Theorem 4.
If and , then the HTLV-I and SARS-CoV-2 co-infection steady state is GAS.
Proof.
We define as:
Clearly, for all , we have and . Calculate as:
Collecting the terms, we have
Equation (46) can be written as:
Utilizing the steady-state conditions for :
we obtain
Collect the terms as:
We have
Then, we obtain
Using inequality (39), we obtain
Because we have ; moreover, when and . The solutions of the system tend to Clearly, hence, LIP confirms the global stability of . □
Theorem 4 suggests that if and , then the HTLV-I and SARS-CoV-2 co-infection will be established regardless of the initial states.

Table 1.
Existence and stability conditions.
6. Numerical Simulations
This section presents some numerical results for models (12)–(18) to illustrate the stability of the steady states. In addition, we present a comparison of the results on the impact of HTLV-I infection on the dynamics of SARS-CoV-2 single infection. To numerically solve the system of PDEs, we use the solver PDEPE in MATLAB (see the code given in the link given in [66]: https://www.mdpi.com/article/10.3390/math10224390/s1 (accessed on 1 December 2022)).
6.1. Stability of Steady States
We solve the system with the following initial conditions:
and homogeneous Neumann boundary conditions
Note that we did not have real data from HTLV-I and SARS-CoV-2 co-infected patients; therefore, the initial conditions were arbitrarily selected. Our global stability results guarantee that the solutions of the model converge to one of the four steady states regardless of the selected initial conditions.
Table 2 lists the values of parameters. We selected four sets of the parameters to obtain the following plans.
Table 2.
Model parameters.
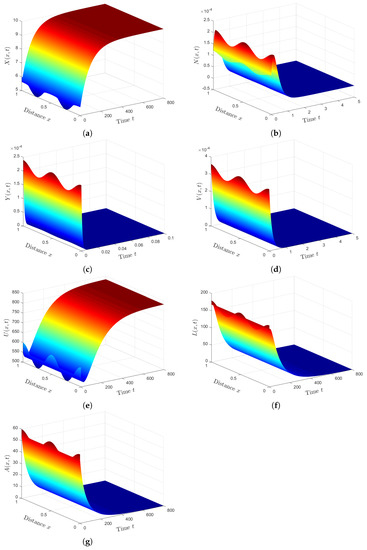
Plan (I) (stability of): Choosing gives and Based on Theorem 1, the steady state, , is GAS. As shown in Figure 1, the numbers of healthy ECs and T cells tend to their normal values and , respectively. Moreover, the other populations will be extinct. This plan leads to the clearance of both HTLV-I and COVID-19. In fact, condition can be achieved by considering two classes of anti-SARS-CoV-2 drug therapies that reduce the parameters and by replacing them with and , respectively. Here, and are the treatment efficacies of anti-SARS-CoV-2 drug therapies for blocking the infection and production of SARS-CoV-2 particles, respectively [20]. However, is difficult to achieve because no treatment is currently recommended for individuals with HTLV-1 infection.
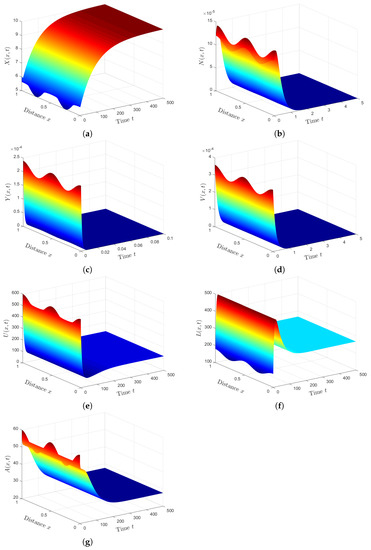
Plan (II) (stability of): We take . So, we obtain and Lemma 2 and Theorem 2 show the existence and global stability of . Figure 2 demonstrates that the numerical solutions reach the steady state . This plan leads the co-infected patient to be infected with HTLV- I only, while the COVID-19 infection disappears. Because depends on the parameters and , can be achieved by applying treatments with efficacies and .
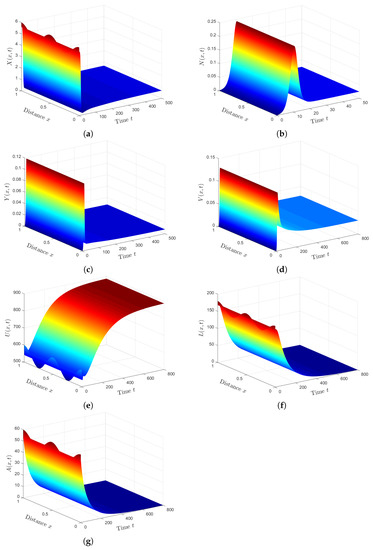
Plan (III) (stability of): We choose . Then, we calculate and . Based on Lemma 2 and Theorem 3, exists, and it is GAS. The numerical solution plotted in Figure 3 converges to . This plan leads the co-infected patient to being infected with SARS-CoV-2 only. This case is practically difficult to be achieved because of the unavailability of HTLV-I treatment.
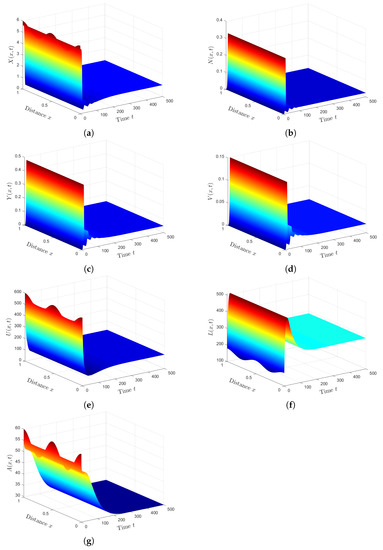
Plan (IV) (stability of): We consider . So, we obtain and . From Lemma 2 and Theorem 4, we have that the HTLV-I and SARS-CoV-2 co-infection steady state exists, and it is GAS. The numerical solution of the system converges to (see Figure 4). This plan suggests that the patient will still be co-infected with HTLV-I and SARS-CoV-2. Co-infection with these two diseases for a long time may expose patients to a significant deterioration in their health condition, which may lead to death.
6.2. Comparison of Results
Next, we investigated the impact of HTLV-I infection on the progression of COVID-19 infection by presenting a comparison between the dynamics of SARS-CoV-2 single infection, and HTLV-I and SARS-CoV-2 co-infection. To establish the effect of HTLV-I infection on COVID-19 infection progression, we compared the solutions of system (12)–(18) with those of the following system for SARS-CoV-2 single infection:
We fixed the parameters and solved systems (12)–(18) and (49)–(52) with initial conditions (47) and boundary conditions (48). We can see from Figure 5 that the presence of HTLV-I reduces the numbers of healthy ECs and T cells, while it increases the numbers of SARS-CoV-2 particles and SARS-CoV-2 infected ECs. This means that HTLV-I infection weakens the immune response and increases COVID-19 disease progression.
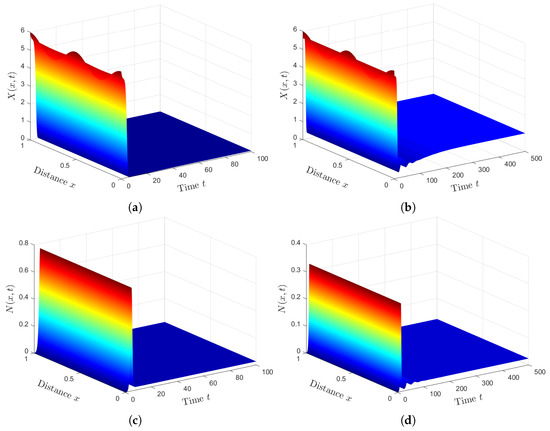
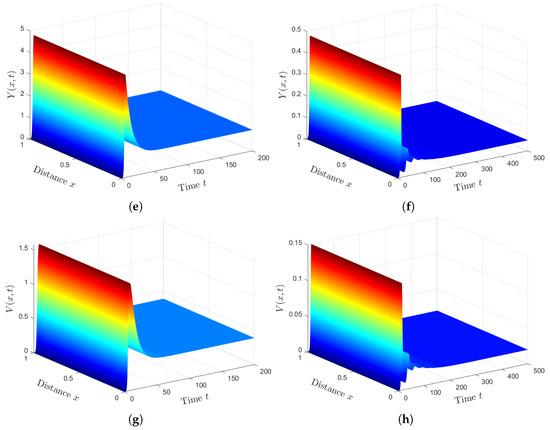
Figure 5.
Comparison between SARS-CoV-2 single infection and HTLV-I/SARS-CoV-2 co-infection. (a) Healthy ECs for system (49)–(52). (b) Healthy ECs for system (12)–(18). (c) Latent infected ECs for system (49)–(52). (d) Latent infected ECs for system (12)–(18). (e) Active infected ECs for system (49)–(52). (f) Active infected ECs for system (12)–(18). (g) SARS-CoV-2 for system (49)–(52). (h) SARS-CoV-2 for system (12)–(18).
7. Conclusions
Mathematical models are considered important tools that can be used for better understanding the in-host dynamics of human viral co-infections under the impact of the immune response. Cases of HTLV-I and SARS-CoV-2 co-infection were recorded [6,13,14,15]. A mathematical model for HTLV-I and SARS-CoV-2 co-infection was developed and analyzed [58]. The vast majority of this model is based on an insufficient approach where the populations (cells and viruses) are homogeneously distributed in the body. In this study, we proposed and examined an HTLV-I and SARS-CoV-2 co-infection model with diffusion. We determined four threshold numbers, , and , which determine the existence and global stability of the four steady states. We formulated Lyapunov functions and applied LIP to establish the global stability of the steady states. We proved the following: (a) ii and , then the infection-free steady state is GAS; (b) if and , then the HTLV-I single infection steady state is GAS; (c) if and , then the SARS-CoV-2 single-infection steady state is GAS; (d) if and , then the HTLV-I and SARS-CoV-2 co-infection steady state is GAS. To validate the theoretical results, we performed numerical simulations for the PDE model. We discussed the impact of HTLV-I infection on COVID-19 progression. We found that the presence of HTLV-I inhibits the immune response and increases the progression of COVID-19 infection. This observation agrees with that of [6], who reported that HTLV-I causes immune dysfunction even in asymptomatic carriers. Therefore, HTLV-I may increase the risk of COVID-19 infection.
In the future, the co-infection model presented in this article can be extended by (i) incorporating the intracellular and immune response time delays, (ii) considering viral mutations, and (iii) incorporating the memory effect by formulating the co-infection model by fractional differential equations.
Author Contributions
Conceptualization, A.M.E.; Methodology, A.S.S. and S.A.A.; Formal analysis, A.M.E., A.D.H. and S.A.A.; Investigation, A.M.E. and A.S.S.; Writing—original draft, A.S.S. and A.D.H.; Writing—review & editing, A.M.E. All authors have read and agreed to the published version of the manuscript.
Funding
This project was funded by the Deanship of Scientific Research (DSR), King Abdulaziz University, Jeddah, Saudi Arabia under grant no. (KEP-PHD-38-130-43).
Data Availability Statement
Not applicable.
Acknowledgments
This project was funded by the Deanship of Scientific Research (DSR), King Abdulaziz University, Jeddah, Saudi Arabia, under grant No. (KEP-PHD-38-130-43). The authors, therefore, acknowledge with thanks DSR technical and financial support.
Conflicts of Interest
The authors declare no conflict of interest.
References
- World Health Organization (WHO). Coronavirus Disease (COVID-19), Weekly Epidemiological Update (18 December 2022). 2022. Available online: https://www.who.int/publications/m/item/covid-19-weekly-epidemiological-update---21-december-2022 (accessed on 29 December 2022).
- Asamoah, J.K.K.; Okyere, E.; Abidemi, A.; Moore, S.E.; Sun, G.Q.; Jin, Z.; Acheampong, E.; Gordon, J.F. Optimal control and comprehensive cost-effectiveness analysis for COVID-19. Results Phys. 2022, 33, 105177. [Google Scholar] [CrossRef] [PubMed]
- Varga, Z.; Flammer, A.J.; Steiger, P.; Haberecker, M.; Andermatt, R.; Zinkernagel, A.S.; Mehra, M.R.; Schuepbach, R.A.; Ruschitzka, F.; Moch, H. Endothelial cell infection and endotheliitis in COVID-19. Lancet 2020, 395, 1417–1418. [Google Scholar] [CrossRef] [PubMed]
- Nowak, M.D.; Sordillo, E.M.; Gitman, M.R.; Mondolfi, A.E. Coinfection in SARS-CoV-2 infected patients: Where are influenza virus and rhinovirus/enterovirus? J. Med. Virol. 2020, 92, 1699. [Google Scholar] [CrossRef]
- Poiesz, B.J.; Ruscette, F.W.; Gazdar, A.F.; Bunn, P.A.; Minna, J.D.; Gallo, R.C. Detection and isolation of type C retrovirus particles from fresh and cultured cells of a patient with cutaneous T-cell lymphoma. Proc. Natl. Acad. Sci. USA 1980, 77, 7415–7419. [Google Scholar] [CrossRef] [PubMed]
- Enomoto, T.; Shiroyama, T.; Hirata, H.; Amiya, S.; Adachi, Y.; Niitsu, T.; Noda, Y.; Hara, R.; Fukushima, K.; Suga, Y.; et al. COVID-19 in a human T-cell lymphotropic virus type-1 carrier. Clin. Case Rep. 2022, 10, e05463. [Google Scholar] [CrossRef]
- Asquith, B.; Bangham, C.R.M. Quantifying HTLV-I dynamics. Immunol. Cell Biol. 2007, 85, 280–286. [Google Scholar] [CrossRef]
- Tay, M.Z.; Poh, C.M.; Rénia, L.; MacAry, P.A.; Ng, L.F. The trinity of COVID-19: Immunity, inflammation and intervention. Nat. Rev. Immunol. 2020, 20, 363–374. [Google Scholar] [CrossRef]
- Ren, X.; Wen, W.; Fan, X.; Hou, W.; Su, B.; Cai, P.; Li, J.; Liu, Y.; Tang, F.; Zhang, F.; et al. COVID-19 immune features revealed by a large-scale single-cell transcriptome atlas. Cell 2021, 184, 1895–1913. [Google Scholar] [CrossRef]
- Bangham, C.R.M. CTL quality and the control of human retroviral infections. Eur. J. Immunol. 2009, 39, 1700–1712. [Google Scholar] [CrossRef]
- Sajjadi, S.; Hejazi, S.; Ravanshad, S.; Esfehani, R.J. Human T-lymphotropic virus type 1 and novel Coronavirus Disease 2019; More complex than just a simple coinfection. Gene 2022, 834, 146550. [Google Scholar] [CrossRef]
- Zhu, X.; Ge, Y.; Wu, T.; Zhao, K.; Chen, Y.; Wu, B.; Zhu, F.; Zhu, B.; Cui, L. Co-infection with respiratory pathogens among COVID-2019 cases. Virus Res. 2020, 285, 198005. [Google Scholar] [CrossRef] [PubMed]
- Wu, Y.; Lin, H.; Xie, Q.; Chen, Q.; Huang, Y.; Zhu, Y.; Chen, L. COVID-19 in a patient with pre-existing acute lymphoblastic leukaemia. Br. J. Haematol. 2020, 190, e13–e15. [Google Scholar] [CrossRef]
- Julian, K.; Shah, Ṅ.; Banjade, R.; Bhatt, D. Utility of Ct values in differentiating COVID-19 reinfection versus prolonged viral shedding in an immunocompromised patient. BMJ Case Rep. CP 2021, 14, e243692. [Google Scholar] [CrossRef] [PubMed]
- Hosoba, R.; Makita, S.; Shiotsuka, M.; Kobayashi, O.; Nakano, K.; Muroya, M.; Okada, N.; Suzuki, M.; Ida, H.; Fukuhara, S.; et al. COVID-19 pneumonia in a patient with adult T-cell leukemia-lymphoma. J. Clin. Exp. Hematop. 2020, 60, 174–178. [Google Scholar] [CrossRef] [PubMed]
- Hernandez-Vargas, E.A.; Velasco-Hernandez, J.X. In-host mathematical modelling of COVID-19 in humans. Annu. Rev. Control 2020, 50, 448–456. [Google Scholar] [CrossRef]
- Li, C.; Xu, J.; Liu, J.; Zhou, Y. The within-host viral kinetics of SARS-CoV-2. Math. Biosci. Eng. 2020, 17, 2853–2861. [Google Scholar] [CrossRef]
- Ke, R.; Zitzmann, C.; Ho, D.D.; Ribeiro, R.M.; Perelson, A.S. In vivo kinetics of SARS-CoV-2 infection and its relationship with a person’s infectiousness. Proc. Natl. Acad. Sci. USA 2021, 118, e2111477118. [Google Scholar] [CrossRef]
- Sadria, M.; Layton, A.T. Modeling within-host SARS-CoV-2 infection dynamics and potential treatments. Viruses 2021, 13, 1141. [Google Scholar] [CrossRef]
- Ghosh, I. Within host dynamics of SARS-CoV-2 in humans: Modeling immune responses and antiviral treatments. SN Comput. Sci. 2021, 2, 482. [Google Scholar] [CrossRef]
- Du, S.Q.; Yuan, W. Mathematical modeling of interaction between innate and adaptive immune responses in COVID-19 and implications for viral pathogenesis. J. Med. Virol. 2020, 92, 1615–1628. [Google Scholar] [CrossRef]
- Hattaf, K.; Yousfi, N. Dynamics of SARS-CoV-2 infection model with two modes of transmission and immune response. Math. Biosci. Eng. 2020, 17, 5326–5340. [Google Scholar] [CrossRef] [PubMed]
- Mondal, J.; Samui, P.; Chatterjee, A.N. Dynamical demeanour of SARS-CoV-2 virus undergoing immune response mechanism in COVID-19 pandemic. Eur. Phys. J. Spec. Top. 2022, 1–14. [Google Scholar] [CrossRef] [PubMed]
- Almoceraa, A.E.S.; Quiroz, G.; Hernandez-Vargas, E.A. Stability analysis in COVID-19 within-host model with immune response. Commun. Nonlinear Sci. Numer. 2021, 95, 105584. [Google Scholar] [CrossRef] [PubMed]
- Gonçalves, A.; Bertr, J.; Ke, R.; Comets, E.; De Lamballerie, X.; Malvy, D.; Pizzorno, A.; Terrier, O.; Calatrava, M.; Mentré, F.; et al. Timing of antiviral treatment initiation is critical to reduce SARS-CoV-2 viral load. CPT Pharmacometrics Syst. Pharmacol. 2020, 9, 509–514. [Google Scholar] [CrossRef] [PubMed]
- Abuin, P.; Anderson, A.; Ferramosca, A.; Hernandez-Vargas, E.A.; Gonzalez, A.H. Characterization of SARS-CoV-2 dynamics in the host. Annu. Rev. Control 2020, 50, 457–468. [Google Scholar] [CrossRef]
- Chhetri, B.; Bhagat, V.M.; Vamsi, D.K.K.; Ananth, V.S.; Prakash, D.B.; Mandale, R.; Muthusamy, S.; Sanjeevi, C.B. Within-host mathematical modeling on crucial inflammatory mediators and drug interventions in COVID-19 identifies combination therapy to be most effective and optimal. Alex. Eng. J. 2021, 60, 2491–2512. [Google Scholar] [CrossRef]
- Elaiw, A.M.; Alsaedi, A.J.; Agha, A.D.A.; Hobiny, A.D. Global stability of a humoral immunity COVID-19 model w logistic growth and delays. Mathematics 2022, 10, 1857. [Google Scholar] [CrossRef]
- Nath, B.J.; Dehingia, K.; Mishra, V.N.; Chu, Y.-M.; Sarmah, H.K. Mathematical analysis of a within-host model of SARS-CoV-2. Adv. Differ. Equ. 2021, 2021, 113. [Google Scholar] [CrossRef]
- Stilianakis, N.I.; Seydel, J. Modeling the T-cell dynamics and pathogenesis of HTLV-I infection. Bull. Math. Biol. 1999, 61, 935–947. [Google Scholar] [CrossRef]
- Wang, L.; Li, M.Y.; Kirschner, D. Mathematical analysis of the global dynamics of a model for HTLV-I infection and ATL progression. Math. Biosci. 2002, 179, 207–217. [Google Scholar] [CrossRef]
- Wodarz, D.; Bangham, C.R.M. Evolutionary dynamics of HTLV-I. J. Mol. Evol. 2000, 50, 448–455. [Google Scholar] [CrossRef] [PubMed]
- Pan, X.; Chen, Y.; Shu, H. Rich dynamics in a delayed HTLV-I infection model: Stability switch, multiple stable cycles, and torus. J. Math. Anal. Appl. 2019, 479, 2214–2235. [Google Scholar] [CrossRef]
- Li, M.Y.; Shu, H. Multiple stable periodic oscillations in a mathematical model of CTL response to HTLV-I infection. Bull. Math. Biol. 2011, 73, 1774–1793. [Google Scholar] [CrossRef] [PubMed]
- Wang, L.; Liu, Z.; Li, Y.; Xu, D. Complete dynamical analysis for a nonlinear HTLV-I infection model with distributed delay, CTL response and immune impairment. Discret. Contin. Dyn. 2020, 25, 917–933. [Google Scholar] [CrossRef]
- Muroya, Y.; Enatsu, Y.; Li, H. Global stability of a delayed HTLV-I infection model with a class of nonlinear incidence rates and CTLs immune response. Appl. Math. Comput. 2013, 219, 10559–10573. [Google Scholar] [CrossRef]
- Li, F.; Ma, W. Dynamics analysis of an HTLV-1 infection model with mitotic division of actively infected cells and delayed CTL immune response. Math. Methods Appl. Sci. 2018, 41, 3000–3017. [Google Scholar] [CrossRef]
- Li, S.; Zhou, Y. Backward bifurcation of an HTLV-I model with immune response. Discret. Contin. Dyn. Syst. Ser. B 2016, 21, 863–881. [Google Scholar]
- Li, M.Y.; Lim, A.G. Modelling the role of Tax expression in HTLV-1 persisence in vivo. Bull. Math. Biol. 2011, 73, 3008–3029. [Google Scholar] [CrossRef]
- Lim, A.G.; Maini, P.K. HTLV-I infection: A dynamic struggle between viral persistence and host immunity. J. Theor. Biol. 2014, 352, 92–108. [Google Scholar] [CrossRef]
- Khajanchi, S.; Bera, S.; Roy, T.K. Mathematical analysis of the global dynamics of a HTLV-I infection model, considering the role of cytotoxic T-lymphocytes. Math. Comput. Simul. 2021, 180, 354–378. [Google Scholar] [CrossRef]
- Katri, P.; Ruan, S. Dynamics of human T-cell lymphotropic virus I (HTLV-I) infection of CD4+T cells. Comptes Rendus Biol. 2004, 327, 1009–1016. [Google Scholar] [CrossRef]
- Wang, Y.; Liu, J. Global stability for delay-dependent HTLV-I model with CTL immune response. AIP Conf. Proc. 2016, 1738, 480074. [Google Scholar]
- Bera, S.; Khajanchi, S.; Roy, T.K. Dynamics of an HTLV-I infection model with delayed CTLs immune response. Appl. Math. Comput. 2022, 430, 127206. [Google Scholar] [CrossRef]
- Elaiw, A.M.; Shflot, A.S.; Hobiny, A.D. Stability analysis of general delayed HTLV-I dynamics model with mitosis and CTL immunity. Math. Biosci. Eng. 2022, 19, 12693–12729. [Google Scholar] [CrossRef]
- Pérez, A.G.; Oluyori, D.A. A model for COVID-19 and bacterial pneumonia coinfection with community-and hospital-acquired infections. arXiv 2022, arXiv:2207.13265. [Google Scholar] [CrossRef]
- Mekonen, K.G.; Obsu, L.L. Mathematical modeling and analysis for the co-infection of COVID-19 and tuberculosis. Heliyon 2022, 8, e11195. [Google Scholar] [CrossRef]
- Rehman, A.U.; Singh, R.; Agarwal, P. Modeling, analysis and prediction of new variants of covid-19 and dengue co-infection on complex network. Chaos Solitons Fractals 2021, 150, 111008. [Google Scholar] [CrossRef]
- Omame, A.; Abbas, M.; Abdel-Aty, A. Assessing the impact of SARS-CoV-2 infection on the dynamics of dengue and HIV via fractional derivatives. Chaos Solitons Fractals 2022, 162, 112427. [Google Scholar] [CrossRef]
- Omame, A.; Abbas, M.; Onyenegecha, C.P. Backward bifurcation and optimal control in a co-infection model for, SARS-CoV-2 and ZIKV. Results Phys. 2022, 37, 105481. [Google Scholar] [CrossRef]
- Ringa, N.; Diagne, M.L.; Rwezaura, H.; Omame, A.; Tchoumi, S.Y.; Tchuenche, J.M. HIV and COVID-19 co-infection: A mathematical model and optimal control. Inform. Med. Unlocked 2022, 31, 100978. [Google Scholar] [CrossRef]
- Ojo, M.M.; Benson, T.O.; Peter, O.J.; Goufo, E.F.D. Nonlinear optimal control strategies for a mathematical model of COVID-19 and influenza co-infection. Phys. A Stat. Mech. Its Appl. 2022, 607, 128173. [Google Scholar] [CrossRef] [PubMed]
- Pinky, L.; Dobrovolny, H.M. SARS-CoV-2 coinfections: Could influenza and the common cold be beneficial? J. Med. Virol. 2020, 92, 2623–2630. [Google Scholar] [CrossRef] [PubMed]
- Elaiw, A.M.; Alsulami, R.S.; Hobiny, A.D. Modeling and stability analysis of within-host IAV/SARS-CoV-2 coinfection with antibody immunity. Mathematics 2022, 10, 4382. [Google Scholar] [CrossRef]
- Agha, A.D.A.; Elaiw, A.M. Global dynamics of SARS-CoV-2/malaria model with antibody immune response. Math. Biosci. Eng. 2022, 19, 8380–8410. [Google Scholar] [CrossRef] [PubMed]
- Elaiw, A.M.; Agha, A.D.A.; Ramadan, S.A.A.E. Global analysis of within-host SARS-CoV-2/HIV coinfection model with latency. Eur. Phys. J. Plus 2022, 137, 174. [Google Scholar] [CrossRef]
- Zhou, Y.; Huang, M.; Jiang, Y.A.; Zou, X. Data-driven mathematical modeling and dynamical analysis for SARS-CoV-2 coinfection with bacteria. Int. J. Bifurc. Chaos 2021, 31, 2150163. [Google Scholar] [CrossRef]
- Elaiw, A.M.; Shflot, A.S.; Hobiny, A.D. Stability analysis of SARS-CoV-2/HTLV-I coinfection dynamics model. AIMS Math. 2023, 8, 6136–6166. [Google Scholar] [CrossRef]
- Elaiw, A.M.; AlShamrani, N.H. Analysis of a within-host HIV/HTLV-I co-infection model with immunity. Virus Res. 2021, 295, 198204. [Google Scholar] [CrossRef]
- Brainard, D.M.; Tager, A.M.; Misdraji, J.; Frahm, N.; Lichterfeld, M.; Draenert, R.; Brer, C.; Walker, B.D.; Luster, A.D. Decreased CXCR3+ CD8 T cells in advanced human immunodeficiency virus infection suggest that a homing defect contributes to cytotoxic T-lymphocyte dysfunction. J. Virol. 2007, 81, 8439–8450. [Google Scholar] [CrossRef]
- Bellomo, N.; Painter, K.J.; Tao, Y.; Winkler, M. Occurrence vs. Absence of taxis-driven instabilities in a May-Nowak model for virus infection. SIAM J. Appl. Math. 2019, 79, 1990–2010. [Google Scholar] [CrossRef]
- Tattermusch, S.; Bangham, C.R.M. HTLV-1 infection: What determines the risk of inflammatory disease? Trends Microbiol. 2012, 20, 494–500. [Google Scholar] [CrossRef] [PubMed]
- Theveneau, E.; Mayor, R. Collective cell migration of epithelial and mesenchymal cells. Cell. Mol. Life Sci. 2013, 70, 3481–3492. [Google Scholar] [CrossRef] [PubMed]
- Wang, W.; Ma, W. Global dynamics of a reaction and diffusion model for an HTLV-I infection with mitotic division of actively infected cells. J. Appl. Anal. Comput. 2017, 7, 899–930. [Google Scholar] [CrossRef]
- Elaiw, A.M.; Hobiny, A.D.; Agha, A.D.A. Global dynamics of SARS-CoV-2/cancer model with immune responses. Appl. Math. Comput. 2021, 408, 126364. [Google Scholar] [CrossRef] [PubMed]
- Elaiw, A.M.; Agha, A.D.A. Global Stability of a reaction-diffusion malaria/COVID-19 coinfection dynamics model. Mathematics 2022, 10, 4390. [Google Scholar] [CrossRef]
- Xu, Z.; Xu, Y. Stability of a CD4+ T cell viral infection model with diffusion. Int. Biomath. 2018, 11, 1850071. [Google Scholar] [CrossRef]
- Zhang, Y.; Xu, Z. Dynamics of a diffusive HBV model with delayed Beddington-DeAngelis response. Nonlinear Anal. World Appl. 2014, 15, 118–139. [Google Scholar] [CrossRef]
- Smith, H.L. Monotone Dynamical Systems: An Introduction to the Theory of Competitive and Cooperative Systems; American Mathematical Society: Providence, RI, USA, 1995. [Google Scholar]
- Protter, M.H.; Weinberger, H.F. Maximum Principles in Differential Equations; Prentic Hall: Hoboken, NJ, USA, 1967. [Google Scholar]
- Henry, D. Geometric Theory of Semilinear Parabolic Equations; Springer: New York, NY, USA, 1993. [Google Scholar]
- Korobeinikov, A. Global properties of basic virus dynamics models. Bull. Math. Biol. 2004, 66, 879–883. [Google Scholar] [CrossRef]
- Khalil, H.K. Nonlinear Systems; Pearson Education: London, UK, 2002. [Google Scholar]
- Perelson, A.S.; Kirschner, D.E.; Boer, R.D. Dynamics of HIV Infection of CD4+ T cells. Math. Biosci. 1993, 114, 81–125. [Google Scholar] [CrossRef]
- Prakash, M.; Rakkiyappan, R.; Annamalai, M.; Cao, J. Dynamical analysis of antigen-driven T-cell infection model with multiple delays. Appl. Math. Comput. 2019, 354, 266–281. [Google Scholar] [CrossRef]


Disclaimer/Publisher’s Note: The statements, opinions and data contained in all publications are solely those of the individual author(s) and contributor(s) and not of MDPI and/or the editor(s). MDPI and/or the editor(s) disclaim responsibility for any injury to people or property resulting from any ideas, methods, instructions or products referred to in the content. |
© 2023 by the authors. Licensee MDPI, Basel, Switzerland. This article is an open access article distributed under the terms and conditions of the Creative Commons Attribution (CC BY) license (https://creativecommons.org/licenses/by/4.0/).