3.2.1. The Effects of the Freeze-Thaw Cycle on Mechanical Properties
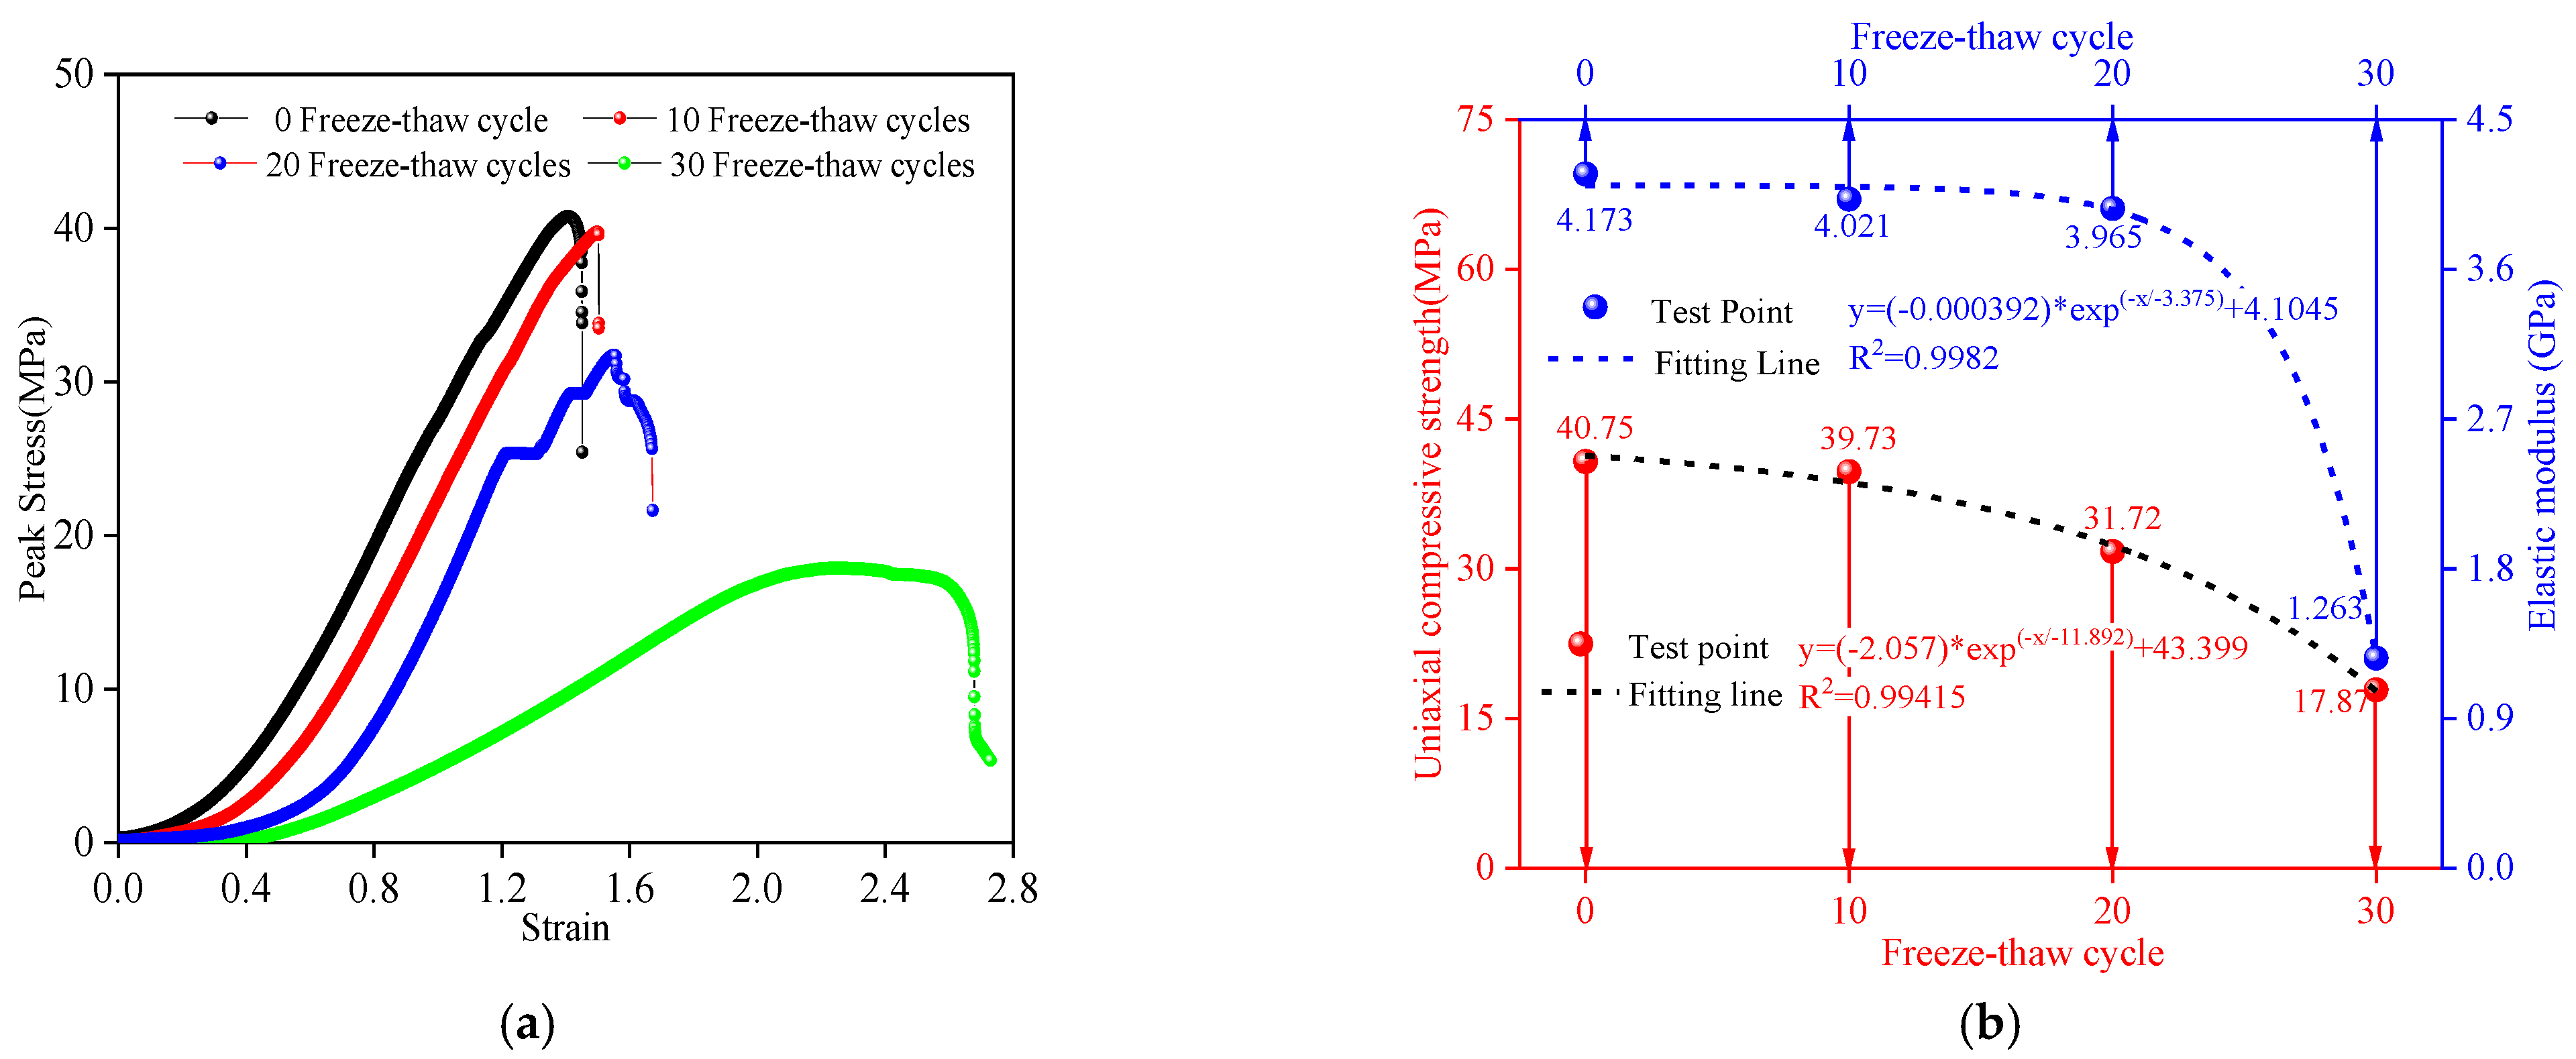
Figure 7a shows the stress-strain curve under different freeze-thaw cycles. It can be seen that the stress-strain curves have obvious pores compaction, elastic deformation, stable development of fractures and unstable development stages of fractures under different freeze-thaw cycles. Meanwhile, with the increase in the number of freeze-thaw cycles, the strain in the pore compaction stage increased significantly. The peak strength decreased, and the peak strain increased observably.
Table 5 shows the statistical results of the peak strength, elastic modulus, and peak strain under different freeze-thaw cycles. When the number of the F-T cycle increased from 0 to 30, the peak strength decreased from 40.75 MPa to 17.87 MPa with a reduction rate of 56.15%. The elastic modulus was reduced from 41.73 MPa to 12.63 MPa with a reduction rate of 69.73%. The peak strain increased from 1.40612% to 2.25087%, with an increase rate of 60.08%. According to the influence of freeze-thaw on the change rate of different mechanical parameters, the F-T cycle had the largest influence on the elastic modulus, followed by the peak strain, which had the least influence on the peak strength.
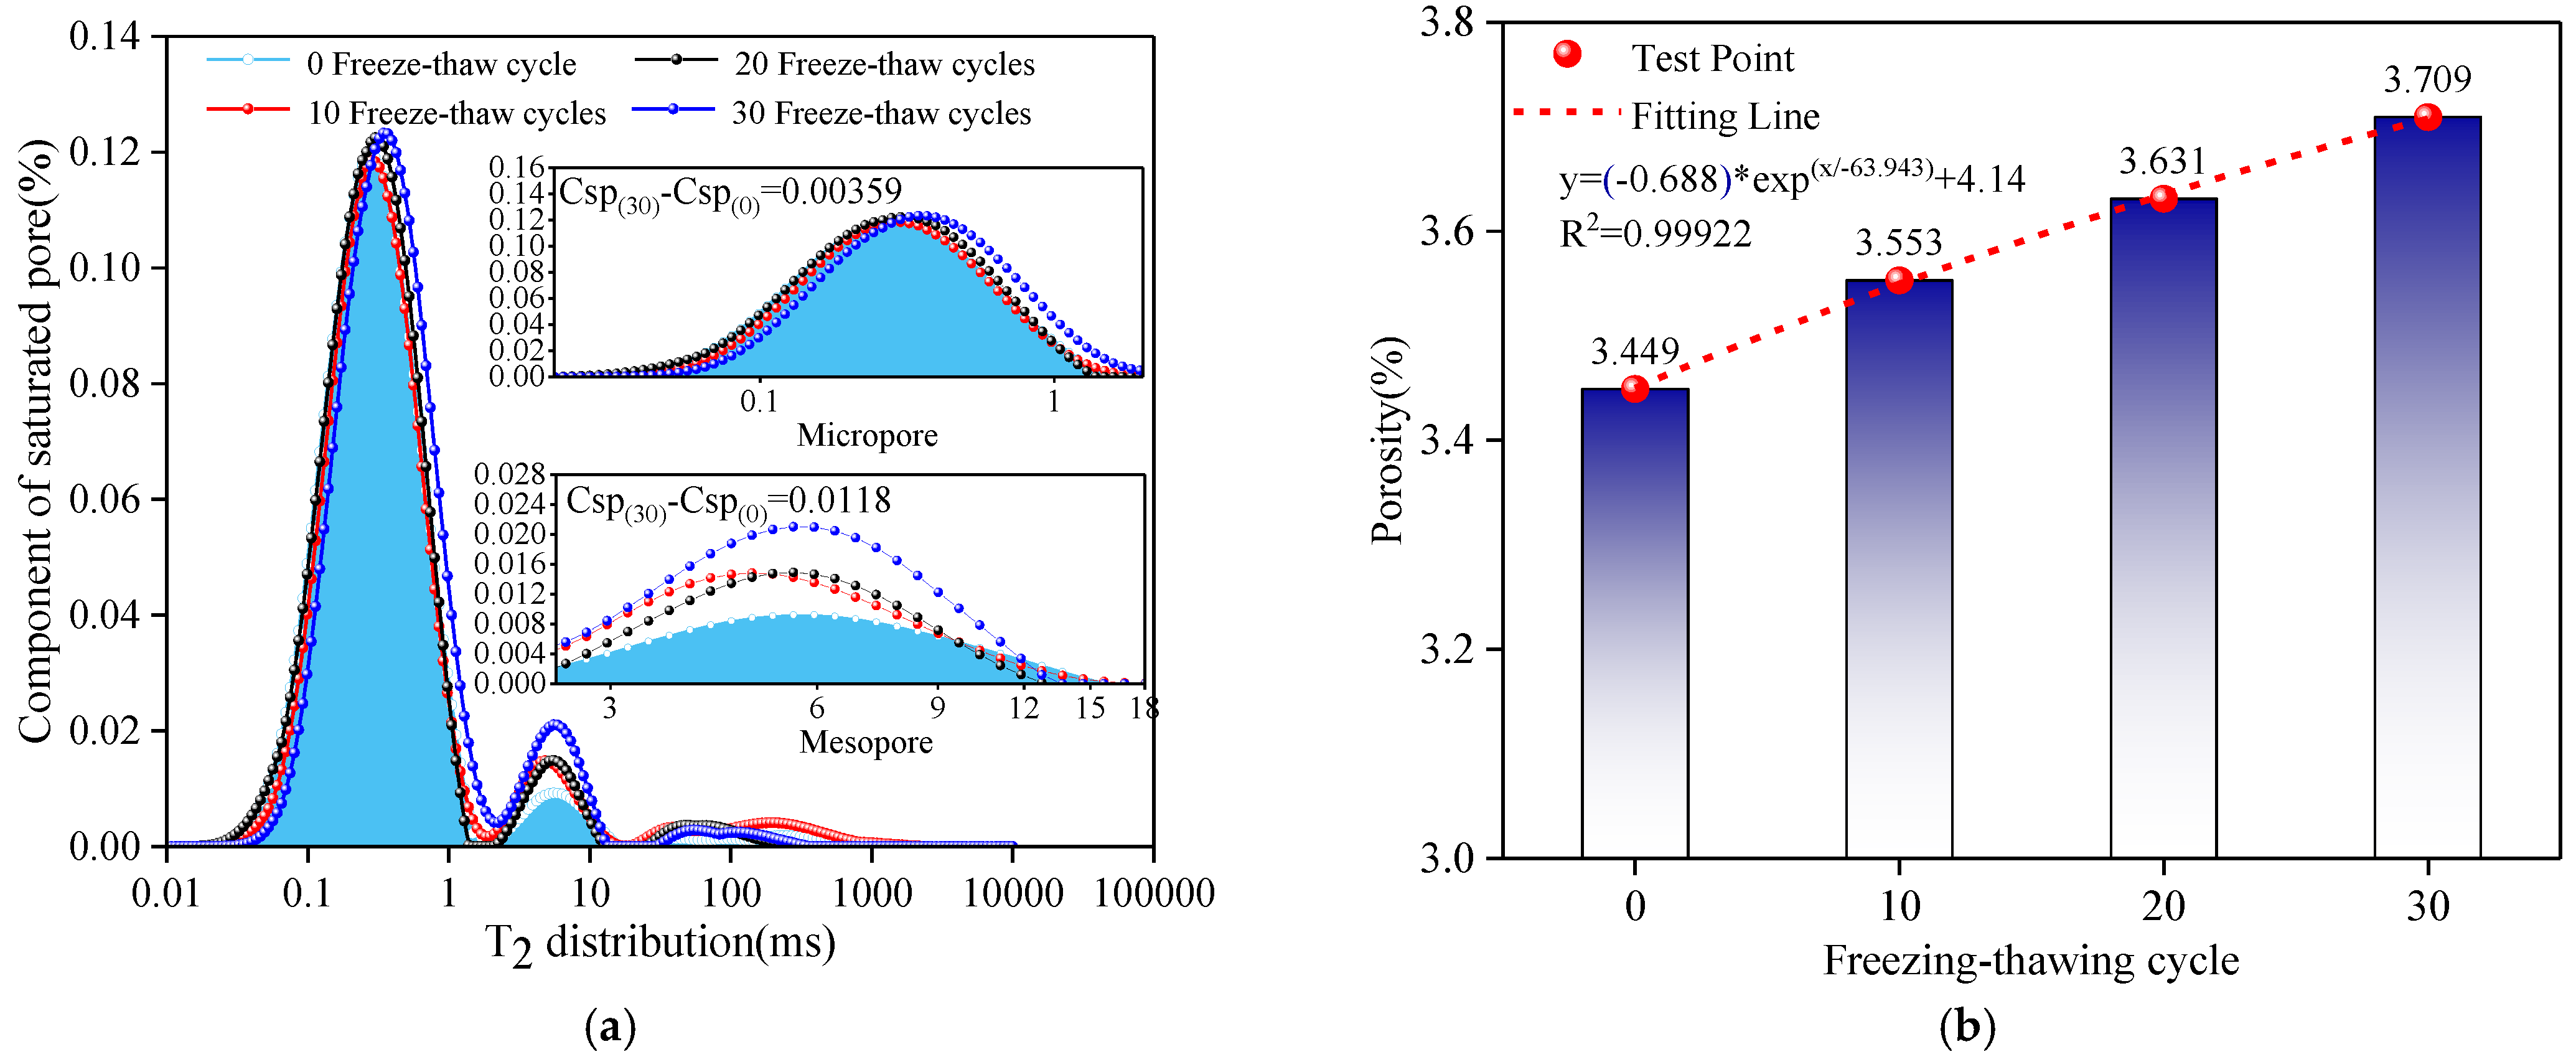
The pore compaction stage is a nonlinear deformation stage in which the original open cracks or pores gradually close during the initial stage of rock loading. With the increase in the F-T cycle, the number of microscopic pores inside the sample gradually increased, which also increased the deformation of the pore compaction stage of the sample. As a result, there was a significant increase in strain during the pore compaction phase, which ultimately led to an increase in peak strain. Moreover, the peak strain had a good exponential relationship with the number of F-T cycles, which increased exponentially with the increase in the cycles. In order to explore the intrinsic relationship between peak strength and elastic modulus and the F-T cycle, different mechanical parameters and freeze-thaw cycles were fitted (
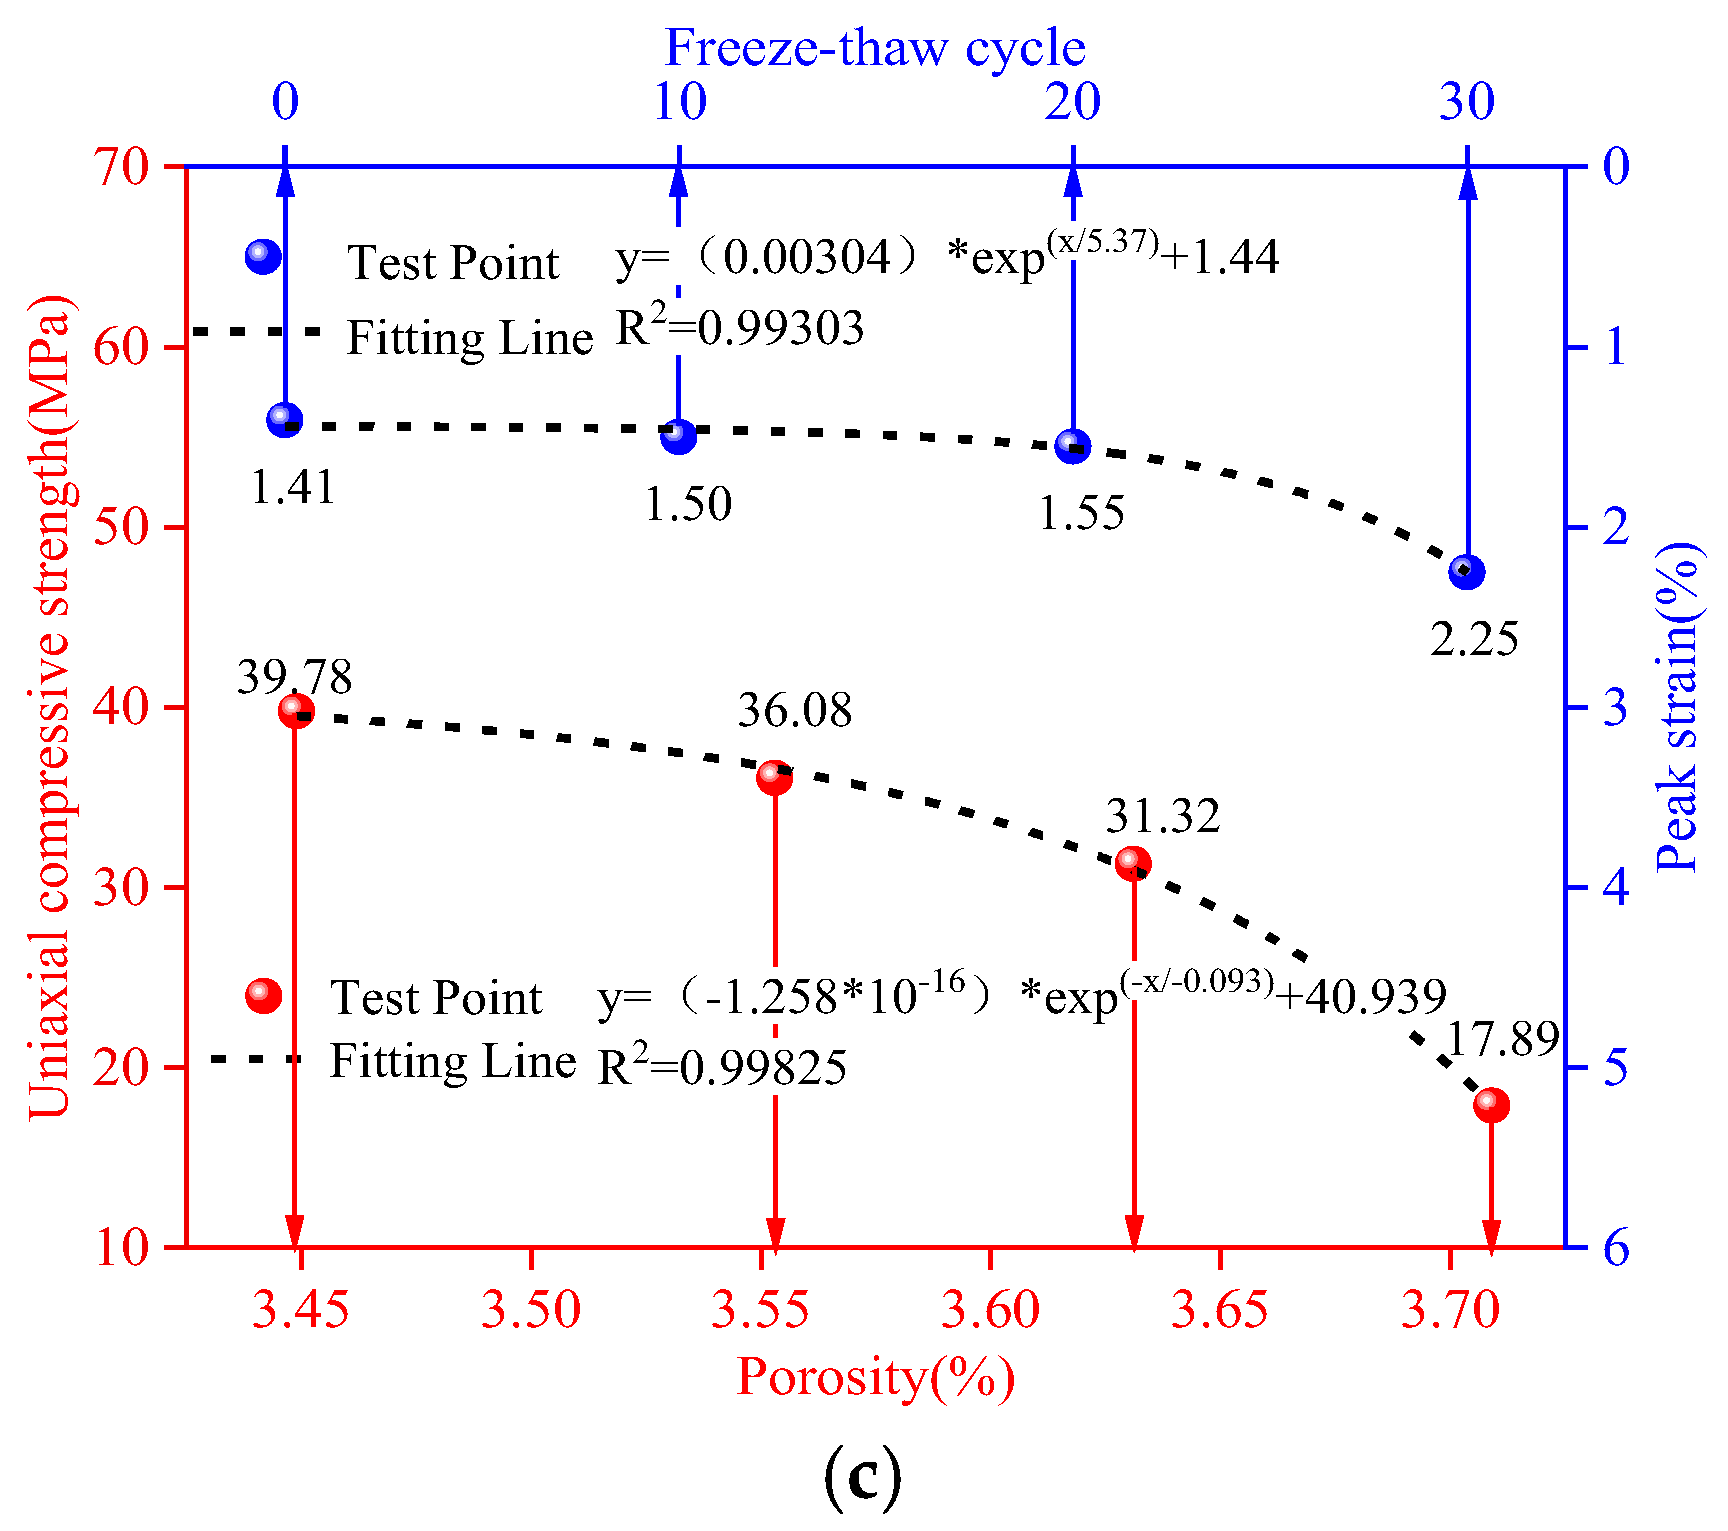
Figure 7b,c). The results showed that the peak strength and elastic modulus have a high exponential relationship with freeze-thaw cycles, and the fitting correlation coefficient is above 0.99. While the number of F-T cycles gradually increased, the peak strength and elastic modulus showed an exponential decrease. In previous studies, it was generally believed that the deterioration of the macroscopic mechanical properties under low-temperature environments was the result of the changes in the microscopic pore structure caused by the F-T cycle [
34]. Consequently, the relationship between porosity and uniaxial compressive strength was also considered. The results showed that there was a good exponential relationship between porosity and compressive strength, and the fitting coefficient was 0.99825. When the repeated F-T cycle caused the number of microscopic pores to increase, the mechanical strength showed an exponentially decreasing trend, which finally affected the safety and stability of the project.
3.2.2. The Effects of Freeze-Thaw Cycles on Energy Evolution
When the particle flow program simulates rock damage under load, the evolution of different types of energy can be tracked by setting the energy command. Therefore, before tracing the energy evolution, a numerical simulation of the uniaxial compression test should be carried out by the trial-and-error method. When the numerical simulation results are basically consistent with the indoor test results, the energy evolution can be recorded by turning.
Table 6 shows the particle flow simulation parameters of the uniaxial compression test under different freeze-thaw cycles. In this numerical simulation, the radius, density, normal and tangential stiffness ratios, porosity, and friction coefficient of the particle element were kept unchanged. The parameters affecting its peak strength and peak strain (Emod, pb_Emod, pb_coh, and pb_ten) were changed to simulate the uniaxial compression test under different cycles.
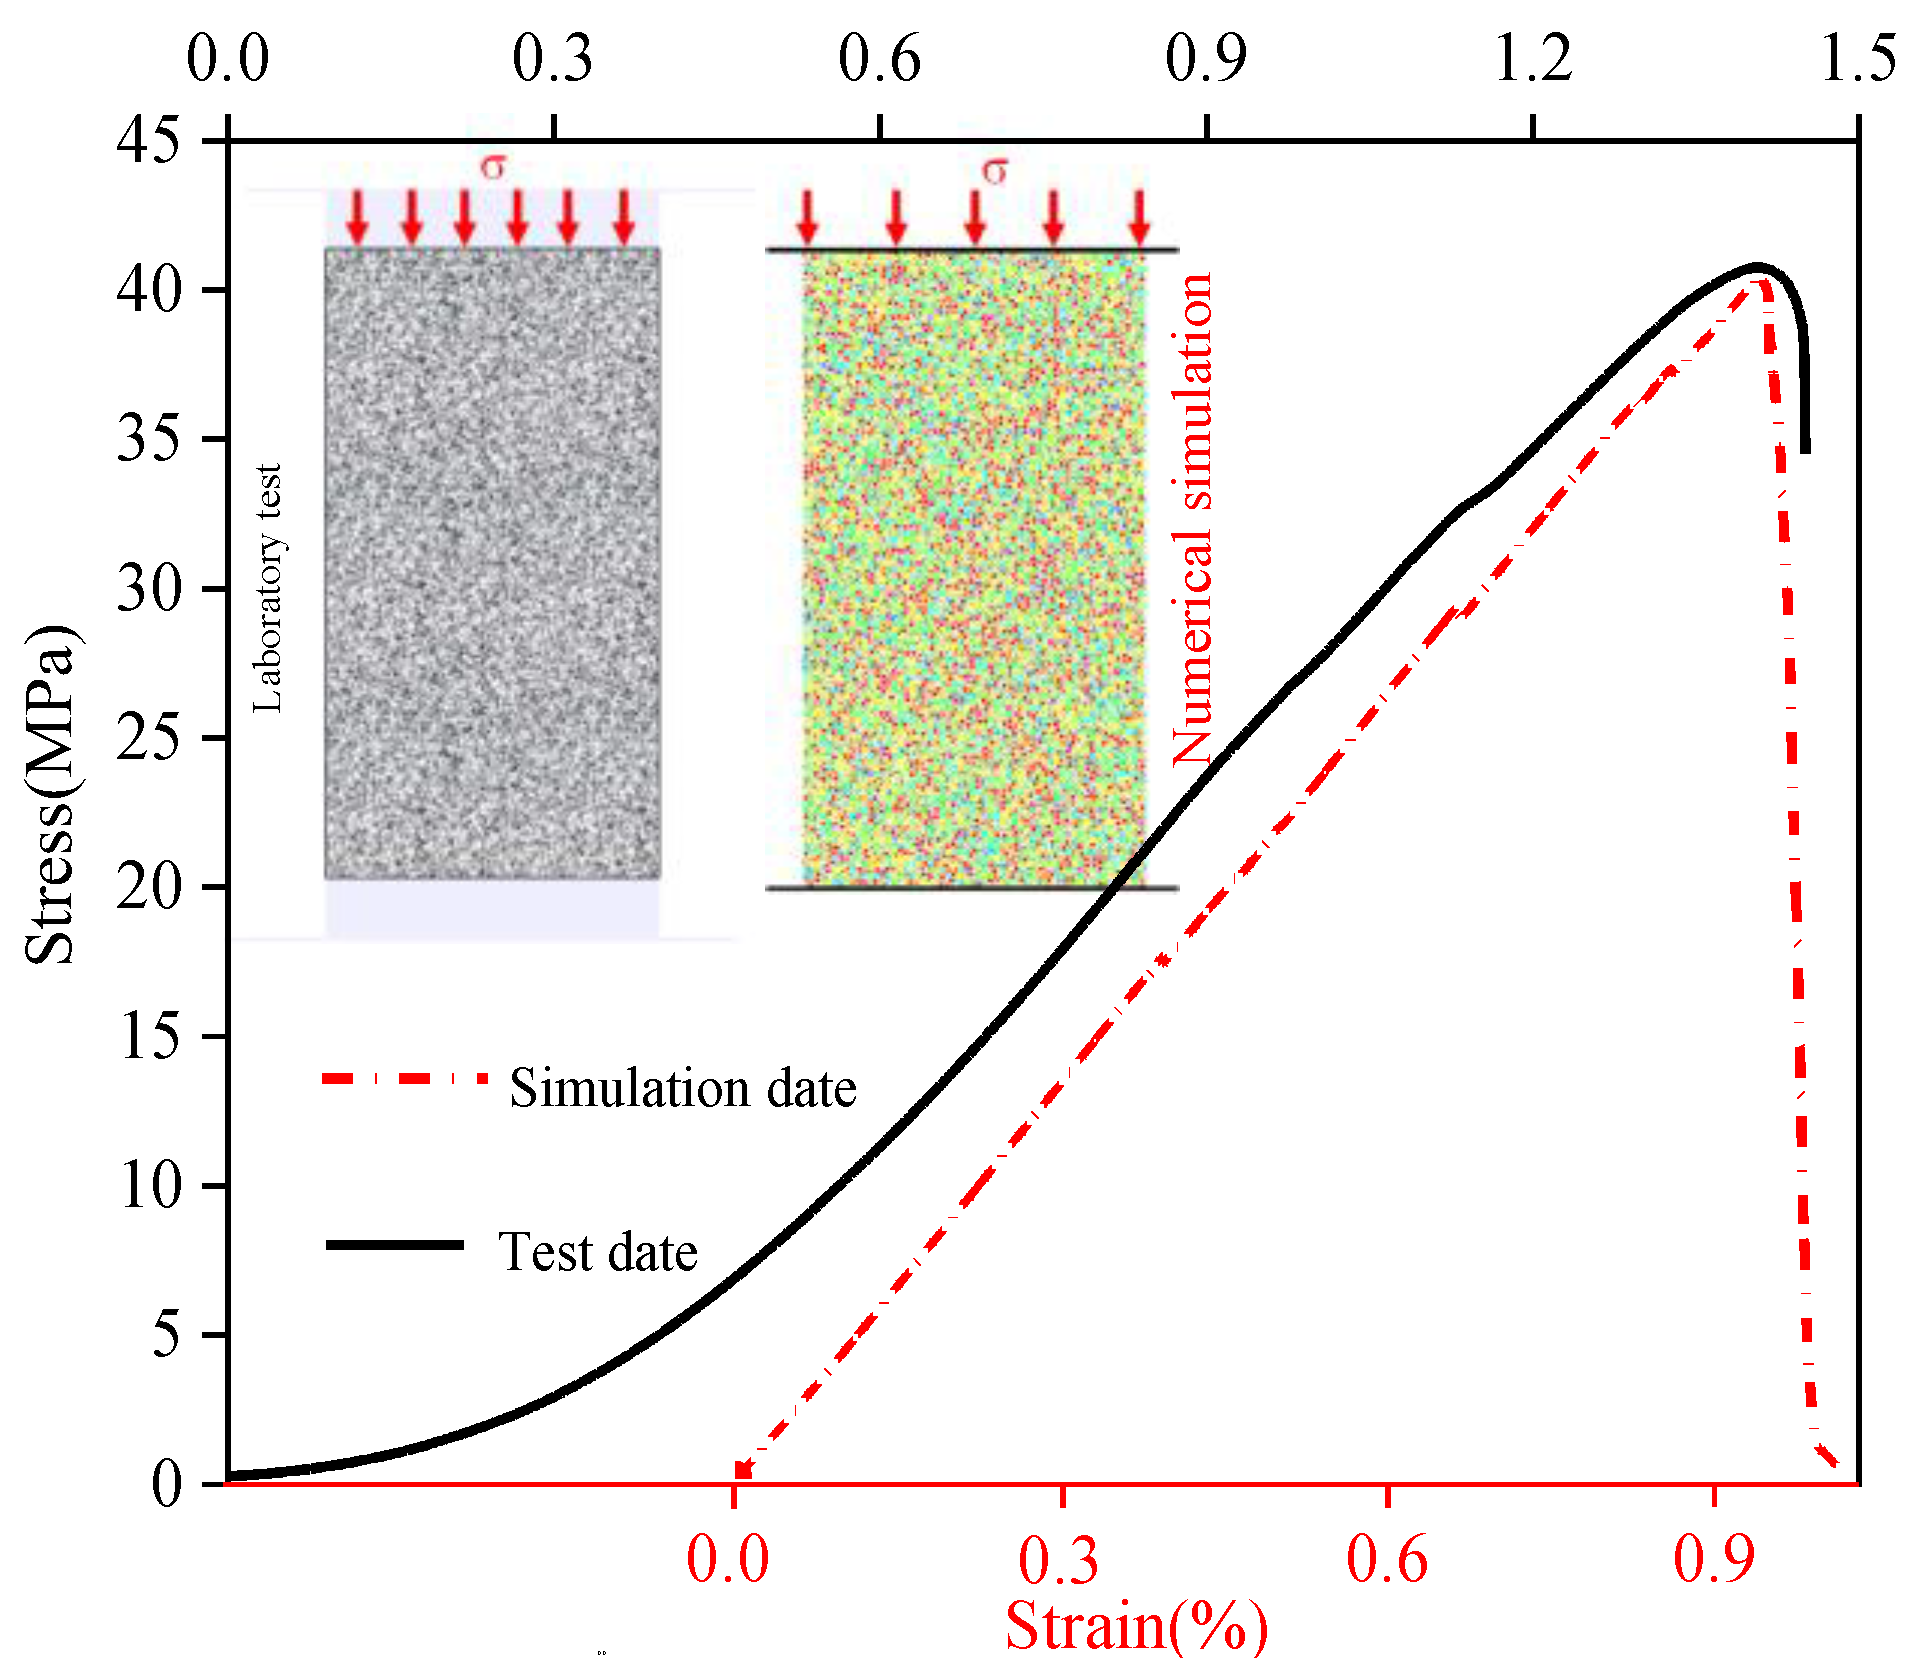
Figure 8 shows the stress-strain curve and numerical simulation stress-strain curve of the mechanical test of the 10 cycles. From the figure, the variation trend of the stress-strain curve simulated by the discrete element program is basically consistent with that of the indoor mechanical test curve. The values of the elastic modulus and peak strength of the discrete element program were basically consistent with those of the indoor mechanical test. The indoor mechanical test results and numerical simulation results of other freeze-thaw cycles are shown in
Table 7. It can be seen that the indoor mechanics test results with different cycles were basically similar to the numerical simulation results. The errors in elastic modulus and peak strength were less than 1 MPa and 0.1 Gpa, respectively.
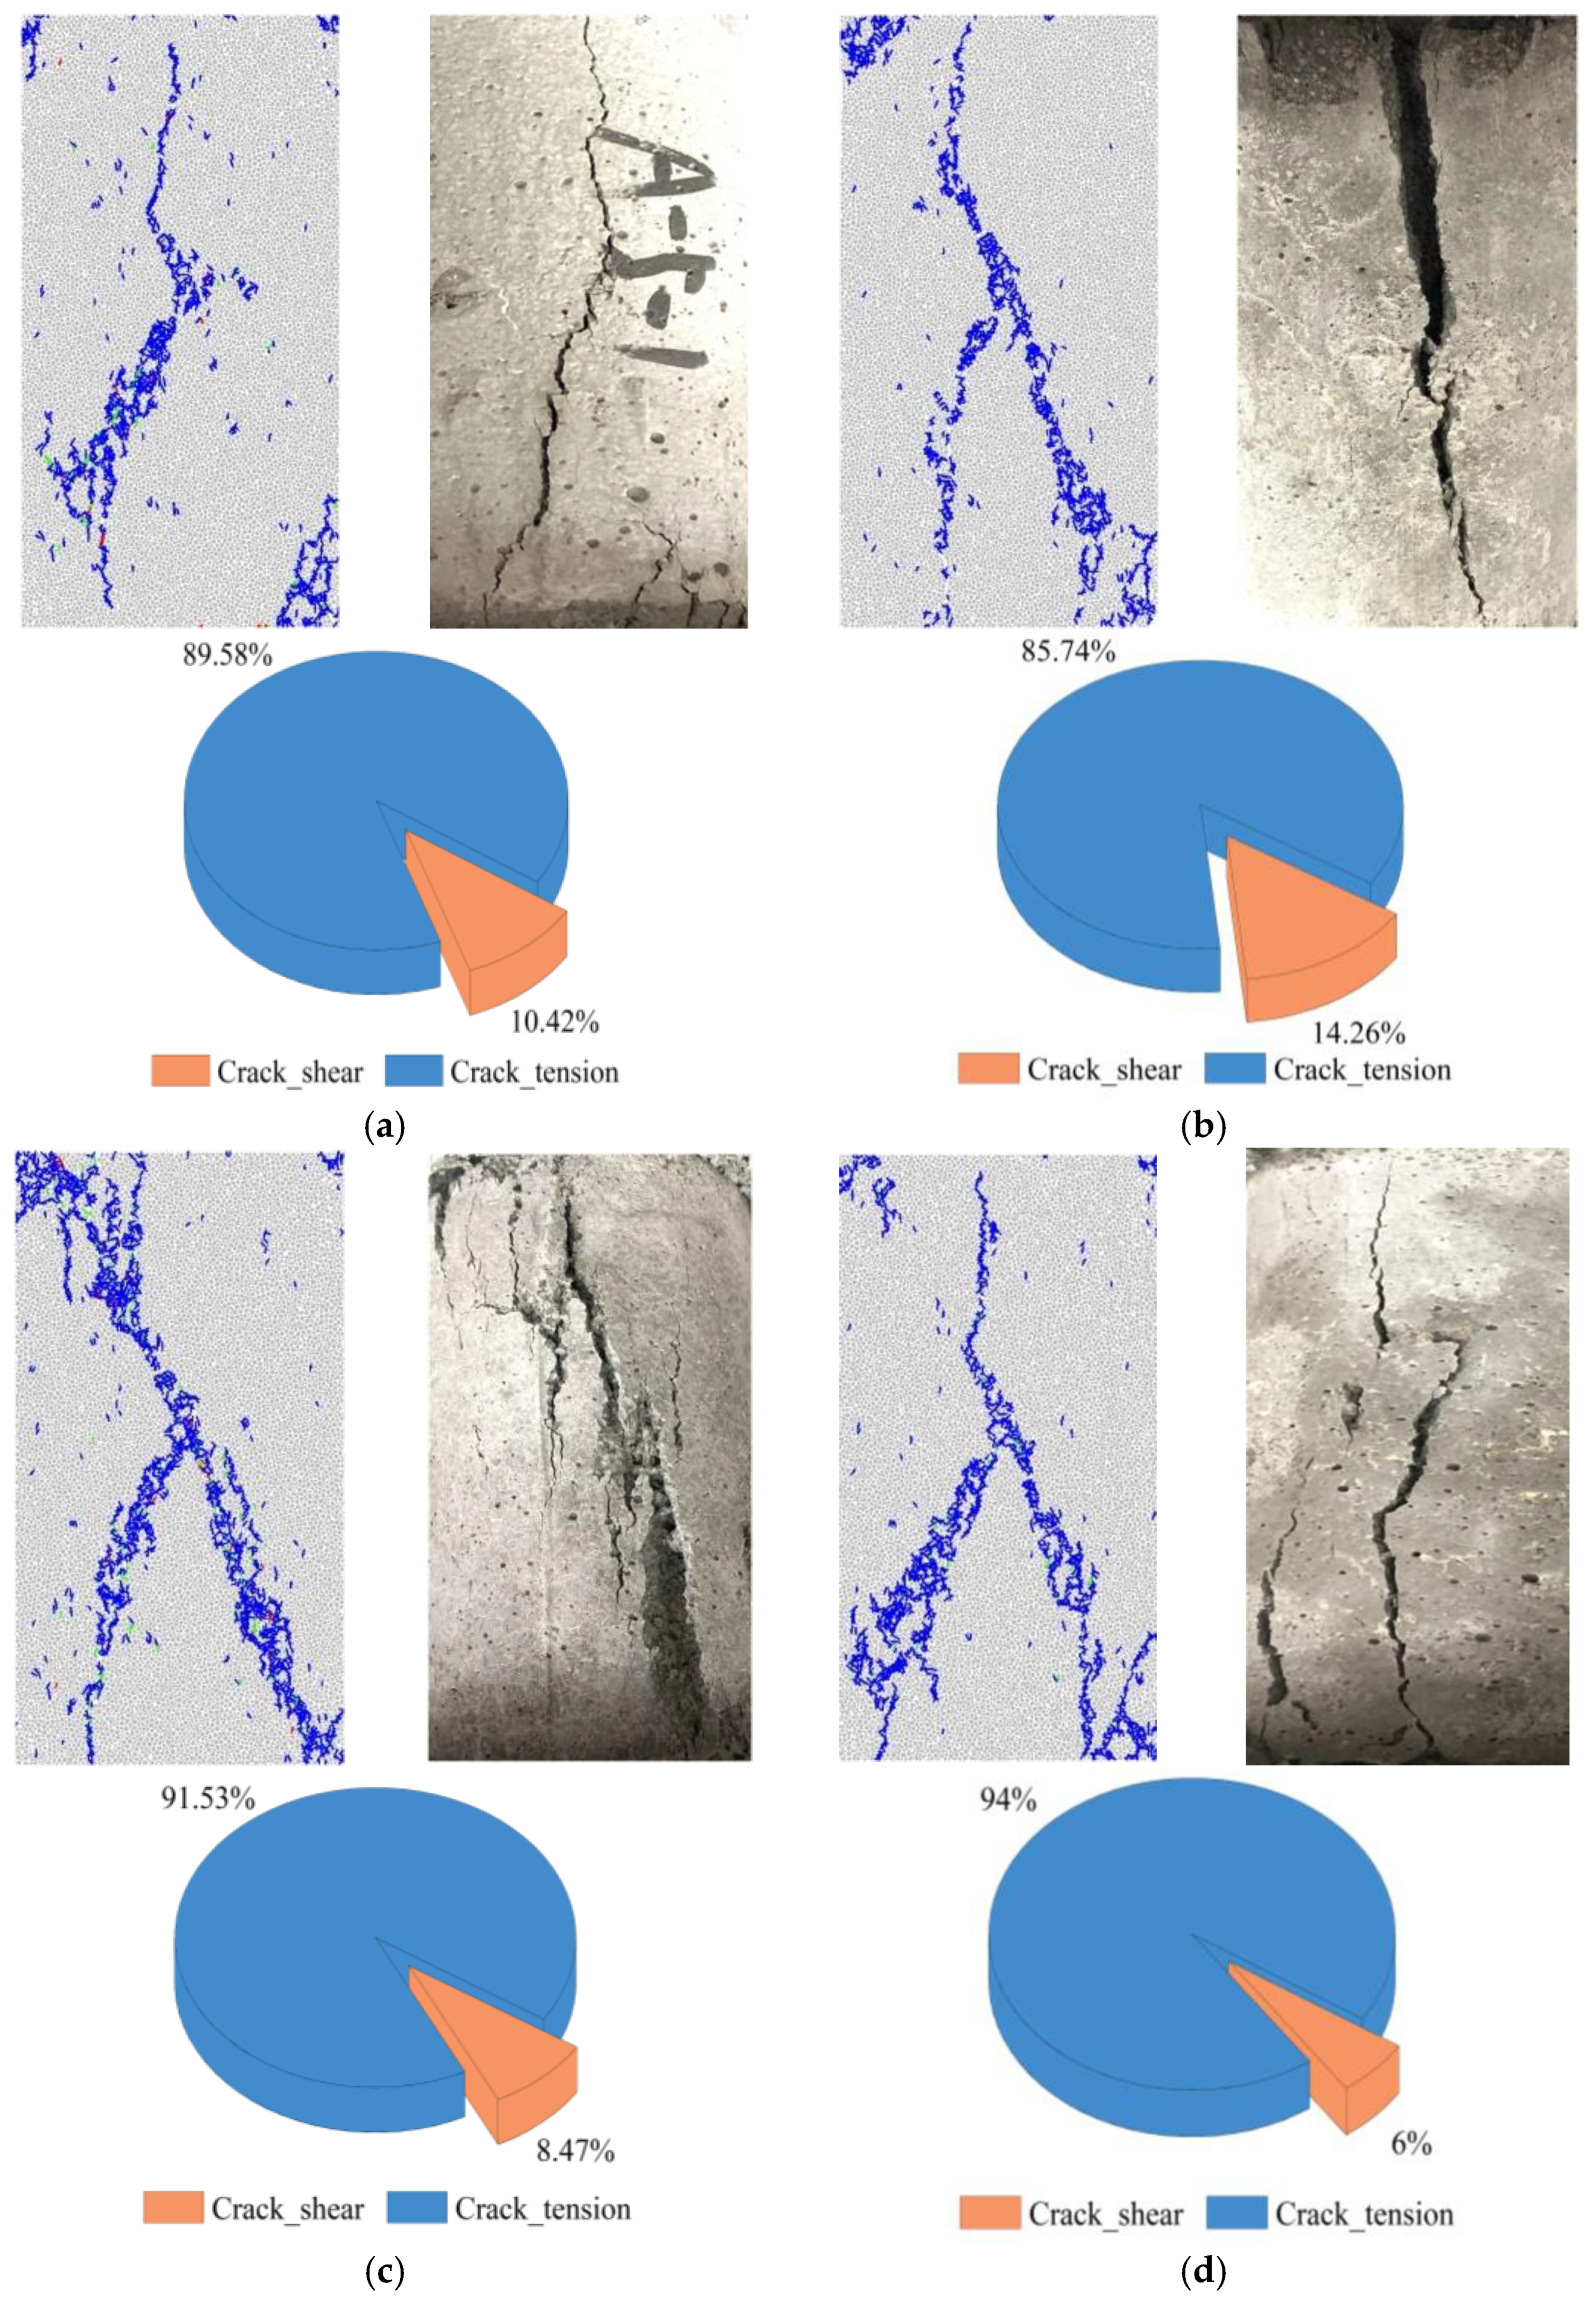
Figure 9 shows the final failure mode under different freeze-thaw cycles of internal mechanical testing and numerical simulation. The failure mode of the numerical simulation under different cycles was basically consistent with the results of internal mechanics tests. Furthermore, the cracks caused by internal force failure were mainly tensile cracks, accounting for 85.74~64%. There are fewer shear cracks, accounting for 6~14.26%. Combined with the failure mode and crack type analysis in the indoor test and numerical simulation, it can be seen that the failure mode under different cycles was mainly a tensile splitting failure, accompanied by local shear failure.
In the numerical simulation of the particle flow program, mechanical energy can be divided into body energy and contact energy. Body energy is a change in energy caused by a gravitational load or an applied load. Contact energy is the energy distribution defined in the contact model. In this law of energy evolution, the total energy is a kind of body energy, which is the energy generated by the boundary movement of the wall. Therein, the strain energy and the bond strain energy are the contact energies in the parallel bond model, which are stored in the linear spring and parallel spring, respectively.
Figure 10 shows the evolution of the number of cracks and four types of energies under different freeze-thaw cycles. From the figure, although the F-T cycle is different, the number of cracks in the process of load failure and the evolution of different types of energy are consistent. Based on the crack propagation of the 0 cycle, the crack propagation and energy evolution were divided into four stages. The first stage is the crack-free stage (0–0.44σ
c). As the force of the specimen gradually increased, the total energy, strain energy, and bond strain energy showed an increasing trend. At this stage, there were no cracks and no frictional energy. The total energy was basically converted into strain energy and cementation energy, which were stored in linear springs and parallel linear springs. The second stage is the slow growth of cracks (0.44σ
c–0.75σ
c). At this stage, the energy absorption rates for total energy, strain energy, and cementation energy increased, and the different energies showed an increasing trend. Cracks and frictional energy appeared inside the specimen, and there was a slow, increasing trend. It can be seen that the friction energy was synchronized with the crack propagation. When cracks appeared, the friction energy also appeared. Moreover, the friction energy showed an increasing trend with the increase in the number of cracks. When the strain between particles reached a certain degree, cracks occurred between different particles. The energy consumed by friction between particles when they are cracked is generated by both friction energies. Since the cracks inside the specimen were in the stage of germination and slow growth, the frictional energy was small. Therefore, the cementation energy and strain energy were much greater than the friction energy. The third stage is the crack acceleration growth stage (0.75σ
c–σ
c). In the stage of accelerated crack growth, the total energy, strain energy, and bond strain energy continued to show an increasing trend. The number of cracks increased, and the growth rate of friction energy increased gradually. More and more of the total energy is dissipated by the frictional energy that overcomes the sliding of the particles. The fourth stage is the rapid growth of cracks (σ
c). In the post-peak phase, the crack spread rapidly, and the friction energy increased rapidly. The bearing capacity of the specimen was weakened, and the rate of total energy growth decreased. The strain energy and boundary energy stored by the linear spring and parallel bond spring were released rapidly due to the failure, and the variation trend changed from increasing to decreasing.
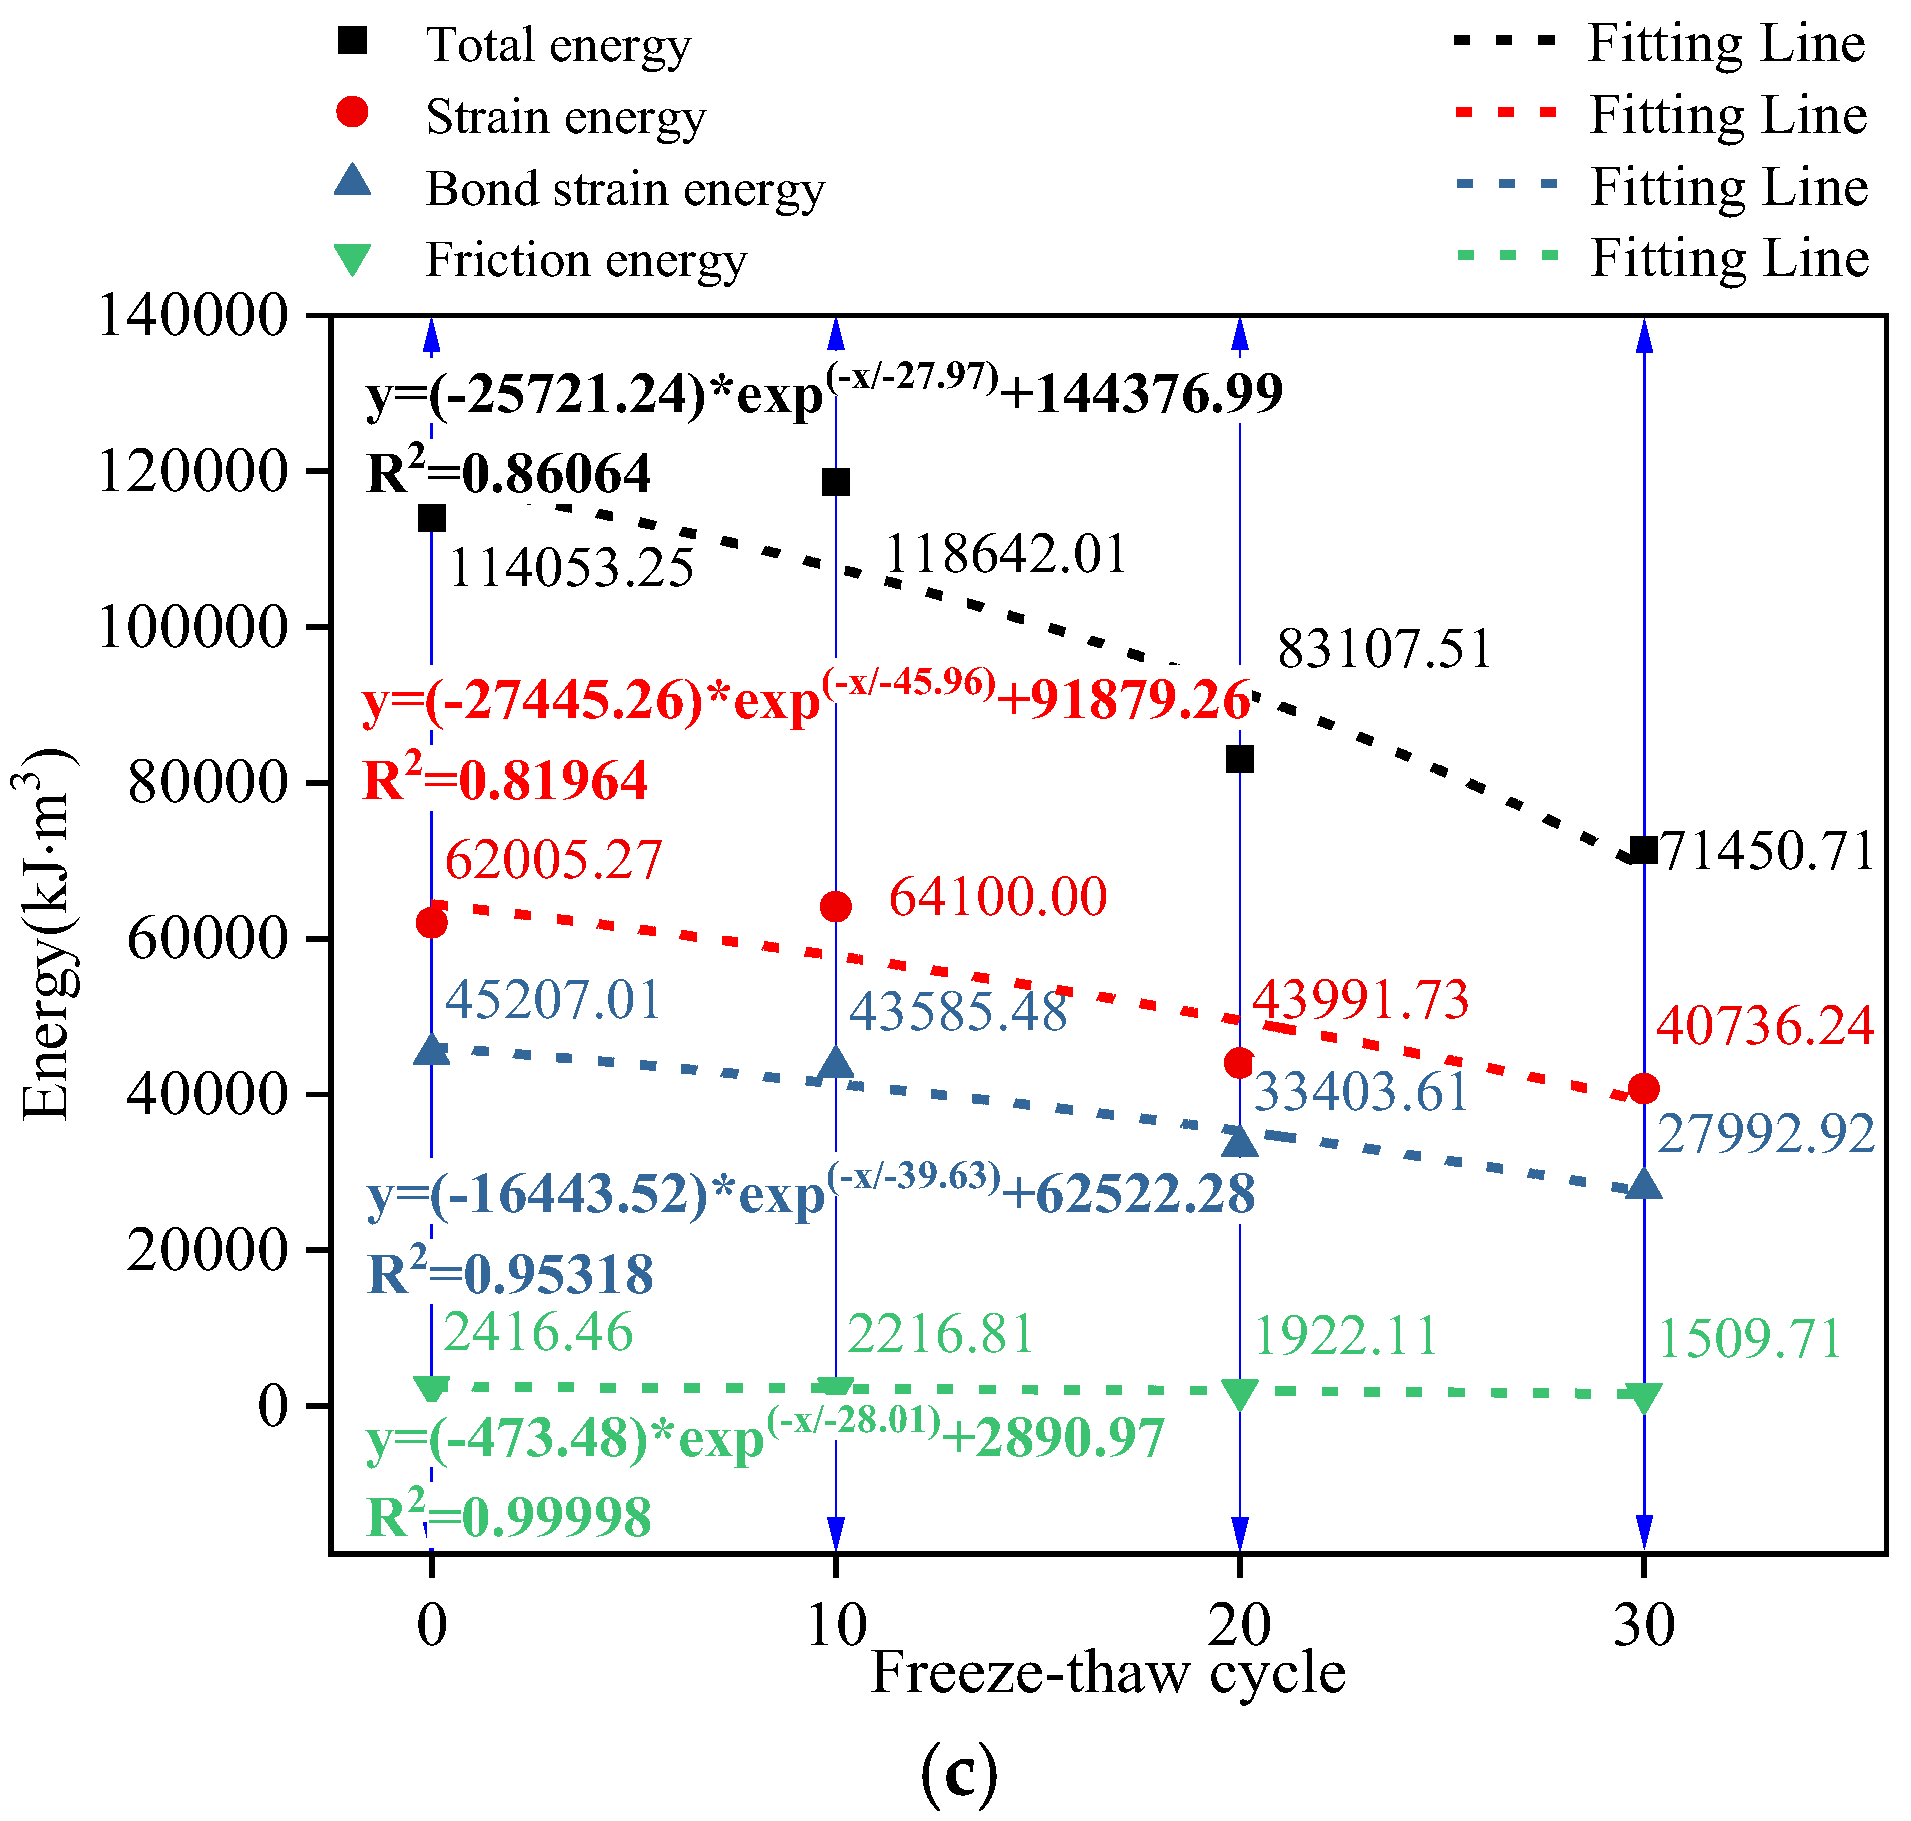
In order to explore the intrinsic relationship between the number of freeze-thaw cycles and different types of energy, the energy values of different stages were fitted to the F-T cycle. The fitting results are shown in
Figure 11. The results showed that when the value points are 0.44σ
c and 0.75σ
c, the total energy, strain energy, bond strain energy, and friction energy have a good exponential relationship with the freeze-thaw cycles, the fitting coefficients of which are above 0.94. With the gradual increase in the number of freeze-thaw cycles, the total energy, strain energy, bond strain energy, and friction energy all showed an exponentially decreasing trend. At the point of peak strength (σ
c), the number of freeze-thaw cycles was exponentially related to the total energy and strain energy, and the fitting coefficient was 0.81964~0.86064. However, the bond strain energy and friction energy conformed severally to a good exponential relationship with freeze-thaw cycles, for which the fitting coefficient was above 0.95. While the number of freeze-thaw cycles gradually increased, the total energy, strain energy, bond strain energy, and friction energy all showed the law of exponential decrease.
In conclusion, peak compressive strength and different types of energy have a good exponential relationship with the F-T cycle. The peak strength and different types of energy showed a decreasing trend with the increase in the number of freeze-thaw cycles. The test results can provide data support for the safety and stability analysis of rock slopes, such as mine slopes and highway shoulder slopes in low-temperature environments, providing guidance for their instability prevention.


