
Optimization of Differential Pricing and Seat Allocation in High-Speed Railways for Multi-Class Demands: A Chinese Case Study
Abstract
:1. Introduction
- In order to design a ticket strategy to better match the actual demands of different types of passengers, this paper conducts a bounded rational analysis for different types of passengers and optimizes the ticket strategy. This not only takes into account the differences between different types of passengers, but also increases the railway companies’ revenue.
- A simulated annealing algorithm is designed by constructing a search strategy of neighborhood solution for ticket strategy. First, an initial fare solution is obtained based on the upper and lower fares in each OD. Based on the ticket price solution, the problem is transformed into an integer linear programming problem. The seat allocation solution can be obtained by using the solver. Then, the designed search strategy of neighborhood solution is used to improve the fare solution and update the optimal solution.
2. Literature Review
2.1. The Research on Demand Division
2.2. Travel Choice Behavior
2.3. The Development of Differentiated Pricing and Seat Allocation
3. Model Building
3.1. Model Assumptions
- Assumption 1: each train has the same transport capacity. The number of sales tickets related to each section cannot exceed this capacity, and the oversold, change or refund of tickets is not considered.
- Assumption 2: the train stop plan is fixed and the train arrives at the station according to the schedule, regardless of the influence of external factors such as delays.
- Assumption 3: this study only considers the seat allocation of second-class seats.
3.2. Passenger Flow Assignment
3.3. Mathematical Model
4. Solution Algorithm
4.1. Generate Initial Fare Solution
4.2. Generate Seat Allocation Solution
4.3. Neighbourhood Price Solution
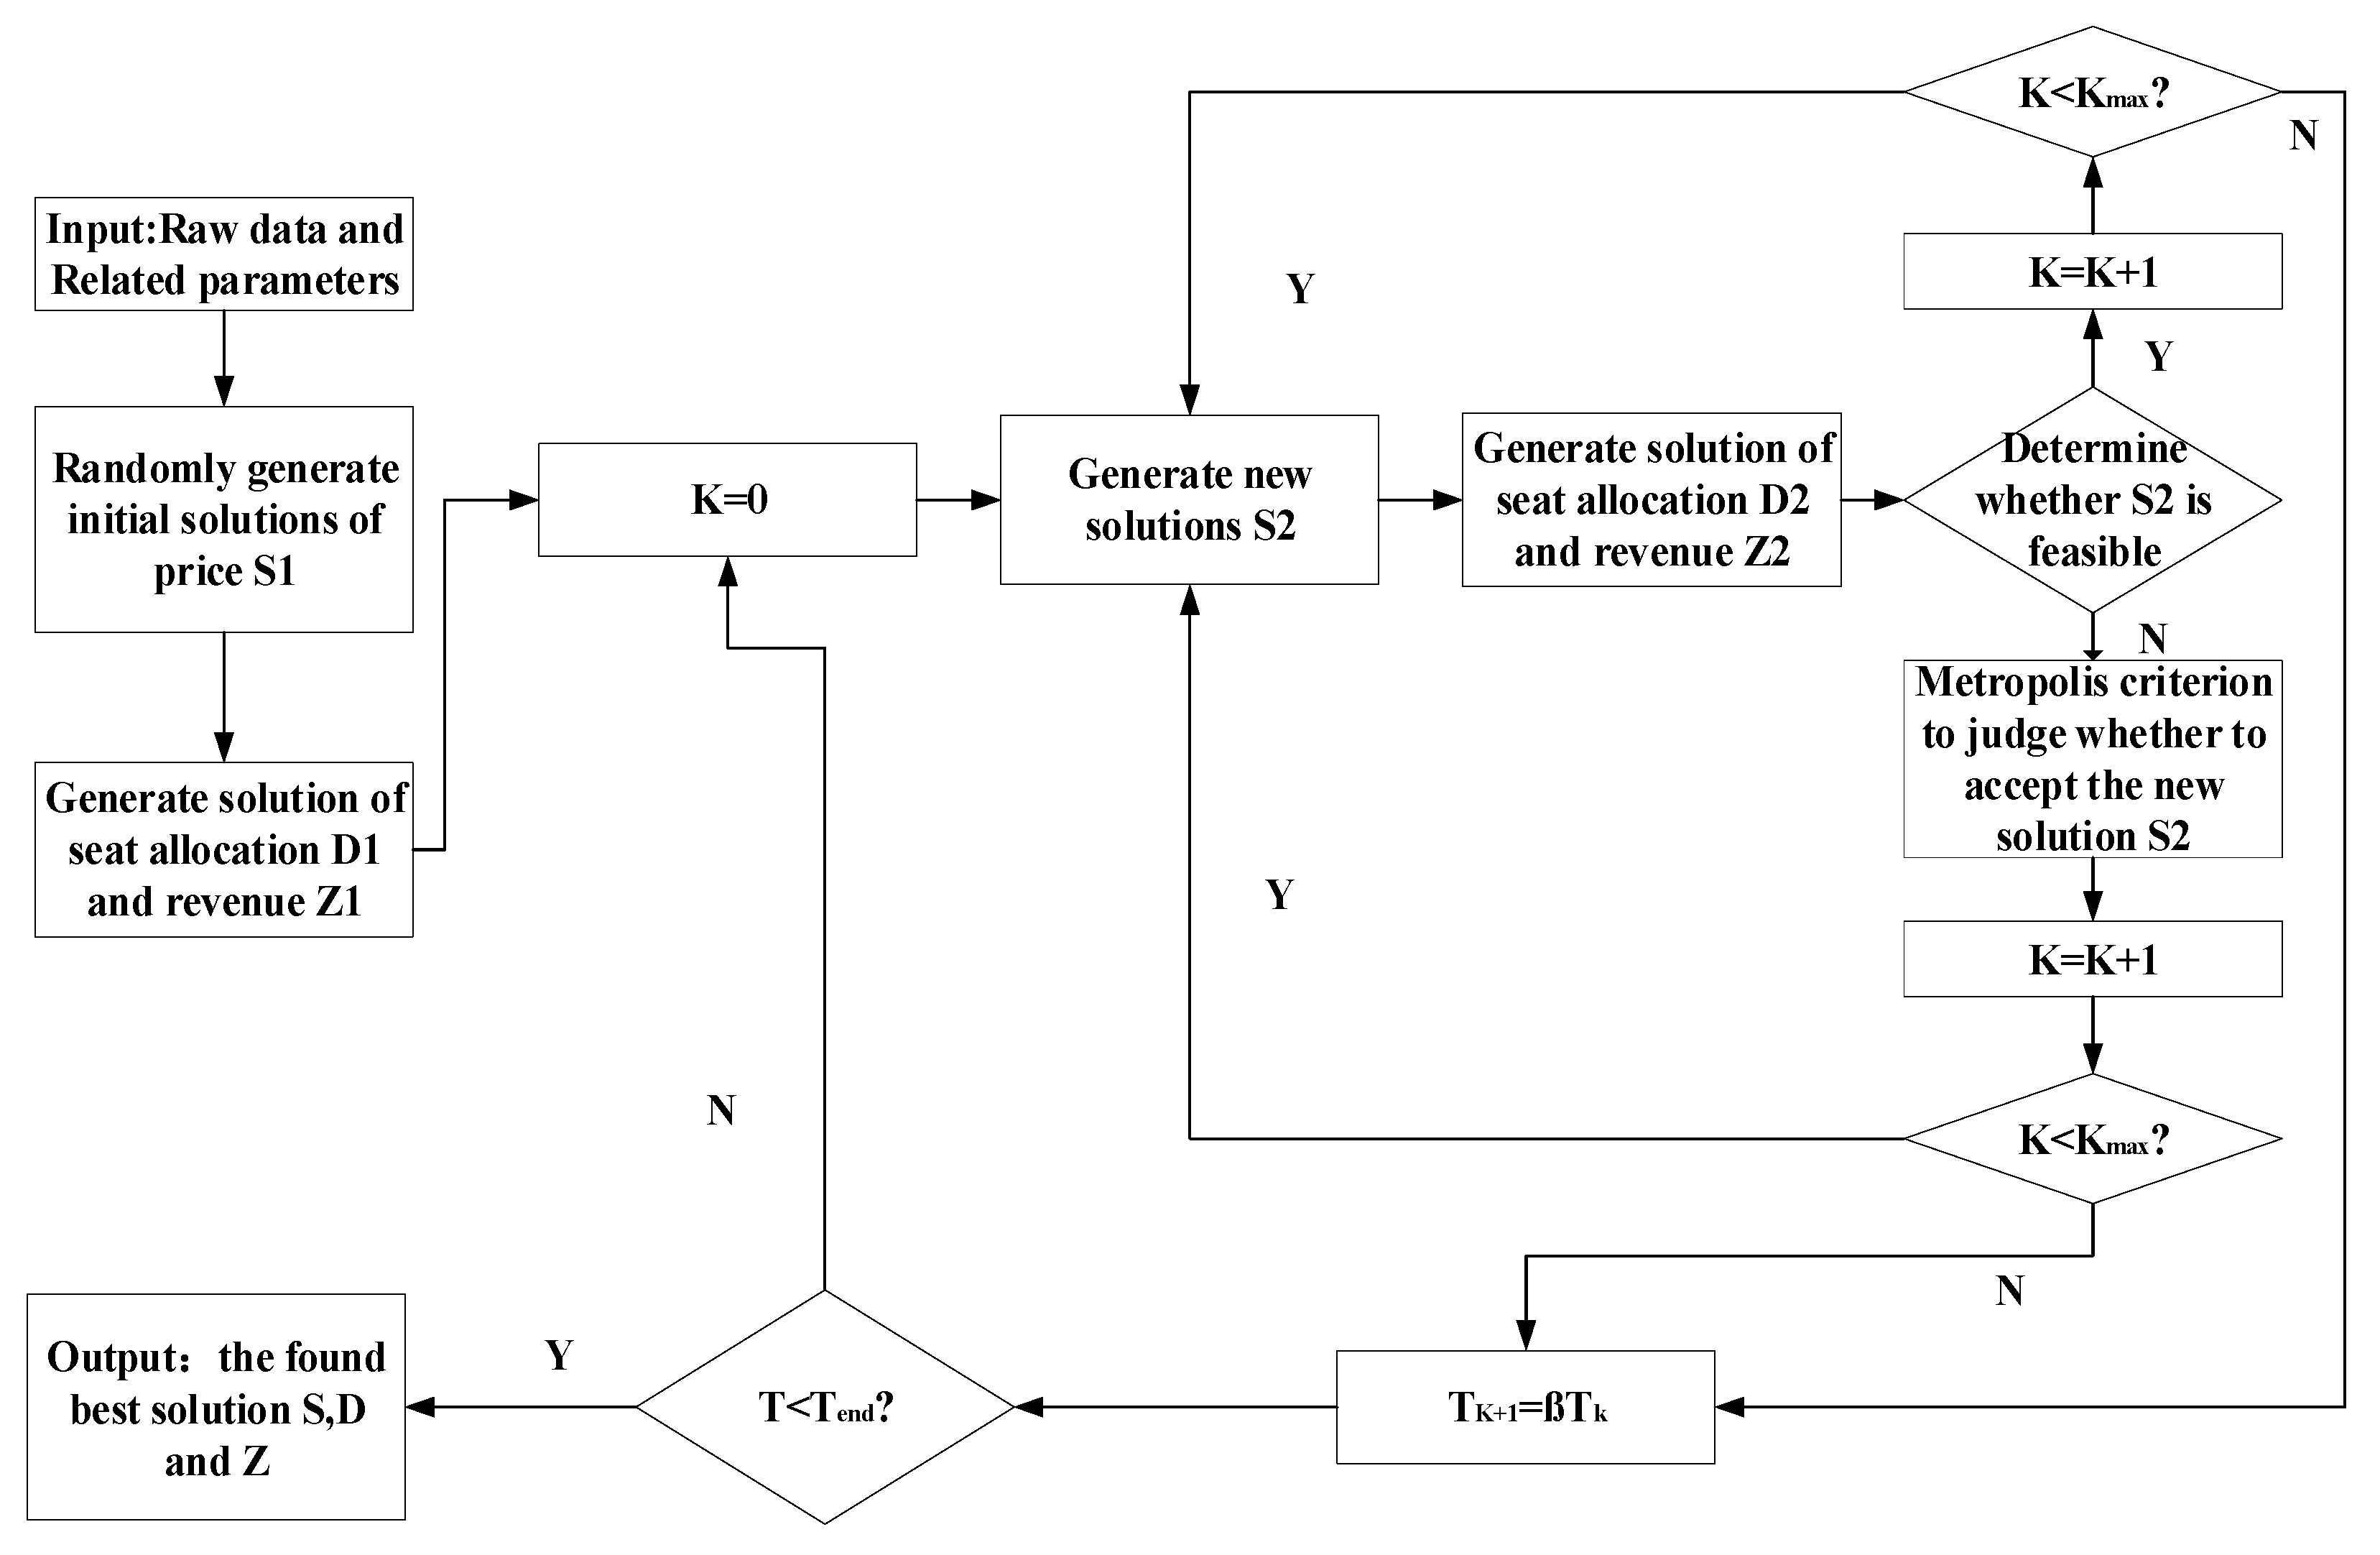
4.4. SA Algorithm Steps
| Algorithm 1. Obtaining the optimal ticket fare solution and the corresponding seat allocation solution, maximizing HSR revenue. |
| Input: initial temperature , temperature drop ratio , final temperature , price range (,), the number of iterations at different temperatures , upper limit of iteration times at different temperatures Output: best solution of revenue, best solution of price, best solution of seat allocation. Start Step 1. Generate the initial fare solution Based on the upper and lower fares settings, the initial fare solution combinations for each OD of each train are randomly generated. Step 2. Generate the seat allocation solution According to the combination of ticket fare solutions obtained, the allocated passenger flow of each train is determined through Formulas (1)–(13). The problem is transformed into an integer programming problem with only the constraint of seat allocation, which can be solved directly using Cplex software. The initial revenue is calculated as , the initial seat allocation solution is calculated as , the initial optimal solution is set as , and the current solution set as . Step 3. Neighborhood Price Solution Neighborhood solutions are generated by using the neighborhood solution search strategy detailed in Section 4.3. The corresponding seat allocation solution and the maximum value of the neighborhood solutions can be calculated. Step 4. Determine whether to update the global optimal solution Implementing the Metropolis criterion: (1) If , accept the neighborhood solution as the current solution and the optimal solution , and let. (2) If , accept the neighborhood solution as the current solution , and let , keep the optimal solution unchanged. Otherwise, keep the optimal solution and the current solution unchanged. Step 5. Check the number of iterations at the current temperature If , then drop the temperature , and ; otherwise set the number of constant temperature iterations , and go to step 3. Step 6. Check termination conditions If or the optimal solution does not change in iterations, terminate the algorithm and output the final solution ; otherwise, set and go to step 3. End |
5. Case Study
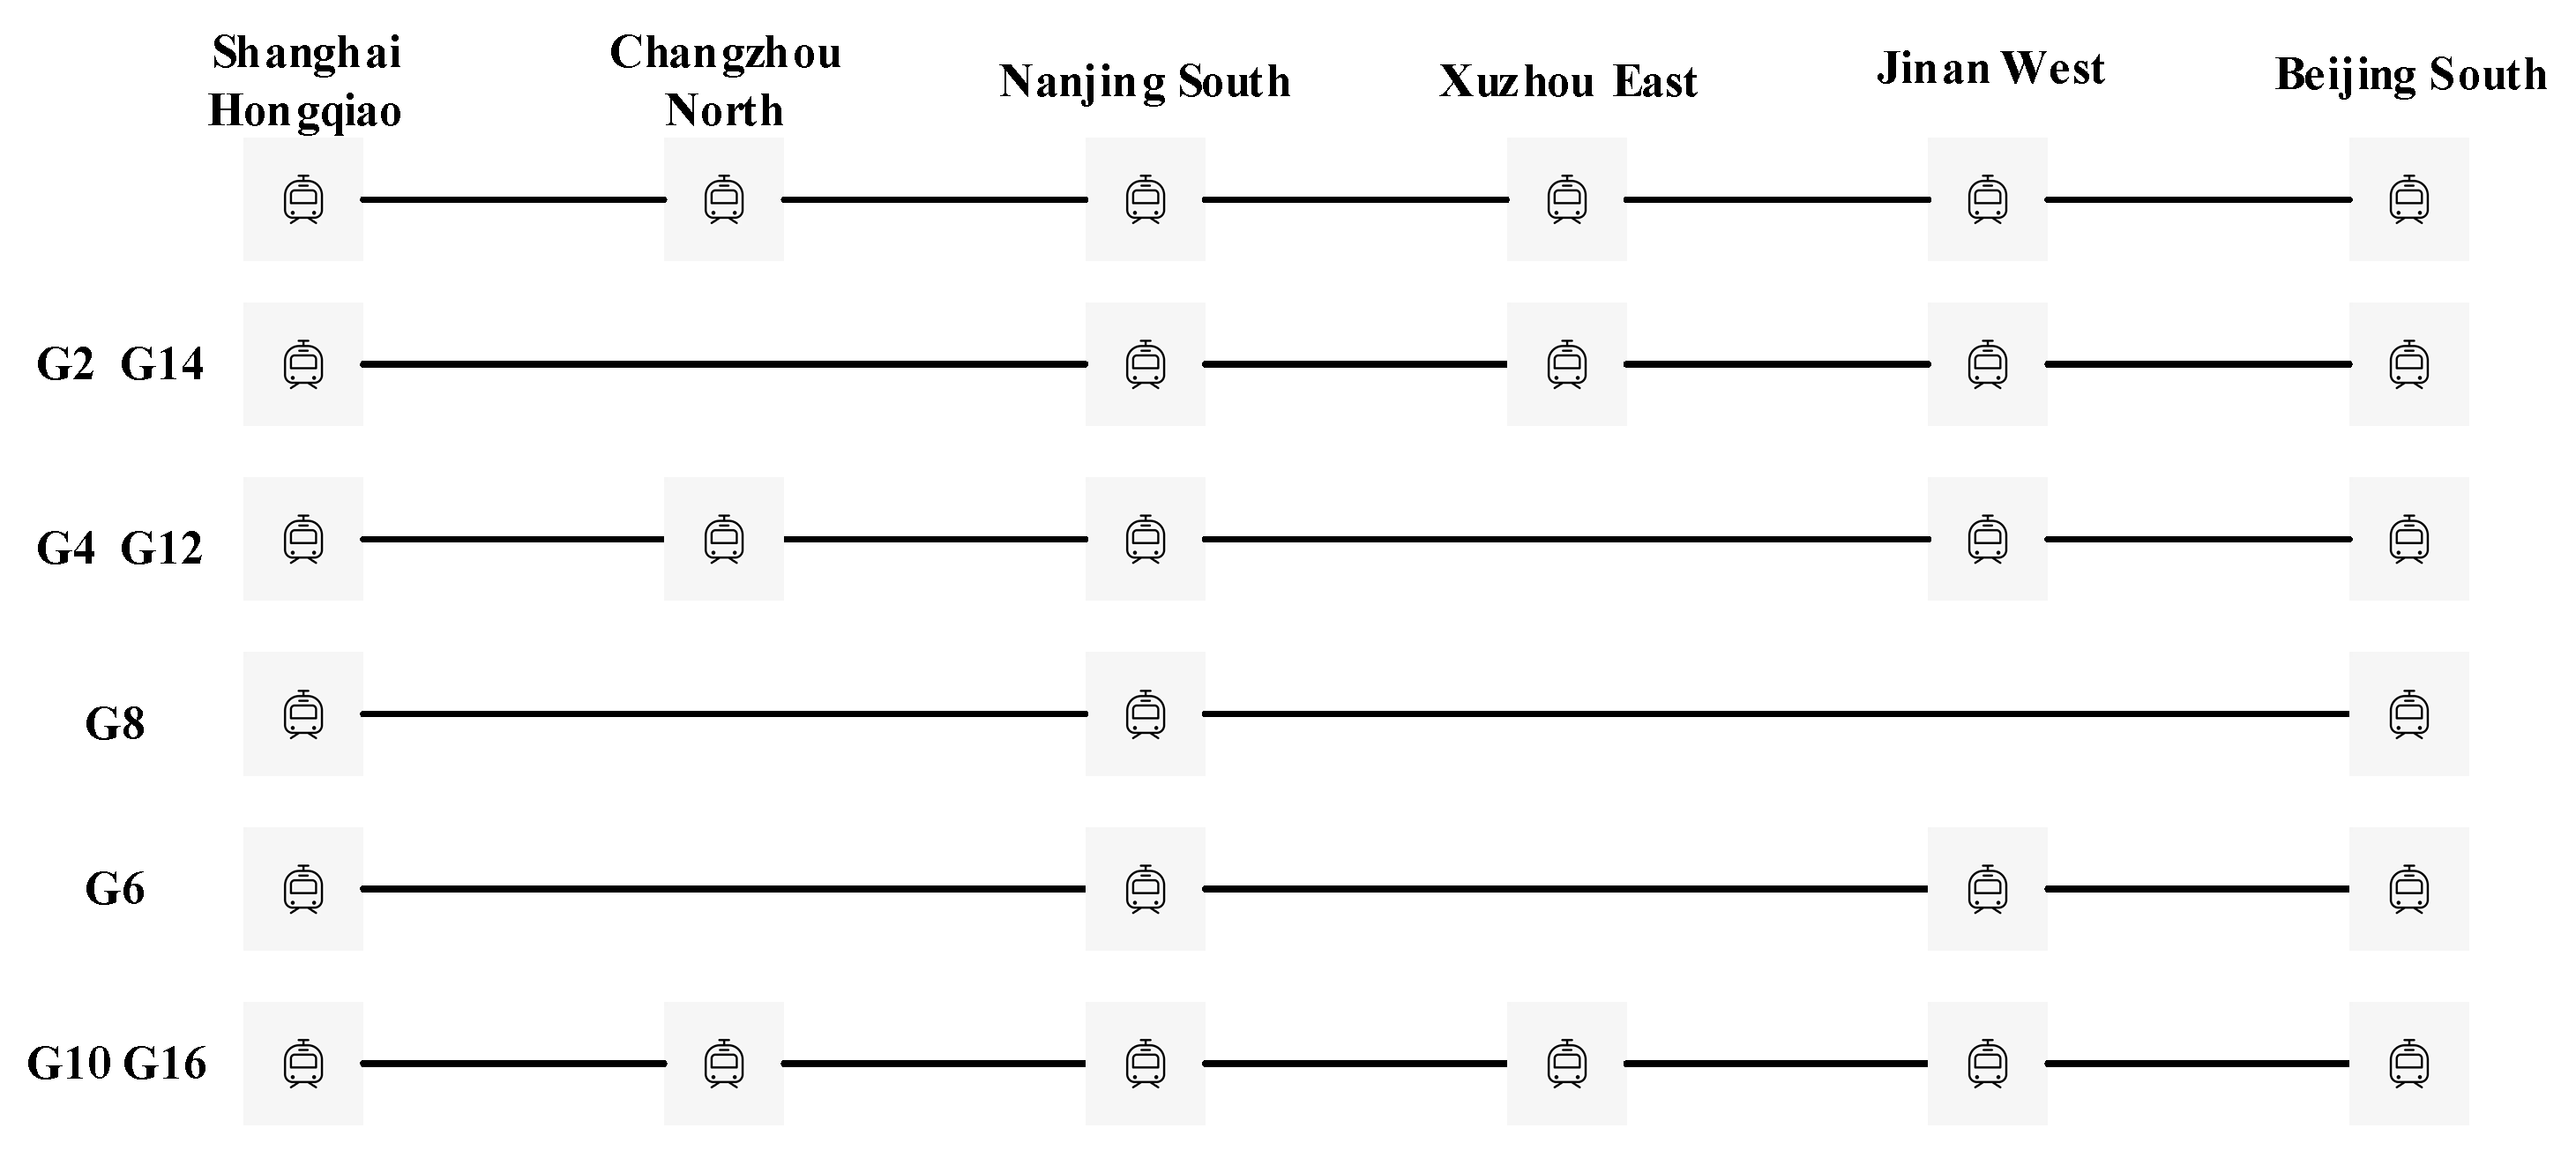
5.1. Basic Data
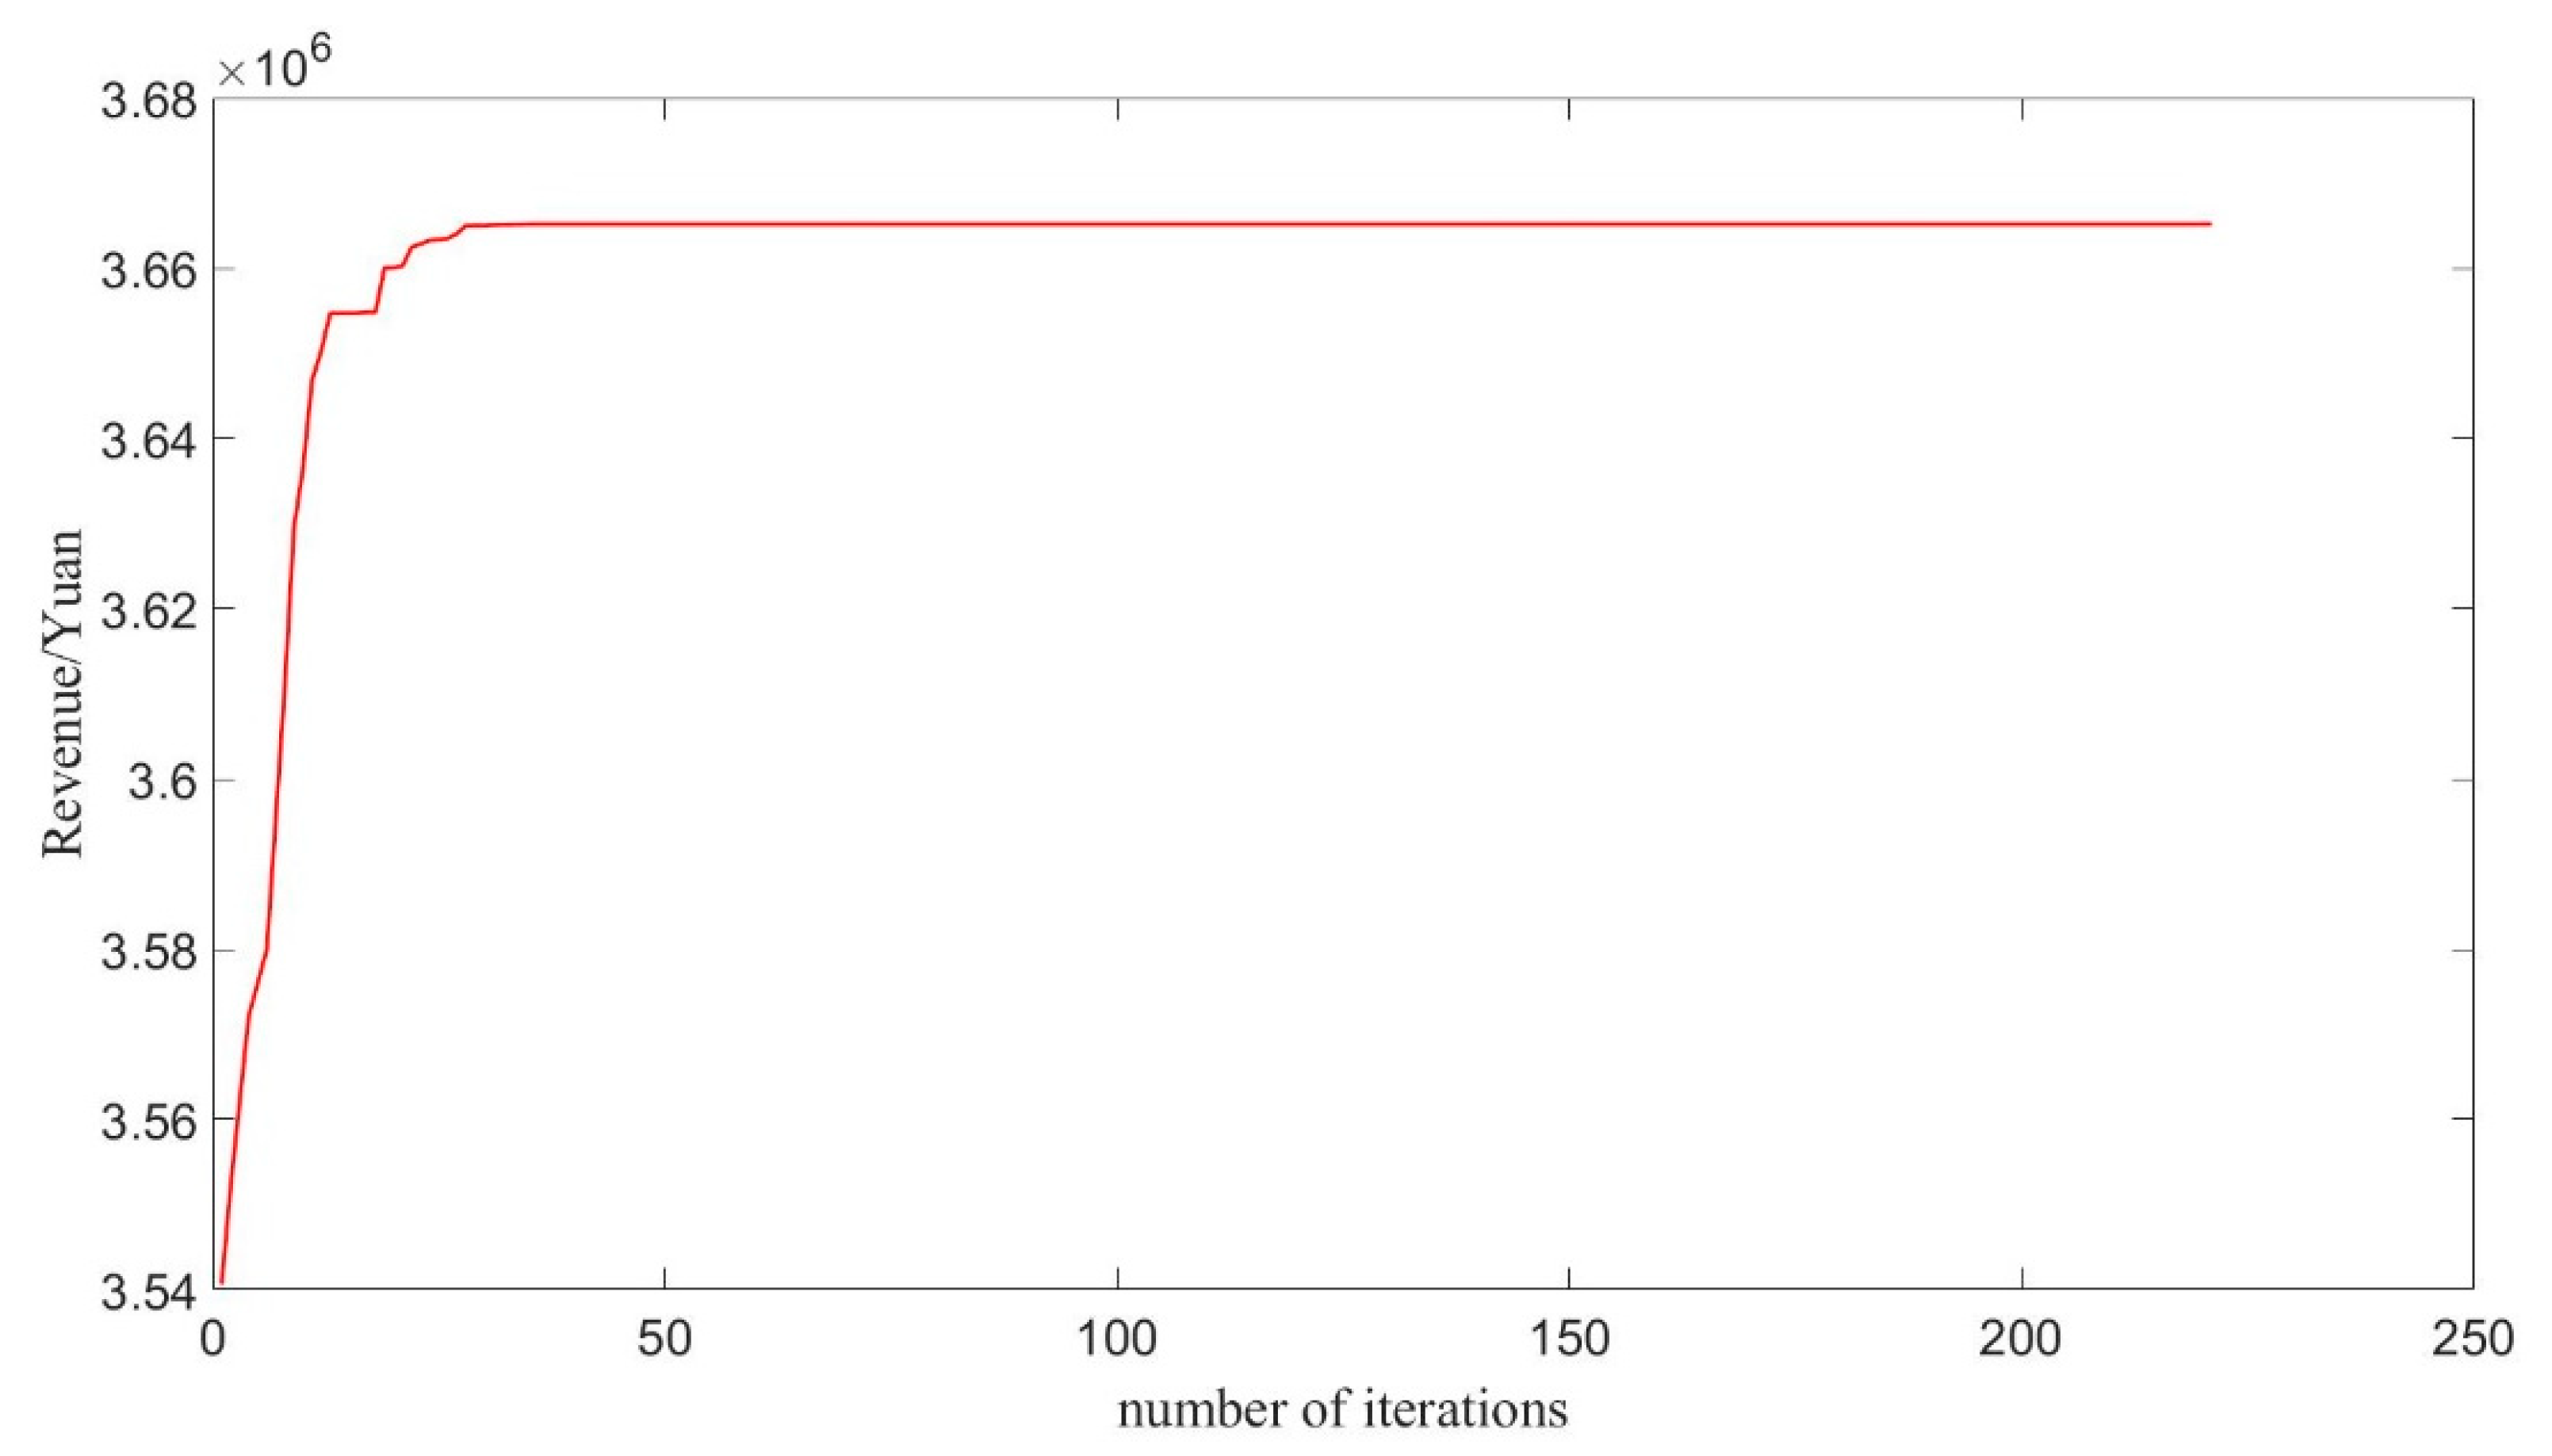
5.2. Results and Discussion
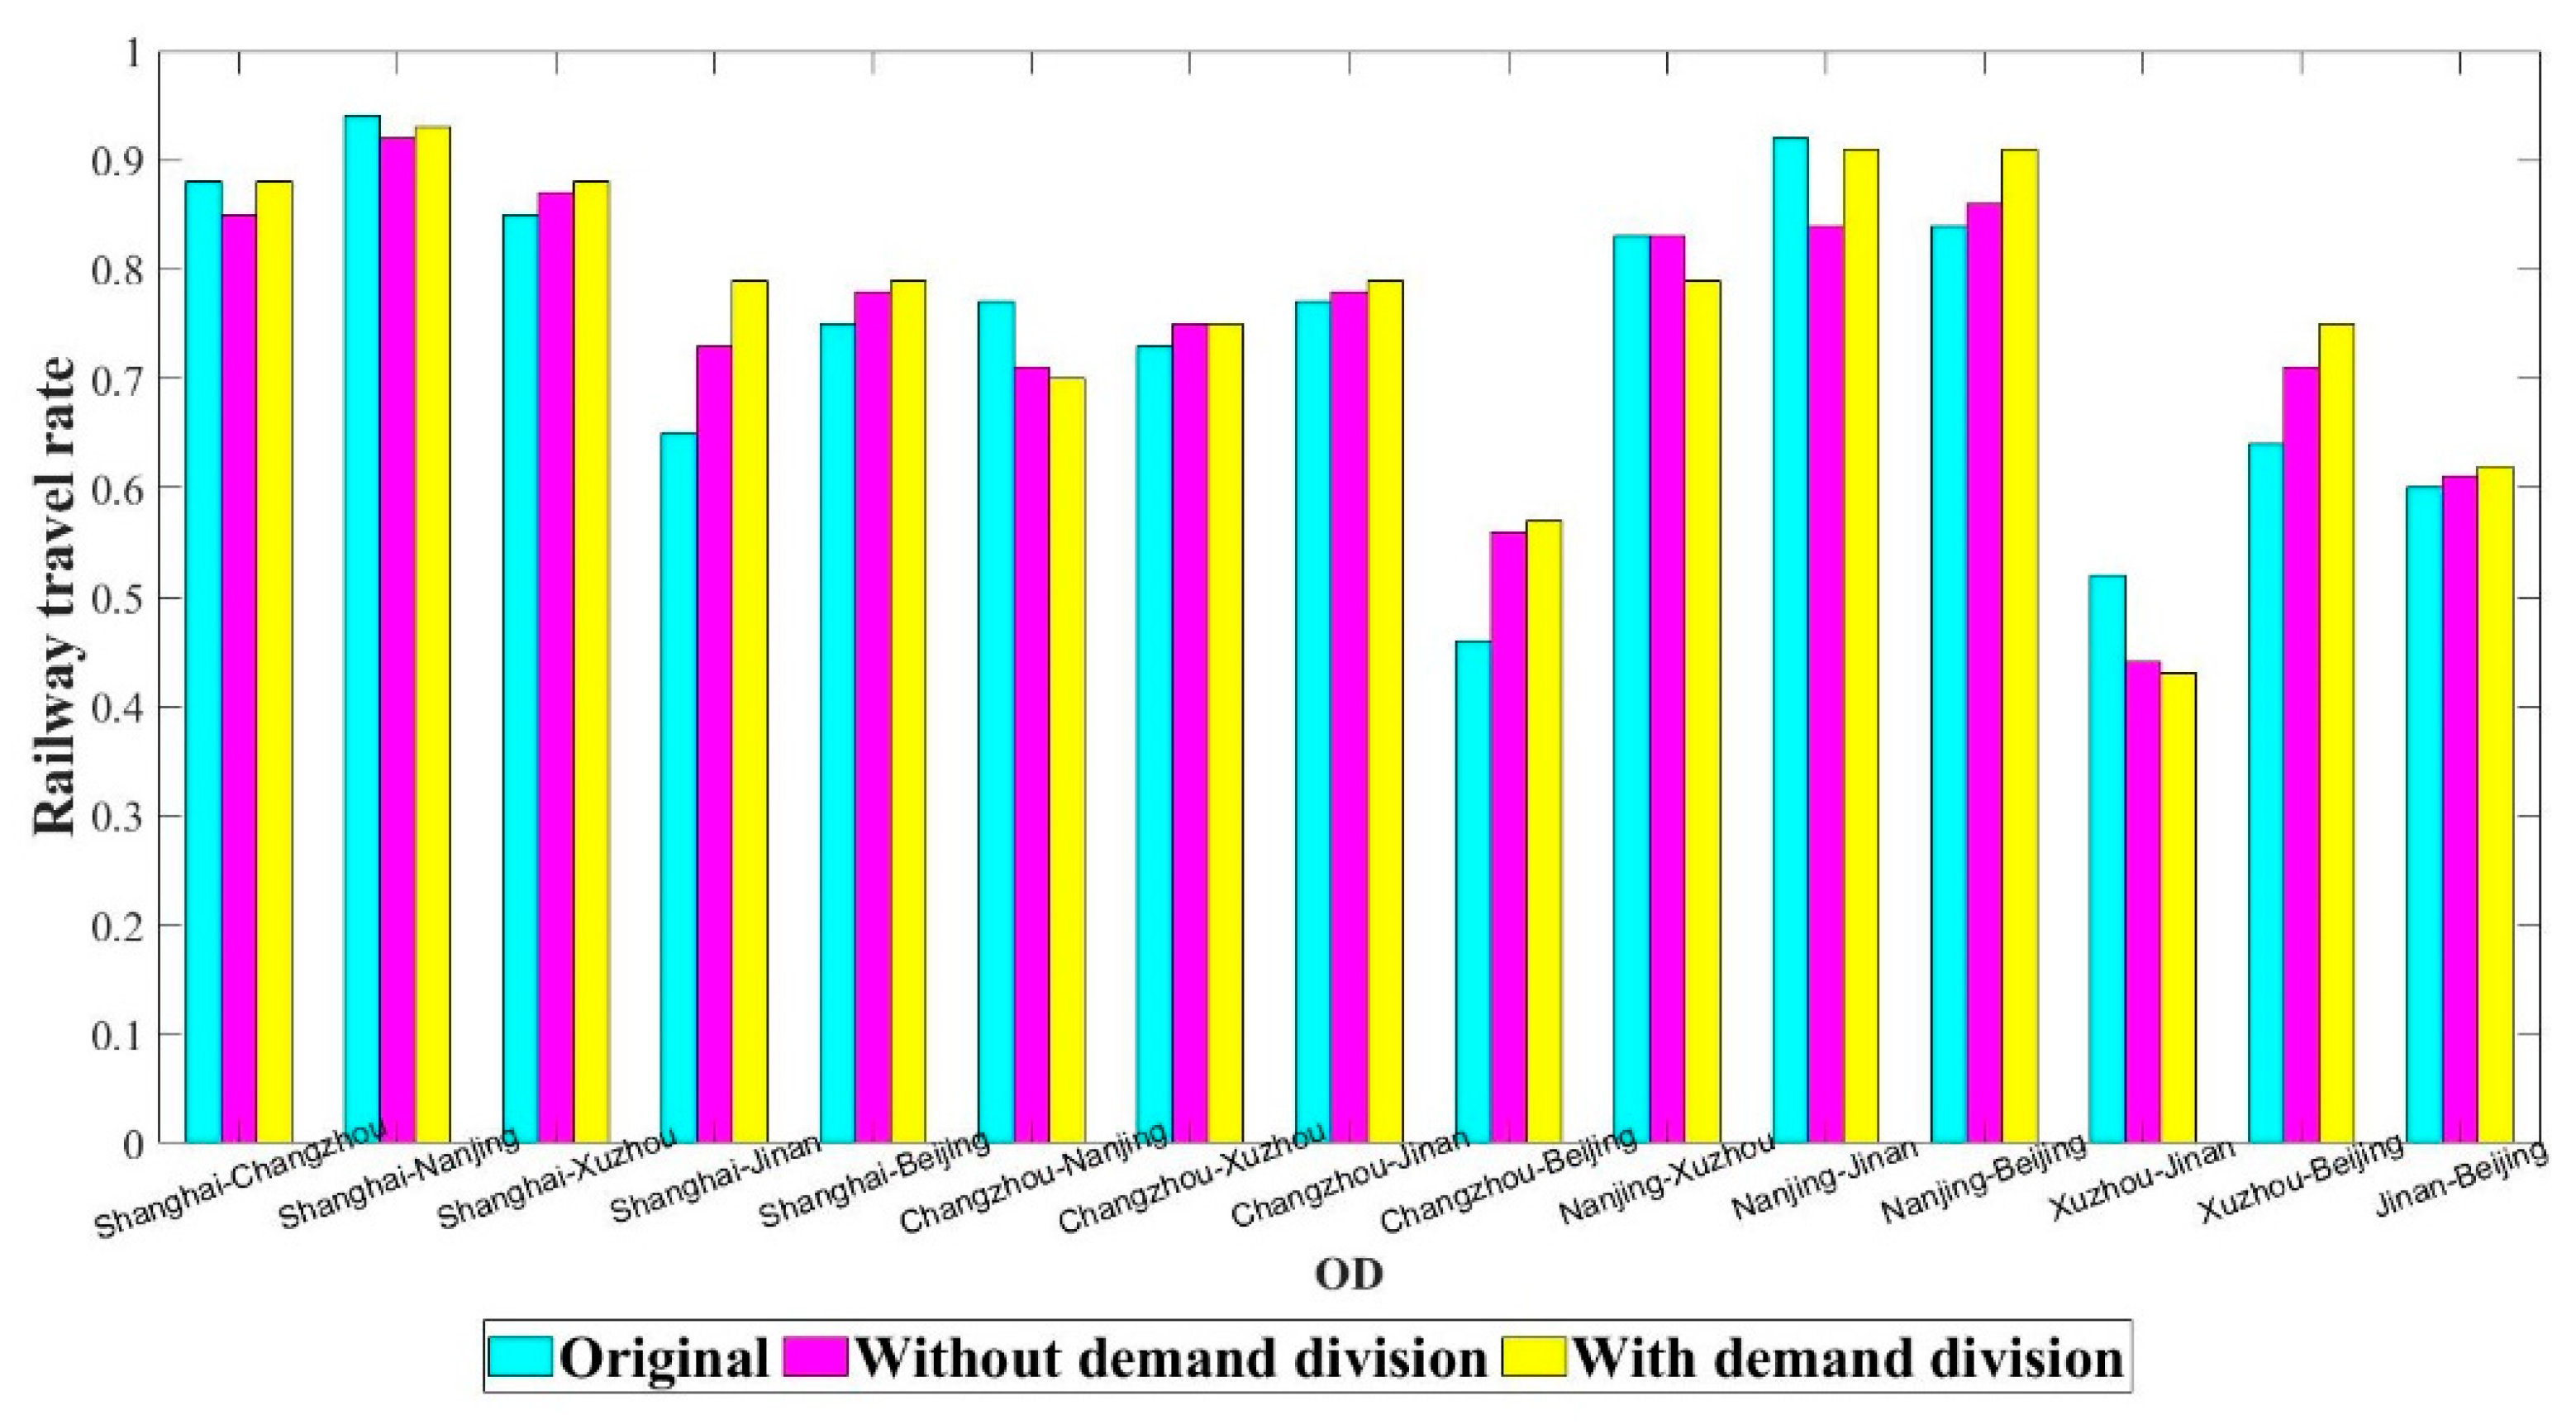
5.3. Comparison with the Unclassified Passenger Flow Case
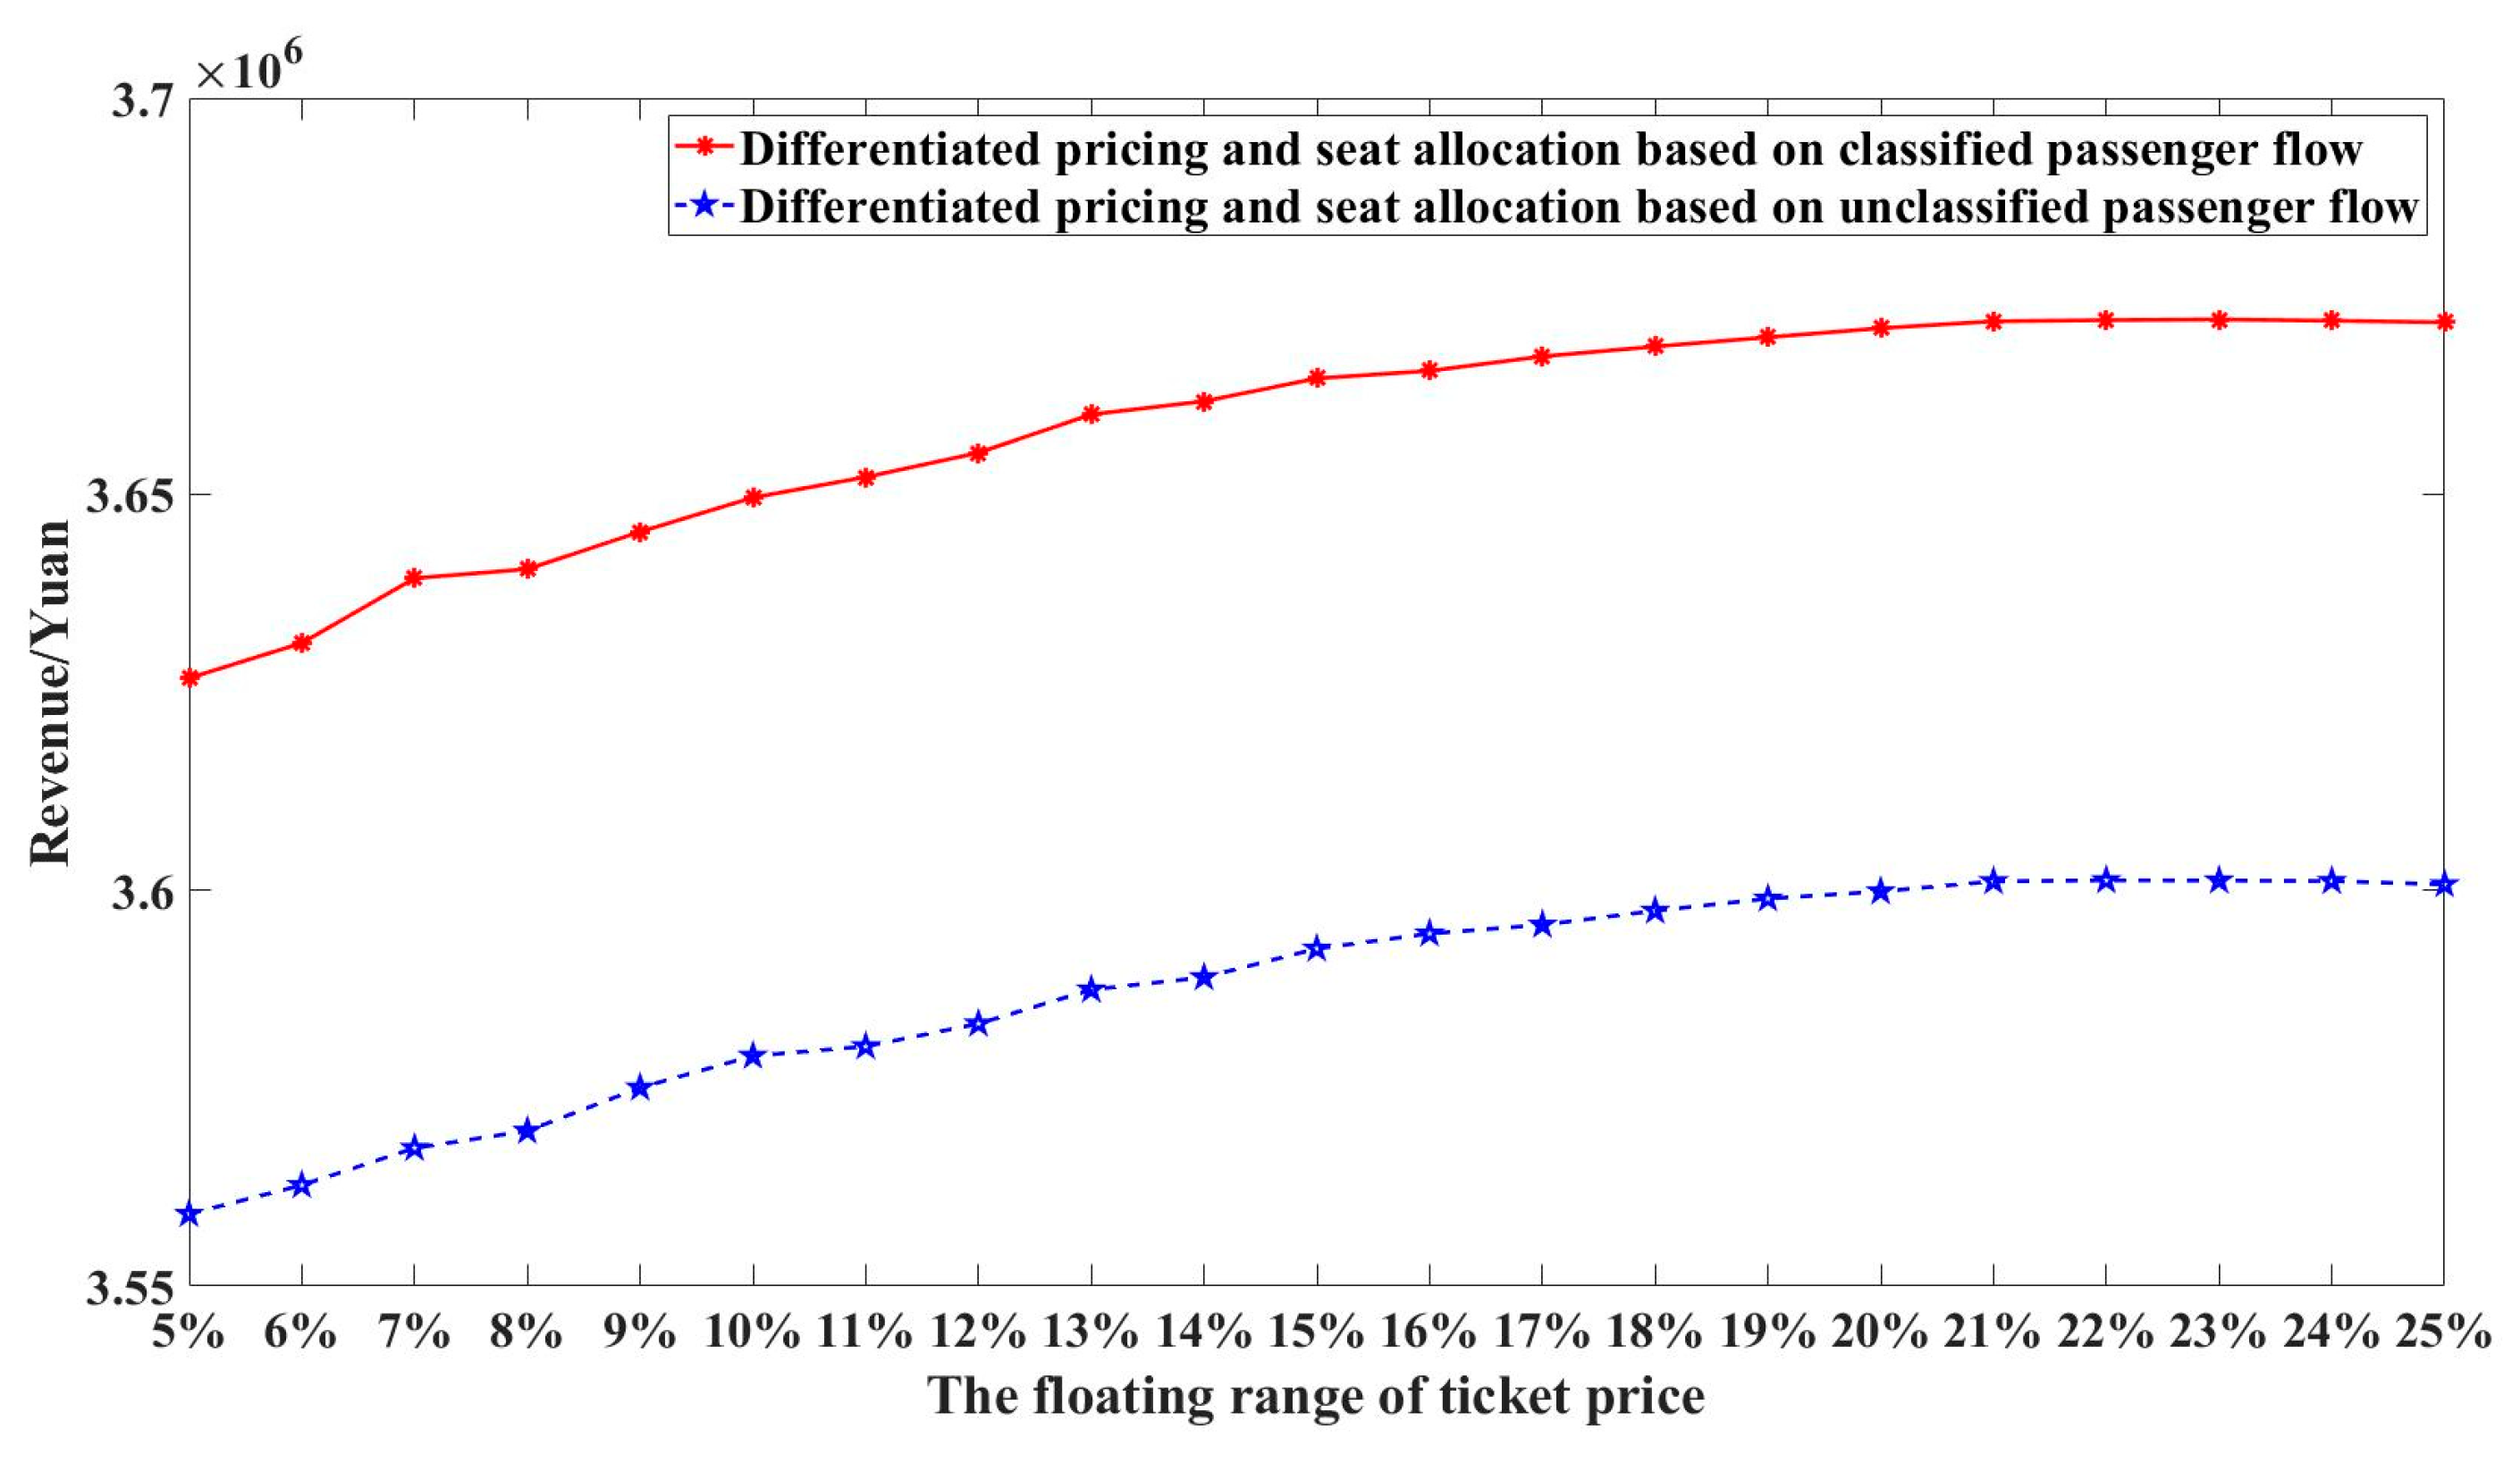
5.4. Sensitivity Analysis
- (1)
- The influence of the floating range of ticket price on optimization results.
- (2)
- The influence of parameter and on optimization results.
6. Conclusions and Further Research
Author Contributions
Funding
Institutional Review Board Statement
Informed Consent Statement
Data Availability Statement
Acknowledgments
Conflicts of Interest
References
- Sun, Y.; Jiang, Z.; Gu, J.; Zhou, M.; Li, Y.; Zhang, L. Analyzing high speed rail passengers’ train choices based on new online booking data in China. Transp. Res. Part C Emerg. Technol. 2018, 97, 96–113. [Google Scholar] [CrossRef]
- Wu, X.; Qin, J.; Qu, W.; Zeng, Y.; Yang, X. Collaborative Optimization of Dynamic Pricing and Seat Allocation for High-Speed Railways: An Empirical Study from China. IEEE Access 2019, 7, 139409–139419. [Google Scholar] [CrossRef]
- Zhang, C.; Liu, T.; Huang, H.; Chen, J. A cumulative prospect theory approach to commuters’ day-to-day route-choice modeling with friends’ travel information. Transp. Res. Part C Emerg. Technol. 2018, 86, 527–548. [Google Scholar] [CrossRef]
- Drabas, T.; Wu, C. Modelling air carrier choices with a Segment Specific Cross Nested Logit model. J. Air Transp. Manag. 2013, 32, 8–16. [Google Scholar] [CrossRef]
- Chao, C.; Lirn, T.; Shang, K. Market segmentation of airline cargo transport. Serv. Ind. J. 2013, 33, 1672–1685. [Google Scholar] [CrossRef]
- Hetrakul, P.; Cirillo, C. Accommodating taste heterogeneity in railway passenger choice models based on internet booking data. J. Choice Model 2013, 6, 1–16. [Google Scholar] [CrossRef]
- Hetrakul, P.; Cirillo, C. A latent class choice based model system for railway optimal pricing and seat allocation. Transp. Res. Part E Logist. Transp. Rev. 2014, 61, 68–83. [Google Scholar] [CrossRef]
- Duan, L.; Peng, Q.; Tang, Y.; Li, B. Preference Differentiation of Railway Shippers and Market Segmentation Method Based on LC-HB Model. J. China Railw. Soc. 2017, 25, 416–424. [Google Scholar]
- Qiao, K.; Zhao, P.; Wen, J. Passenger Market Segmentation of High-speed Railway Based on Latent Class Model. J. Transp. Syst. Eng. Inf. Technol. 2017, 17, 28–34. [Google Scholar]
- Eldeeb, G.; Mohamed, M. Quantifying preference heterogeneity in transit service desired quality using a latent class choice model. Transp. Res. Part A Policy Pract. 2020, 139, 119–133. [Google Scholar] [CrossRef]
- Li, B.; Zhao, P.; Li, Y.; Song, W. Research on Dynamic Pricing of Parallel Trains of High-speed Railway Based on Passenger Segment. J. China Railw. Soc. 2017, 39, 10–16. [Google Scholar]
- Hao, X.; Zhu, J.; Shan, X.; Li, W. Research on Marketing Strategy of Railway Passenger Travel Behaviour Analysis in Competitive Section. Sci. Program. 2022, 2022, 1691400. [Google Scholar] [CrossRef]
- Paulley, N.; Balcombe, R.; Mackett, R.; Titheridge, H.; Preston, J.; Wardman, M.; Shires, J.; White, P. The demand for public transport: The effects of fares, quality of service, income and car ownership. Transp. Policy 2006, 13, 295–306. [Google Scholar] [CrossRef] [Green Version]
- Gu, R.; Li, Y.; Cen, X. Exploring the stimulative effect on following drivers in a consecutive lane-change using microscopic vehicle trajectory data. J. Transp. Saf. Secur. 2022, tdac047. [Google Scholar] [CrossRef]
- Li, Y.; Gu, R.; Lee, J.; Yang, M.; Chen, Q.; Zhang, Y. The dynamic tradeoff between safety and efficiency in discretionary lane-changing behavior: A random parameters logit approach with heterogeneity in means and variances. Accid. Anal. Prev. 2021, 153, 106036. [Google Scholar] [CrossRef]
- Santos, G.; Maoh, H.; Potoglou, D.; Von Brunn, T. Factors influencing modal split of commuting journeys in medium-size European cities. J. Transp. Geogr. 2013, 30, 129–137. [Google Scholar] [CrossRef]
- Thrane, C. Examining tourists’ long-distance transportation mode choices using a Multinomial Logit regression model. Tour. Manag. Perspect. 2015, 15, 115–121. [Google Scholar] [CrossRef]
- Chou, F.; Parlar, M. Optimal control of a revenue management system with dynamic pricing facing linear demand. Optim. Control. Appl. Methods 2006, 27, 323–347. [Google Scholar] [CrossRef]
- Basu, D.; Hunt, J.D. Valuing of attributes influencing the attractiveness of suburban train service in Mumbai city: A stated preference approach. Transp. Res. Part A Policy Pract. 2012, 46, 1465–1476. [Google Scholar] [CrossRef]
- Wang, W.; Ni, S.; Lv, X.; Guo, J. Boarding Choice for High-speed Railway Passengers Based on Disaggregate Theory. J. Transp. Syst. Eng. Inf. Technol. 2015, 15, 13–18+43. [Google Scholar]
- Jung, S.; Yoo, K. A study on passengers’ airport choice behavior using hybrid choice model: A case study of Seoul metropolitan area, South Korea. J. Air Transp. Manag. 2016, 57, 70–79. [Google Scholar] [CrossRef]
- Liu, S.; Zhu, J.; Easa, S.M.; Guo, L.; Wang, S.; Wang, H.; Xu, Y. Travel Choice Behavior Model Based on Mental Accounting of Travel Time and Cost. J. Adv. Transp. 2021, 2021, 1–21. [Google Scholar] [CrossRef]
- Yang, Y.; Tang, H.; Peng, Y. Travel mode choice of residents in the post-COVID-19 era considering preference differences. J. Transp. Syst. Eng. Inf. Technol. 2022, 22, 15–24. [Google Scholar]
- Brons, M.; Pels, E.; Nijkamp, P.; Rietveld, P. Price elasticities of demand for passenger air travel: A meta-analysis. J. Air Transp. Manag. 2002, 8, 165–175. [Google Scholar] [CrossRef] [Green Version]
- Lin, K.; Sibdari, S. Dynamic price competition with discrete customer choices. Eur. J. Oper. Res. 2009, 197, 969–980. [Google Scholar] [CrossRef]
- Rietveld, P.; van Woudenberg, S. Second-best decision making of railway operators: How to fix fares, frequency and vehicle size. J. Transp. Econ. Policy 2007, 41, 363–385. [Google Scholar]
- Van Vuuren, D. Optimal pricing in railway passenger transport: Theory and practice in The Netherlands. Transp. Policy 2002, 9, 95–106. [Google Scholar] [CrossRef]
- Nuzzolo, A.; Crisalli, U.; Gangemi, F. A behavioural choice model for the evaluation of railway supply and pricing policies. Transp. Res. Part A Policy Pract. 2000, 34, 395–404. [Google Scholar] [CrossRef]
- Yan, Z.; Li, X.; Han, B. Collaborative optimisation of resource capacity allocation and fare rate for high-speed railway passenger transport. Transp. Plan. Manag. 2019, 10, 23–33. [Google Scholar] [CrossRef]
- Zhao, X.; Zhao, P. A seat assignment model for high-speed railway ticket booking system with customer preference consideration. Transp. A Transp. Sci. 2019, 15, 776–806. [Google Scholar] [CrossRef]
- Kamandanipour, K.; Nasiri, M.M.; Konur, D.; Yakhchali, S.H. Stochastic data-driven optimization for multi-class dynamic pricing and capacity allocation in the passenger railroad transportation. Expert. Syst. Appl. 2020, 158, 113568. [Google Scholar] [CrossRef]
- Qin, J.; Qu, W.; Wu, X.; Zeng, Y. Differential pricing strategies of high speed railway based on prospect theory: An empirical study from China. Sustainability 2019, 11, 3804. [Google Scholar] [CrossRef] [Green Version]
- Jing, Y.; Liu, Y.; Guo, S. Reasearch on dynamic joint pricing strategy for high-speed railway based on passenger selection behavior. J. China Railw. Soc. 2019, 41, 28–33. [Google Scholar]
- Qin, J.; Li, X.; Yang, K.; Xu, G.; Qu, W. Differential pricing of high-speed railway passenger ticket based on prospect theory. J. Railw. Sci. Eng. 2022, 19, 1820–1829. [Google Scholar]
- Yang, K. Differential Pricing Optimization Method for High speed Railway Based on Cumulative Prospect Theory. Master’s Thesis, Central South University, Changsha, China, 2022. [Google Scholar]
- Zhou, W.; Cai, W.; Liu, X.; Qin, J. Optimization of differentiated fare and ticket amount for high-speed train. J. Railw. Sci. Eng. 2021, 18, 869–876. [Google Scholar]
- Qin, J.; Ni, L.; Shi, F. Combined simulated annealing algorithm for the discrete facility location problem. Sci. World J. 2012, 2012, 576392. [Google Scholar] [CrossRef] [Green Version]
- Zhu, H.; Zhong, Y. A kind of renewed simulated annealing algorithm. Comput. Technol. Dev. 2009, 19, 32–35. [Google Scholar]
- Zhao, X.; Zhao, P.; Li, B.; Song, W. Study on high-speed railway ticket pricing and ticket allocation under competition among multiple modes of transportation. J. China Railw. Soc. 2018, 40, 20–25. [Google Scholar]
- Schmidt, U.; Starmer, C.; Sugden, R. Third-generation prospect theory. J. Risk Uncertain. 2008, 36, 203–223. [Google Scholar] [CrossRef]
- Su, H.; Xu, G.; Zeng, Q.; Peng, S.; Jia, X. Collaborative optimization of differential pricing and seat allocation for multiple highspeed trains considering passenger demand. J. Railw. Sci. Eng. 2022, 7, 1–10. [Google Scholar]


| Train | Shanghai | Changzhou | Nanjing | Xuzhou | Jinan | Beijing |
|---|---|---|---|---|---|---|
| G2 | 9:00 | — | 10:12 | 11:27 | 12:35 | 14:00 |
| G4 | 13:00 | 13:44 | 14:19 | — | 16:37 | 18:00 |
| G6 | 7:00 | — | 8:12 | — | 10:30 | 11:53 |
| G8 | 12:00 | — | 13:12 | — | — | 16:36 |
| G10 | 8:00 | 8:44 | 9:19 | 10:36 | 11:44 | 13:07 |
| G12 | 10:00 | 10:44 | 11:19 | — | 13:37 | 15:00 |
| G14 | 11:00 | — | 12:12 | 13:27 | 14:35 | 16:00 |
| G16 | 14:00 | 14:44 | 15:19 | 16:36 | 17:44 | 19:07 |
| Starting Station | Ending Station | G2 | G4 | G6 | G8 | G10 | G12 | G14 | G16 | Original Fare |
|---|---|---|---|---|---|---|---|---|---|---|
| Shanghai | Changzhou | — | 70 | — | — | 71.5 | 75 | — | 70.5 | 74.5 |
| Shanghai | Nanjing | 127 | 127 | 125 | 128.5 | 127 | 136.5 | 134 | 128 | 135 |
| Shanghai | Xuzhou | 264.5 | — | — | — | 260 | — | 272 | 265.5 | 279 |
| Shanghai | Jinan | 375.5 | 380 | 379.5 | — | 371.5 | 394 | 399.5 | 375.5 | 398.5 |
| Shanghai | Beijing | 519.5 | 527.5 | 517.5 | 524.5 | 526.5 | 550 | 552 | 514.5 | 553 |
| Changzhou | Nanjing | — | 61 | — | — | 53.5 | 65.5 | — | 53.5 | 59.5 |
| Changzhou | Xuzhou | — | — | — | — | 198 | — | — | 199 | 209 |
| Changzhou | Jinan | — | 371 | — | — | 319.5 | 332 | — | 318.5 | 334 |
| Changzhou | Beijing | — | 465 | — | — | 468.5 | 493.5 | — | 470 | 493.5 |
| Nanjing | Xuzhou | 142 | — | — | — | 152 | — | 156 | 143 | 149.5 |
| Nanjing | Jinan | 264.5 | 264 | 261 | — | 264 | 275.5 | 289.5 | 263 | 279 |
| Nanjing | Beijing | 415.5 | 418 | 414 | 473 | 421.5 | 439.5 | 459 | 417 | 443.5 |
| Xuzhou | Jinan | 123 | — | — | — | 123 | — | 136.5 | 120.5 | 129.5 |
| Xuzhou | Beijing | 290.5 | — | — | — | 289 | — | 326.5 | 293.5 | 309 |
| Jinan | Beijing | 174.5 | 172.5 | 178 | — | 176.5 | 188 | 193.5 | 175 | 184.5 |
| Starting Station | Ending Station | G2 | G4 | … | G12 | G14 | G16 |
|---|---|---|---|---|---|---|---|
| Shanghai | Changzhou | — | 16/49 | … | 232/237 | — | 1/68 |
| Shanghai | Nanjing | 219/721 | 180/180 | … | 381/381 | 529/531 | 16/16 |
| Shanghai | Xuzhou | 18/18 | — | … | — | 137/137 | 3/3 |
| Shanghai | Jinan | 85/84 | 248/248 | … | 22/22 | 9/9 | 31/31 |
| Shanghai | Beijing | 238/238 | 584/584 | … | 421/421 | 384/384 | 264/943 |
| Changzhou | Nanjing | — | 2/0 | … | 155/155 | — | 24/24 |
| Changzhou | Xuzhou | — | — | … | — | — | 3/3 |
| Changzhou | Jinan | — | 2/2 | … | 45/45 | — | 7/7 |
| Changzhou | Beijing | — | 47/47 | … | 37/37 | — | 34/34 |
| Nanjing | Xuzhou | 21/40 | — | … | — | 2/2 | 2/5 |
| Nanjing | Jinan | 76/76 | 2/2 | … | 81/89 | 1/1 | 2/22 |
| Nanjing | Beijing | 606/605 | 178/178 | … | 447/447 | 529/529 | 13/13 |
| Xuzhou | Jinan | 30/28 | — | … | — | 1/1 | 5/5 |
| Xuzhou | Beijing | 30/30 | — | … | — | 139/139 | 6/6 |
| Jinan | Beijing | 188/188 | 2/252 | … | 144/156 | 9/9 | 3/33 |
| Original Fare | Differentiated Pricing and Seat Allocation without the Demand Division | Differentiated Pricing and Seat Allocation with the Demand Division | |
|---|---|---|---|
| Revenue/Yuan | 3,540,624 | 3,593,539 | 3,665,177 |
| Increase ratio compared with the original fare | — | 1.50% | 3.52% |
| Increase ratio compared without the demand division | — | — | 1.02% |
| Passenger Type | G2 | G4 | G6 | G8 | G10 | G12 | G14 | G16 | Total Number of Travelers |
|---|---|---|---|---|---|---|---|---|---|
| Economic | 73 | 38 | 55 | 40 | 68 | 43 | 42 | 32 | 500 |
| Middle | 119 | 497 | 76 | 563 | 106 | 195 | 178 | 219 | 2400 |
| Business | 46 | 49 | 18 | 61 | 40 | 183 | 164 | 13 | 800 |
| Train | Original Fare | Differentiated Pricing and Seat Allocation without the Demand Division | Differentiated Pricing and Seat Allocation with the Demand Division |
|---|---|---|---|
| G2 | 71.79% | 85.60% | 89.23% |
| G4 | 79.17% | 87.49% | 92.04% |
| G6 | 36.22% | 39.91% | 39.07% |
| G8 | 97.10% | 94.43% | 99.81% |
| G10 | 73.30% | 77.76% | 75.37% |
| G12 | 100.00% | 100.00% | 99.23% |
| G14 | 100.00% | 98.85% | 99.96% |
| G16 | 30.11% | 27.90% | 32.19% |
Disclaimer/Publisher’s Note: The statements, opinions and data contained in all publications are solely those of the individual author(s) and contributor(s) and not of MDPI and/or the editor(s). MDPI and/or the editor(s) disclaim responsibility for any injury to people or property resulting from any ideas, methods, instructions or products referred to in the content. |
© 2023 by the authors. Licensee MDPI, Basel, Switzerland. This article is an open access article distributed under the terms and conditions of the Creative Commons Attribution (CC BY) license (https://creativecommons.org/licenses/by/4.0/).
Share and Cite
Zhou, W.; Zou, Z.; Chai, N.; Xu, G. Optimization of Differential Pricing and Seat Allocation in High-Speed Railways for Multi-Class Demands: A Chinese Case Study. Mathematics 2023, 11, 1412. https://doi.org/10.3390/math11061412
Zhou W, Zou Z, Chai N, Xu G. Optimization of Differential Pricing and Seat Allocation in High-Speed Railways for Multi-Class Demands: A Chinese Case Study. Mathematics. 2023; 11(6):1412. https://doi.org/10.3390/math11061412
Chicago/Turabian StyleZhou, Wenliang, Ziyu Zou, Naijie Chai, and Guangming Xu. 2023. "Optimization of Differential Pricing and Seat Allocation in High-Speed Railways for Multi-Class Demands: A Chinese Case Study" Mathematics 11, no. 6: 1412. https://doi.org/10.3390/math11061412