Article

Fuzzy Discretization on the Multinomial Naïve Bayes Method for Modeling Multiclass Classification of Corn Plant Diseases and Pests

1
Department of Mathematics, Faculty of Mathematics and Natural Sciences, University of Sriwijaya, Inderalaya 30662, Indonesia
2
Study Program of Plant Protection, Department of Plant Pest and Disease, Faculty of Agriculture, University of Sriwijaya, Inderalaya 30662, Indonesia
3
Smart Inspection Discussion Group, Department of Mechanical Engineering, Faculty of Engineering, University of Sriwijaya, Inderalaya 30662, Indonesia
*
Author to whom correspondence should be addressed.
Mathematics 2023, 11(8), 1761; https://doi.org/10.3390/math11081761
Submission received: 12 February 2023 / Revised: 23 March 2023 / Accepted: 30 March 2023 / Published: 7 April 2023
(This article belongs to the Topic Data Science and Knowledge Discovery)

Abstract

:
As an agricultural commodity, corn functions as food, animal feed, and industrial raw material. Therefore, diseases and pests pose a major challenge to the production of corn plants. Modeling the classification of corn plant diseases and pests based on digital images is essential for developing an information technology-based early detection system. This plant’s early detection technology is beneficial for lowering farmers’ losses. The detection system based on digital images is also cost-effective. This paper aims to model the classification of corn plant diseases and pests based on digital images by implementing fuzzy discretization. Discretization is an essential technique to improve the knowledge extraction process of continuous-type data. It is also essential in some methods where continuous data must be processed or handled. Fuzzy discretization allows classes to have overlapping intervals so that they can handle information that is vague or unclear. We developed hypotheses and proved that different combinations of membership functions in fuzzy discretization affect classification performance. Empirical assessment using Monte Carlo resampling was carried out to obtain the generalizability of the performance of the best classification model of all proposed models. The best model is determined based on the number of metrics with the highest value and the highest metric on the Fscore and Kappa, a multiclass measure. The combination of digital image data preprocessing and classification methods also affects the performance of the classification model. We hope this work can provide an overview for experts in building early detection systems of corn plant diseases and pests using classification models based on fuzzy discretization.

1. Introduction

Discretization is a preprocessing technique to improve the knowledge extraction process of continuous-type data and is also helpful for improving the model [1,2,3]. This process is essential in some statistical machine-learning methods where continuous data must be processed or handled [4,5,6,7,8]. For example, when the value of the set of predictor variables is a continuous or real number, there will likely be very few observations that will have the same value. Discretization can result in many equivalence classes, with few elements in such a situation. These classes generate many antecedents in the classification rules, so that discretization using crisp set theory becomes inefficient [2]. Discretization using fuzzy set theory, known as fuzzy discretization, allows classes to have overlapping intervals. As a result, the number of antecedents in the classification rules is few. Implementing fuzzy discretization in several classification methods has increased the classification method’s performance [4,5,8,9], including naïve Bayes [10,11,12].
Fuzzy discretization can represent vagueness in splitting class intervals, especially RGB digital image features. The RGB represents the red, green, and blue color space model. This technique can also improve object classification performance, [9,11]. However, no less important is the combination of the fuzzy membership functions used in the discretization process [9,11,13]. The combination related to the number of linguistic terms is determined based on prior knowledge or experience and the used fuzzy membership functions. The type of function chosen to represent each linguistic term is subjective. There is no exact method for selecting fuzzy membership functions. Experimenting or trial and error is the best way to achieve the best classification performance [3,6,9,13].
Corn is one of the world’s most important agricultural commodities because it is used not only as food and feed, but also as industrial raw material. During the production stage, corn plants are susceptible to disease and pests. The early diagnosis of corn diseases and pests aims to reduce the likelihood of crop failure and preserve the quality and quantity of crop yields. The use of digital images as a dataset for identifying corn plant diseases and pests is increasing rapidly [9,14,15,16,17,18,19], as well as in other food crops [20,21,22,23,24,25,26]. This increase is because the cost is cheaper than other technologies, such as infrared light [21]. Sealing characteristics from digital images is crucial for identifying corn diseases and pests since it distinguishes classes. In terms of detecting the diseases and pests of corn crops, digital image processing using the RGB color space model is the most informative compared to other features [16]. In addition, it provides satisfactory performance [9,14]. However, discretizing RGB features into several classes is a subjectivity that tends to be vagueness [14].
The naïve Bayes method is the usual classification method with a satisfactory performance [27,28], especially for image classification [14,29,30]. If the predictor variables have a continuous scale and meet the assumption of a Gaussian distribution, this method is known as Gaussian naïve Bayes. On the other hand, if the Gaussian assumption is not met by the variables, they are first discretized to categorical type. The naïve Bayes method with categorical-typed variables is called multinomial naïve Bayes (MNB). The other name is non-parametric naïve Bayes [30,31]. However, in some cases, these naïve Bayes methods did not obtain the classification performance satisfactorily [5,32], especially in corn plant disease classification [15,16].
Furthermore, minor disturbances in the training data can cause significant changes to decision-making or the estimated posterior probability in some classification methods. As a result, the performance of the classification model on sampling data cannot be generalized. However, the resampling technique can be applied to generalize a classification model’s performance [33]. Therefore, this article proposed different fuzzy discretization in the naïve Bayes method (fuzzy naïve Bayes) for classifying corn plant diseases and pests. The difference is in the number of fuzzy membership functions and the type of fuzzy membership functions. We also proposed Monte Carlo resampling to assess the generalization of the performance of the proposed method.
We developed hypotheses that different fuzzy discretization affect classification performance. This work is organized as follows: Section 2 presents the related work to fuzzy discretization on some methods to the classification task. Section 3 describes the material and methods to develop the proposed classification model. Section 4 presents the empirical applications of fuzzy discretization on multinomial naïve Bayes. This section includes data exploration, modeling, and a discussion of the results of the classification of corn diseases and pests, including testing the hypothesis of the performance of the proposed different models. Section 5 presents the conclusions and proposals for future studies.

2. Related Work

Fuzzy discretization has been implemented in various classification methods. Some of them are multinomial naïve Bayes (MNB), decision tree ID3 (DTID3), decision tree C45 (DTC45), decision tree C50 (DTC50), neural network (NN), genetic algorithm (GA), and analytical hierarchy process (AHP). Most of each variable is discretized using the same membership function [3,5,28,29]. However, some combine several fuzzy membership functions [9,10,12]. Several studies show that the performance of the initial model increases by implementing fuzzy discretization.
The same fuzzy membership function for all categories on each discretized predictor variable is usually triangular or trapezoidal. For example, when predicting heart disease status, using the triangular fuzzy membership function in discretizing all numeric type predictor variables has succeeded in increasing the performance of the naïve Bayes model [10]. They are, likewise, using the trapezoidal fuzzy membership function [12] for the same case. However, the accuracy value achieved is higher for the triangular function. At the same time, the accuracy for the naïve Bayes method is higher when using the trapezoidal function. Furthermore, using trapezoidal fuzzy membership functions on all predictor variables to predict Saudi Arabian breast cancer also improved the neural network’s performance combined with random forest [4].
Using a combination of linear and triangular fuzzy membership functions in discretizing the predictor variable also succeeded in increasing the performance of the naïve Bayes model in predicting the type of cans based on digital images [11]. Each predictor variable is discretized into three categories. Each category from the lowest to the highest value range is represented by a membership function successively linear descending, triangular, and linearly ascending. Combining linear and triangular fuzzy membership functions on most predictor variables increased the model’s performance [5]. In this case, driver behavior is predicted using a genetic algorithm, and age is the only variable discretized using a fuzzy trapezoidal membership function.
Nevertheless, not all fuzzy discretization can improve the prediction or classification model performance. For example, in cases predicting diabetes status (PIMA Indian dataset) and liver disease status (BUPA Medical Research), fuzzy discretization was not successful in increasing the performance of the prediction model [3]. In both studies, each predictor variable was discretized into three, five, and seven categories, and all of them used the triangular membership function. In the PIMA Indian dataset, the highest accuracy is achieved by data with predictor variables which are discretized into five categories. In the BUPA Medical Research liver disorder dataset, discretizing the predictor variable into three categories is the most accurate.
Furthermore, modeling the classification of corn diseases and pests based on digital images is essential for developing an early detection system based on information technology. Choosing the feature of the digital image is fundamental in the classification modeling of corn plant diseases and pests, as well as the classification method because it distinguishes classes [16]. The better the performance of the maize disease and pest classification model, the better the detection system that can be built. Various approaches in processing digital images, including selecting features as predictor variables and classification methods, have been proposed, but not all provide satisfactory performance. In classifying corn plant diseases, digital image processing by transforming it into a grayscale image gives the highest accuracy of less than 80% [15]. In this research, shape, color, and texture were chosen as predictor variables to classify digital images into two classes (infected with the disease and healthy). Processing digital images of corn plant diseases and pests into a red, green, and blue (RGB) color space model and using the three red, green, and blue channels as predictor variables in classifying corn plant diseases and pests gives satisfactory performance [9,14,16]. The technique is the most informative feature of the digital image of corn disease compared to other features such as scale-invariant feature transform (SIFT), strong feature acceleration (SURF), Oriented FAST, rotated BRIEF (ORB), and object detectors, such as oriented gradient histogram (HOG) [16]. Using the RGB color space model with the red, green, and blue channels as predictor variables for other food crop classifications also provides satisfactory performance [24].
Other color space models are HSV and Labs. HSV is hue, saturation, and value (HSV). The HSV is interchangeable with hue, saturation, and intensity (HSI). Next, another color space model is luminosity, chromaticity layer ‘a*’ and ‘b*’ (Labs). The chromaticity layers ‘a*’ and ‘b*’ provide the color information along the red-green and blue-yellow axes, respectively. Another approach to processing digital images is the convolutional neural network (CNN). CNN is deep learning based on the feed-forward neural network. A variation of CNN is the graph convolutional neural network (GCNN) [34], also known as the graph convolution network (GCN) [35]. Another variation is the knowledge-embedded graph convolutional network (KEGCN) [36]. GCN is a development of CNN by processing images into graphs and reducing input data using permutation-invariant operators [34]. KEGCN combines the GCN and the strengths of the knowledge-embedded graph approach [36]. The embedded graph method is a technique to translate large and complex graphs into a reduced vector space so that machine learning tasks become more efficient [37]. With its various developments, the implementation of CNN provides satisfactory performance in classifying corn plant diseases [17,18,19] and other food crops [21,22,23,38]. Other food crop disease classifications using HSV [20,24,26] and Lab [25] also perform satisfactorily.
Many factors affect the performance of the classification model, and several ways to improve its performance, including image-based classification. We focus on improving the performance of the corn disease and pest classification model by using fuzzy discretization with digital images as datasets. Processing digital images of the diseases and pests of corn plants involves using an RGB color space model with the red, green, and blue channels as predictor variables. Fuzzy discretization is implemented in the naïve Bayes multinomial method. Empirical assessment using Monte Carlo resampling was carried out to obtain the generalizability of the performance of the best classification model of all proposed models.

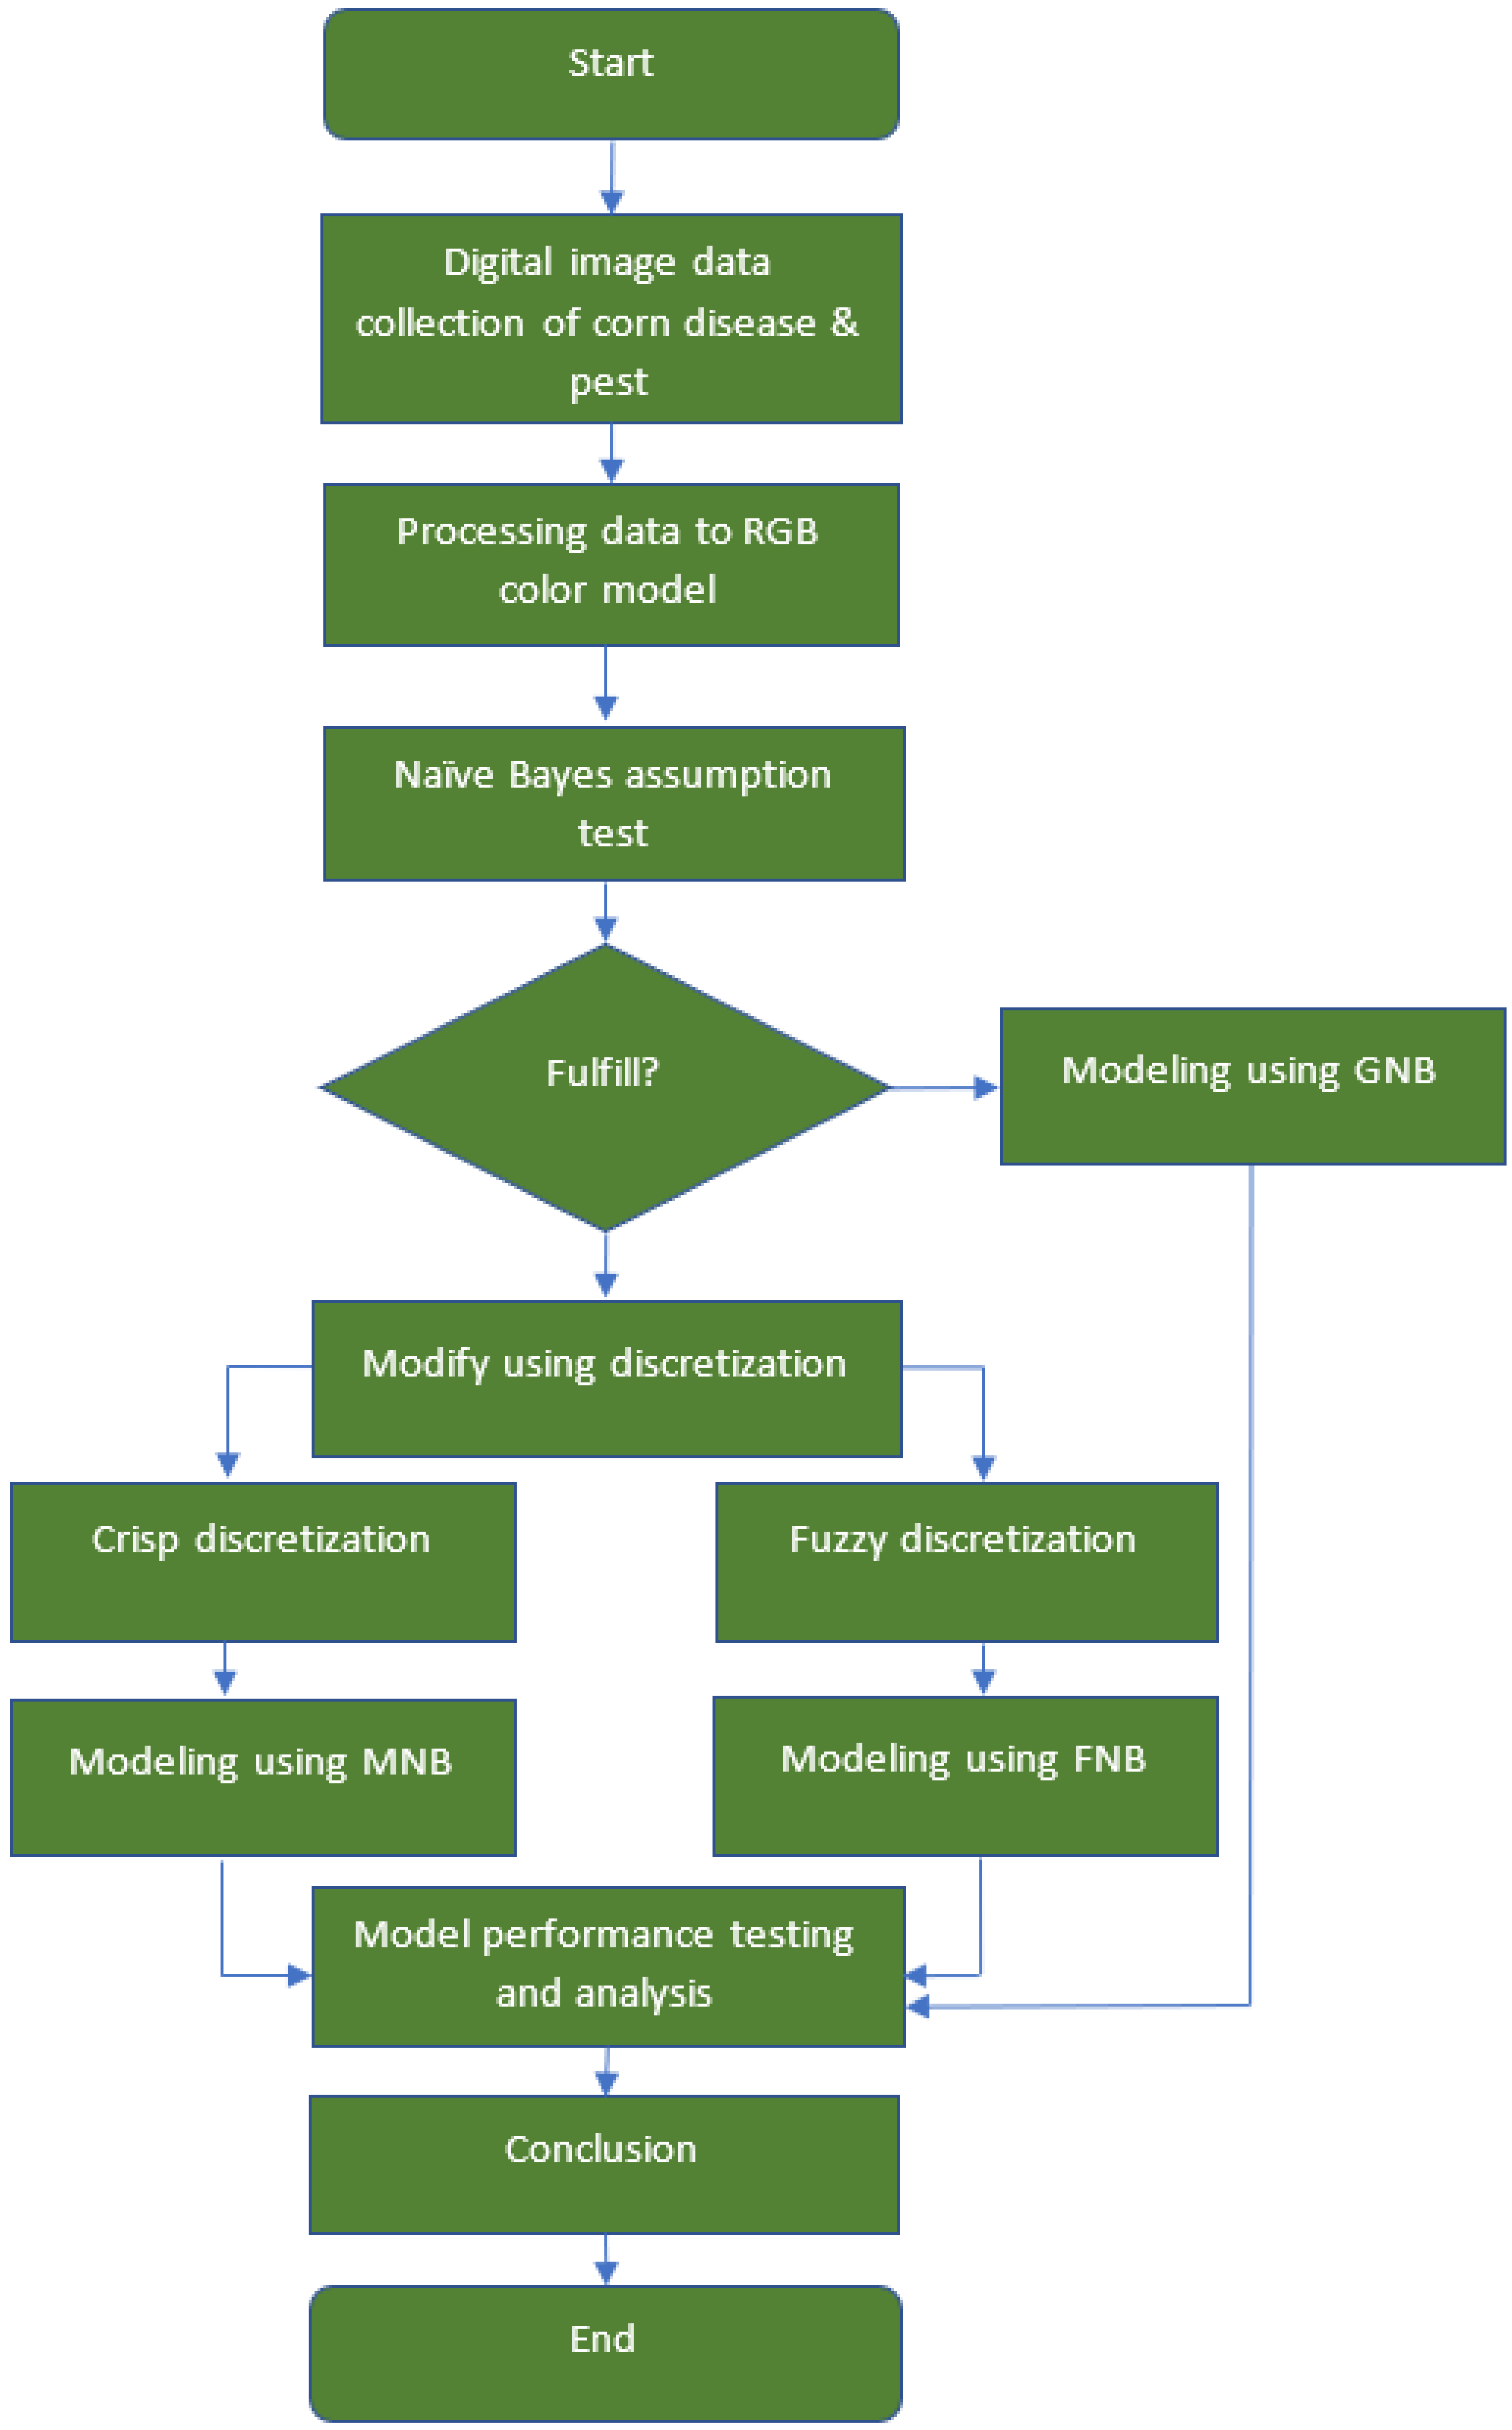
3. Materials and Methods

The main steps in our proposed method to model and classify the diseases and pests of corn plants using the fuzzy naïve Bayes method with different fuzzy discretization are depicted in Figure 1. The methods classify objects or observations by determining the posterior probability following the Bayes theorem. Since the predictor variables have a ratio scale, it is possible to employ the Gaussian naïve Bayes method by first testing the assumptions of the Gaussian distribution. If this assumption is not met, we continue by transforming the value of the predictor variable into a nominal or ordinal scale using discretization. Crisp and fuzzy discretization is proposed in this work.

3.1. Crisp and Fuzzy Discretization

Discretization is partitioning continuous variables to obtain categorical type variables by grouping their values into classes with certain intervals. This process is essential in statistical machine-learning applications where continuous data must be processed or handled [6]. This process can also reduce the data scale, increasing data processing efficiency [1]. The crisp and fuzzy discretizations are each formed based on the principal concept in their set theory. In the crisp set, if an element of universal X is a member of set A , then it is written as x A . Conversely, if x is not a member of A , it is written as x A . So, there are only two possibilities for the membership value of x in set A , μ A x = 1 or μ A x = 0 .
In the fuzzy set, the membership value x in set A is in the interval [0, 1], and x is a member of set A , if x has the highest membership value [39]. The crisp discretization forms classes (categories) with the specific interval by determining non-overlapping points of intersection. Fuzzy discretization forms classes by connecting linguistic terms to fuzzy membership functions. Fuzzy discretization allows for overlapping class intervals [2]. We proposed that the number of classes of predictor variables in crisp discretization refers to prior knowledge or expert experience. Thus, fuzzy discretization is formed based on the previously formed crisp discretization [4].
Let X d is the d -th predictor variable of continuous type and has a value with interval min x d , max x d . The crisp discretization of x d into m categories is obtained by determining m pairs of lower and upper classes limit with an interval width of r x d where the class limit does not overlap. The upper-class limit u 1 c x d ,   u 2 c x d ,   u 3 c x d ,   , u m 1 c x d ,   u m c x d is the intersection points of the variable value, which is determined by:
u 1 c x d = min x d + r x d u 2 c x d = min x d + 2 r x d u 3 c x d = min x d + 3 r x d u m 1 c x d = min x d + m 1 r x d u m c x d = max x d
the width of the interval r is obtained by:
r x d = max x d min x d m
The upper limit of the m -th class is the maximum value. The lower limit of the first class is the minimum value. The next lower limit class up to the m -th class is determined based on the upper limit and the value of k , which is the size of the gap between classes so that class limits do not overlap.
l 1 c x d = min x d l 2 c x d = u 1 c x d + k l 3 c x d = u 2 c x d + k l m 1 c x d = u m 2 c x d + k l m c x d s = u m 1 c x d + k
For fuzzy discretization, let X be the universal set while X ˜ d denotes the fuzzy set obtained from X . The fuzzy set X ˜ d in the universe X is expressed as a set of ordered pairs of x f and membership function μ X ˜ d x f [39]:
X ˜ d = x f , μ X ˜ d x f | x f X
The fuzzy membership function μ X ˜ d x f visualizes the degree of the membership of each value in a given fuzzy set X ˜ d . This function is defined as μ X ˜ d x f : X     0 , 1 where each element x f of X is mapped to a value in the interval [0, 1].
Each fuzzy membership function can represent all categories of predictor variables, and their implementation can combine these functions. We propose fuzzy discretization based on crisp discretization with overlapping class limits. The m -th class upper limit and the first lower limit of class, as well as crisp discretization, are the maximum and minimum values, respectively. For other upper and lower limit classes, it is determined by a tuning system [8,40] with the following conditions:
u 1 c x d < u 1 f x d < u 2 c x d u 2 c x d < u 2 f x d < u 3 c x d u 3 c x d < u 3 f x d < u 4 c x d u m 1 c x d < u m 1 f x d < u m c x d u m f x d = u m c x d
and
l 1 f x d = l 1 c x d l 2 c x d < l 2 f x d < l 3 c x d l 3 c x d < l 3 f x d < l 4 c x d l m 1 c x d < l m 1 f x d < l m c x d l m f x d = l m c x d

3.2. Type of Fuzzy Membership Function

The selection of fuzzy membership functions representing linguistic terms in fuzzy discretization is subjective [6,9,11]. Several fuzzy membership functions used in this work are defined in Equations (7)–(12) [9,39]. Suppose x f is the value of a predictor variable in an interval a , b , the triangular fuzzy membership function with parameter a ,   m ,   b where a < m < b is defined as:
μ X ˜ d x f = 1 ; x f = m x f a m a ; a x f m b x f b m ; m x f b 0 ; x f a V x f b
For the trapezoidal fuzzy membership function with parameter a ,   m ,   n ,   b where a < m < n < b is given as:
μ X ˜ d x f = 0 ; x f a x f a m a ; a x f m b x f b n ; n x f b 0 ; x f b
For each of the decreasing and increasing linear fuzzy membership functions with parameter a ,   b where a < b is given as:
μ X ˜ d x f = 1 ; x f a b x f b a ; a x f b 0 ; x f b
μ X ˜ d x f = 0 ; x f a x f a b a ; a x f b 1 ; x f b
For each of the S-shrinkage and the S-growth fuzzy membership function with parameter a ,   m ,   b where a < m < b is defined as:
μ X ˜ d x f = 1 ; x f a 1 2 x f a m a 2 ; a x f m 2 b x f b m 2 ; m x f b 0 ; x f b
μ X ˜ d x f = 0 ; x f a 2 x f a m a 2 ; a x f m 1 2 b x f b m 2 ; m x f b 1 ; x f b
Each observation is categorized into a linguistic term with maximum fuzzy membership value rules.

3.3. Multinomial Naïve Bayes

The naïve Bayes method classifies observations into a particular class by determining the posterior probability based on the Bayes theorem, independent assumptions between variables, and naïve (strong independent) in calculating conditional probability. Let Y j be the random variable that represents the j -th class of corn diseases and pests, P Y j be the j -th class prior probability, P X 1 , , X D Y j be the likelihood function of the D predictor variables, and P X 1 , , X D be the evidence or joint distribution function, and the posterior probability is given as:
Y j X 1 , , X D = P Y j   P X 1 , , X D Y j P X 1 , , X D = P Y j   d = 1 D P X d Y j d = 1 D P X d
The multinomial naïve Bayes method is one type of the naïve Bayes method. This method requires predictor variables of categorical type. So, continuous type variables need to be discretized first using crips discretization. Let n X d | Y j is the number of images related to the j -th class in all variables X , n Y j is the number of images in the j-th class, n c X d | Y j is the number of images related to the j -th class in a variable X d with category k , and m is the number of categories in the variable X d . The j -th class prior probability and the j -th likelihood function, respectively, are defined as [14,41]:
P Y j = d = 1 D n X d | Y j + 1 n Y j + D
P X d Y j = k m n k X d | Y j + 1 n X d | Y j + m
Since the product of the predictor variable prior probability is a constant for each class, the posterior probability is written as [14,41]:
P Y j X 1 , , X D = d = 1 D n X d | Y j + 1 n Y j + D d = 1 D k m n k X d | Y j + 1 n X d | Y j + m
To implement the fuzzy discretization into the multinomial naïve Bayes, let X ˜ d = x f 1 ,   x f 1 , x f Z be the information space of the fuzzy sample of the predictor variable of X d , x f z X be the independent event, and μ X ˜ d x f z be the fuzzy membership function of X d . The likelihood function of a fuzzy sample is defined as P X ˜ d | Y j = z = 1 Z P x f z | Y j μ X ˜ d x f z and the predictor variable prior probability is P X ˜ d = z = 1 Z P x f z μ X ˜ d x f z . Since the evidence in the fuzzy set is not a constant, the posterior probability is written as [42]:
P Y j X 1 , , X D =   P Y j d = 1 D P X ˜ d | Y j d = 1 D P X ˜ d
The implementation of the Laplace smoothing results is:
P Y j X 1 , , X D = P Y j d = 1 D z = 1 Z P x f z | Y j μ X ˜ d x f z + 1 Z d = 1 D z = 1 Z P x f z μ X ˜ d x f z + 1 Z
Furthermore, the performance of the classification model is assessed using some metrics based on the confusion matrix table. This table represents a straightforward cross-tabulation of observed and expected classes. For multiclass J where j = 1 ,   2 ,   J , let TP j be an outcome where the model correctly classifies in the j-th class (true positive), and TN j be an outcome where the model correctly classifies in the not j-th class (true negative). Let FP j be an outcome where the model incorrectly classifies in the j-th class (false positive), and FN j be an outcome where the model incorrectly classifies in the not j-th class (false negative) [43,44]. Other classes are obtained similarly. The metrics for assessing the classification method performance based on the confusion matrix are accuracy (average accuracy), precision (macro), recall (macro-), and Fscore (macro). For all these metrics, the larger the values, the better the classification model. The macro-metrics are used to evaluate the performance of a model or system where each class is equally important. The macro measures mean that a majority class will contribute equally along with the minority [43,44,45]. We also use Fscore and Kappa to select the best model in this multiclass case [43,45,46].

4. Empirical Application

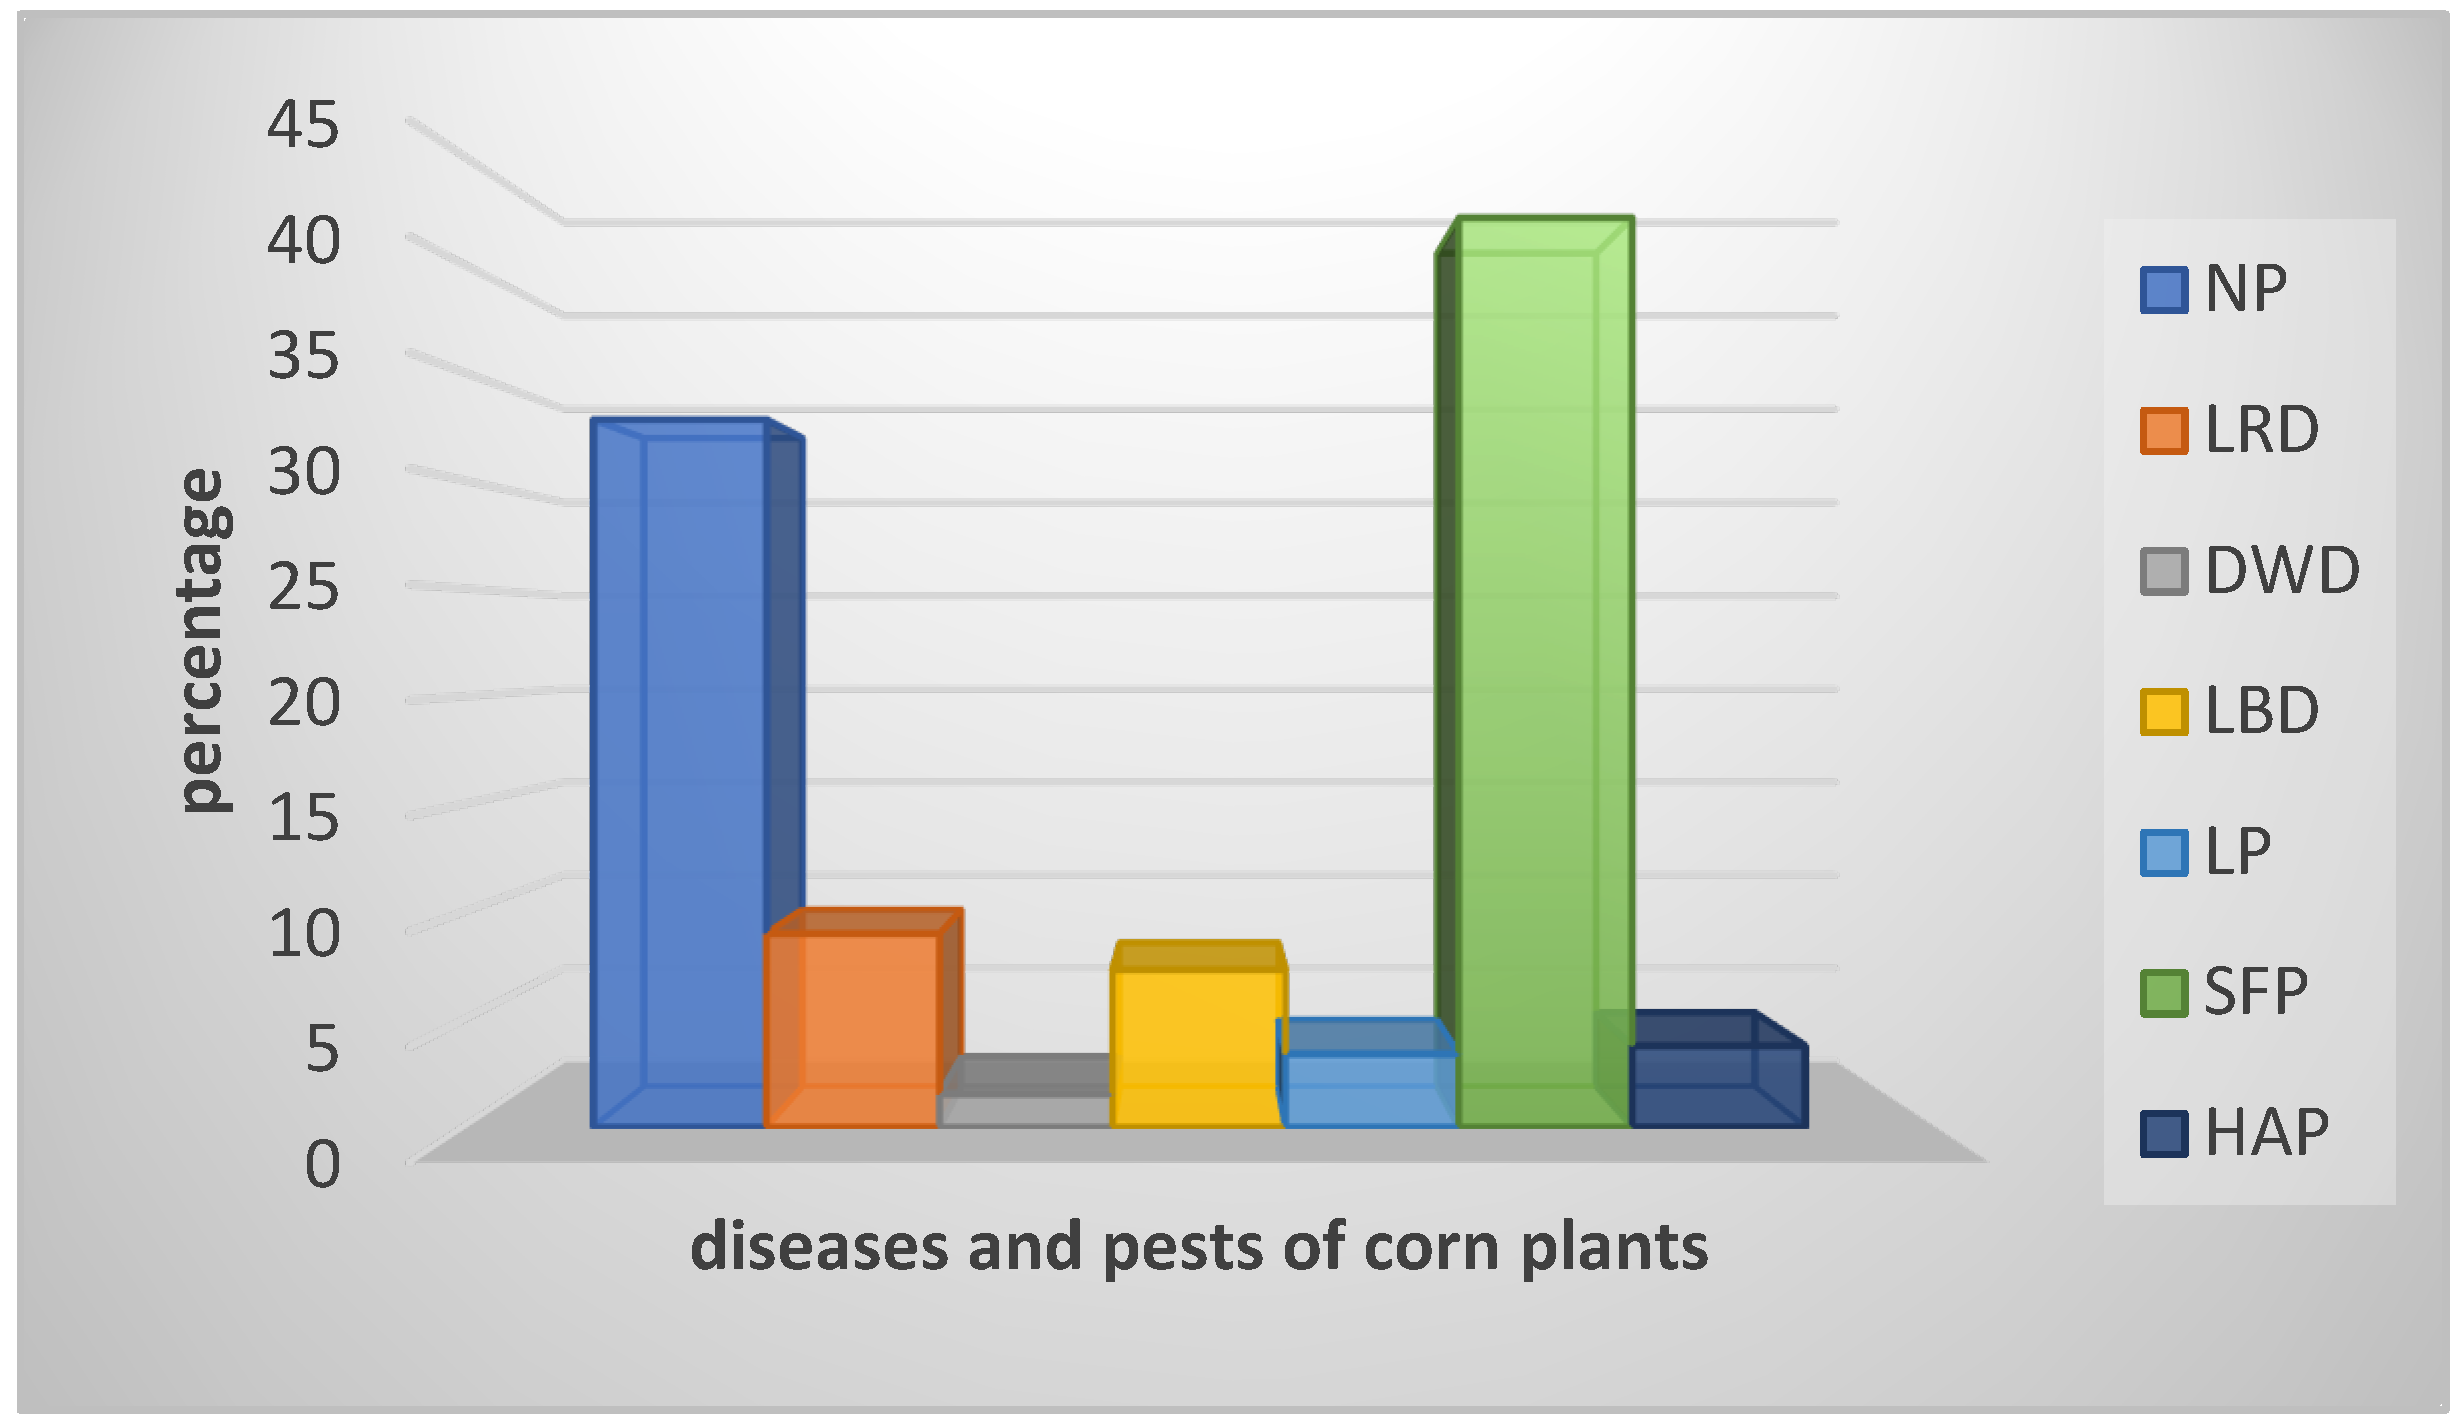
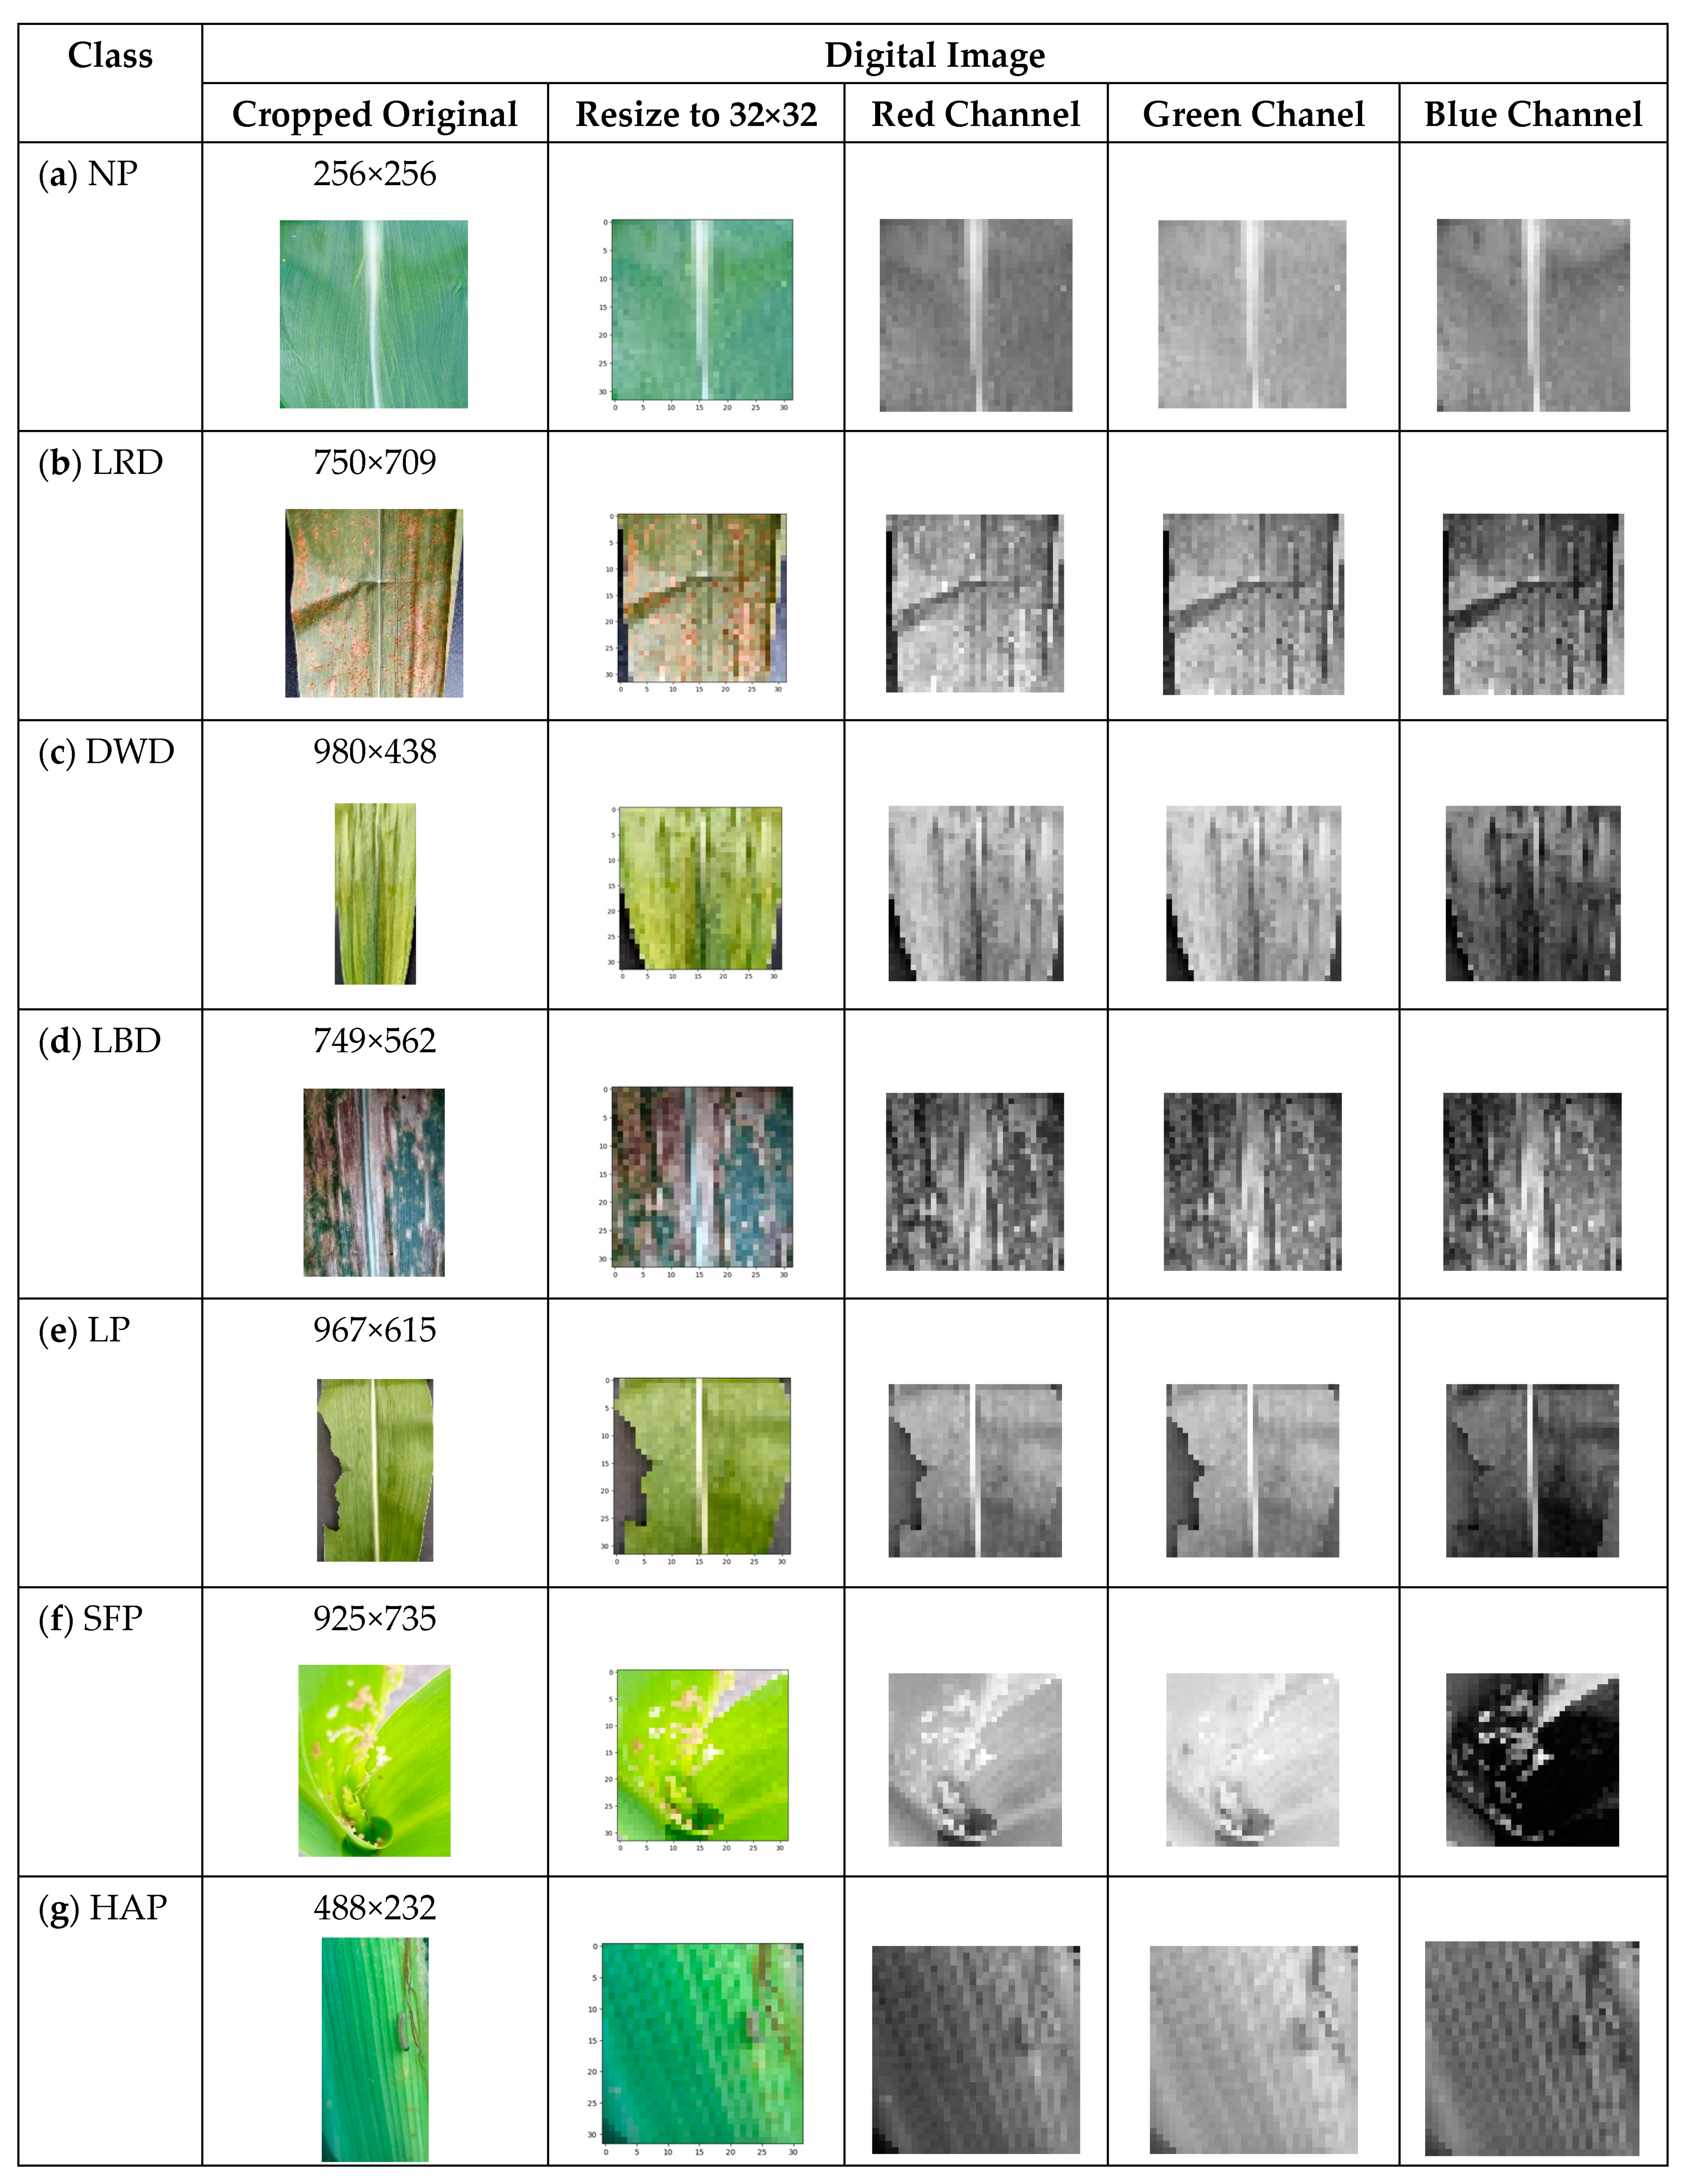
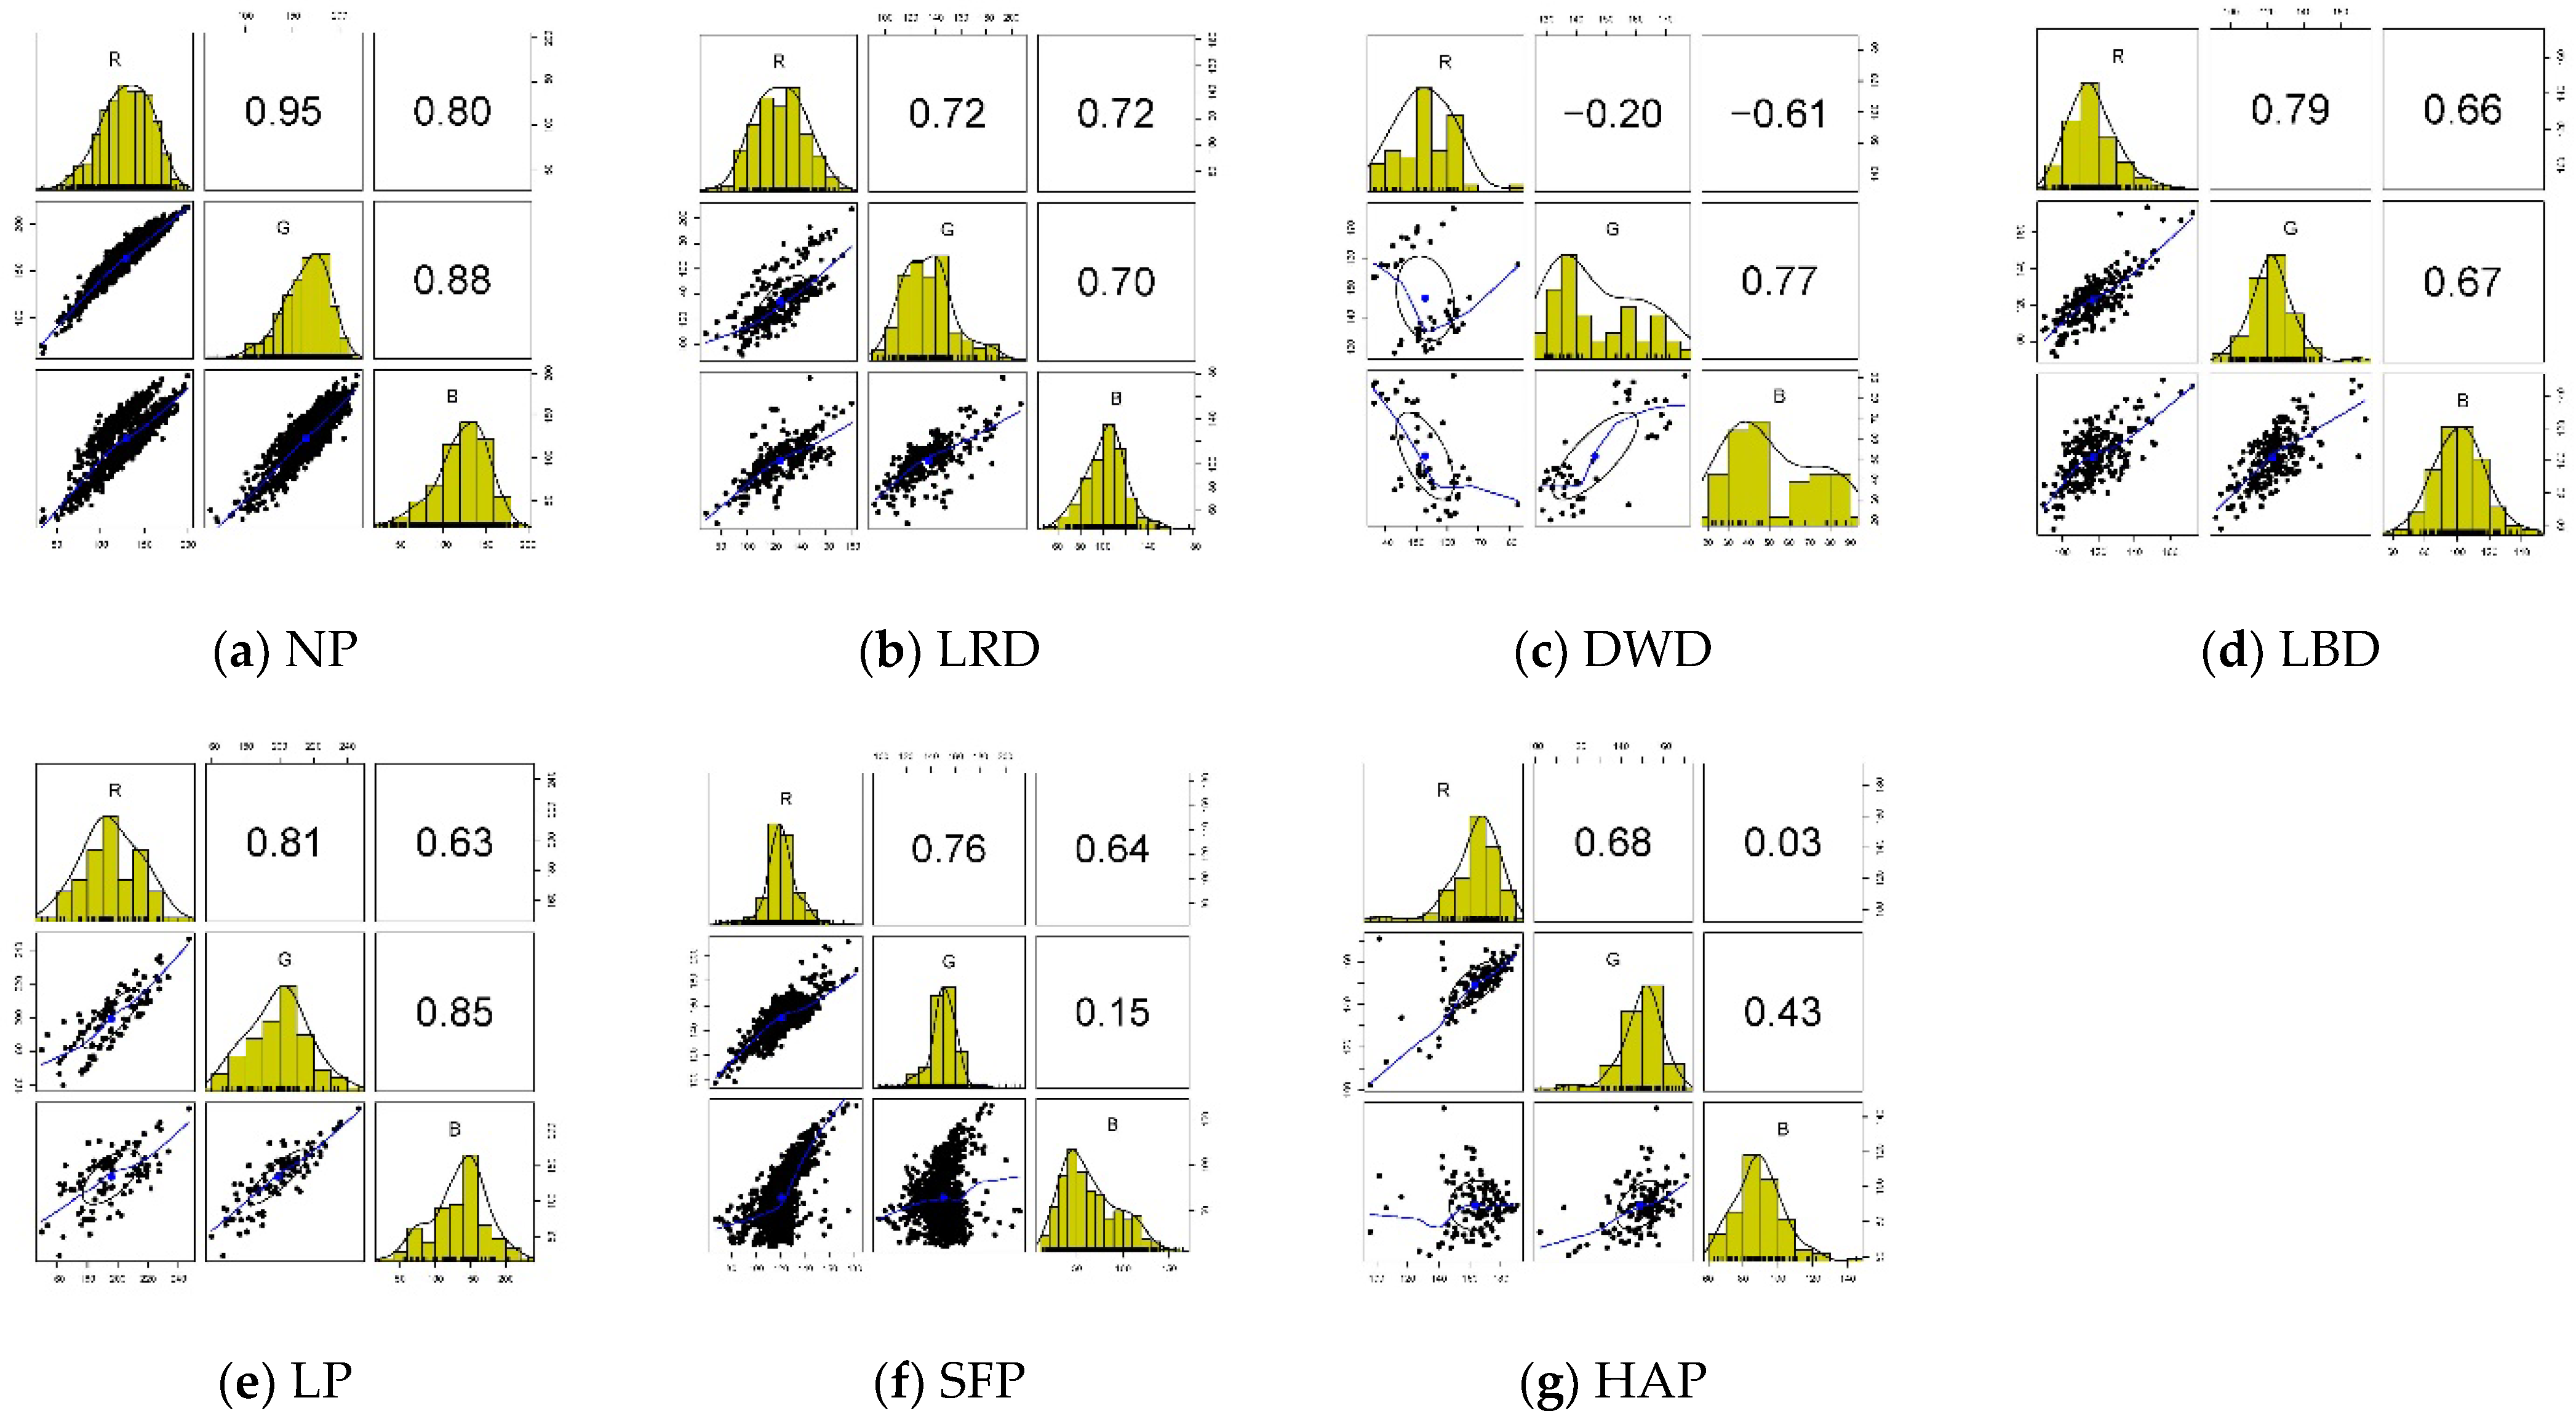
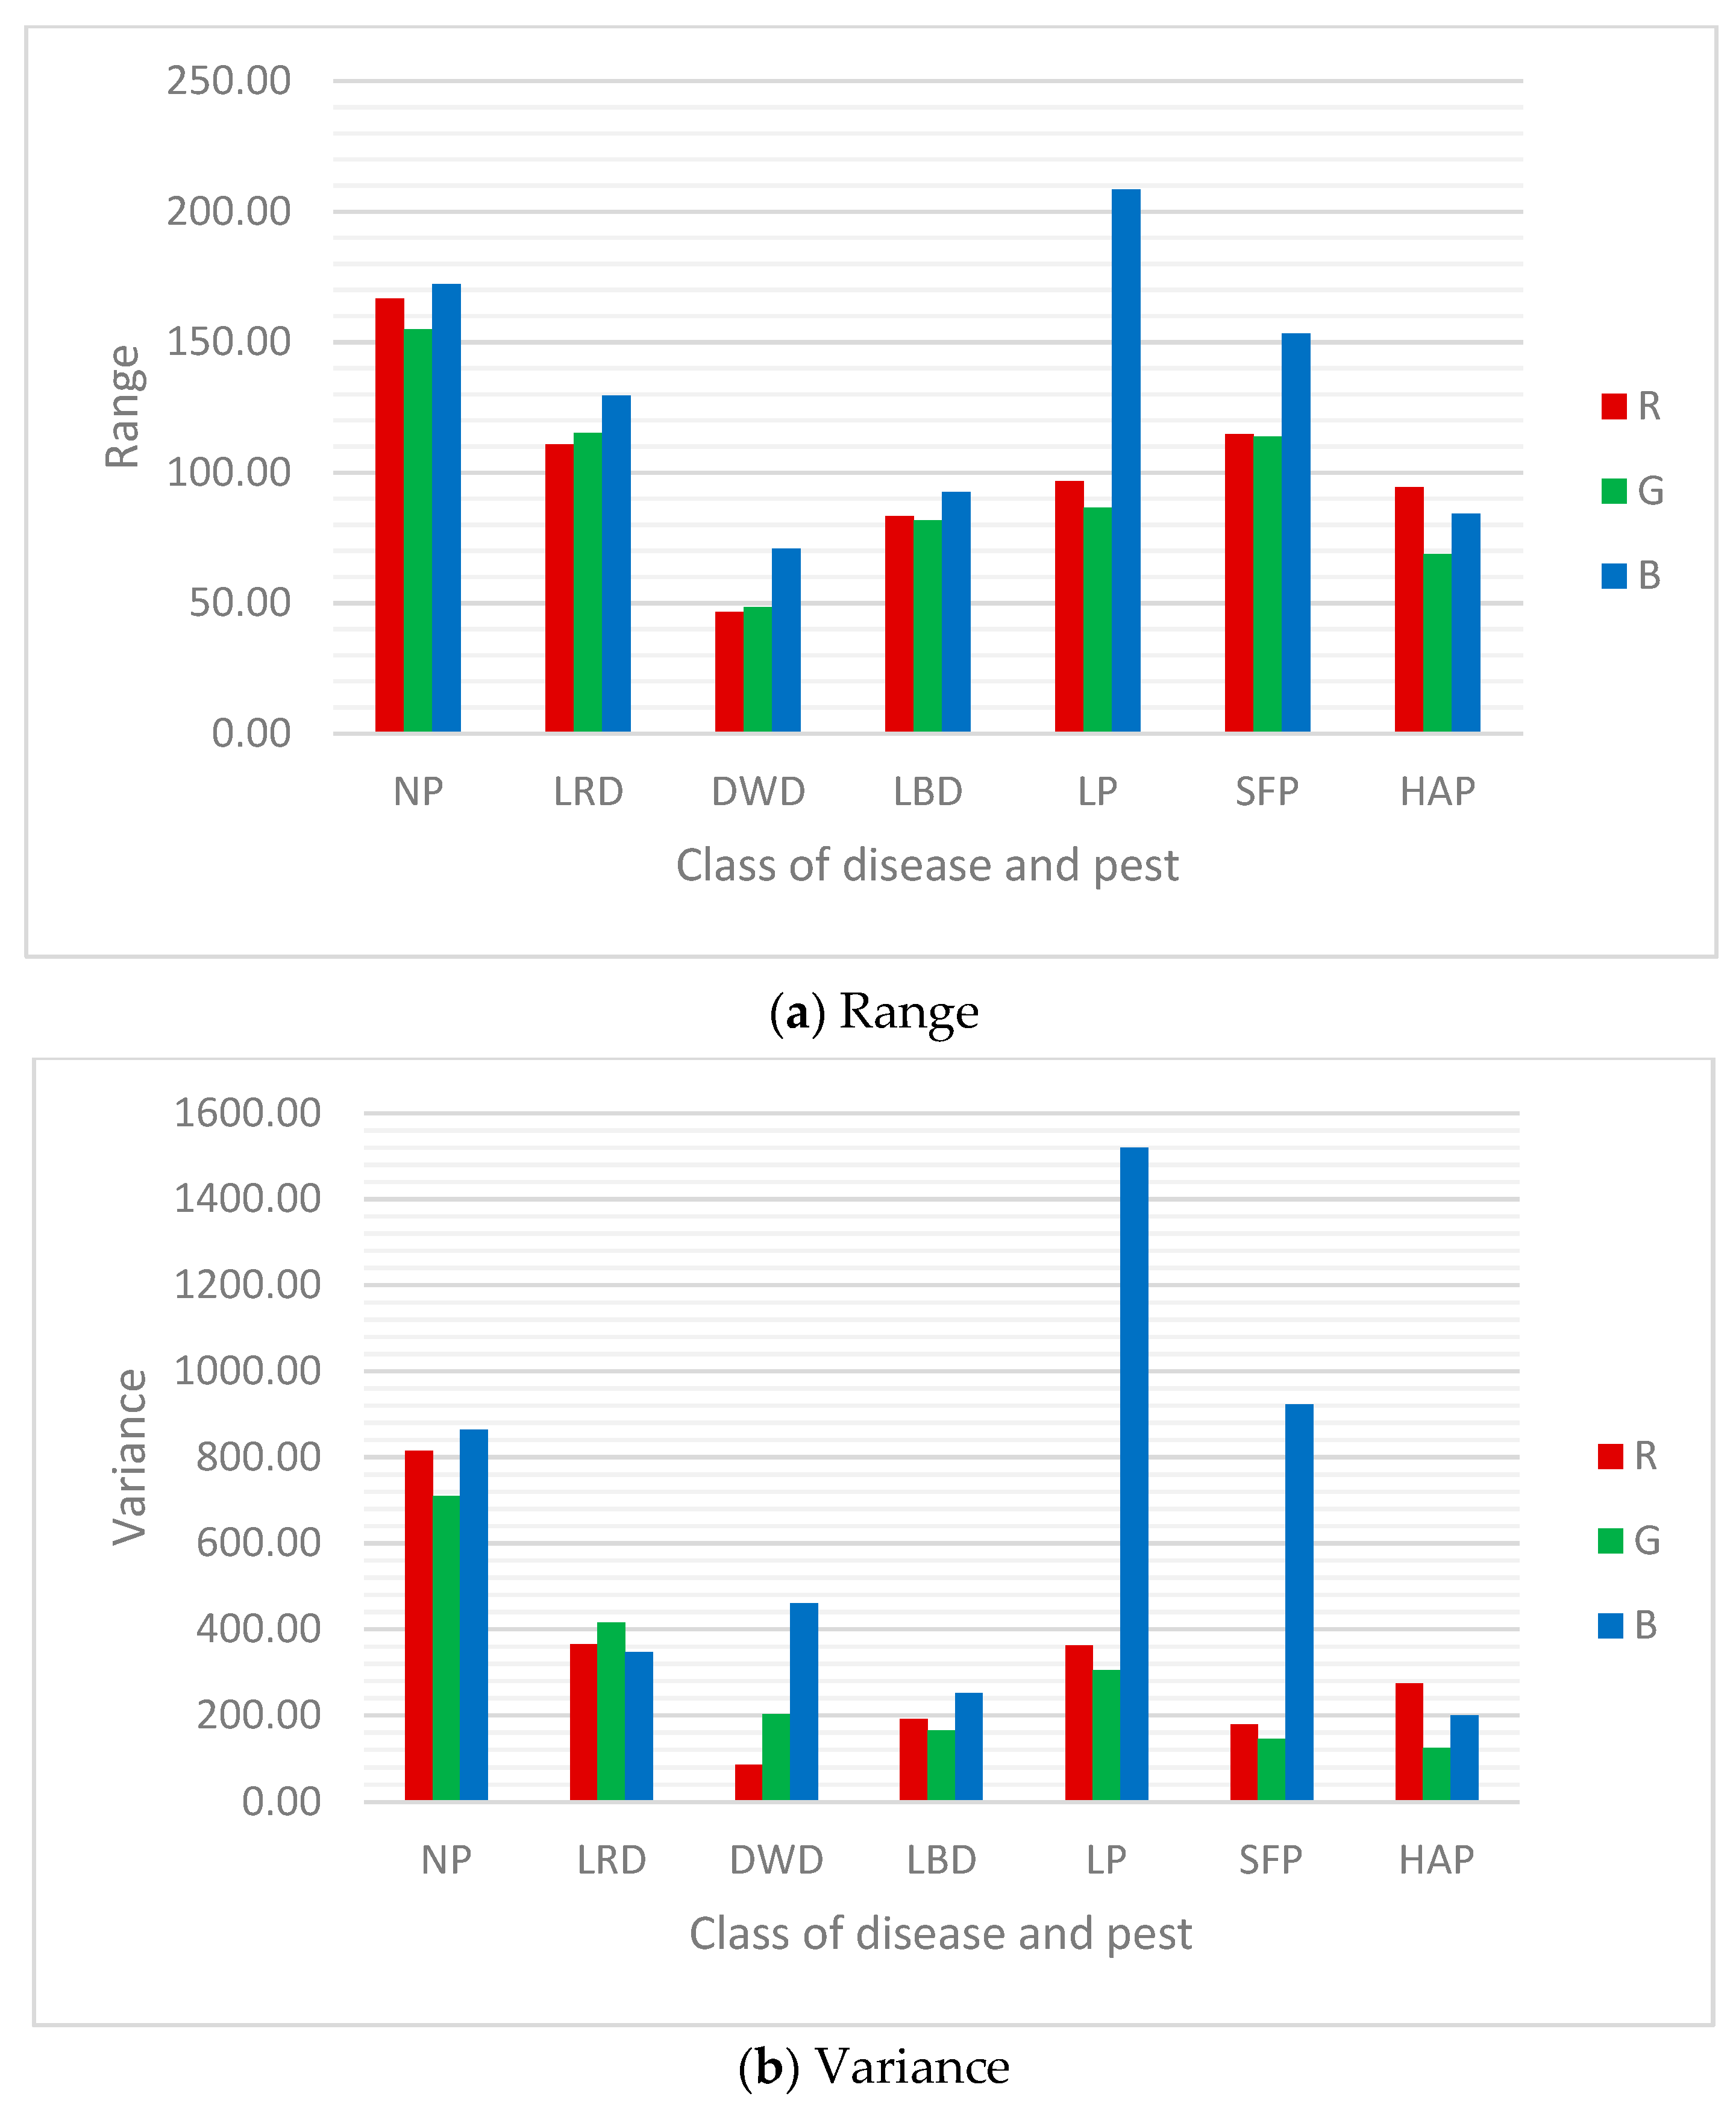
4.1. Description and Exploration of Dataset
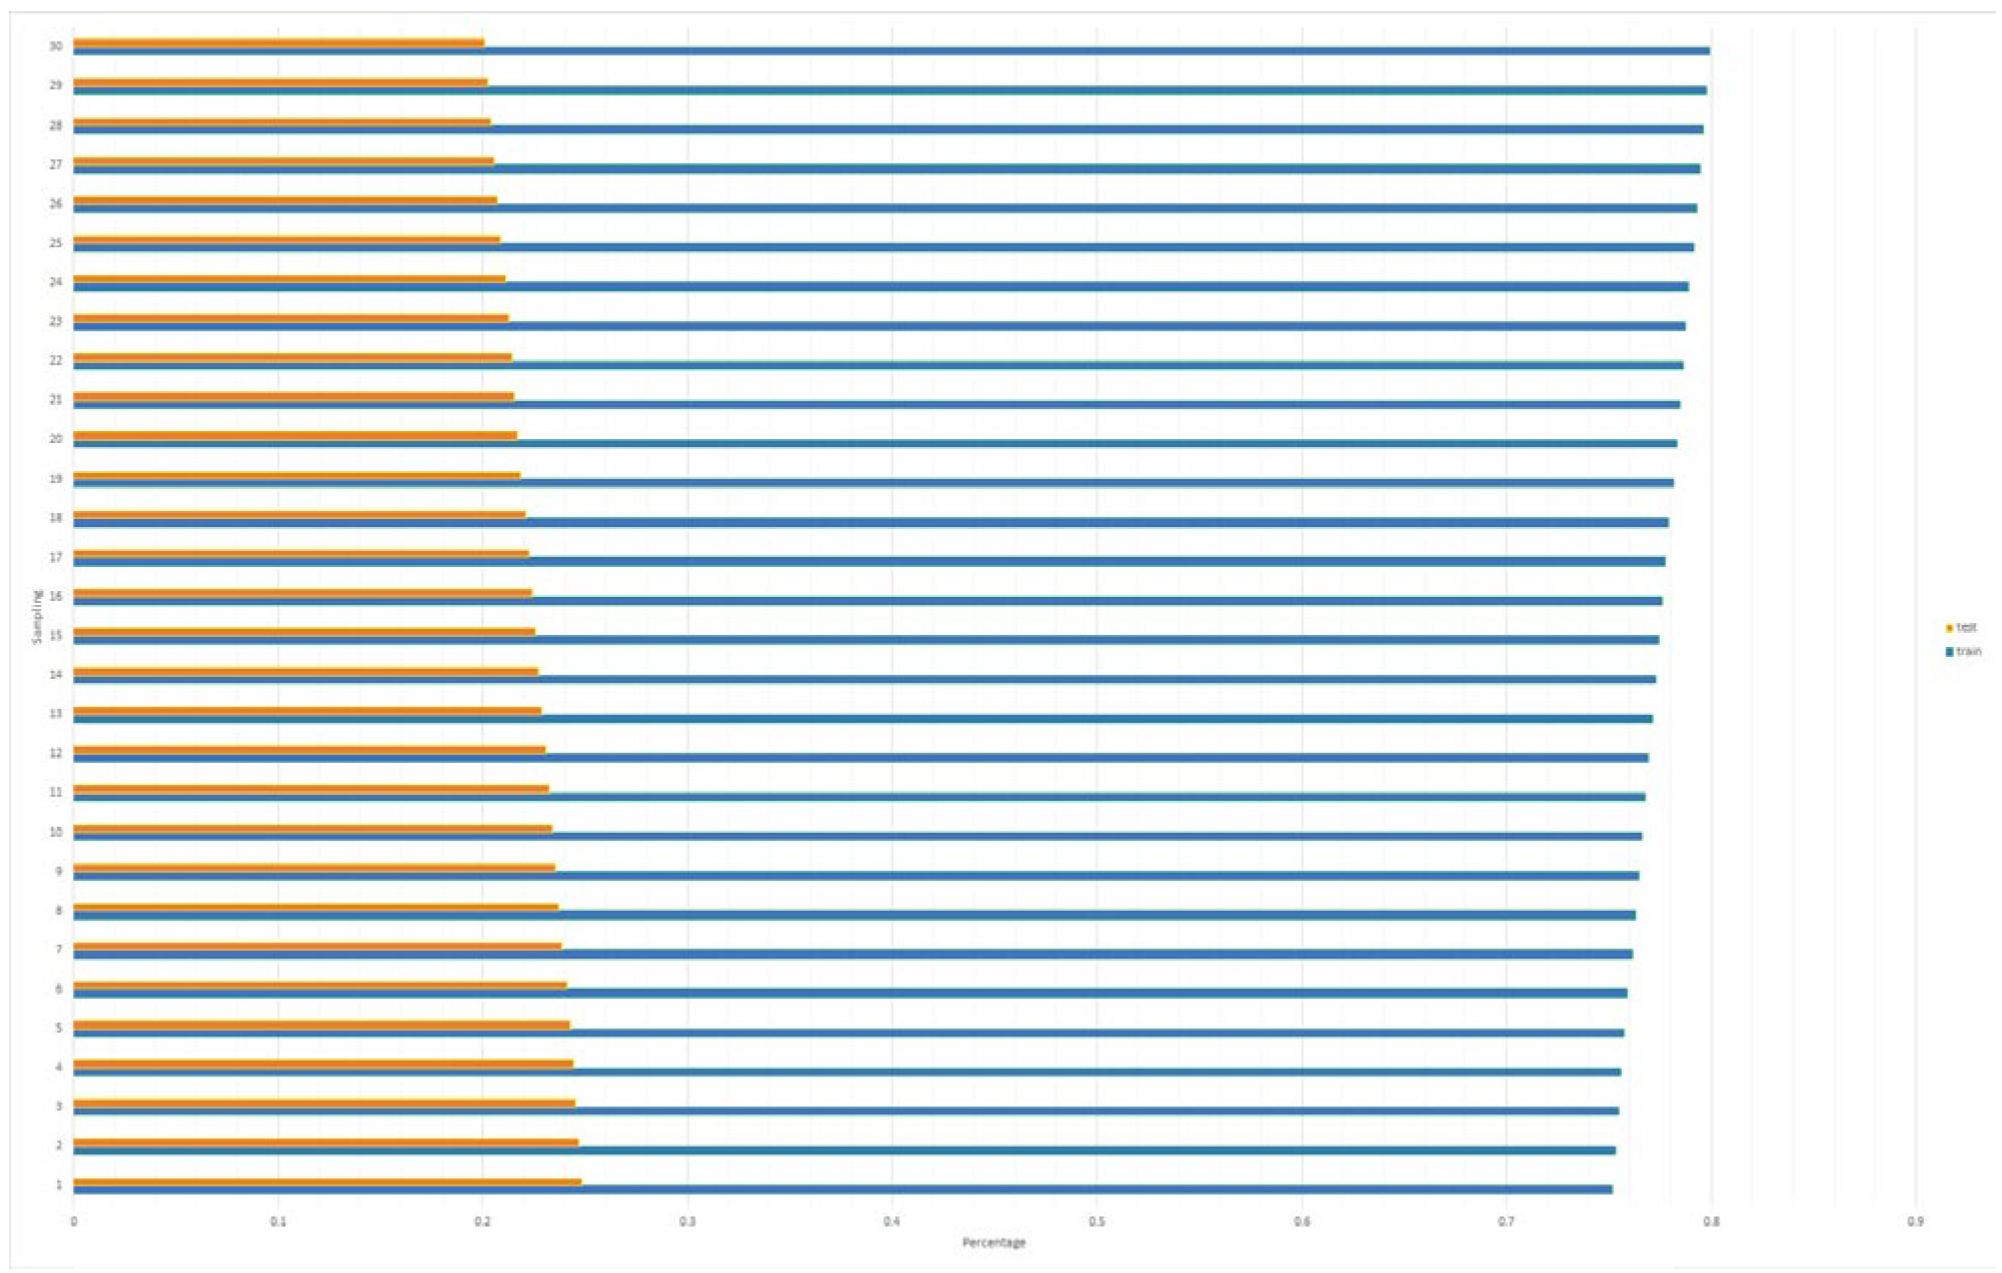
The research data is a digital image of 3172 corn plant diseases and pests distributed into seven classes (Figure 2): nonpathogenic (NP), leaf rust disease (LRD), downy mildew disease (DWD), leaf blight disease (LBD), Locusta pest (LP), Spodoptera Frugiperda pest (SFP), and Heliotis Armigera pest (HAP). The data results from taking photos of them at corn plantations in Tanjung Pering, Tanjung Seteko, and Tanjung Baru, Ogan Ilir, South Sumatra. The SFP is the most common pest that attacks corn crops in Indonesia. It started in early 2019 [47,48], and this dominance can be seen in the data collected in this work.
The leaves were the parts of the corn plant that LRD, DWD, and LBD attacked. The characteristic of LRD is the presence of pustules on both upper and lower leaf surfaces with reddish-brown or black colors scattered across the leaf surface. The leaves become dry at the level of a heavy attack, killing the plant. Leaves infected with DWD are yellow-green. Characteristics of LBD are small oval or ellipse-shaped patches of grayish-green or brown corn leaves scattered across the leaf surface. The parts of the corn plant that SFP and LP attacked were the leaves, while HAP attacked the cobs. The young SFP larvae damage the leaves and attack simultaneously. They leave a remnant of the upper epidermis of the leaf, which is transparent and leaves only the bones of the leaf. LP attacks corn plants by eating the leaves, leaving scars such as tears, while HAP feeds on developing corn kernels and attacks flower stalks first. SFP dominates the other classes with a percentage of about 42%.
The original images have the size of 2000 × 3000 pixels to 6000 × 8000 pixels and are cropped to 256 × 256 pixels to 1010 × 646 pixels to highlight specific observations of diseases and pests. The image is then resized to the exact size of 32 × 32 pixels and converted to the red, green, and blue (RGB) color space model. The average pixel value of each channel R, G, and B is the predictor variable, and the class or type of disease and pest is the label. The examples of the original digital image that was cropped and the preprocessed result for each type (class) of pests and diseases of corn are presented in Figure 3.
The description of the dataset of the image is presented in Table 1. The highest pixel mean in all channels belongs to the LP class. However, the lowest mean of the pixel in the red and green channels belongs to the LBD class, while the blue channel belongs to the DWD class. Therefore, the LP class has the highest standard deviation of pixels in all channels. At the same time, HAP has the lowest standard deviation of the pixel in the blue and green channels.
Before discretizing the predictor variable of each corn plant disease and pest class, assessing the correlation, Gaussian assumption, and descriptive statistical properties is helpful. Figure 4 presents the Pearson correlation between the predictor variables and the distribution plot of each variable for each class of the diseases and pests of corn plants. Pearson correlations in each class of corn plant diseases and pests inform that almost all classes have at least one relationship between variables that is quite strong (more than 0.5), both positive and negative. Of the 21 correlations explored, only the relationships between R and G (DWD), G and B (SFP, HAP), and R and B (HAP) were not strong.
The distribution plots of each class variable convey that no single variable exists in each class with a Gaussian distribution. Likewise, the multivariate Gaussian assumption test utilizing the Henze-Zirkler test for each class of corn diseases and pests [41,49] is given in Table 2.
The null hypothesis for inference is that the joint density functions of predictor variables adhere to a multivariate Gaussian distribution. The hypothesis is rejected if the p-value is less than the significant level of 5%. The result reveals that all classes do not exhibit a multivariate Gaussian distribution. For this reason, multinomial naïve Bayes (MNB) and fuzzy naïve Bayes (FNB) were appropriate for classification purposes.
Figure 5 reports that each class has a wide range of values and a relatively large variance at the pixel values R, G, and B. In this condition, there are certainly not many observations with the same value, and discretization without prior knowledge will result in many equivalence classes. There will be very few elements in each of those equivalence classes. As a result, discretization is inefficient. For example, the Sturges rule can obtain 10–11 classes (categories). Prior knowledge becomes essential in discretization so important information is not lost due to transforming numeric variables.

4.2. Modelings

Training and test data are drawn independently and identically from the same distribution when there is a minor disturbance in training data for a volatile method. Therefore, as depicted in Figure 6, we proposed Monte Carlo resampling to assess the generalization of the proposed multinomial naïve Bayes classification model’s performance. This resampling created multiple splits (thirty splits) with different proportions between 75–80% for modeling and the rest for classification tasks [33].
Discretizing all predictor variables of corn plant disease and pests into five categories is the best choice [9]. Crisp discretization into the five categories is given in Table 3.
We presented the six best models of fuzzy discretization on multinomial naïve Bayes. Each model represents each category m by a fuzzy membership function, and all variables have the same membership function. These parameters are obtained using a tuning system [9,40]. The six models are FMNB1 (all triangular), FMNB2 (all trapezoidal), FMNB3 (combination of linear and triangular), FMNB4 (combination of linear and trapezoidal), FMNB5 (combination of S and triangular), and FMNB6 (combination of S and trapezoidal). The lower and upper limits of the fuzzy membership function parameters for each variable and the proposed FMNB model are presented in Table 4.

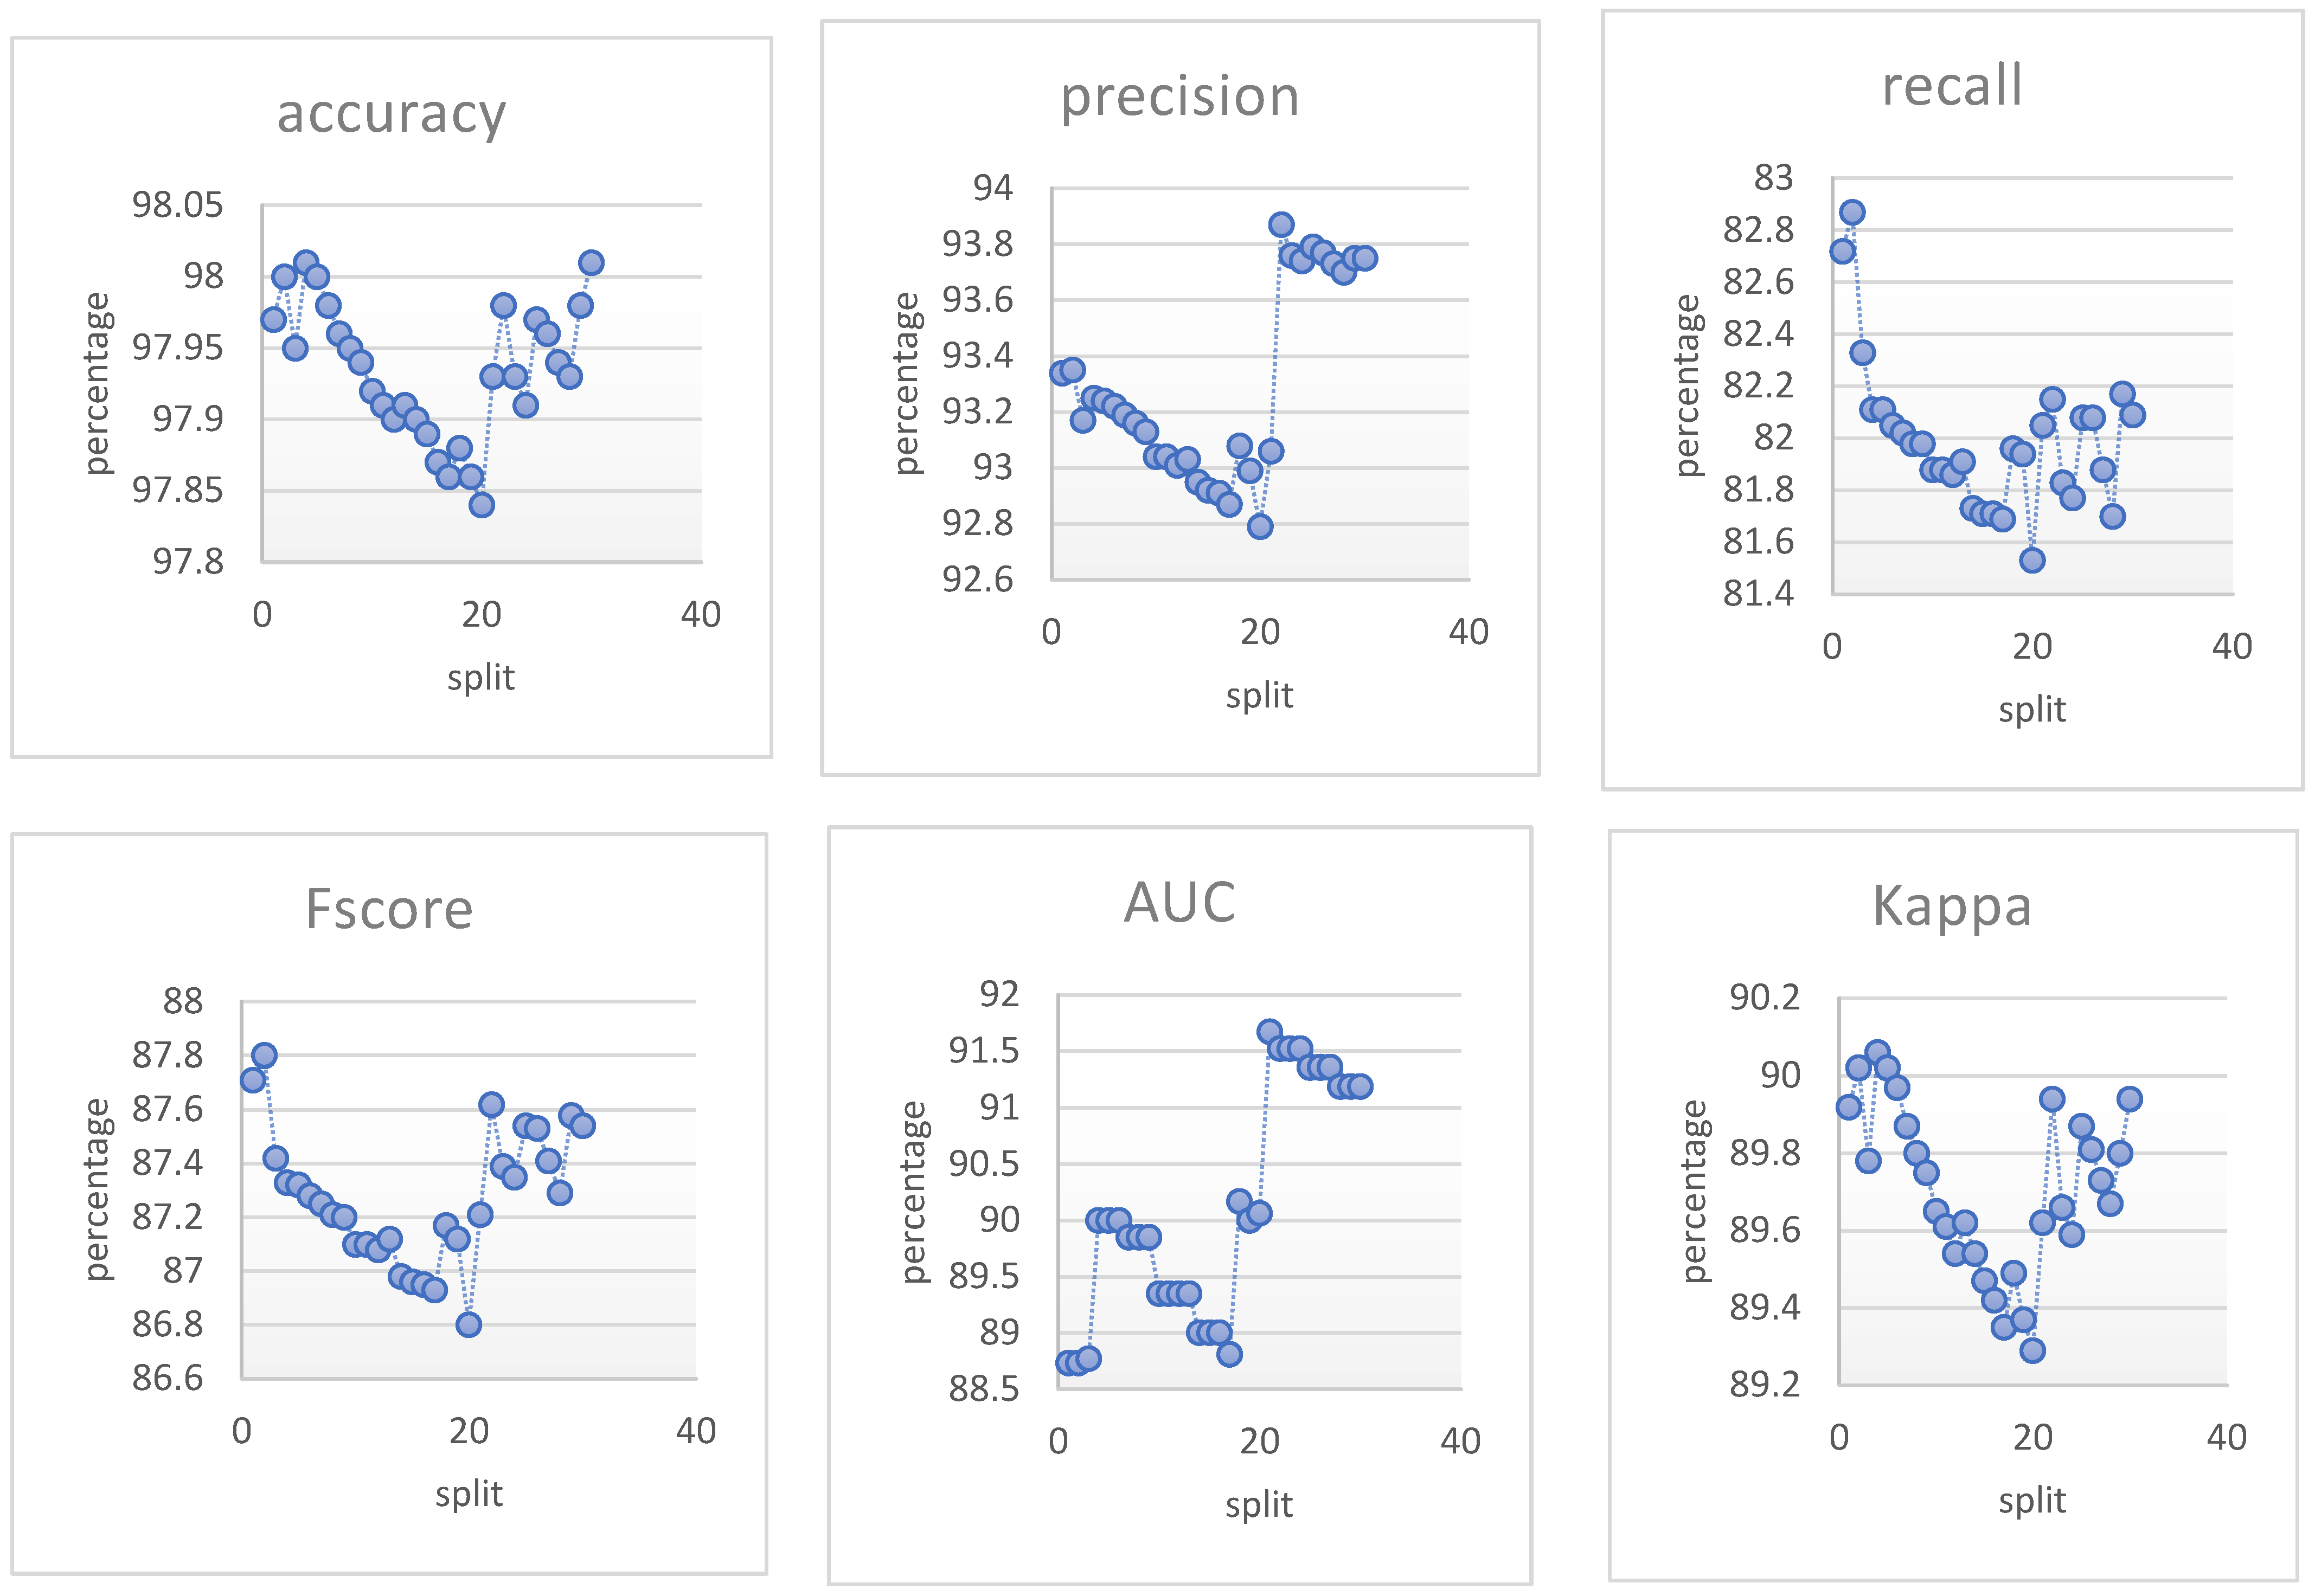
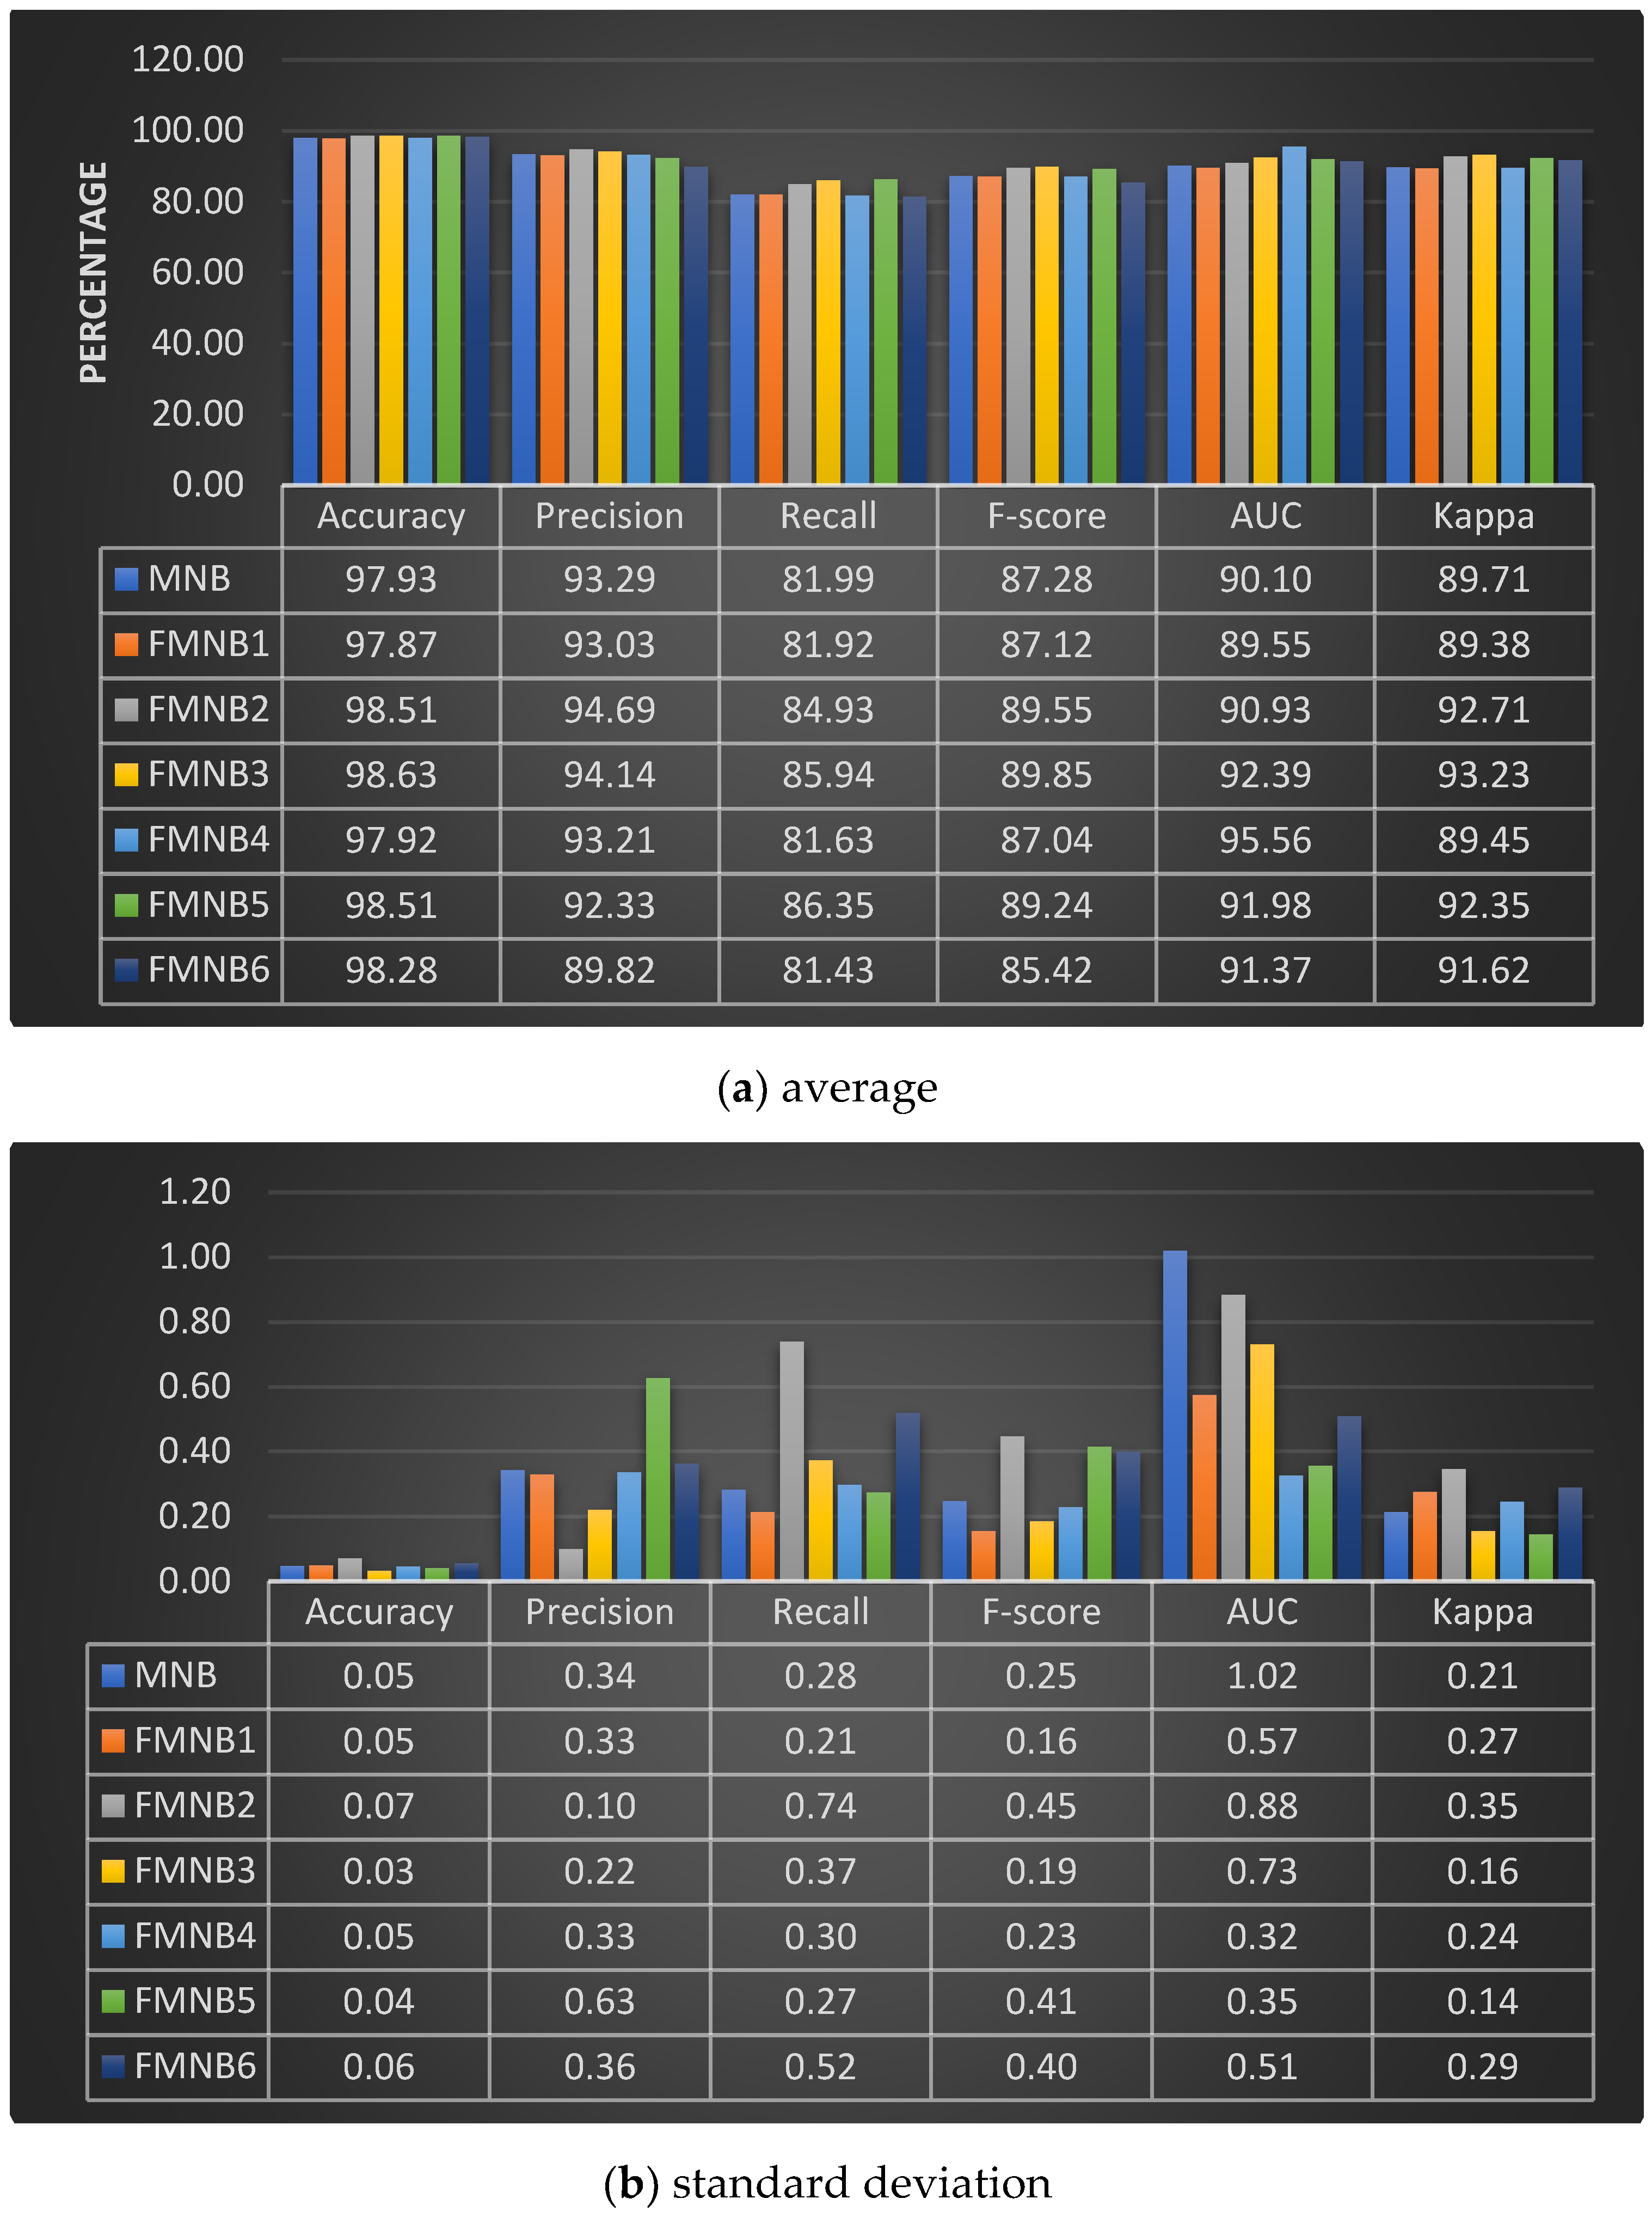
4.3. Result and Discussion

The performance metric of MNB in thirty splits of Monte Carlo resampling, as given in Figure 7, shows that the performance of this method varies in each split of Monte Carlo resampling. These results depend on the training and test data split randomly. This model has the highest performance of 98.02% (accuracy) and the lowest of 81.5% (recall). The model performance, calculated as the average of these thirty splits, represents the true prediction [35] for the other models we propose in this paper.
The criteria in selecting the best model are based on six metrics: accuracy, precision, recall, Fscore, AUC, and Kappa. The greater the metric values indicate, the better the classification model. We focus on macro values for metrics of precision, recall, and Fscore because each class has the same importance [43,44]. We also use Fscore and Kappa to select the best model in this multiclass case [43,45,46]. When applied to multiclass classification, the Kappa and Fscore demonstrate how accurately the model predicted data assignments in distinct classes compared to a randomly chosen class.
Figure 8 shows that the six classification models proposed have an average performance metric of more than 89% (Kappa). This value includes a high level [45]; normally, this is possible if the predictor variable is used and the data closely matches the real word. Then, the distribution of predictions for Monte Carlo resampling in the six proposed models has a relatively small average, and the majority is less than one. We conclude that all the models proposed in this paper perform well since all performance metrics are more than 85%. However, not all fuzzy discretizations in the model MNB can improve the performance of the initial model. This event can be seen in the average performance metrics of the FMNB1 and FMNB4 models. Compared to the initial MNB model, the six performance metrics of the two models are lower. All metrics are measured based on the macro-metrics used to evaluate the performance of a model or system where each class is equally important. In other words, a majority class will contribute equally to the minority. The FMNB3 model is the model with the best classification performance. This model has the highest four averages of the six measured metrics averages, followed successively by the models FMNB2, FMNB5, FMNB6, MNB, FMNB4, and FMNB1. In addition, the FMNB3 model has the highest value on the Fscore and Kappa, a multiclass measure. Experimentation or trial and error are needed for the best classification model performance.
Furthermore, whether the performance of the proposed models is different from one another and whether the increase in classification performance metrics using the proposed fuzzy models is significant can be seen in Table 5. These six proposed models are worth comparing based on performance measurement using Monte Carlo resampling. In 5% significance levels, the test shows that at least one average performance metric differs among the six proposed models for accuracy, precision, recall, Fscore, AUC, and Kappa.
The Tukey-Cramer test with a 5% significance level, as presented in Table 6, has the critical values for the six metrics, respectively, 0.04, 0.28, 0.36, 0.27, 0.56, and 0.18. The pair of models is significantly different and increases metrics when it has an absolute mean difference (AMD) more than the Q-critical value.
Almost all performance metrics of the proposed models are different, and the metrics of MNB have improved significantly. Except AUC for FMNB1 vs FMNB4 and FMNB2 vs FMNB3. This event indicates that all FMNB models with a higher metric value than the initial MNC model are beneficial. Furthermore, these models are also helpful for proving the hypothesis that the combination of selected fuzzy membership functions affects classification performance. The highest increase of each performance metric was 5.46% (AUC at FMNB4), 4.36% (recall at FMNB5), 3.95% (Kappa at FMNB3), 2.57% (Fscore at FMNB3), 1.41% (precision at FMNB2), and 0.70% (accuracy at FMNB3). For FMNB3 as the best model, the increase in performance metrics achieved successively is 3.95% (recall), 3.52% (Kappa), 2.57% (Fscore), 2.29% (AUC), 0.85% (precision), and 0.70% (accuracy). Finally, trial and error is still the best way to obtain fuzzy discretization, producing the best classification performance.
A comparison of the performance of the proposed model with other studies that also implement fuzzy discretization is presented in Table 7. In addition, the performance improvement of the initial model with models that implement fuzzy discretization is also presented in the table. The initial model used discretization based on the crisp set concept.
The greatest increase in accuracy of 34.93% was achieved in classifying types of cans waste using naïve Bayes with a combination of fuzzy, linear, and triangular membership functions [11]. At the same time, the smallest increase in accuracy was achieved by our proposed method. The improvements in accuracy, precision, recall, and specificity achieved in this proposed work from the initial model (MNB) to the best model (FMNB3) were 0.7%, 0.85%, 3.95%, and 13.27%, respectively. Even though the cases classified are different, both have in common, namely using the naïve Bayes method, discretization using a combination of linear and triangular membership functions, and the data is in the form of digital image transformed data. However, there are at least significant differences between the performance metrics of the proposed models, especially between the original model and the model that implements fuzzy discretization. The best performance of the classification model can be obtained by trial and error and by exploring combinations of fuzzy membership functions. Prior knowledge about a variable’s characteristics can help form linguistic terms and become a crisp and fuzzy discretization reference.
Furthermore, a comparison of the results in this work with other work that classifies two classes or multiclass of disease [15,16,17,18,19], and pests in corn plants [9,14,50], is presented in Table 8. The classification of the two classes consists of a healthy class (non-pathogen) and a class infected with disease [15]. By using the hold-out evaluation method with a ratio of 90:10 in research that processes digital image data using this grayscale space model, the highest performance is achieved using the random forest classification method of 79.23% (accuracy), 79% (recall), and 81.5% (Fscore). Digital image size reduction to the same size, 100 × 100 pixels for datasets, can be enlarged to improve model performance.
For the classification of the four classes, there are three disease-infected classes and one healthy class [16,17,18,19]. The highest performance for a dataset of 3853 digital images processed into the RGB color space model and resized to 64 × 64 pixels [16] is 87% (accuracy) using the support vector machine with the linear kernel (SVML) classification method.
For the same dataset, only 200 digital images were randomly sampled, and the support vector machine SVM classification method obtained the highest performance compared to the decision tree (DT) and k-nearest neighbor (KNN) methods based on k-fold cross-validation resampling. At the same time, digital image processing using CNN for classifying the four classes also obtained a performance above 85% based on resampling hold out with a ratio of 70:30, both for 100 data [18] and 5939 data [19]. For the classification of six classes, each consists of three disease-infected classes and three pest-infected classes [9,14]. The dataset processed using the RGB color model is reduced to the same pixel size, 32 × 32. The highest performance in the dataset that was processed using the RGB color space model was 98.54% (accuracy), 88.57% (precision), 94.38% (recall), and 93.59% (Fscore), which was achieved using the KNN classification method. However, the evaluation method used is the hold-out method. By using the same data and the evaluation method using 10-fold cross-validation, the performance of the fuzzy decision tree (FDT) method is better than the DT method.
A seven-class dataset consists of six classes, as in [9,14], and is added with one healthy class. However, the digital image size is reduced to the same size, 256 × 256 pixels. The classification performance using multinomial logistic regression is 99.85% (accuracy), 98.59% (precision), 98.15% (recall), and 98.37% (Fscore). The evaluation used the five-fold cross-validation as a resampling method. The performance of this model is the highest compared to all other studies, including the proposed method. However, in this study, 1444 observations had the same digital image data as other observations, so it was only natural that the performance was high. In our proposed study, all observations consist of different digital images.
The results of classifying the diseases and pests on corn plants using image processing with CNN or transforming them to RGB color space models have equivalent performance. The combination of digital image data preprocessing (including the pixel size used in reducing digital images to the same size) and classification methods certainly also affects the performance of the classification model. Compared with the results of other research that classifies the diseases and pests of corn plants, the results obtained in this work, especially FNB3, obtained better results, especially in terms of precision and accuracy. An empirical assessment using Monte Carlo resampling was conducted to obtain the generalizability of the proposed performance model. The classification results validated using Monte Carlo provide an average performance of 30 multiple splits, making the classification model more robust than those validated using only one particular split. In addition, all metrics of studies for multiclass [9] and our proposed methods are measured based on the macro-metrics. The metrics are used to evaluate the performance of the models where each class is equally important. A majority class will contribute equally along with the minority. Hopefully, this work can provide an overview for experts in classifying the diseases and pests of corn plants based on digital images using fuzzy discretization in the naïve Bayes method. The best model from this classification can be a reference for building an early detection system.

5. Conclusions

Modeling the classification of corn plant diseases and pests is essential for developing an information technology-based early detection system. This paper has modeled the classification of the diseases and pests of corn plants based on digital images by implementing fuzzy discretization. The best performance of the classification model is obtained by trial and error by exploring combinations of fuzzy membership functions that represent each linguistic term in each variable. Prior knowledge about a variable helps form linguistic terms and becomes a reference in crisp and fuzzy discretization. Furthermore, the implementation of fuzzy discretization is also compared with crisp discretization. An empirical assessment using Monte Carlo resampling was conducted to obtain the generalizability of the proposed performance model. The best model determined, based on the number of metrics with the highest value, is the FMNB3 model. In addition, the FMNB3 model has the highest value on the Fscore and Kappa, a multiclass measure. Each predictor variable is represented by decreasing linear, triangular, and increasing linear membership functions. Not all proposed fuzzy naïve Bayes models have higher metrics than the multinomial naïve Bayes. We need more experiments on this matter. The combination of other membership functions and the number of different class intervals on the predictor variable is interesting for further experimentation. However, in this work, predictor variables’ discretization into five categories can provide performance at a high level in the seven proposed models. Ultimately, we hope this work can provide an overview for experts in building early detection systems using classification models based on fuzzy discretization.

Author Contributions

Conceptualization, Y.R., C.I. and I.Y.; methodology, A.N., C.A. and Y.R.; software, Y.R., I.Y., C.A. and A.N.; validation, C.A., A.N., Y.R. and C.I.; formal analysis, Y.R.; investigation, C.I. and Y.R.; resources, C.I. and Y.R.; data curation, C.I. and I.Y; writing—original draft preparation, Y.R.; writing—review and editing, Y.R. and I.Y.; visualization, A.N. and C.A.; supervision, Y.R.; project administration, I.Y.; funding acquisition, Y.R. and C.I. All authors have read and agreed to the published version of the manuscript.

Funding

This research has been funded by DIPA University of Sriwijaya through Competitive Research No. 0118.115/UN9/SB3.LP2M. PT/2022, 17 May 2022.

Data Availability Statement

The data are contained within the article.

Acknowledgments

The author would like to thank the Rector of University of Sriwijaya for DIPA No. SP DIPA-023.17.2.677515/2022 through Decree No. 0109/ UN9.3.1/ SK/2022 on 28 April 2022.

Conflicts of Interest

The authors declare no conflict of interest.

References

  1. Chen, Q.; Huang, M. Rough fuzzy model based feature discretization in intelligent data preprocess. J. Cloud Comput. 2021, 10, 5. [Google Scholar] [CrossRef]
  2. Roy, A.; Pal, S.K. Fuzzy discretization of feature space for a rough set classifier. Pattern Recognit. Lett. 2003, 24, 895–902. [Google Scholar] [CrossRef]
  3. Shanmugapriya, M.; Nehemiah, H.K.; Bhuvaneswaran, R.S.; Arputharaj, K.; Sweetlin, J.D. Fuzzy Discretization based Classification of Medical Data. Res. J. Appl. Sci. Eng. Technol. 2017, 14, 291–298. [Google Scholar] [CrossRef]
  4. Algehyne, E.A.; Jibril, M.L.; Algehainy, N.A.; Alamri, O.A.; Alzahrani, A.K. Fuzzy Neural Network Expert System with an Improved Gini Index Random Forest-Based Feature Importance Measure Algorithm for Early Diagnosis of Breast Cancer in Saudi Arabia. Big Data Cogn. Comput. 2022, 6, 13. [Google Scholar] [CrossRef]
  5. Fernandez, S.; Ito, T.; Cruz-Piris, L.; Marsa-Maestre, I. Fuzzy Ontology-Based System for Driver Behavior Classification. Sensors 2022, 22, 7954. [Google Scholar] [CrossRef]
  6. Eftekhari, M.; Mehrpooya, A.; Farid, S.-M.; Vicenc, T. How Fuzzy Concepts Contribute to Machine Learning; Springer: Cham, Switzerland, 2022. [Google Scholar] [CrossRef]
  7. Chen, H.L.; Hu, Y.C.; Lee, M.Y. Evaluating appointment of division managers using fuzzy multiple attribute decision making. Mathematics 2021, 9, 2417. [Google Scholar] [CrossRef]
  8. Altay, A.; Cinar, D. Fuzzy decision trees. In Studies in Fuzziness and Soft Computing, 1st ed.; Springer: Cham, Switzerland, 2016; pp. 221–261. [Google Scholar] [CrossRef]
  9. Resti, Y.; Irsan, C.; Amini, M.; Yani, I.; Passarella, R.; Zayanti, D.A. Performance Improvement of Decision Tree Model using Fuzzy Membership Function for Classification of Corn Plant Diseases and Pests. Sci. Technol. Indones. 2022, 7, 284–290. [Google Scholar] [CrossRef]
  10. Femina, B.T.; Sudheep, E.M. A Novel Fuzzy Linguistic Fusion Approach to Naive Bayes Classifier for Decision Making Applications. Int. J. Adv. Sci. Eng. Inf. Technol. 2020, 10, 1889–1897. [Google Scholar] [CrossRef]
  11. Resti, Y.; Burlian, F.; Yani, I.; Zayanti, D.A.; Sari, I.M. Improved the Cans Waste Classification Rate of Naive Bayes using Fuzzy Approach. Sci. Technol. Indones. 2020, 5, 75–78. [Google Scholar] [CrossRef]
  12. Yazgi, T.G.; Necla, K. An Aggregated Fuzzy Naive bayes Data Classifier. J. Comput. Appl. Math. 2015, 286, 17–27. Available online: https://www.ptonline.com/articles/how-to-get-better-mfi-results (accessed on 12 December 2022).
  13. Sadollah, A. Introductory Chapter: Which Membership Function is Appropriate in Fuzzy System? In Fuzzy Logic Based in Optimization Methods and Control Systems and Its Applications; InTechOpen: London, UK, 2018; pp. 3–6. [Google Scholar] [CrossRef] [Green Version]
  14. Resti, Y.; Irsan, C.; Putri, M.T.; Yani, I.; Anshori; Suprihatin, B. Identification of Corn Plant Diseases and Pests Based on Digital Images using Multinomial Naïve Bayes and K-Nearest Neighbor. Sci. Technol. Indones. 2022, 7, 29–35. [Google Scholar] [CrossRef]
  15. Panigrahi, K.P.; Das, H.; Sahoo, A.K.; Moharana, C.S. Maize Leaf Disease Detection and Classification Using Machine Learning Algorithms; Springer: Singapore, 2020. [Google Scholar] [CrossRef]
  16. Kusumo, B.S.; Heryana, A.; Mahendra, O.; Pardede, H.F. Machine Learning-based for Automatic Detection of Corn-Plant Diseases Using Image Processing. In Proceedings of the 2018 International Conference on Computer, Control, Informatics and its Applications (IC3INA), Tangerang, Indonesia, 1–2 November 2018; pp. 93–97. [Google Scholar] [CrossRef]
  17. Syarief, M.; Setiawan, W. Convolutional neural network for maize leaf disease image classification. Telkomnika Telecommun. Comput. Electron. Control. 2020, 18, 1376–1381. [Google Scholar] [CrossRef]
  18. Sibiya, M.; Sumbwanyambe, M. A Computational Procedure for the Recognition and Classification of Maize Leaf Diseases Out of Healthy Leaves Using Convolutional Neural Networks. AgriEngineering 2019, 1, 119–131. [Google Scholar] [CrossRef] [Green Version]
  19. Haque, M.A.; Marwaha, S.; Deb, C.K.; Nigam, S.; Arora, A.; Hooda, K.S.; Soujanya, P.L.; Aggarwal, S.K.; Lall, B.; Kumar, M.; et al. Deep learning-based approach for identification of diseases of maize crop. Sci. Rep. 2022, 12, 1–14. [Google Scholar] [CrossRef]
  20. Xian, T.S.; Ngadiran, R. Plant Diseases Classification using Machine Learning. J. Phys. Conf. Ser. 2021, 1962, 1–12. [Google Scholar] [CrossRef]
  21. Ngugi, L.C.; Abelwahab, M.; Abo-Zahhad, M. Recent Advances in Image Processing Techniques for Automated Leaf Pest an Diseas Recognition—A Review. Inf. Process. Agric. 2021, 8, 27–51. [Google Scholar] [CrossRef]
  22. Domingues, T.; Brandão, T.; Ferreira, J.C. Machine Learning for Detection and Prediction of Crop Diseases and Pests: A Comprehensive Survey. Agriculture 2022, 12, 1350. [Google Scholar] [CrossRef]
  23. Kasinathan, T.; Singaraju, D.; Sriniuasulu, R.U. Insect classification and detection in field crops using modern machine learning techniques. Inf. Process. Agric. 2021, 8, 446–457. [Google Scholar] [CrossRef]
  24. Almadhor, A.; Rauf, H.T.; Lali, M.I.U.; Damaševičius, R.; Alouffi, B.; Alharbi, A. Ai-driven framework for recognition of guava plant diseases through machine learning from dslr camera sensor based high resolution imagery. Sensors 2021, 21, 3830. [Google Scholar] [CrossRef]
  25. Hossain, E.; Hossain, M.F.; Rahaman, M.A. A Color and Texture Based Approach for the Detection and Classification of Plant Leaf Disease Using KNN Classifier. In Proceedings of the 2019 International Conference on Electrical, Computer and Communication Engineering (ECCE), Cox’sBazar, Bangladesh, 7–9 February 2019; pp. 1–6. [Google Scholar] [CrossRef]
  26. Rajesh, B.; Vardhan, M.V.S.; Sujihelen, L. Leaf Disease Detection and Classification by Decision Tree. In Machine Learning Foundations; Springer: Cham, Switzerland, 2020; pp. 141–165. [Google Scholar] [CrossRef]
  27. AAgghey, Z.; Mwinuka, L.J.; Pandhare, S.M.; Dida, M.A.; Ndibwile, J.D. Detection of username enumeration attack on ssh protocol: Machine learning approach. Symmetry 2021, 13, 2192. [Google Scholar] [CrossRef]
  28. Akbar, F.; Hussain, M.; Mumtaz, R.; Riaz, Q.; Wahab, A.W.A.; Jung, K.H. Permissions-Based Detection of Android Malware Using Machine Learning. Symmetry 2022, 14, 718. [Google Scholar] [CrossRef]
  29. Hsu, S.C.; Chen, I.C.; Huang, C.L. Image classification using naive bayes classifier with pairwise local observations. J. Inf. Sci. Eng. 2017, 33, 1177–1193. [Google Scholar] [CrossRef]
  30. Pan, Y.; Gao, H.; Lin, H.; Liu, Z.; Tang, L.; Li, S. Identification of bacteriophage virion proteins using multinomial Naïve bayes with g-gap feature tree. Int. J. Mol. Sci. 2018, 19, 1779. [Google Scholar] [CrossRef] [PubMed] [Green Version]
  31. Daniele, S.; Jonathan, M.G.; Federico, A.; Biganzoli, E.M.; Ian, O.E. A Non-parametric Version of the Naive Bayes Classifier. Knowl. Based Syst. 2011, 24, 775–784. [Google Scholar] [CrossRef] [Green Version]
  32. Mazhar, T.; Malik, M.A.; Nadeem, M.A.; Mohsan, S.A.H.; Haq, I.; Karim, F.K.K.; Mostafa, S.M.M. Movie Reviews Classification through Facial Image Recognition and Emotion Detection Using Machine Learning Methods. Symmetry 2022, 14, 2607. [Google Scholar] [CrossRef]
  33. Kuhn, M.; Johnson, K. Applied Predictive Modeling; Springer: Cham, Switzerland, 2013. [Google Scholar] [CrossRef]
  34. Bae, J.-H.; Yu, G.-H.; Lee, J.-H.; Vu, D.T.; Anh, L.H.; Kim, H.-G.; Kim, J.-Y. Superpixel Image Classification with Graph Convolutional Neural Networks Based on Learnable Positional Embedding. Appl. Sci. 2022, 12, 9176. [Google Scholar] [CrossRef]
  35. Zhang, H.; Zhou, J.J.; Li, R. Enhanced Unsupervised Graph Embedding via Hierarchical Graph Convolution Network. Math. Probl. Eng. 2020, 2020, 5702519. [Google Scholar] [CrossRef]
  36. Yu, D.; Yang, Y.; Zhang, R.; Wu, Y. Knowledge embedding based graph convolutional network. In Proceedings of the WWW’21: The Web Conference 2021, Ljubljana, Slovenia, 19–23 April 2021; pp. 1619–1628. [Google Scholar] [CrossRef]
  37. Giordano, M.; Maddalena, L.; Manzo, M.; Guarracino, M.R. Adversarial attacks on graph-level embedding methods: A case study. Ann. Math. Artif. Intell. 2022. [Google Scholar] [CrossRef]
  38. Wang, C.; Zhou, J.; Zhang, Y.; Wu, H.; Zhao, C.; Teng, G.; Li, J. A Plant Disease Recognition Method Based on Fusion of Images and Graph Structure Text. Front. Plant Sci. 2022, 12, 1–12. [Google Scholar] [CrossRef]
  39. Hudec, M. Fuzziness in Information Systems: How to Deal with Crisp and Fuzzy Data in Selection, Classification, and Summarization, 1st ed.; Springer International Publishing: Cham, Switzerland, 2016. [Google Scholar] [CrossRef] [Green Version]
  40. Yunus, M. Optimasi Penentuan Nilai Parameter Himpunan Fuzzy dengan Teknik Tuning System. MATRIK J. Manajemen Tek. Inform. dan Rekayasa Komput. 2018, 18, 21–28. [Google Scholar] [CrossRef]
  41. Resti, Y.; Kresnawati, E.S.; Dewi, N.R.; Zayanti, D.A.; Eliyati, N. Diagnosis of diabetes mellitus in women of reproductive age using the prediction methods of naive bayes, discriminant analysis, and logistic regression. Sci. Technol. Indones. 2021, 6, 96–104. [Google Scholar] [CrossRef]
  42. Lee, C.F.; Tzeng, G.H.; Wang, S.Y. A new application of fuzzy set theory to the Black-Scholes option pricing model. Expert Syst. Appl. 2005, 29, 330–342. [Google Scholar] [CrossRef]
  43. Dinesh, S.; Dash, T. Reliable Evaluation of Neural Network for Multiclass Classification of Real-world Data. arXiv 2016, arXiv:1612.00671. [Google Scholar]
  44. Sokolova, M.; Lapalme, G. A systematic analysis of performance measures for classification tasks. Inf. Process. Manag. 2009, 45, 427–437. [Google Scholar] [CrossRef]
  45. Ramasubramanian, K.; Singh, A. Machine Learning Using R With Time Series and Industry-Based Use Cases in R, 2nd ed.; Apress: New Delhi, India, 2019. [Google Scholar] [CrossRef]
  46. De Diego, I.M.; Redondo, A.R.; Fernández, R.R.; Navarro, J.; Moguerza, J.M. General Performance Score for classification problems. Appl. Intell. 2022, 52, 12049–12063. [Google Scholar] [CrossRef]
  47. Lubis, A.A.N.; Anwar, R.; Soekarno, B.P.; Istiaji, B.; Dewi, S.; Herawati, D. Serangan Ulat Grayak Jagung (Spodoptera frugiperda) pada Tanaman Jagung di Desa Petir, Kecamatan Daramaga, Kabupatem Bogor dan Potensi Pengendaliannya Menggunakan Metarizhium Rileyi. J. Pus. Inov. Masyarkat 2020, 2, 931–939. [Google Scholar]
  48. Firmansyah, E.; Ramadhan, R.A.M. Tingkat serangan Spodoptera frugiperda J.E. Smith pada pertanaman jagung di Kota Tasikmalaya dan perkembangannya di laboratorium. Agrovigor J. Agroekoteknologi 2021, 14, 87–90. [Google Scholar] [CrossRef]
  49. Székely, G.J.; Rizzo, M.L. A new test for multivariate normality. J. Multivar. Anal. 2005, 93, 58–80. [Google Scholar] [CrossRef] [Green Version]
  50. Resti, Y.; Desi, H.S.; Zayanti, D.A.; Eliyati, N. Classification of Diseases Aand Pests Of Maize using Multinomial Logistic Regression Based on Resampling Technique of K-Fold Cross-Validation. Indones. J. Eng. Sci. 2022, 3, 69–76. [Google Scholar] [CrossRef]
Figure 1. Research Flowchart.
Mathematics 11 01761 g001
Figure 2. Percentage of diseases and pests of multiclass corn plants.
Mathematics 11 01761 g002
Figure 3. Corn plant disease and pest digital images.
Mathematics 11 01761 g003
Figure 4. Pearson correlation and distribution plot.
Mathematics 11 01761 g004
Figure 5. Range and standard deviation of RGB pixel value in each class.
Mathematics 11 01761 g005
Figure 6. Sample split on Monte Carlo resampling.
Mathematics 11 01761 g006
Figure 7. Performance metric of MNB on split samples of Monte Carlo resampling.
Mathematics 11 01761 g007
Figure 8. The performance metrics of the models using Monte Carlo resampling.
Mathematics 11 01761 g008
Table 1. Dataset Description.
ClassMean of Pixel Value in ChannelStd. Dev. of Pixel Value in Channel
RedGreenBlueRedGreenBlue
NP129.13157.58118.2028.5526.6329.39
LRD125.19134.25102.6319.1020.3818.61
DWD152.88146.4051.409.2614.2421.46
LBD117.03122.94101.6213.8112.8315.87
LP195.71199.24134.6719.0117.4638.97
SFP120.58150.0464.5413.3612.0430.37
HAP163.26149.1589.3516.5311.1614.12
Table 2. Multivariate Gaussian Test.
Henze-Zirkler
Test
Class of Corn Diseases and Pests
LRDDWDLBDLPSFPHAPNP
Statistic5.551.671.892.3111.684.4918.89
p-value0.007.2 × 10−62.56 × 10−71.64 × 10−90.000.000.00
Table 3. Crisp discretization.
m l m c x d ,   u m c x d
x 1 x 2 x 3
1[32.77, 75.55][63.00, 99.70][12.18, 56.11]
2[75.56, 118.34][99.71, 136.40][56.12, 100.03]
3[118.35, 161.12][136.41, 173.10][100.04, 143.95]
4[161.13, 203.90][173.11, 209.80][143.96, 187.87]
5[203.91, 246.68][209.81, 246.50][187.88, 231.80]
Table 4. Fuzzy discretization.
Model m l m f x d ,   parameters ,   u m f x d
x 1 x 2 x 3
FMNB11[32.77, 57.64, 85.55][63.00, 83.41, 109.70][12.18, 34.74, 66.11]
2[72.64, 66.54, 128.34][93.41, 118.42, 146.40][49.74, 74.79, 110.03]
3[102.64, 137.62, 171.12][131.45, 156.43, 183.10][89.79, 119.80, 153,95]
4[152.64,181.60, 213.90][168.47, 188.46,, 219.80][134.81, 167,81, 197.87]
5[206.02, 220.04, 246.68][175.20, 189.23, 246.50][192.29, 206.33,231.80]
FMNB21[32.77,44.77, 62.77, 90.55][63.00, 78.00, 93.00, 114.70][12.18, 27.17, 42.18, 71.11]
2[55.77, 75.76, 97.77, 133.34][86.00, 106.00, 128.00, 151.40][35.18,55.16, 77.18, 115.03]
3[83.77, 103.76, 125.77, 176.12][114.00, 106.00, 128.00, 188.10][63.18, 83.17, 105.17, 158.95]
4[111.76, 131.77, 153.76, 218.90][142.00, 162.00, 184.01, 224.80][91.18, 111.17, 133.18, 202.87]
5[139.77, 159.76, 181.76, 246.68][170.00, 190.02, 212.01, 246.50][119.18, 139.17, 161.16, 231.80]
FMNB31[32.77, 88.64][63.00, 113.41][12.18, 66.74]
2[51.54, 93.06, 135.57][65.10,92.09, 155.08][30.03, 78.91, 120.79]
3[114.00, 127.85, 174.68][105.37, 153.79, 195.21][80.10, 125.17, 160.24]
4[143.11,150.44, 225.77][164.28, 179.19, 200.09][145.19, 182.06, 198.93]
5[206.02, 220.04, 246.68][175.20, 246.50][192.29, 231.80]
FMNB41[32.77, 88.64][63.00, 113.41][12.18, 66.74]
2[96.64, 116.64, 138.63, 133.34][121.41, 141.42, 163.44, 151.40][74.74, 94.70, 116.73, 115.03]
3[124.64, 144.63, 166.62, 176.12][149.41, 169.44, 169.42, 188.10][102.74, 122.72, 144.70, 158.95]
4[152.64, 172.62, 194.64, 218.90][177.41, 197.42, 219.40, 224.80][130.74, 150.72, 172.71, 202.87]
5[206.02, 246.68][175.20, 246.50][192.29, 231.80]
FMNB51[32.77, 60.64, 88.50][63.00, 82.41, 101.81][12.18, 43.74, 75.30]
2[71.54, 96.06, 120.57][85.10, 115.09, 145.08][56.03, 87.91, 119.79]
3[109.00, 127.85, 146.68][109.37, 137.79, 166.21][99.10, 128.17, 157.24]
4[131.11, 166.44, 201.77][135.28, 171.19, 207.09][143.19, 171.06, 198.93]
5[170.02, 208.35, 246.68][169.20, 207.85, 246.50][187.29, 209.55, 231.80]
FMNB61[32.77, 60.64, 88.50][63.00, 82.41, 101.81][12.18, 43.74, 75.30]
2[71.54, 87.50, 106.15, 120.57][85.10, 109.55, 126.18, 145.08][56.03, 68.62, 87.58, 119.79]
3[109.00, 126.41, 139.04, 146.68][109.37, 146.44, 163.07, 166.21][99.10, 112.51, 131.47, 157.24]
4[131.11, 150.30, 181.93, 201.77][135.28, 183.33, 199.96, 207.09][137.44, 156.40, 175.36, 194.33]
5[170.02, 208.35, 246.68][169.20, 207.85, 246.50][187.29, 209.55, 231.80]
Table 5. ANOVA.
Table 5. ANOVA.
MetricsSource
of Var.
Sum of SquaresMean SquaresFp-ValueF-Criteria
Accuracybetween9.142.29876.632 × 10−1002.43
within0.380.00
Precisionbetween441.47110.37790.852.37 × 10−97
within20.240.14
Recallbetween621.85155.46703.457.73 × 10−94
within32.050.22
Fscore between425.96106.49853.801.2 × 10−99
within18.080.12
AUCbetween96.4124.1044.093.57 × 10−24
within79.270.55
Kappabetween225.6856.42962.043 × 10−103
within8.500.06
Table 6. Tukey-Cramer Test.
Comparison ModelAbsolute Mean Difference
AccuracyPrecisionRecallFscoreAUCKappa
MNB vs. FMNB20.571.412.942.270.833.01
MNB vs. FMNB30.700.853.952.572.293.52
MNB vs. FMNB50.570.964.361.961.882.65
MNB vs. FMNB60.353.470.571.861.271.91
FMNB2 vs. FMNB30.120.561.010.311.460.52
FMNB2 vs. FMNB30.002.361.420.311.050.36
FMNB2 vs. FMNB30.234.883.504.130.441.09
FMNB3 vs. FMNB50.121.810.410.610.410.88
FMNB3 vs. FMNB60.354.324.514.431.021.61
FMNB5 vs. FMNB60.232.514.923.820.610.73
Table 7. Comparison of the proposed original and implemented fuzzy discretization model result with previous research.
Prediction Method/
Dataset/Number of Class
Combination of Fuzzy Membership FunctionsPerformance of Original Model (%)Performance of Fuzzy Approach Model (%)
Accu Prec Rec SpecAccu Prec Rec Spec
NN-RF/breast cancer SA/two (Algehyne et al. [4])all trapezoidal95.61-88.4593.5699.33-99.4199.24
GA/driver behavior
(Fernandez et al. [5])
linear and triangular
trapezoidal (only
for age)
-----82.0087.00-
DTID3/Corn Diseases and Pests (Resti et al. [9])S and triangular94.5384.3183.0796.7297.7689.8394.8798.66
NB/ Heart Disease Status (Femina and Sudheep [10])all triangular 87.60-88.6379.1091.63-92.6890.19
NB/ Types of Cans Waste (Resti et al. [11])linear and triangular 50.26---85.19---
NB/heart disease (Yazgi and Necla [12])all trapezoidal74.00---81.50---
Proposed method linear and triangular 97.9393.2981.9998.7998.6394.1485.9499.21
Table 8. Comparison of the results of the classification of diseases and pests of corn plants.
Paper No of ClassNo of Obs.Evaluation MethodClassification
Method
Performance Metric (%)
Accu Prec Rec Fscore
Panigrahi et al. [15]23823Hold out with a ratio of 90:10DT74.35-75.0075.00
KNN76.16-75.0076.00
NB77.46-78.0075.50
SVM77.56-78.5078.50
RF79.23-79.0081.50
Kusumo et al. [16]4385210-CV DT77.00---
NB78.00---
RF88.00---
SVML89.00---
SVMR87.00---
Sibiya and
Sumbwanyambe [18]
4100Hold out with a ratio of 70:30CNN92.85---
Haque [19]45939Hold out with a ratio of 70:30CNN95.71---
Syarief and Setiawan [17]420010-CV DT83.30-83.58-
KNN93.30-94.72-
SVM93.50-95.08-
Resti et al. [14]6761Hold out with a ratio of 80:20MNB92.7279.8879.2478.17
KNN98.5488.5794.3893.59
Resti et al. [9]676110-CVDT94.5384.3183.0783.58
FDT97.7689.3994.8793.29
Resti et al. [50]746165-CVLR99.8598.5998.1598.37
Proposed Method73172Monte Carlo MNB97.9393.2981.9987.28
FNB398.6394.1485.9489.95
Disclaimer/Publisher’s Note: The statements, opinions and data contained in all publications are solely those of the individual author(s) and contributor(s) and not of MDPI and/or the editor(s). MDPI and/or the editor(s) disclaim responsibility for any injury to people or property resulting from any ideas, methods, instructions or products referred to in the content.

