Article

Multi-Drug Scheduling for Chemotherapy Using Fractional Order Internal Model Controller

1
Department of Mechatronics, Manipal Institute of Technology, Manipal Academy of Higher Education, Manipal 576104, India
2
Symbiosis Institute of Technology, Symbiosis International University (Deemed University), Pune 412115, India
3
Department of Information Technology, College of Computer and Information Sciences, Princess Nourah bint Abdulrahman University, P.O. Box 84428, Riyadh 11671, Saudi Arabia
*
Author to whom correspondence should be addressed.
Mathematics 2023, 11(8), 1779; https://doi.org/10.3390/math11081779
Submission received: 24 February 2023 / Revised: 29 March 2023 / Accepted: 6 April 2023 / Published: 8 April 2023
(This article belongs to the Special Issue Mathematics in Biomedicine, 2nd Edition)

Abstract

:
Chemotherapy is a widely used cancer treatment method globally. However, cancer cells can develop resistance towards single-drug-based chemotherapy if it is infused for extended periods, resulting in treatment failure in many cases. To address this issue, oncologists have progressed towards using multi-drug chemotherapy (MDC). This method considers different drug concentrations for cancer treatment, but choosing incorrect drug concentrations can adversely affect the patient’s body. Therefore, it is crucial to recognize the trade-off between drug concentrations and their adverse effects. To address this issue, a closed-loop multi-drug scheduling based on Fractional Order Internal-Model-Control Proportional Integral (IMC-FOPI) Control is proposed. The proposed scheme combines the benefits of fractional PI and internal model controllers. Additionally, the parameters of IMC-FOPI are optimally tuned using a random walk-based Moth-flame optimization. The performance of the proposed controller is compared with PI and Two degrees of freedom PI (2PI) controllers for drug concentration control at the tumor site. The results reveal that the proposed control scheme improves the settling time by 43% and 21% for VX, 54% and 48 % for VY, and 48% and 40% for VZ, respectively, compared to PI and 2PI. Therefore, it can be concluded that the proposed control scheme is more efficient in scheduling multi-drug than conventional controllers.

1. Introduction

Cancer is a chronic illness that causes a significant number of deaths worldwide. It involves the growth of unwanted tumors in the nerve tissues of the human body that can spread to other body parts from the initial site [1]. The three crucial stages of cancer are initiation, promotion, and progression [2]. Unfortunately, cancer is often not detected during its initial stage, making it challenging to treat once it reaches the progression stage. In 2020, approximately 1.39 million cases of cancer were reported globally. However, the Indian Council of Medical Research has predicted that this number will increase by 12% over the next five years, which is a concerning situation that requires effective treatment solutions [3]. The main approaches for treating cancer include advanced surgical techniques, chemotherapy, hormonal therapy, radiation therapy, adjuvant therapy, and immunotherapy [4].
Among these, chemotherapy has been widely used and proven to be effective. This method involves administering cytotoxic drugs into the patient’s body to eradicate cancer cells. However, these drugs can also harm normal cells due to their toxicity, which poses a risk to the patient’s life during treatment. Therefore, it is essential to select an appropriate drug dosage that can destroy cancer cells while causing minimal harm to healthy cells [5]. Administering drugs in cumulative cycles with appropriate dosages per cycle is a delicate process that requires an optimal schedule for each cycle. Single-drug delivery systems are vulnerable to drug resistance in cancer cells, which can result in treatment failure [6]. Therefore, using multiple drugs in chemotherapy has proven more effective than using a single drug. In multi-drug chemotherapy (MDC), selecting an appropriate combination of drug dosages is crucial to balancing the drugs’ benefits and toxic effects. In [7,8], an analytical gradient-based method for reducing tumor size is proposed using a single drug dosage scheme. In [9], drug scheduling using a direct search algorithm with systematic search region contraction is attempted, and the results are reliable compared to the analytical method. An automated single drug delivery using distributed evolutionary computing is implemented in [10], and the results are contrasted with techniques such as simulated annealing and tabu search algorithms. An improved GA-based single-drug delivery model was implemented in [11,12], and the results are compared with clinical data. A multi-objective GA-based IPD controller is implemented in [13] for a single drug delivery system and found a substantial reduction in cancer cells using this methodology. An H∞ controller-based drug delivery system for tumor growth reduction is implemented in [14,15], and the results are more encouraging than a PID controller. A model-based control mechanism is designed in [16] for chemotherapeutic drug delivery for cancer treatment and compared with the PI controller. A nonlinear synergetic fuzzy approach for single drug delivery is implemented in [17], and the analysis with external disturbances is studied. In [18], an intuitionistic fuzzy logic-based control scheme is implemented for drug dosage during chemotherapy, and a high reduction in cancer cells is achieved. A combined swarm and evolutionary-based control strategy for drug delivery is proposed in [19], which is more effective than pure swarm or evolutionary methods with a tolerable dosage of the drug injection. It is evident from the literature that several single-drug scheduling methods are proposed for chemotherapy, whereas the research on MDC in a closed loop is confined. In single-drug scheduling, cancer cells resist the drug if the dosage is infused for a more extended period; single-drug scheduling fails in many cases. Therefore, to counter this issue, most oncologists progress toward MDC. In MDC, the concentration of each drug plays a vital role throughout the treatment process. It became a challenging issue for oncologists to determine the appropriate dose of each drug. Hence closed-loop multi-drug control is necessary for estimating the suitable drug scheduling in MDC.
It is revealed from the literature that PID, along with its variants, is implemented for multi-drug scheduling during cancer treatment [20,21]. The performance of these conventional controllers degrades if there is any change in the physiological condition of the person undergoing treatment. This problem can be minimized if the physiological conditions are modeled using fractional-order (FO) calculus. In [22,23], fractional order mathematics is utilized to develop a mathematical model for lung cancer and a fractional order controller for anesthesia–hemodynamic stabilization. Furthermore, in [24] the Caputo–Fabrizio fractional derivative is utilized to model the human liver. Most physical systems offer fractance characteristics [25,26], which encourages the usage of FO-based control schemes. Internal Model Control (IMC) has several advantages over classical PID controllers. One advantage of IMC is that it provides better disturbance rejection. This is because the model-based control algorithm can anticipate and compensate for disturbances before they affect the controlled variable. In contrast, PID controllers can only respond to disturbances after affecting the controlled variable. IMC also offers improved setpoint tracking, as the model-based control algorithm can predict the system response to changes in the setpoint and adjust the controller output accordingly. PID controllers, on the other hand, may take longer to adapt to changes in the setpoint and may not be able to predict the system response accurately. Another advantage of IMC is faster response times. Since IMC incorporates a mathematical model of the system being controlled, it can make more accurate predictions about the system response and adjust the controller output accordingly. This can result in faster response times compared to PID controllers, which may take longer to adapt to changes in the system. To utilize the combined benefits of IMC and FO calculus, a maiden attempt has been made to design IMC-FOPI for multi-drug scheduling during chemotherapy in this article. A random walk-based Moth-flame optimization (RW-MFO) is implemented to optimize the control parameters of the proposed IMC-FOPI. The Key contributions of this work are as follows.
  • An IMC-FOPI controller for the control of three drug dosages at the tumor site is proposed. Proportional Integral (PI) and two degrees of freedom PI (2PI) are also designed for comparison purposes.
  • A random walk-based moth flame optimization (RW-MFO) is used to optimize the parameters of the proposed controllers. Its performance is compared with the moth flame optimization (MFO) based on convergence rate.
  • A rigorous performance investigation of IMC-FOPI was carried out for setpoint tracking and disturbance rejection. For each case, the performance is compared with PI and 2PI, respectively.
The subsequent sections are as follows. In Section 2, the multi-drug chemo model is described. The proposed technique, IMC-FOPI control strategy, and the tuning of an optimal controller using RWMFO are discussed in Section 3; the results and discussion are given in Section 4, respectively. Finally, the conclusion of this article is presented in Section 5.

2. Background Review

Multidrug Chemo Model

Over time, mathematical models have been extensively utilized to model tumor responses in cancer chemotherapy, as evidenced by various references [6,7,13,20]. These models are useful for predicting tumor responses, optimizing control parameters, and determining appropriate drug dosages for chemotherapy administration. In this work, we consider a three-drug chemotherapeutic model, which builds upon the two-drug models [7] by adding one more chemo drug, as developed by Tse et al. [20]. Real-time data are collected from oncologists for three drugs: irinotecan, cisplatin, and docetaxel, used in the treatment cycles. The model is based on the principles of Pharmacokinetics, a branch of pharmacology that studies the mathematical behavior of the body in response to drug intake. It involves four processes: absorption, distribution, metabolism, and excretion. The three drugs, X, Y, and Z are considered in this study for cancer treatment. It is assumed that tumor cells can migrate from sensitive to resistive compartments. The tumor is divided into eight disjointed subpopulations [20], which include four categories of cells: (a) cells that are resistant to all three drugs (NXYZ (t)); (b) cells that are resistant to any two drugs, drugs X and Y (NXY(t)), drugs Y and Z (NYZ(t)), and drugs Z and X (NZX(t)); (c) cells which are resistant to any one drug, drug X ((NX(t)), drug Y (NY(t)) and drug Z (NZ(t)); (d) cells which are sensitive to all three drugs, S(t). The probability of sensitive cells attaining resistance to “drug i” spontaneously is de-noted by αi. Multiple mutations lead to the emergence of multiple resistant tumor cells. Figure 1 shows a schematic representation of tumor cell transition. It should be noted that this study assumes that all patients are affected by advanced-stage lung cancer and hence the mutation rate is assumed to be similar for the entire group. However, the mutation rate may vary for other stages of cancer and different types of cancer cells.
In this work, the exponential growth model is considered to represent the change in the tumor cell population, N(t), and it is mathematically represented as,
d N t d t = λ N
where λ is a constant representing the exponential growth of cells and takes a positive value and the same growth rate is shared among the other tumor cells in subpopulations. In the present work, it is assumed that the effect of chemotherapy is instantaneous.
It is presumed that chemotherapeutic drugs are non-cross-resistant since certain forms of drugs exhibit little or no cross-resistance. For the cells already resistant to non-cross-resistant drugs and the cells from sensitive sub-population, the mutation rates to the non-cross-resistant drug are the same. If the drugs are used together, the number of cells killed in each subpopulation is considered equal to the total number of cells killed when each drug is used separately. The ‘ith’ drug is effective against its sensitive populations only if the concentration ( v i ) is above the threshold level ( v t h i ). Only a fraction of cells is killed by the chemotherapeutic drugs that are effective on them and is represented by Ki. The mathematical equations representing the dynamic model of the three-drug system is given below
d S d t = λ 1 α X α Y α Z S k X v X v t h X H v X v t h X S k Y v Y v t h Y H v Y v t h Y S k Z v Z v t h Z H v Z v t h Z S
d N Y d t = λ 1 α X α Z N Y + α Y S k X v X v t h X H v X v t h X + k Z v Z v t h Z H v Z v t h Z N Y
d N Z d t = λ [ ( 1 α X α Y ) N Z + α Z S ] ( k X ( v X v t h X ) H ( v X v t h X ) + k Y ( v Y v t h Y ) H ( v Y v t h Y ) ) N Z
d N X Y d t = λ [ ( 1 α Z ) N X Y + α Y N X + α X N Y ] k Z ( v Z v t h Z ) H ( v Z v t h Z ) N X Y
d N X Z d t = λ [ ( 1 α Y ) N X Z + α Z N X + α X N Z ] k Y ( v Y v t h Y ) H ( v Y v t h Y ) N X Z
d N Y Z d t = λ [ ( 1 α X ) N Y Z + α Y N Z + α Z N Y ] k X ( v X v t h X ) H ( v X v t h X ) N Y Z
d N X Y Z d t = λ α X N Y Z + α Y N X Z + α Z N X Y
where H ( x ) is the Heaviside step function, which is given by:
H s = 1 i f   x > 0 0 o t h e r w i s e
Apart from studying tumor populations, the drug toxicities and drug concentrations are addressed in this work. It is assumed that the drug concentration is exponentially decaying with respect to time.
The rate of change of drug concentration is represented in Equations (10)–(12) [20].
d v X d t = u X γ X v X
d v Y d t = u Y γ Y v Y
d v Z d t = u Z γ Z v Z
where u i represents the drug delivered rate and γ i represents the half-life decay of ith drug. Similarly, the relation between the concentration of drug ( v i ) and cumulative toxicity ( τ i ) of the drug can be mathematically represented as given in Equations (13)–(15). It is to be noted that, the τ i increase with the v i and reduces the metabolism rate of drug i in the patient’s body. It is assumed that the rate of metabolism of ith drug inside the patient’s body is directly proportional to τ i with a constant of proportionality η i . The initial values for various model parameters of the three-drug model are decided by optimizing the chemo model using the memetic optimization algorithm by Tse et al. [20]. All the initial values are given in Appendix A.
d τ X d t = v X η X τ X
d τ Y d t = v Y η Y τ Y
d τ Z d t = v Z η Z τ Z

3. Proposed Technique

3.1. Modeling of Imc-Fopi Controller

An efficient control algorithm is required to maintain the concentration of the drugs at their reference value during the treatment process. A feedback control algorithm based on the IMC-FOPI scheme is proposed to select the amount of drug dose to be infused into the patient’s bloodstream. Figure 2 represents the block diagram for the closed-loop Multidrug scheduling scheme for chemotherapy. It consists of three IMC-FOPI controllers for drugs v x , v y and v z , respectively.
The level of the drug is continuously measured at the tumor site and given as feedback to the controller. The controller will compare it with the prescribed reference value. IMC-FOPI will infuse the drug doses into the patient’s body according to the difference between reference and measured drug concentration. Design and implementation of IMC-FOPI require an internal transfer function model which maps an input drug dose to the output drug concentration. In this work, three fractional-order models are derived using the impulse response invariant method [5] to map the drug concentration CA, CB, and CC, to drug doses uA, uB, and uC, respectively. The basic schematic representation of the IMC-FOPI controller is shown in Figure 3.
The output for Figure 3 can be written as follows:
Y s = C F O I M C s G s 1 + G s G F O m s R s ± 1 C F O I M C s G s 1 + C F O I M C s G s G F O m s D s
The relationship between CFOIMC (s) and CIMC-FOPI (s) can be represented by
C I M C F O P I s = C F O I M C s 1 C F O I M C s G F O m s
After combining Equations (16) and (17) the output Y(s) can be rewritten as follows,
Y s = C I M C F O P I s G s 1 + C I M C F O P I s G s R s ± 1 1 + C I M C F O P I s G s D s
where, GFOm (s) is the fractional order transfer function model, CFOIMC (s) is fractional order IMC, CIMC-FOPI (s) is fractional order IMC-PI, G(s) is the actual plant model, R(s) is reference input, and D(s) is a disturbance.
The steps involved in the design and implementation of IMC-FOPI are as follows [27]
1-
Estimation of open loop fractional order transfer function model GFOm (s) to map the drug concentration to drug doses.
G F O m s = K τ s μ + 1
2-
Factorize the GFOm (s) in minimum and non-minimum phase parts
G F O m s = G F O m + s × G F O m s
where, G F O m s = K τ s μ + 1 is the non-minimum phase part and G F O m + s = 1 is the minimum phase part.
3-
Using G F O m s , the fractional order IMC controller can be designed as follows
C F O I M C = 1 G F O m s L s
L s = 1 1 + ρ s γ
where L(s) is the filter with coefficient ρ γ is the power that can be chosen such that F(s) is realizable. Substitute γ = 1 in Equation (22) and combine it with Equation (21), which yields
C F O I M C = τ s μ + 1 K × 1 1 + ρ s
4-
Estimate CIMC-FOPI (s) by substituting CFOIMC (s) in Equation (17). Organize the RHS in such a way that it will transform into the conventional fractional-order PI with the preceding filter.
C I M C F O P I = 1 s 1 μ τ K ρ 1 + 1 τ s μ
The fractional order integral is implemented using the “Oustaloup approximation” method. This approach employs the 2M + 1 order filter inside the defined frequency band [αL, αH,]. The fractional-order transfer function of power μ is expressed by Equation (25) [28,29,30].
s μ = G k = M M s + α z k s + α p k
Here, G is the gain, αz,k and αp,k are the respective zero and pole frequencies (Equations (26) and (27)).
α z k = α L α H α L k + M + 1 2 1 μ 2 M + 1
α p k = α L α H α L k + M + 1 2 1 + μ 2 M + 1
For the design and implementation of IMC-FOPI, a FO transfer function that gives the relationship between drug concentration and doses, respectively, needs to be estimated. This rigorous experimentation is performed to evaluate the approximated FO model for all the drug concentrations, as shown in Figure 4.
The FO transfer function model for drug concentrations vX, vY, and vZ are given by (28)–(30).
v x = 3.15 2.99 s 0.977 + 1
v y = 3.73 3.72 s 0.988 + 1
v z = 4.01 3.84 s 0.994 + 1
In controller design, accessing the system’s stability is an important attribute. The frequency response of the three FO transfer functions represented in (28)–(30) is shown in Figure 5. The phase margins for FO models are 109, 107, and 104, respectively, which indicates that the system is stable.
The IMC-FOPI using the FO models can be formulated as follows:
C I M C F O P I x = 1 s 1 0.977 3.15 2.99 ρ 1 1 + 1 2.99 s 0.977
C I M C F O P I Y = 1 s 1 0.988 3.73 3.72 ρ 2 1 + 1 3.72 s 0.988
C I M C F O P I Z = 1 s 1 0.994 4.01 3.84 ρ 3 1 + 1 3.84 s 0.994
where ρ1, ρ2 and ρ3 are filter coefficients for IMC-FOPI. The overall performance of closed-loop drug scheduling depends on the optimal values of these filter coefficients. So, an RW-MFO algorithm is utilized to estimate the magnitude of these design parameters. The description of the RW-MFO algorithm is given in the subsequent section.

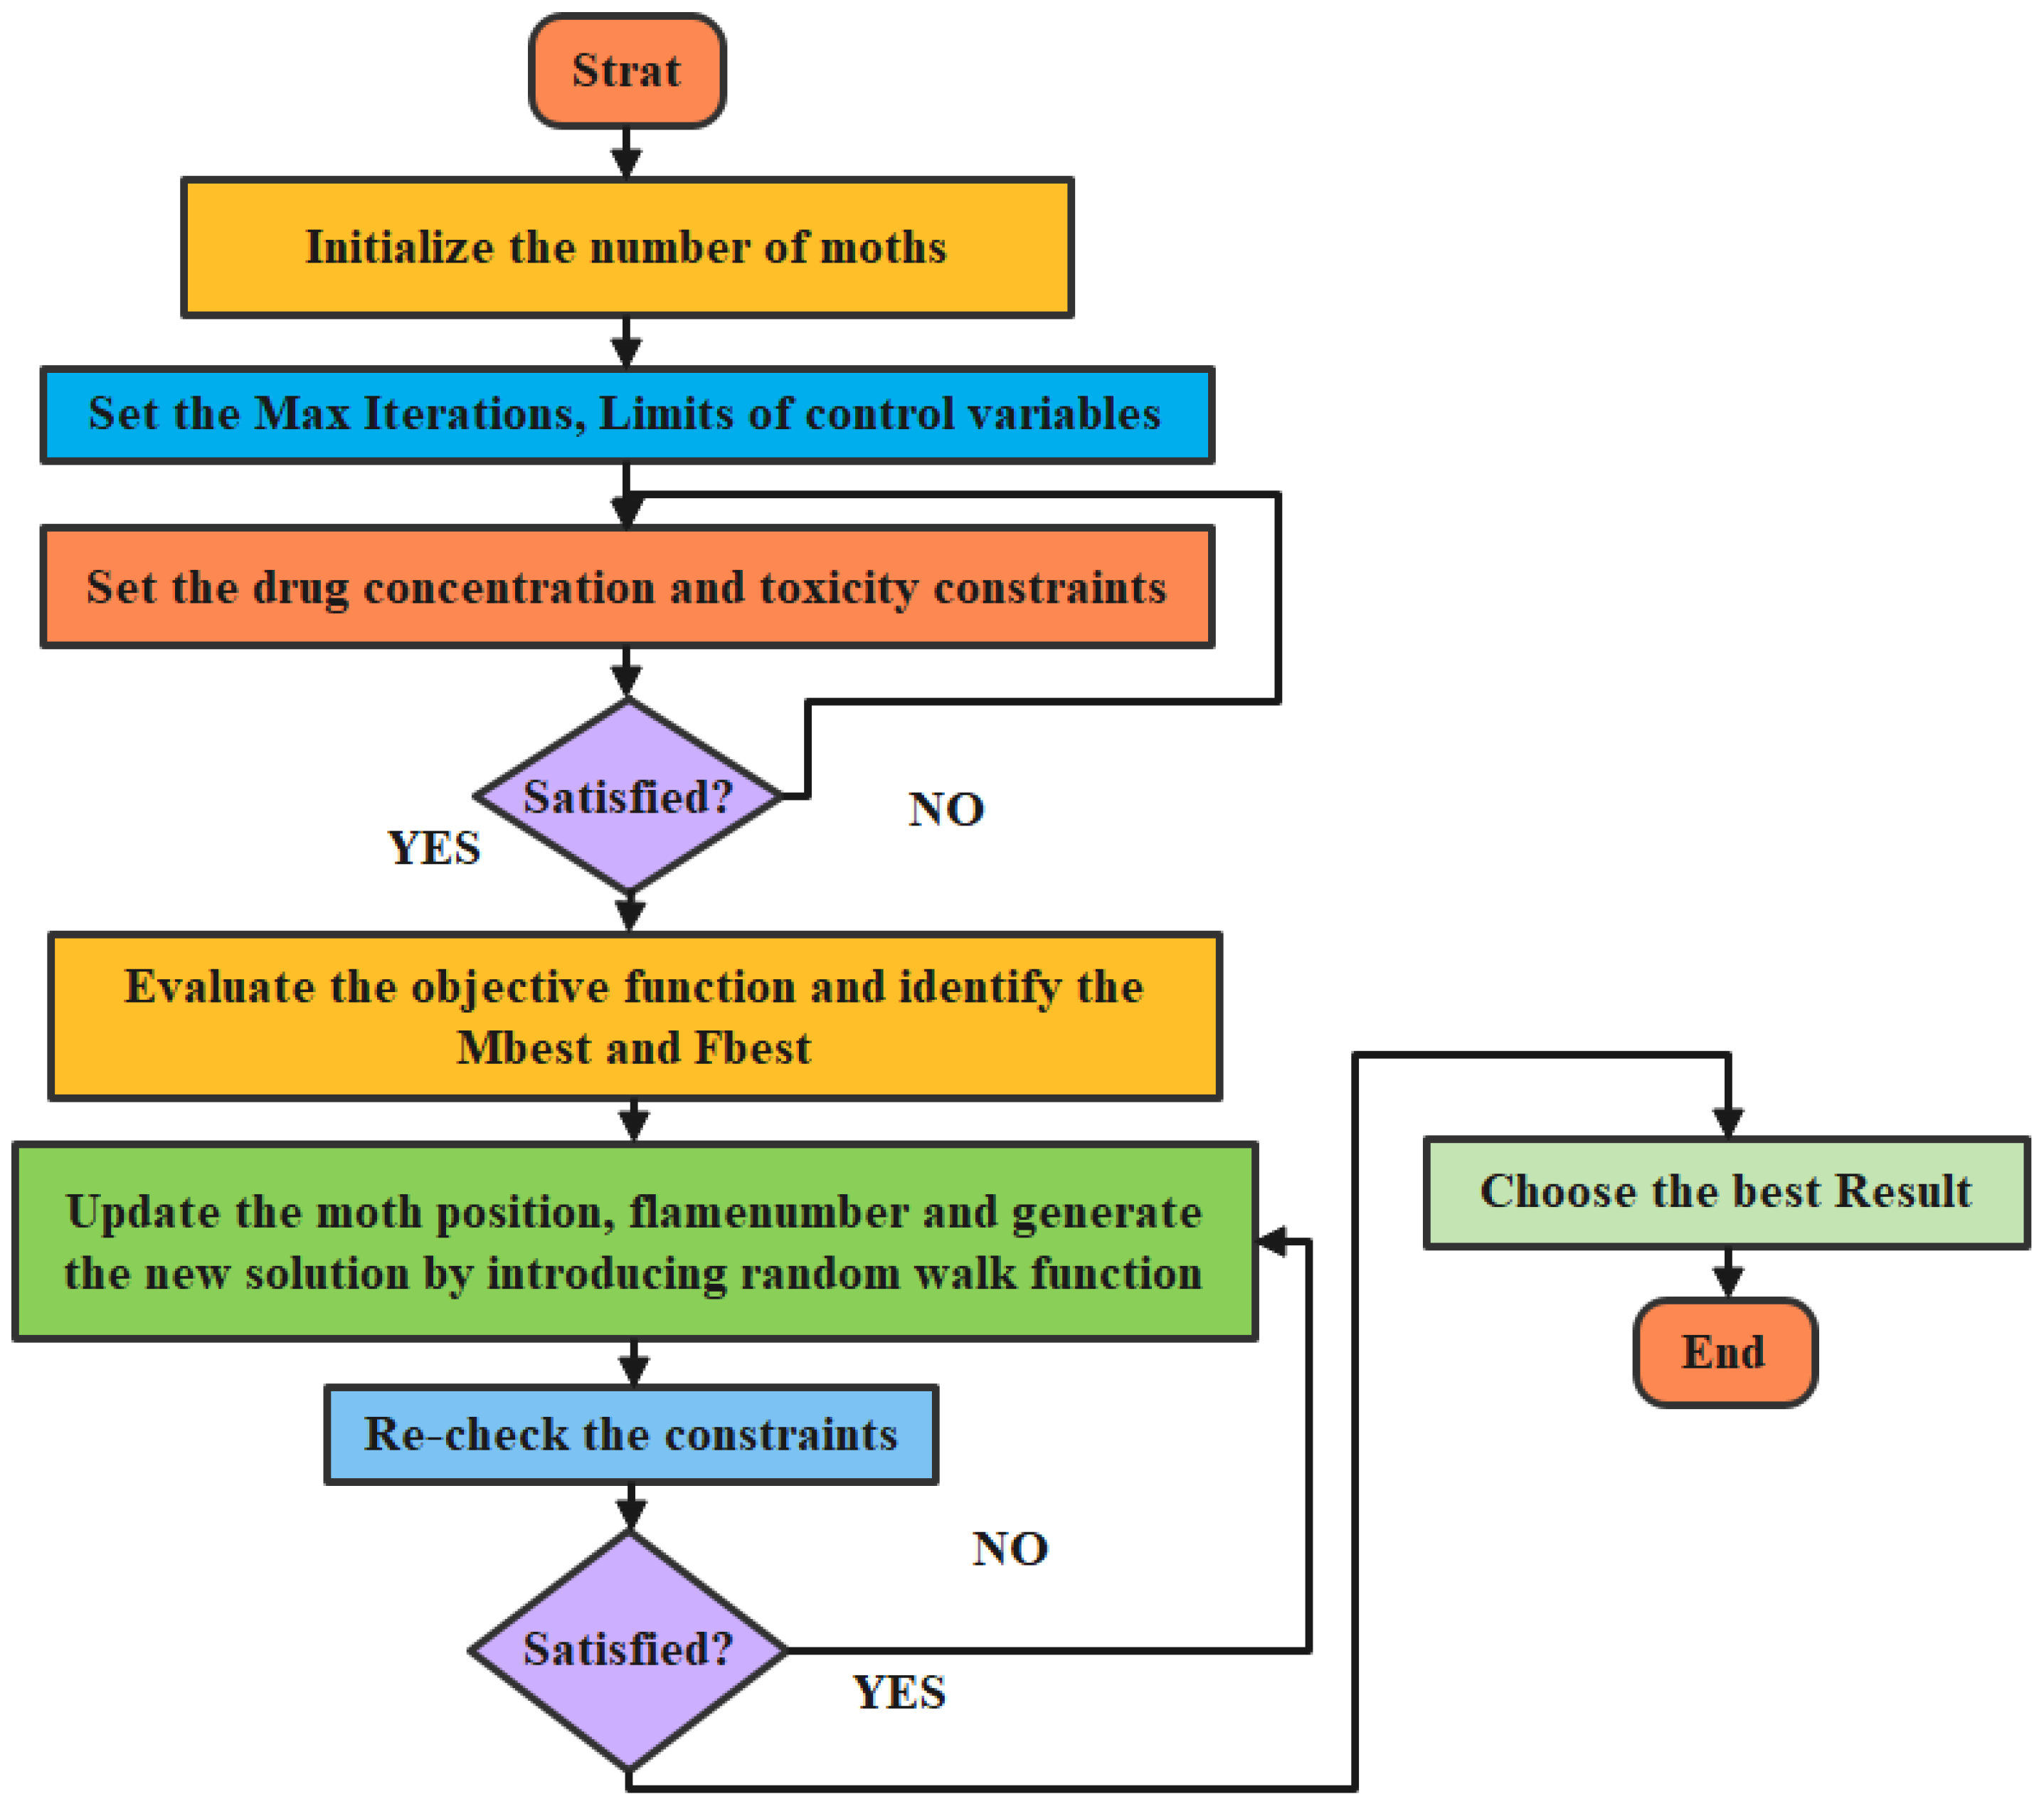
3.2. Random Walk Moth Flame Optimization (Rw-Mfo)

RW-MFO is an improved version of MFO optimization that utilizes the random walk theory with existing MFO. It enhances the ability of MFO in each search space to find the optimal solution. The details of conventional MFO and proposed RW-MFO are discussed in the next subsection.

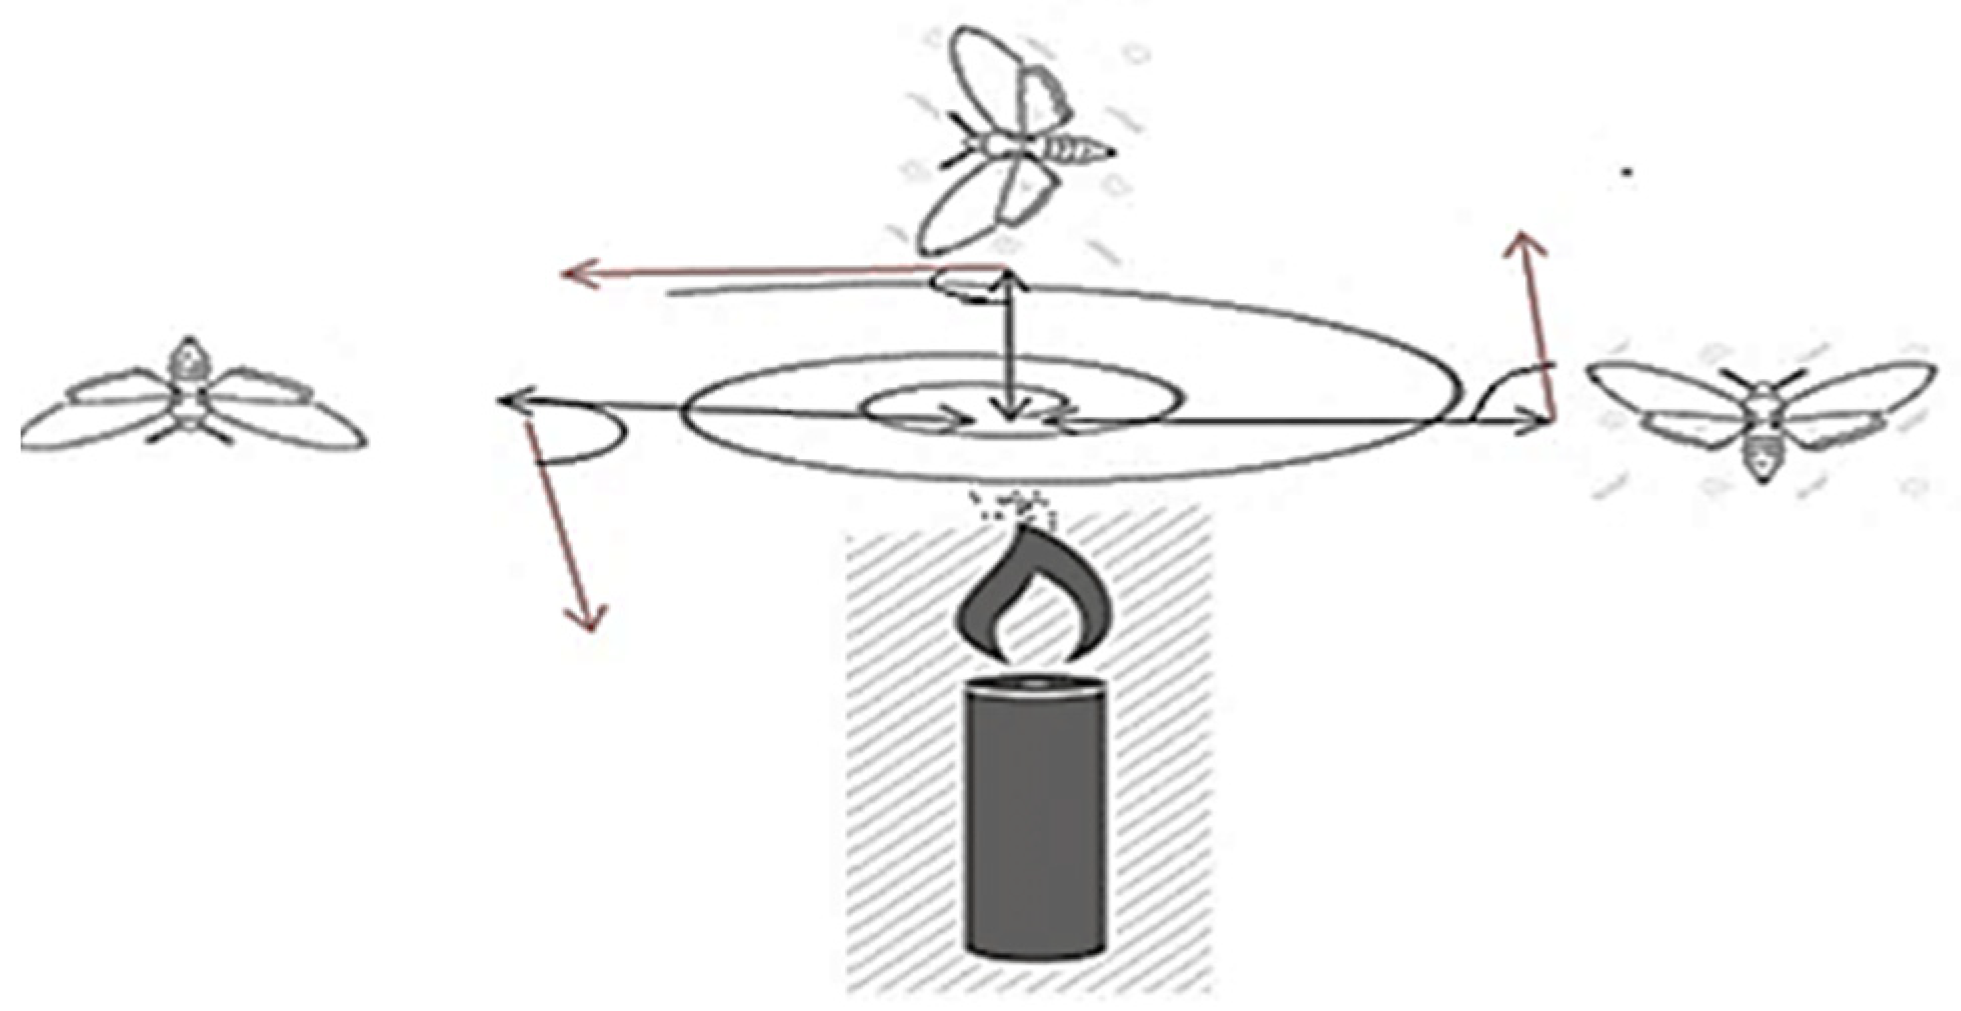
3.2.1. Conventional MFO

MFO optimization proposed by Seyedali Mirjalili [31] combines population and local search-based techniques. MFO is simple in implementation and mimics the swarming behavior of moths. They have a unique feature called transverse orientation, which helps them in navigation. They move along a straight line around the moon for long distances. The unique feature is effective only for long distances. In general, moths revolve around man-made light in a spiral path with the same angle which is represented in Figure 6. The considered behavior is mathematically formulated as an optimization technique for problem-solving. The moth’s position is updated using a logarithmic spiral around the flame, which improves exploration and exploitation in this optimization.
The three stages of MFO optimization are described as follows.
1-
Generate the initial population of moths X = X 1 , X 2 , . . . X N T
2-
Two matrices corresponding to moths and flame positions are represented by:
M = m 1,1 m 1,2 m 1 , v m 2,1 m 2,2 m 2 , v m p , 1 m p , 2 m p , v
F = F 1,1 F 1,2 F 1 , v F 2,1 F 2,2 F 2 , v F p , 1 F p , 2 F p , v
3-
The fitness values of moths and flames are stored as an array.
F M = F M 1 F M 2 F M n &   F F = F F 1 F F 2 F F n
4-
The logarithmic spiral is implemented using the following equation.
M i = S ( M i , F j ) = D i · e b t . cos ( 2 π t ) + F j
where, D i = F j M i is the distance between moth and flame:
5-
The position of the flame is updated as follows.
F N = r o u n d N l N 1 T
where l, N and T are the current iterations, max flames, and max. Iterations, respectively.
6-
Update the position of the moth as per step 4.

3.2.2. Random Walk-MFO

To improve the local exploitation behavior of MFO, a random walk concept has been introduced in this optimization [32]. This random walk is modeled using the equation,
X t + 1 = X t + r n d d × X t
where
r n d d = 0.01 × r 1 × σ r 2 1 β
r 1 and r 2 are the random numbers in [0, 1] and σ is given by:
σ = Γ ( 1 + β ) × sin ( π β 2 ) Γ 1 + β 2 × β × 2 β 1 2 1 β
where Γ is the gamma function and β is the random walk index. This RW-MFO helps in exploring the search efficiently and makes it better to come out of local optima. The flowchart of the proposed RW-MFO is shown in Figure 7.

3.3. Objective Function and Constraints

Closed-loop chemotherapy drug scheduling aims to minimize the number of cancer cells in the human body with minimum toxicity [33]. An optimal design of closed-loop control parameters is required to achieve the objective. So, the objective function is formulated as given below.
O = S t f + l N l t f + l , m N l m t f + l , m , n N l m n t f
where l , m , n X , Y , Z .
The chosen drugs reduce the cancer cells during chemotherapy and produce adverse effects on the other body parts if the concentration levels are not correctly selected. So, a set of constraints are imposed in the model to maintain appropriate levels of drugs during treatment.
v l 50 τ l 100 l X , Y , Z

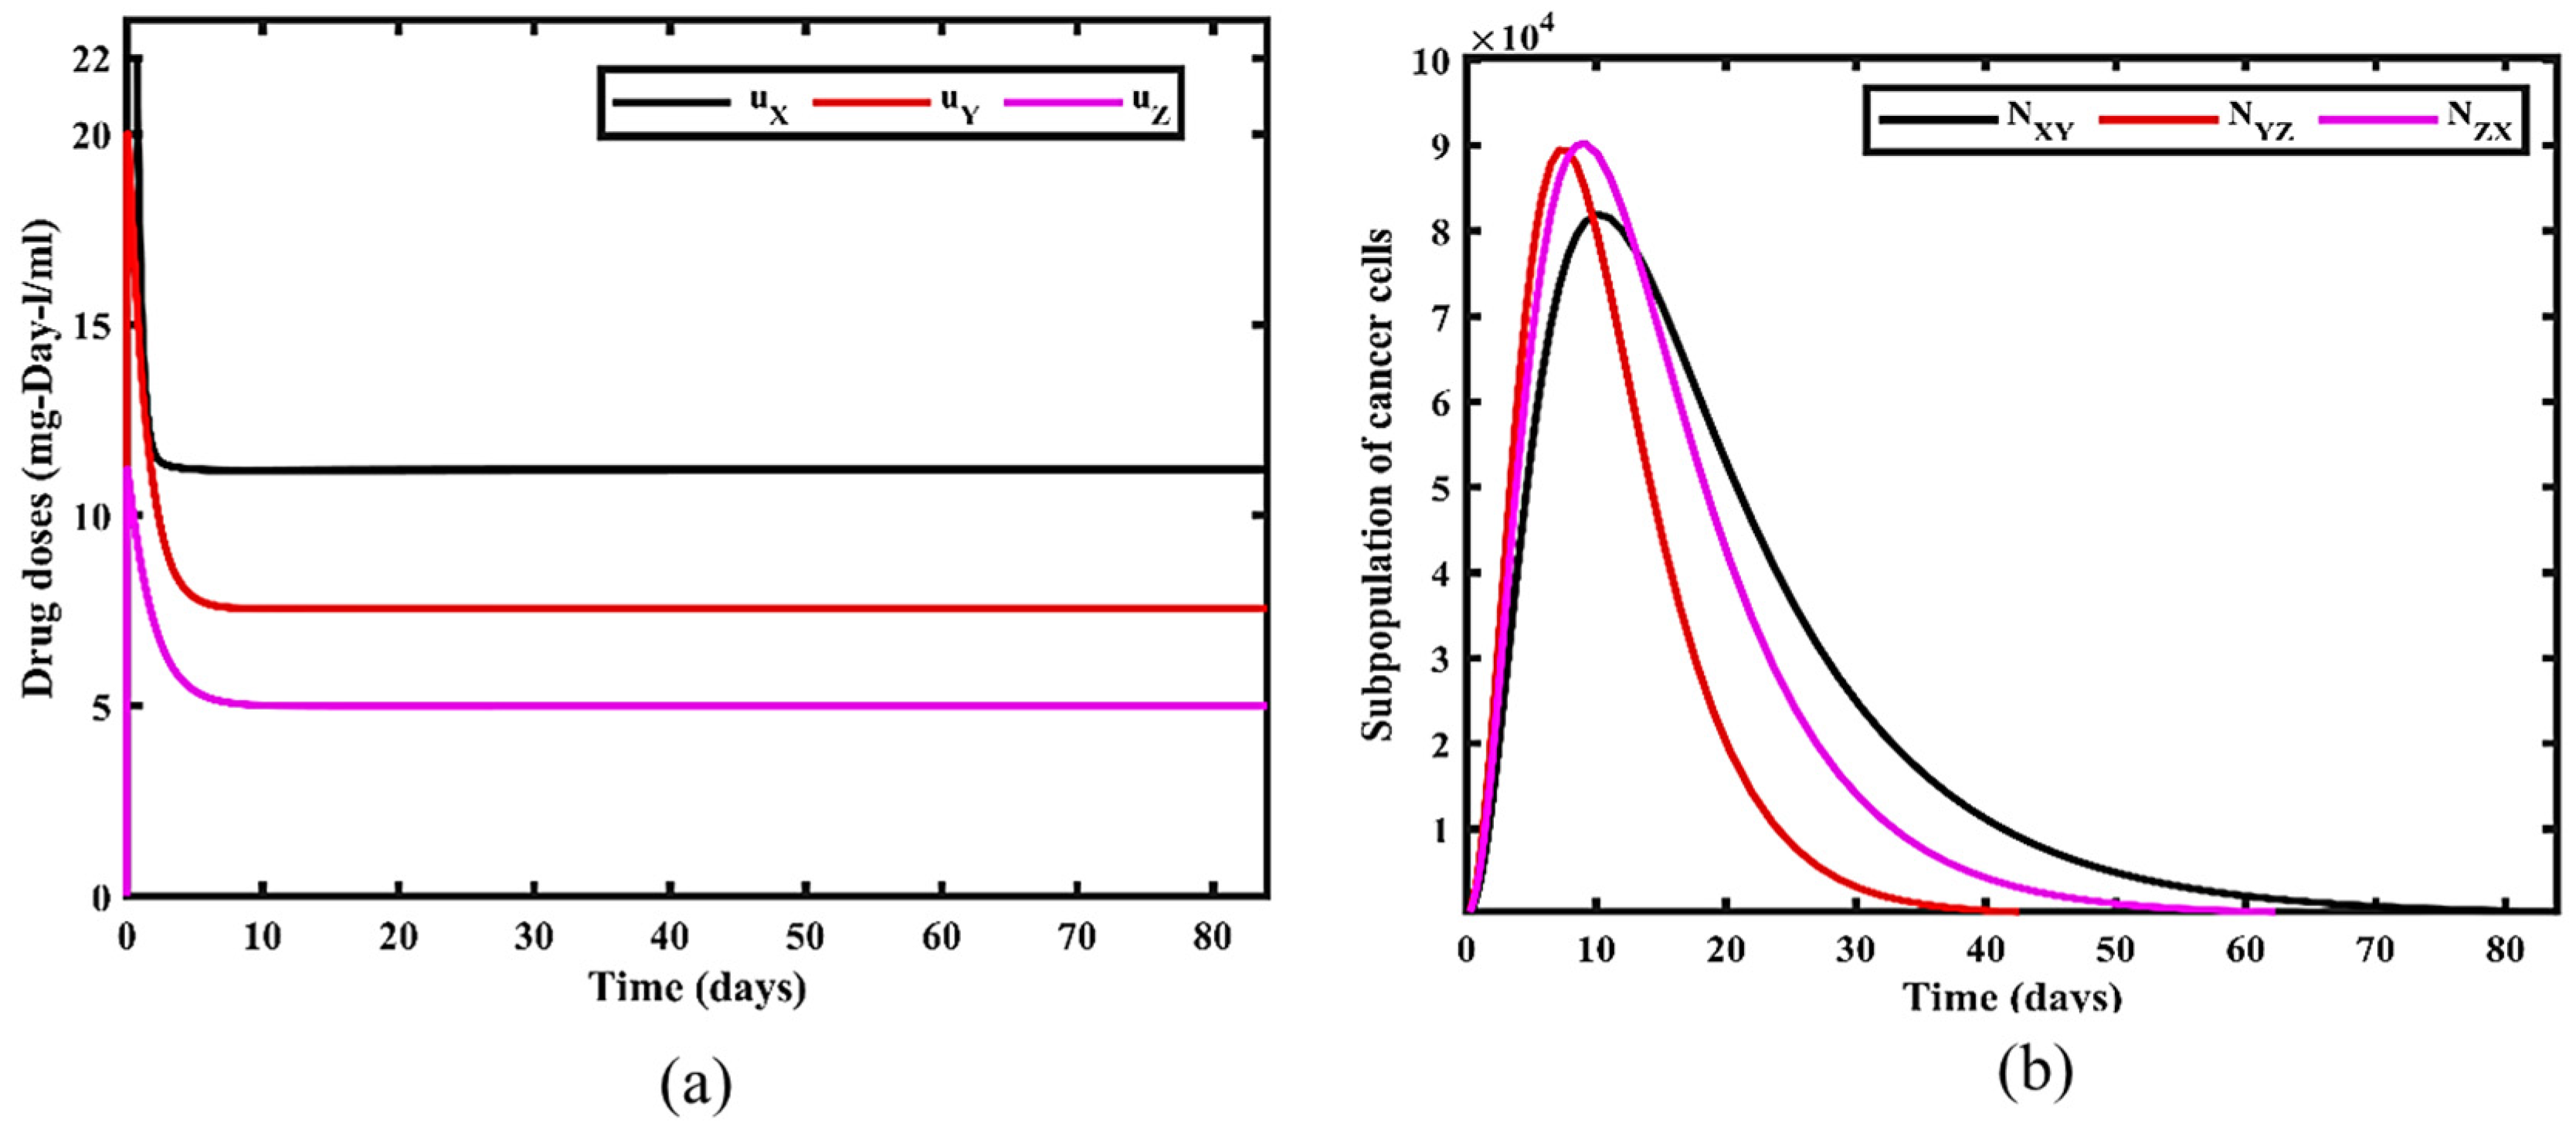
4. Results and Discussion

An IMC-FOPI controller for MDC is implemented to maintain the concentration of drugs at their prescribed level. An oustaloup filter approximation method is used to design the fractional order controller with a frequency limit between [10−3 and 103] rad/s. The MDC minimizes tumors and can produce adverse effects on the human body if the drug concentration is not appropriately chosen. So, it is essential to maintain the concentration of drugs and associated toxicities within acceptable limits throughout the treatment process. Thus, an optimal selection of control parameters is necessary to achieve the desired objective. The control parameters of the proposed controller are tuned using the RW-MFO algorithm, as shown in Figure 8.
In Figure 9, the convergence curve of MFO and RW-MFO are presented. It is observed that the performance of conventional MFO is improved after implementing random walk in the algorithm. MFO takes 600 function evaluations, whereas RW-MFO converges in 400 evaluations itself. Table 1 shows the analytical comparison of MFO and RW-MFO based on fitness value. It can be seen the fitness value of RW-MFO is 28, whereas, for MFO, it is 101. Hence it can be inferred that RW-MFO is appropriate for tuning the proposed control scheme.
In the preliminary phase of the treatment, the error between the desired and measured drug concentrations is the maximum. As the treatment progresses, the error between desired and measured drug concentrations minimizes to zero. For effective anticancer therapy, the concentration of multi-drug must be maintained at the specified level. It is accomplished by utilizing the pre-set nature of the signal, defined as step input for the entire treatment period. As an illustration, the value of drug concentration should be taken between 10 to 50 mg/mL. Therefore, concentrations for vX = 35 mg/mL, vY = 28 mg/mL, and vZ = 20 mg/mL are chosen, respectively [22]. The performance comparison of IMC-FOPI with PI and 2PI for all the drug concentrations is shown in Figure 10.
From Figure 10a, it is perceived that the drug concentration for all the designed controllers increases gradually and finally settles to the desired level. However, IMC-FOPI takes less time to reach the reference concentration compared to PI and 2PI. It shows the efficacy of the proposed fractional order controller over integer order. A similar performance of IMC-FOPI is observed for drug concentration control of vY and vZ in Figure 10b,c. Table 2 shows the comparison of all the controllers based on overshoot, settling time, and rise time for all the drugs. It is observed that for vX concentration, IMC-FOPI takes 10.66 days to settle down at reference value with an overshoot of 0% in comparison to PI and 2PI. A similar performance of IMC-FOPI is seen for Drug Concentration vY and vZ control at the Tumor site. It shows the effective dynamic and steady-state performance of IMC-FOPI in the case of multi-drug scheduling.
The primary intent of the chemotherapeutic drug is to kill the cancer cell as much as possible with tolerable toxicity. There is a direct relationship between toxicity and the decrease in cancer cells. This toxic nature of the drugs impacts the patient’s physiological condition adversely. So, it is also essential to check the toxic effect of the drugs within tolerable limits. Figure 11 and Figure 12 show the variation in the toxicity levels and reduction in the number of cancer cells w.r.t multi drugs for all the design controllers.
The cancer cell population starts reducing from its initial value of 4.605 × 10¹¹ to their respective minimum values for all designed controllers. For IMC-FOPI, the remaining cancer cells are 28, which is less than PI (1165) and 2PI (1129). It can be perceived that IMC-FOPI can control the drug concentration of all the controllers optimally compared to PI and 2PI. The variation in the drug doses and corresponding subpopulation of cancer cells for IMC-FOPI are shown in Figure 13a,b. In the initial phase of treatment, the drug dose increases gradually to its maximum value and then settles down to a minimum value for all the drugs, as shown in Figure 13a. Whenever the drugs are used together, the cell destroyed inside each population is considered to be proportionate to the number of cells destroyed while every drug is used separately. For example, drug VZ will kill the cancer cell subpopulation NXY as these cells have resistance towards the drug VX and VY, respectively. The patient’s physiological condition will change during treatment and varies from patient to patient. In most of the analyses, these physiological conditions are assumed to be constant while designing the controller. This work performs robustness analysis by considering the changes in model parameters ranging from ±5% to ±50%. The calculated Integral Absolute Error (IAE) for each drug concentration is given in Table 3. IAE is almost like parametric uncertainty compared to the base case. It indicates the stable performance of the proposed controller.

5. Conclusions

Single-drug based chemotherapy is one of the widely used techniques for cancer treatment. In this method, due to continuous usage of a single drug at regular intervals; the patient’s body develops resistance toward the drug. Therefore, clinicians migrate towards MDC-based treatment. A compromise between drug concentration and toxicity is maintained for effective treatment with fewer side effects. In this paper, an IMC-FOPI controller for closed-loop multi-drug scheduling is proposed. This scheme utilizes the advantages of fractional PI as well as IMC controllers. The design parameters of the IMC-FOPI controller are optimized using the RW-MFO technique. The proposed method effectively determines the suitable drug concentrations at every interval without violating the constraints. The efficacy of the proposed controller is compared with the PI and 2PI controllers in reducing the number of cancer cells. A robustness analysis by varying model parameters in the range of ±5% to ±50% is performed. Results indicate that the variation in IAE is minimal in the entire deviation range. It shows the stable performance of the proposed IMC-FOPI controller in multi-drug scheduling for cancer treatment. In the future, the setpoint for all the drug doses will be optimized along with controller parameters.

Author Contributions

Conceptualization, N.P., V.S., M.P.K., R.A. and H.A.A.; Data curation, N.P., V.S., M.P.K., R.A. and H.A.A.; Formal analysis, N.P., V.S., M.P.K., R.A. and H.A.A.; Funding acquisition, N.P., V.S., M.P.K., R.A. and H.A.A.; Investigation, N.P., V.S., M.P.K., R.A. and H.A.A.; Methodology, N.P., V.S., M.P.K., R.A. and H.A.A.; Project administration, N.P., V.S., M.P.K., R.A. and H.A.A.; Resources N.P., V.S., M.P.K., R.A. and H.A.A.; Software, N.P., V.S., M.P.K., R.A. and H.A.A.; Supervision, N.P., V.S., M.P.K., R.A. and H.A.A.; Validation N.P., V.S., M.P.K., R.A. and H.A.A.; Visualization, N.P., V.S., M.P.K., R.A. and H.A.A.; Writing—original draft, N.P., V.S., M.P.K., R.A. and H.A.A.; Writing—review and editing, N.P., V.S., M.P.K., R.A. and H.A.A. All authors have read and agreed to the published version of the manuscript.

Funding

This research was funded by Princess Nourah bint Abdulrahman University Researchers Supporting Project number (PNURSP2023R323), Princess Nourah bint Abdulrahman University, Riyadh, Saudi Arabia.

Data Availability Statement

Not applicable.

Acknowledgments

The authors express their gratitude to Princess Nourah bint Abdulrahman University Researchers Supporting Project number (PNURSP2023R323), Princess Nourah bint Abdulrahman University, Riyadh, Saudi Arabia.

Conflicts of Interest

The authors declare no conflict of interest.

Appendix A

ParametersDescriptionInitial Values
ηXConstant related to metabolic rate of drug X0.4 day−1
ηYConstant related to metabolic rate of drug Y0.5 day−1
ηZConstant related to metabolic rate of drug Z0.45 day−1
αXMutation rate from sensitive subpopulation to resistant subpopulation of drug X0.008
αYMutation rate from sensitive subpopulation to resistant subpopulation of drug Y0.01
αZMutation rate from sensitive subpopulation to resistant subpopulation of drug Z0.014
γXDecay constant of drug X0.32 day−1
γYDecay constant of drug Y0.27 day−1
γZDecay constant of drug Z0.25 day−1
λConstant related to growth rate0.0099 day−1
STotal sensitive population4.60517 × 1011
kXProportion of cells killed by drug X per unit time per drug concentration0.0084 day−2 D−1
kYProportion of cells killed by drug Y per unit time per drug concentration0.0074 day−2 D−1
kZProportion of cells killed by drug Z per unit time per drug concentration0.0092 day−2 D−1
νthXThreshold concentration of drug X to be effective10 day D
νthYThreshold concentration of drug Y to be effective10 day D
νthZThreshold concentration of drug Z to be effective10 day D
νXConcentration of the drug X in the cancer site ---
νYConcentration of the drug Y in the cancer site---
νZConcentration of the drug Z in the cancer site---
τXToxicity dues to drug X in the body---
τYToxicity dues to drug Y in the body---
τZToxicity dues to drug Z in the body---
uXDelivery rate of drug X---
uYDelivery rate of drug Y---
uZDelivery rate of drug Z---
NXSubpopulation resistant to drug X0
NYSubpopulation resistant to drug Y0
NZSubpopulation resistant to drug Z0
NXYSubpopulation resistant to drug X and Y0
NYZSubpopulation resistant to drug Y and Z0
NZXSubpopulation resistant to drug Z and X0
NXYZSubpopulation resistant to drug X, Y, and Z0

References

  1. Bailar, J.C.; Gornik, H.L. Cancer undefeated. N. Engl. J. Med. 1997, 336, 1569–1574. [Google Scholar] [CrossRef]
  2. Brant, J.M.; Conde, F.; Saria, M. Core Curriculum for Oncology Nursing-E-Book; Elsevier Health Sciences: Amsterdam, The Netherlands, 2015. [Google Scholar]
  3. Cancer Statistics. 2020. Available online: https://www.ncdirindia.org/All_Reports/Report_2020/PB/Press_release.pdf (accessed on 24 February 2023).
  4. Sudhakar, A. History of cancer, ancient and modern treatment methods. J. Cancer Sci. Ther. 2009, 1, 1–7. [Google Scholar] [CrossRef]
  5. Pachauri, N.; Yadav, J.; Rani, A.; Singh, V. Modified fractional order IMC design-based drug scheduling for cancer treatment. Comput. Biol. Med. 2019, 109, 121–137. [Google Scholar] [CrossRef] [PubMed]
  6. Ghita, M.; Billiet, C.; Copot, D.; Verellen, D.; Ionescu, C.M. Model Calibration of Pharmacokinetic-Pharmacodynamic Lung Tumour Dynamics for Anticancer Therapies. J. Clin. Med. 2022, 11, 1006. [Google Scholar] [CrossRef] [PubMed]
  7. Martin, R.B. Optimal Control of Drug Administration in Cancer Chemotherapy. Ph.D. Thesis, School of Computer & Information Sciences, University of Western Australia, Perth, Australia, 1991. [Google Scholar]
  8. Martin, R.B. Optimal control drug scheduling of cancer chemotherapy. Automatica 1992, 28, 1113–1123. [Google Scholar] [CrossRef]
  9. Bojkov, B.; Hansel, R.; Luus, R. Application of direct search optimization to optimal control problems. Hung. J. Ind. Chem. 1993, 21, 177–185. [Google Scholar]
  10. Tan, K.C.; Khor, E.F.; Cai, J.; Heng, C.M.; Lee, T.H. Automating the drug scheduling of cancer chemotherapy via: Evolutionary computation. Artif. Intell. Med. 2002, 1, 908–913. [Google Scholar]
  11. Liang, Y.; Leung, K.S.; Mok, T.S.K. A novel evolutionary drug scheduling model in cancer chemotherapy. IEEE Trans. Inf. Technol. Biomed. 2006, 10, 237–245. [Google Scholar] [CrossRef]
  12. Liang, Y.; Leung, K.S.; Mok, T.S.K. Evolutionary drug scheduling models with different toxicity metabolism in cancer chemotherapy. Appl. Soft Comput. 2008, 8, 140–149. [Google Scholar] [CrossRef]
  13. Algoul, S.; Alam, M.S.; Hossain, M.A.; Majumder, M.A.A. Majumder. Multi-objective optimal chemotherapy control model for cancer treatment. Med. Biol. Eng. Comput. 2011, 49, 51–65. [Google Scholar] [CrossRef]
  14. Moradi, H.; Vossoughi, G.; Salarieh, H. Optimal robust control of drug delivery in cancer chemotherapy: A comparison between three control approaches. Comput. Biol. Med. 2013, 112, 69–82. [Google Scholar] [CrossRef] [PubMed]
  15. Kovács, L.; Szeles, A.; Sápi, J.; Drexler, D.A.; Rudas, I.; Harmati, I.; Sápi, Z. Model-based angiogenic inhibition of tumor growth using modern robust control method. Comput. Methods Programs Biomed. 2014, 114, 98–110. [Google Scholar] [CrossRef]
  16. Khadraoui, S.; Harrou, F.; Nounou, H.N.; Nounou, M.N.; Datta, A.; Bhattacharyya, S.P. A measurement-based control design approach for efficient cancer chemotherapy. Inf. Sci. 2016, 333, 108–125. [Google Scholar] [CrossRef]
  17. Qaiser, H.; Ahmad, I.; Kashif, M. Fuzzy, synergetic and nonlinear state feedback control of chemotherapy drug for a cancerous tumor. Biomed. Signal Process. Control. 2020, 62, 102061. [Google Scholar] [CrossRef]
  18. Karar, M.E.; El-Garawany, A.H.; El-Brawany, M. Optimal adaptive intuitionistic fuzzy logic control of anticancer drug delivery systems. Biomed. Signal Process. Control. 2020, 58, 101861. [Google Scholar] [CrossRef]
  19. Shindi, O.; Kanesan, J.; Kendall, G.; Ramanathan, A. The combined effect of optimal control and swarm intelligence on optimization of cancer chemotherapy. Comput. Methods Programs Biomed. 2020, 189, 105327. [Google Scholar] [CrossRef]
  20. Tse, S.M.; Liang, Y.; Leung, K.S.; Lee, K.H.; Mok, T.S.K. A memetic algorithm for multiple-drug cancer chemotherapy scheduling optimization, IEEE Trans. Syst. Man Cybern. 2007, 37, 84–91. [Google Scholar] [CrossRef]
  21. Alam, M.S.; Hossain, M.A.; Algoul, S.; Majumader, M.A.A.; Al-Mamun, M.A.; Sexton, G.; Phillips, R. Multi-objective multi-drug scheduling schemes for cell cycle specific cancer treatment. Comput. Chem. Eng. 2013, 58, 14–32. [Google Scholar] [CrossRef]
  22. Ghita, M.; Copot, D.; Ionescu, C.M. Lung cancer dynamics using fractional order impedance modeling on a mimicked lung tumor setup. J. Adv. Res. 2021, 32, 61–71. [Google Scholar] [CrossRef] [PubMed]
  23. Hegedus, E.T.; Birs, I.R.; Ghita, M.; Muresan, C.I. Fractional-Order Control Strategy for Anesthesia–Hemodynamic Stabilization in Patients Undergoing Surgical Procedures. Fractal Fract. 2022, 6, 614. [Google Scholar] [CrossRef]
  24. Baleanu, D.; Jajarmi, A.; Mohammadi, H.; Rezapour, S. A new study on the mathematical modelling of human liver with Caputo–Fabrizio fractional derivative. Chaos Solitons Fractals 2020, 134, 109705. [Google Scholar] [CrossRef]
  25. Jajarmi, A.; Baleanu, D.; Sajjadi, S.S.; Nieto, J.J. Analysis and some applications of a regularized Ψ–Hilfer fractional derivative. J. Comput. Appl. Math. 2022, 415, 114476. [Google Scholar] [CrossRef]
  26. Suresh, V.; Pachauri, N.; Vigneysh, T. Decentralized control strategy for fuel cell/PV/BESS based microgrid using modified fractional order PI controller. Int. J. Hydrogen Energy 2021, 46, 4417–4436. [Google Scholar] [CrossRef]
  27. Iskakova, K.; Alam, M.M.; Ahmad, S.; Saifullah, S.; Akgül, A.; Yılmaz, G. Dynamical study of a novel 4D hyperchaotic system: An integer and fractional order analysis. Math. Comput. Simul. 2023, 208, 219–245. [Google Scholar] [CrossRef]
  28. Arshad, S.; Saleem, I.; Akgül, A.; Huang, J.; Tang, Y.; Eldin, S.M. A novel numerical method for solving the Caputo-Fabrizio fractional differential equation. AIMS Math. 2023, 8, 9535–9556. [Google Scholar] [CrossRef]
  29. Bequette, B.W. Process Control: Modeling, Design, and Simulation; Prentice Hall Professional: Hoboken, NJ, USA, 2003. [Google Scholar]
  30. Baranowski, J.; Bauer, W.; Zagórowska, M.; Dziwiński, T.; Piątek, P. Time-domain oustaloup approximation. In Proceedings of the 2015 20th International Conference on Methods and Models in Automation and Robotics (MMAR), Miedzyzdroje, Poland, 24–27 August 2015; pp. 116–120. [Google Scholar]
  31. Mirjalili, S. Moth-flame optimization algorithm: A novel nature-inspired heuristic paradigm. Knowl.-Based Syst. 2015, 89, 228–249. [Google Scholar] [CrossRef]
  32. Suresh, V.; Sreejith, S.; Sudabattula, S.K.; Cherukuri, S.H.C.; Prabaharan, N.; Siano, P.; Alhelou, H.H. Stochastic economic dispatch incorporating commercial electric vehicles and fluctuating energy sources. IEEE Access 2020, 8, 216332–216348. [Google Scholar] [CrossRef]
  33. Deshpande, N.M.; Gite, S.S.; Aluvalu, R. Microscopic Analysis of Blood Cells for Disease Detection: A Review. Track. Prev. Dis. Artif. Intell. 2022, 125–151. [Google Scholar] [CrossRef]
Figure 1. Tumor cell Transition.
Mathematics 11 01779 g001
Figure 2. Block diagram for IMC-FOPI based closed loop multi-drug scheduling strategy.
Mathematics 11 01779 g002
Figure 3. Schematic representation of IMC-FOPI controller.
Mathematics 11 01779 g003
Figure 4. The approximated fractional order (FO) transfer function model for three drug concentrations vx, vy, and vz.
Mathematics 11 01779 g004
Figure 5. Frequency domain analysis of FO models using Bode Plots.
Mathematics 11 01779 g005aMathematics 11 01779 g005b
Figure 6. Spiral path followed by moths around the light.
Mathematics 11 01779 g006
Figure 7. Flow chart of RW-MFO.
Mathematics 11 01779 g007
Figure 8. Block diagram of RW-MFO tuned IMF-FOPI.
Mathematics 11 01779 g008
Figure 9. Comparison of convergence curves for RW-MFO tuned IMCFOPI.
Mathematics 11 01779 g009
Figure 10. Performance comparison of IMC-FOPI with PI and 2PI for (a) VX (b) VY (c) VZ.
Mathematics 11 01779 g010
Figure 11. Variation in Toxicities for all designed controller (a) τX (b) τY (c) τZ.
Mathematics 11 01779 g011
Figure 12. Reduction in number of cancer cells.
Mathematics 11 01779 g012
Figure 13. (a) Variation in the drug doses. (b) Variation in the subpopulation of cancer cells.
Mathematics 11 01779 g013
Table 1. Comparison of fitness values of MFO and RW-MFO.
Methodρ1ρ2ρ3Fitness Value
MFO0.4821.2531.784101
RW-MFO0.3081.3111.65328
Table 2. Performance comparison of all the design control based on time repose parameters.
Concentration vX
Controllers%OvershootSettling Time
(Days)
Rise Time
(Days)
IMC-FOPI010.665.23
PI9.7818.906.01
2PI4.9213.544.89
Concentration vY
IMC-FOPI05.042.82
PI13.5210.983.01
2PI9.7129.793.11
Concentration vZ
IMC-FOPI0.096.193.64
PI13.1711.953.26
2PI9.8710.183.27
Table 3. IAE variations for all the drugs in case of parametric uncertainty.
DeviationIAE VXIAE VYIAE VZ
0%72.1538.8533.32
±5%72.2038.9033.38
±10%72.2138.9233.41
±20%72.2738.9533.47
±30%72.3338.9833.50
±40%72.4038.9933.53
±50%72.4239.0133.58
Disclaimer/Publisher’s Note: The statements, opinions and data contained in all publications are solely those of the individual author(s) and contributor(s) and not of MDPI and/or the editor(s). MDPI and/or the editor(s) disclaim responsibility for any injury to people or property resulting from any ideas, methods, instructions or products referred to in the content.

