Article

Blockchain Adoption and Organic Subsidy in an Agricultural Supply Chain Considering Market Segmentation

1
School of Economics and Management, Beijing University of Posts and Telecommunications, Beijing 100876, China
2
School of Modern Post (School of Automation), Beijing University of Posts and Telecommunications, Beijing 100876, China
3
China Telecom Corporation Limited Research Institute, Guangzhou 510630, China
*
Author to whom correspondence should be addressed.
Mathematics 2024, 12(1), 106; https://doi.org/10.3390/math12010106
Submission received: 24 November 2023 / Revised: 18 December 2023 / Accepted: 25 December 2023 / Published: 28 December 2023
(This article belongs to the Special Issue Modeling, Simulation and Optimization of Supply Chains)

Abstract

:
The quality authenticity of organic agricultural products has always been a hot issue for consumers. Blockchain’s advantages in information traceability and preventing data from being tampered with can reduce fake and counterfeit products, increasing the consumers’ trust in the quality of organic agricultural products. Considering market segmentation of consumer types in organic agricultural products (OPs) and conventional agricultural products (CPs), this study builds a game-theoretical model to explore how participants decide between blockchain traceability platforms and organic subsidy strategies. Results show that the producer should introduce the blockchain when the fraction of blockchain technology’s total cost shared by the producer is smaller and the fixed cost of implementing blockchain is higher or when the fraction of blockchain technology’s total cost shared by the producer is higher and the fixed cost of implementing blockchain is lower. The retailer is inclined to an organic subsidy, and the smaller the market proportion of undifferentiated-conscious consumers (UCCs), the more inclined the retailer is to the organic subsidy strategy. In addition, the market share of UCCs positively promotes the sales quantities and supply chain profits of CPs but is not conducive to the sales quantities of OPs.

1. Introduction

In recent years, organic agricultural products have become increasingly popular in the consumer market [1]. Consumers with health consciousness are more willing to purchase organic agricultural products [2]. However, there is a problem of counterfeiting in the market for organic agricultural products. According to the World Economic Forum, $30 to $40 billion will be spent annually due to product counterfeiting issues [3]. In 2014, according to Xinhua News Agency, there was at least 90% fake and inferior “Wuchang rice” in the market. In 2015, Wuchang City invested 32 million yuan to construct a traceability system for organic “Wuchang rice”. Wuchang rice can be traced by the whole quality inspection through traceability security code [4]. The food quality issues have drawn great attention from consumers and governments. Due to food fraud, real-time information sharing, transparency, and information traceability based on the product life cycle becomes vital for the agricultural supply chain [5,6,7,8]. Research claimed that about 71.35% of consumers do not trust organic products [9], and 94% of consumers believe that transparency in food production is essential [10]. Furthermore, consumers are ready to pay more for food traceability [11].
According to the Food and Agriculture Organization of the United Nations (FAO), information and communications technology (ICT) can help improve food quality security. For example, the use of Quick Response (QR) codes in food packaging and the introduction of various tracking systems in the food supply chain have made food more secure [12]. Therefore, blockchain technology has a great application prospect in the quality of agricultural products. At present, there are many research frameworks for the application of blockchain technology in agriculture. For example, P.Chinnasamy et al. [13] built a confidential and portable blockchain-based infrastructure for smart greenhouse farmlands. Blockchain technology is a distributed database technology with information traceability and immutability characteristics. The complete information about the agricultural product life cycle can be recorded in blockchain, and consumers can track the origins through the blockchain. For example, blockchain technology was applied to the green carbon digital certificate of Tianmu fruit shoots. The whole process of low-carbon environmental protection operation is traced by scanning the code, ensuring low-carbon food’s authenticity [14]. IBM and Walmart have jointly built a food traceability system based on blockchain technology, which can trace information such as factory, production date, transportation route, and storage temperature to ensure food safety and quality [15]. In 2018, Alibaba released the world’s first “authentic traceability function” based on blockchain technology using the characteristics of blockchain technology immutability and traceability [16]. In 2017, ZTE Chain established a blockchain traceability and anti-counterfeiting system to verify the authenticity of organic rice [17]. Therefore, blockchain traceability can help record the authenticity of organic agricultural products’ quality and increase consumer trust in organic agricultural products.
Government agricultural subsidies are also crucial to farmers to encourage agricultural production. Agricultural subsidies can fight rural poverty and increase agricultural production [18]. According to a quantitative survey from the region of Eastern Macedonia and Thrace, the farmer’s decision to produce organically is closely related to subsidies [19]. Subsidies for agricultural organic products contribute to the development of sustainable agriculture. In these conditions, we seek to focus on the following questions:
(1)
Whether subsidy policies always benefit the producer and retailer in the case of in-store competition between organic and conventional agricultural products?
(2)
Whether the market segmentation of agricultural consumers has an impact on the decisions of supply chain members?
(3)
Under different subsidy strategies, how the attitude of supply chain members toward blockchain traceability platforms has changed?
To address the above problems, we examine an agricultural supply chain consisting of a producer and a retailer. The producer plants organic agricultural products (OPs) and conventional agricultural products (CPs) and sells these products to the retailer. In the agricultural market, we assume that consumers are divided into two types: organic-oriented consumers (OCCs) and undifferentiated-conscious consumers (UCCs). UCCs only care about the retailer price and intrinsic attributes of agricultural products, not whether they are organic or not. OCCs that focus on the organic production of agricultural products only choose organic products. The producer can decide to invest in building a blockchain technology application platform for organic agricultural products, blockchain adoption (denoted by B), and no blockchain (denoted by N). The producer and retailer share the total costs of blockchain technology (the unit blockchain operation cost and the fixed cost of implementing blockchain). The government has two subsidy strategies for the producer in the organic production process, organic subsidy (denoted by S) and no organic subsidy (denoted by N). As a result, four cases are established: (1) Case NN, no blockchain and no organic subsidy; (2) Case NS, no blockchain and organic subsidy; (3) Case BN, blockchain adoption and no organic subsidy; (4) Case BS, blockchain adoption and organic subsidy.
Our key findings are as follows. First, the coefficient of consumer valuation of OPs has a certain positive impact on the retailer and producer’s profit, while the unit production cost of OPs has the opposite effect. Both CPs’ sales quantities and supply chain profits will increase with the market proportion of UCCs. By contrast, the sales quantities of OPs will decrease as the market proportion of UCCs increases. Second, in the same blockchain (subsidy) scenario, the wholesale prices under subsidy (blockchain) are lower (higher) than those under no subsidy (blockchain). In the same blockchain scenario, the optimal order quantities of OPs under subsidy are higher than those under no subsidy, while the optimal order quantities of CPs under subsidy are lower than those under no subsidy. However, the comparison of order quantities of CPs under different subsidy strategies is related to the increased coefficient of the valuation for OPs with blockchain and the subsidy factor of OPs. Finally, the retailer and producer always benefit from the organic subsidy strategy. Supply chain members’ attitude toward blockchain traceability depends on the fixed cost of implementing blockchain. Only when the fixed cost of implementing blockchain is less than a certain value do the supply chain members benefit from blockchain traceability.
The remainder of this study is organized as follows. The related literature is presented in Section 2. Section 3 shows the model description and inverse demand function, and formulates the profit function in different cases. Section 4 analyzes the equilibrium outcomes. Section 5 is the main findings and future research directions.

2. Literature Review

2.1. Organic and Non-Organic Products in the Agricultural Supply Chain

One stream of the literature investigates the agricultural products in the supply chain. Some literature investigates intervening factors that influence consumers’ willingness to purchase organic products. For example, Dou et al. [20] investigated how environmental protection information and quality and safety information affect consumers’ purchase intention of organic milk and showed that both have a positive reinforcing effect. Some scholars have studied organic agricultural products. For example, Hu et al. [17] compared and analyzed two business models (agricultural supermarket and e-commerce platform) in organic agricultural products supply chain considering blockchain certification traceability. Liang and Lim [21] examined the factors that influence consumers’ purchasing decisions for organic products through questionnaires. Some scholars divide agricultural products into organic and conventional agricultural products. Perlman et al. [22] studied the pricing decisions in the agricultural supply chain considering the retail channel and direct channel, organic products, and conventional products. Pu et al. [23] investigated the entry mode selection for organic agricultural products, a conventional retailer or independent retailer. Considering the differences of shelf lives and utility to customers, Ozinci et al. [24] studied the pricing decisions in an agri-food supply chain consisting of organic versions and non-organic agricultural products. However, the above research does not divide the market consumers into two types. Based on the hoteling model, Liu et al. [25] divided the market consumers into two types (without preference difference, preferring organic agricultural products), and explored the effect of subsidy on pricing. By contrast, our work divides consumers into two types, organic-oriented consumers (OCCs) and undifferentiated-conscious consumers (UCCs) from the perspective of consumer utility. In addition, this study considers the blockchain traceability and subsidy strategy for organic agricultural products.

2.2. Subsidy Strategies in Agricultural Supply Chains

Our work is also related to the subsidy strategies in agricultural supply chains. Currently, the research on subsidy strategy is mainly divided into two categories: the subsidy objects, and the form of subsidy. For example, Liu et al. [26] analyzed three subsidy strategies (no subsidy, direct incentive, and indirect incentive) in the agricultural supply chain in the form of subsidy, including subsidy for retail price (i.e., direct incentive)and subsidy for operating costs based on big data and blockchain (i.e., indirect incentive). Liu et al. [27] further examined how different subsidy strategies (no subsidy, fixed strategy, and varying strategy) affect the pricing decision in a fresh supply chain. The subsidy objects in this literature are the blockchain technology developer and the producer. The government subsidizes the unit price of traceability services for the producer. The blockchain technology developer’s subsidy can be a unit development cost subsidy or a fixed cost subsidy. Considering the yield uncertainty, Ye et al. [28] explored three subsidy strategies regarding blockchain adoption (none, single, and both supply chains) in two competing agricultural supply chains. Xu et al. [29] examined the optimal quality of supply and price subsidy strategies for the producer and the seller in a two-level agricultural supply chain. Cao et al. [30] studied how the four subsidy strategies of local governments (no, only manufacturer, only retailer, both) affect optimal operational strategies in the fresh produce supply chain involving cross-regional sales. Du and Lu [31] investigated how the government subsidy affects the visualization service investment strategies. Wang and Zhao [32] explored how a classified tax and subsidy system affects the packaging strategy of reusable packaging containers in fresh food supply chains. Tan et al. [33] investigated the incentive effect of government subsidies on the introduction of blockchain technology. This literature pointed out that the B2C e-commerce platform benefits from government subsidies, but the offline retailer does not. For the O2O supply chain, the e-commerce platform and the offline retailer both prefer government subsidies. Liu and Wang [34] analyzed how government policy subsidies affect the strategy of fresh and logistics enterprises’ investment in fresh-keeping efforts. Guo et al. [35] explored the incentive effects of five subsidy strategies based on subsidy objects (Farmer, E-Commerce Platform, Farmer and E-Commerce Platform, and Consumers) on agricultural products. Peng and Pang [36] considered a three-level contract-farming supply chain, where the risk-averse farmer faces yield uncertainty and government agricultural subsidy. Results indicated that the supplier and the distributor benefit from the subsidy, while the impact of the subsidy on the farmer’s profit depends on the degree of risk aversion. Nevertheless, this study explores the subsidy strategy for organic agricultural products from the perspective of production cost optimization and blockchain adoption in the agricultural supply chain considering market segmentation.

2.3. Blockchain in Agricultural Supply Chains

Another related stream of literature is blockchain in agricultural supply chains. Most research focuses on the information traceability of blockchain technology and the advantages of information immutability in agricultural supply chains. For example, Liu et al. [26] considered that the application of big data and blockchain contributes to the optimization of the production cost and sale costs in the agri-food supply chain. Then, Liu et al. [37] explored three different blockchain adoption strategies (none, one, and both) in two competitive agri-food supply chains considering the blockchain traceability service. Liu et al. [27] further considered the blockchain-based traceability information’s trust level and consumers’ preference for traceability information in a fresh supply chain. Considering the yield uncertainty, Ye et al. [28] explored how two competing agri-food supply chains adopt blockchain technology and how the government chooses the optimal subsidy strategy. Through evolutionary game analysis, Zheng et al. [38] investigated the government’s regulatory and producer’s blockchain traceability strategies in an agricultural supply chain. Liu et al. [39] explored the role that blockchain played in imported fresh food supply chains and analyzed how risk attitudes affected the optimal decisions in an imported fresh food supply chain. Li et al. [40] built a fresh agricultural product supply chain and discussed the dynamic optimization of freshness-keeping effort, advertising effort, and blockchain adoption degree in different blockchain scenarios. Chu [41] constructed the optimization model in a cross-border e-commerce fresh agricultural products supply chain based on blockchain technology and studied how different channel preferences affect the investment conditions of pricing and blockchain technology. Hu et al. [17] used quantitative methods to explore the benefits of the adoption of blockchain in the organic agricultural products supply chain. Wu et al. [42] investigated the supply chain members’ optimal decisions based on blockchain traceability in the fresh product supply chain. Unlike previous literature, we consider the impact of blockchain traceability on the agricultural supply chain, as well as the subsidy strategy for organic agricultural products. Furthermore, this study also explores the impact of market segmentation on supply chain members’ decisions.

2.4. Research Gaps and Innovations

The literature review reveals several gaps in the existing research. (1) The market segmentation of organic-oriented consumers (OCCs) and undifferentiated-conscious consumers (UCCs) in the agricultural supply chain has been largely overlooked. (2) Although there are many studies on agricultural subsidies, there is still a gap in the research on organic production cost subsidies under the classification of agricultural consumers. (3) Previous studies have not addressed the interaction between consumer market segmentation, subsidies for organic agricultural products, and blockchain technology in traceability applications.
This research aims to fill the gap between blockchain adoption and organic product subsidies in the agricultural supply chain, and it has the following innovative contributions:
(1)
Market segmentation of UCCs and OCCs types: By dividing consumers into two types, organic-oriented consumers (OCCs) and undifferentiated-conscious consumers (UCCs) from the perspective of consumer utility, this study provides a more comprehensive marketing strategy for organic and conventional agricultural products. This approach allows decision-makers to pay more attention to consumers’ market preferences and make optimal sales decisions.
(2)
Application of blockchain technology in organic products: Recognizing the importance of blockchain technology in agricultural traceability applications, this study explores the market impact of blockchain technology on organic products from the perspective of consumer utility. This idea provides a valuable reference for the study of organic products in the agricultural market.
(3)
Interaction effect between organic subsidies and blockchain: Organic product subsidies reduce the organic cost of producers, which in turn helps to promote the sustainable development of organic agriculture. Blockchain traceability of organic products improves the quality and reliability of organic products, which in turn helps to increase consumer trust in organic products. The interaction between the two studies provides valuable insights into organic production in the agricultural supply chain.

3. Problem Description and Assumptions

3.1. Notations

c o is the unit production cost of organic agricultural products (OPs).
ϕ is the market proportion of undifferentiated-conscious consumers (UCCs). Here, ϕ ( 0 , 1 ) . We normalized the market potential as 1, the market proportion of OCCs is 1 ϕ .
ν is the consumers’ valuation of conventional agricultural products (CPs).
δ is the coefficient of consumers’ valuation for OPs, here, δ > 1 .
a is the increase coefficient of the valuation for OPs with blockchain.
r is the subsidy factor of OPs.
b is the unit blockchain operating costs.
F is the fixed cost of implementing blockchain.
p o and p c are the retail prices of OPs and CPs, respectively.
λ is the fraction of blockchain technology’s total cost shared by the producer. The producer and retailer share the total costs of blockchain technology, λ ( 0 , 1 ) represents the fraction of the cost of blockchain technology shared by the producer.
q o and q c are the selling quantities of OPs and CPs, respectively.
w o and w c are the wholesale l prices of OPs and CPs, respectively.
π P and π R are the profit functions of the agricultural producer and retailer.

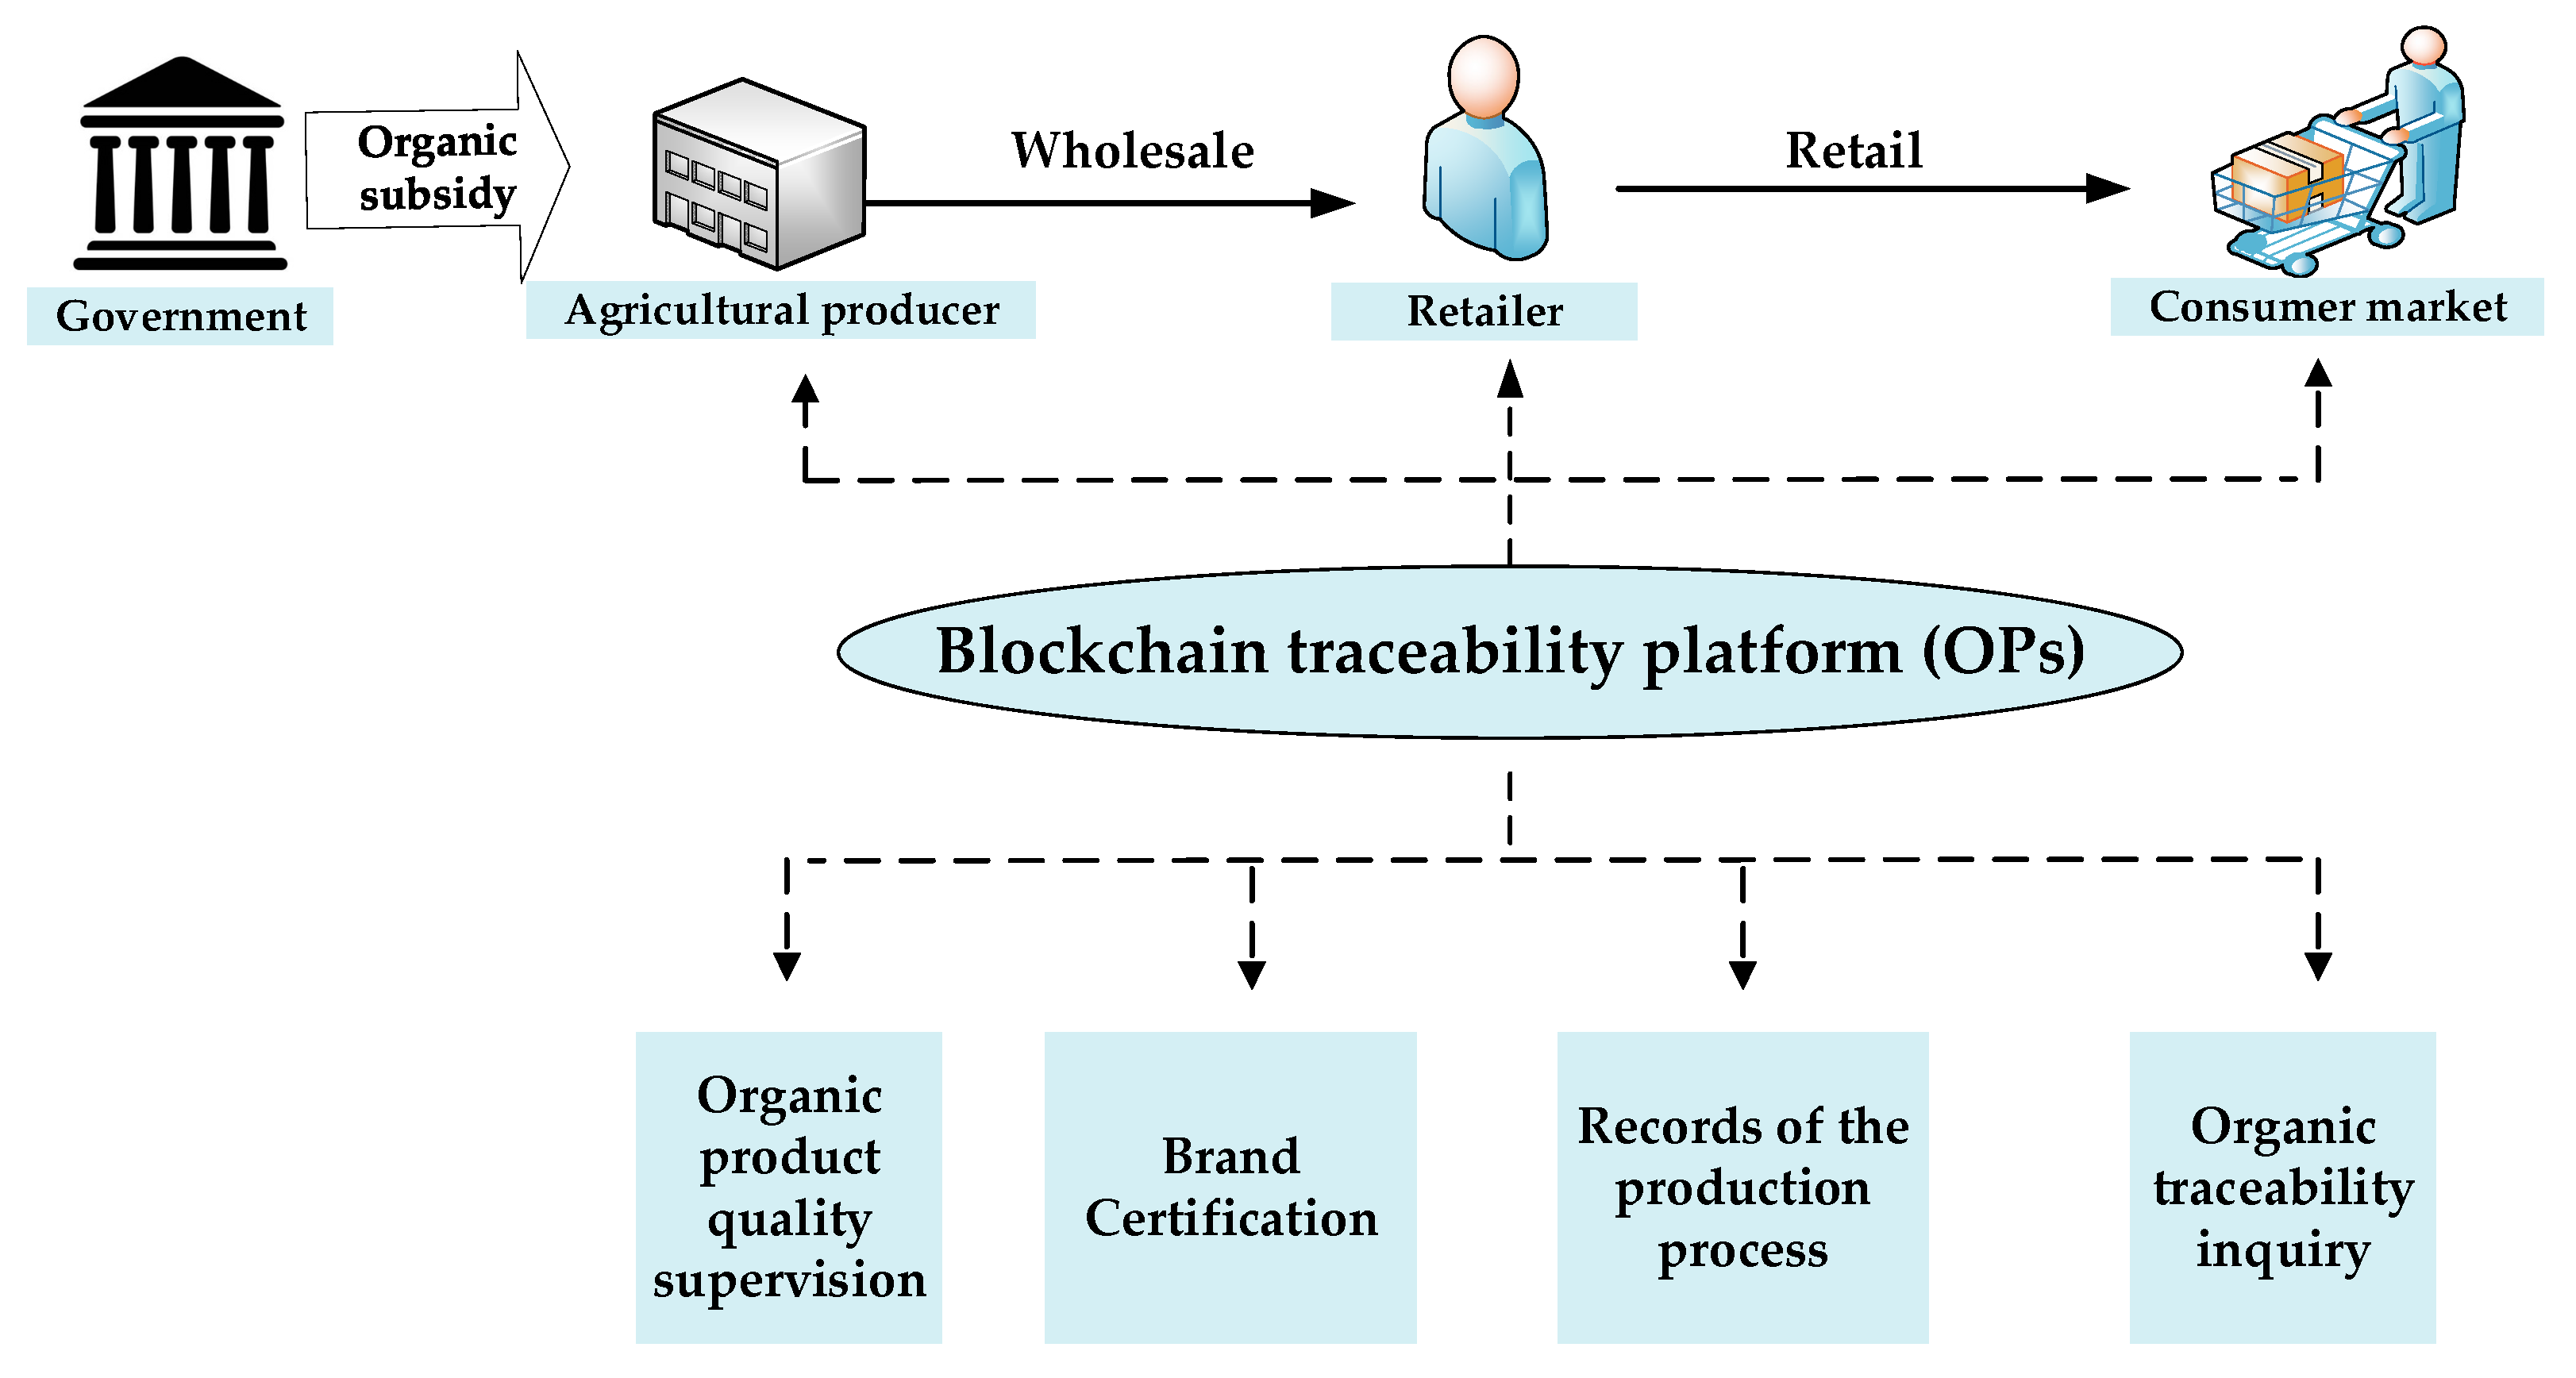
3.2. Problem Description

This paper considers an agricultural supply chain consisting of an agricultural producer (denoted by P) and a retailer (denoted by R) in the market. The producer with enough production capacity plants organic agricultural products (OPs) and conventional agricultural products (CPs) and sells both products to the retailer. We use subscripts o and c to represent OPs and CPs, respectively. The retailer sells the two agricultural products to the market at the unit retail prices p o and p c , respectively. The wholesale prices of OPs and GPs are w o and w c , respectively. Let q o and q c denote the selling quantity of OPs and GPs. The supply chain structure of the proposed method is illustrated in Figure 1.
We assume that consumers are heterogeneous in the valuation of OPs and CPs. In the market for agricultural products, consumers are divided into two types: organic-oriented consumers (OCCs) and undifferentiated-conscious consumers (UCCs). UCCs only care about the retailer price and intrinsic attributes of agricultural products, not whether they are organic or not. OCCs that focus on the organic production of agricultural products only choose organic products. v is the consumer’s valuation of CPs and follows uniform distribution over [0, 1]. Consumer valuation of OPs is higher than CPs and δ > 1 represents the coefficient of increase in the consumer’s valuation of OPs. Hence, a consumer’s surpluses of UCCs from purchasing CPs and OPs are v p c and δ v p o , respectively. A consumer’s surplus of OCCs from purchasing OPs is δ v p o . Following Li et al. [43], the inverse demand functions without blockchain are as follows:
p o N = δ δ q o q c
p c N = 1 δ ( δ δ q o q c ) δ 1 δ ϕ q c
For OPs, consumers pay more attention to the organic production process, the authentic quality, and the certification of OPs. Blockchain technology has the characteristics of information traceability and non-tampering. Agricultural supply chain members can record the agricultural product life cycle’s complete information and track the origins through the blockchain. Before purchasing agricultural products, consumers can check the OPs’ information by scanning the bar code, increasing consumer trust in the authentic quality of OPs. As a result, the valuation of OPs will increase when the agricultural supply chain introduces the blockchain in the organic production process, and the increase coefficient of the valuation is a > 1 . Therefore, a consumer’s surplus from purchasing OPs is a δ v p o when the supply chain adopts blockchain. We set B , N to denote the scenarios of blockchain adoption and no blockchain, respectively. We assume that the producer invests in building a blockchain technology application platform. The unit blockchain operation cost of the producer is b and the fixed cost of implementing blockchain is F. To make profit distribution more reasonable, we introduce a cost-sharing contract by following Gong et al. [44]. In addition, this study set the unit production cost of OPs as c o . Similar to Pu et al. [23], the unit production cost of CPs is normalized to 0 since the unit production cost of OPs is higher than CPs. Hence, we can infer that the price of OPs is higher than the price of CPs due to inputs from organic production ( p o > p c ). The inverse demand functions with blockchain as follows:
p o B = a δ a δ q o q c
p c B = 1 a δ ( a δ a δ q o q c ) a δ 1 a δ ϕ q c
To encourage organic food production, the government can subsidize the unit production cost of OPs and the subsidy factor is r ( 0 , 1 ) . We set S , N to denote the subsidy strategy of subsidy and no subsidy, respectively. According to subsidy strategies and blockchain scenarios, there are the four cases: (1) Case NN: no blockchain and no subsidy; (2) Case NS: no blockchain and organic subsidy; (3) Case BN: blockchain and no subsidy; (4) Case BS: blockchain and organic subsidy.

3.3. Assumptions

(a)
The agricultural producer provides organic agricultural products (OPs) and conventional agricultural products (CPs) and sells these products monopoly.
(b)
Organic-oriented consumers (OCCs) are very concerned about the OPs’ quality authenticity. In other words, traceability of the quality of OPs can improve OCCs’ organic preferences.
(c)
The agricultural producer and retailer are risk-neutral and completely rational.
(d)
In this study, we assume δ > 1 , which represents the coefficient of increase in the consumer’s valuation of OPs. δ = 1 represents that consumers have the same valuation for OPs and CPs. At this time, OPs do not have any additional advantage over CPs. In this paper, we assume that OPs have a higher nutritional value and valuation than CPs.
(e)
To make the outcomes meaningful, we assume that (1) 0 < c o < δ 1 , which means the unit production cost of OPs is not large enough; (2) a > a 0 , which denotes the increase coefficient of the valuation for OPs with blockchain is big enough. Here, a o = 1 + b + c o 2 δ + 1 2 4 b δ 1 δ + c o 1 + b 2 δ 1 + b 2 δ + 2 c o + c o 3 δ 2 c o .

3.4. Model Formulation

Considering the adoption of blockchain technology and government subsidy strategies, we have the four cases (case NN, case NS, case BN, and case BS). The expected profit functions of supply chain members are as follows:
(1)
Case NN: no blockchain and no subsidy
In case NN, the producer does not use the blockchain to authenticate and track OPs’ organic production information, and the government does not subsidize the producer’s inputs in organic production. First, the agricultural producer decides the wholesale prices of organic agricultural products and conventional agricultural products based on maximizing its total revenue. Subsequently, the retailer determines the quantities of organic agricultural products and conventional agricultural products according to the producer’s decision simultaneously. Thus, the profit functions for the producer and retailer are as follows:
π P N N = ( w o N N c o ) ( δ δ q o N N q c N N ) + w c N N ( δ ( δ δ q o N N q c N N ) δ 1 δ ϕ q c N N )
π R N N = ( p o N N w o N N ) ( δ δ q o N N q c N N ) + ( p c N N w c N N ) ( δ ( δ δ q o N N q c N N ) δ 1 δ ϕ q c N N )
Based on the backward induction method, we obtain the optimal equilibrium outcomes of the producer and retailer in case NN in Proposition 1. Detailed derivations and proofs are provided in Appendix A.
Proposition 1.
In Case NN, the optimal quantities and retailer prices are as follows:
w o N N = 1 2 ( δ + c o ) , w c N N = 1 2 , p o N N = 1 4 ( 3 δ + c o ) , p c N N = 3 4 , q o N N = δ 1 δ c o ϕ c o 4 δ 1 δ , q c N N = ϕ c o 4 δ 1
Taking the above optimal solutions into the Equations (5) and (6), we can obtain the optimal profits of the producer and retailer in case NN as follows:
π R N N = δ 1 δ c o 2 + ϕ c o 2 16 δ 1 δ   and   π P N N = δ 1 δ c o 2 + ϕ c o 2 8 δ 1 δ
(2)
Case NS: no blockchain and organic subsidy
In case NS, the producer does not introduce blockchain in the organic production process for organic agricultural products, and there exists the government subsidy for the organic agricultural products. First, considering the subsidy factor, the agricultural producer decides the wholesale prices of organic agricultural products and conventional agricultural products. Subsequently, based on the wholesale prices w o N S and w c N S , the retailer determines the quantities of organic agricultural products and conventional agricultural products simultaneously. Therefore, the profit functions for the producer and retailer are as follows:
π P N S = ( w o N S r c o ) ( δ δ q o N S q c N S ) + w c N S ( δ ( δ δ q o N S q c N S ) δ 1 δ ϕ q c N S )
π R N S = ( p o N S w o N S ) ( δ δ q o N S q c N S ) + ( p c N S w c N S ) ( δ ( δ δ q o N S q c N S ) δ 1 δ ϕ q c N S )
Based on the backward induction method, we can derive the optimal solutions of the producer and retailer, and the results are presented in Proposition 2. Detailed derivations and proofs are provided in Appendix A.
Proposition 2.
In Case NS, the optimal quantities and retailer prices are as follows:
w o N S = 1 2 ( δ + r c o ) , w c N S = 1 2 , p o N S = 1 4 ( 3 δ + r c o ) , p c N S = 3 4 , q o N S = δ 1 δ r c o ϕ r c o 4 δ 1 δ , q c N N = ϕ r c o 4 δ 1
Substituting the above optimal solutions into Equations (7) and (8), the optimal profits of the producer and retailer in case NS can be obtained as follows:
π R N S = δ 1 δ r c o 2 + ϕ r 2 c o 2 16 δ 1 δ   and   π P N S = δ 1 δ r c o 2 + ϕ r 2 c o 2 8 δ 1 δ
(3)
Case BN: blockchain and no subsidy
In case BN, the producer introduces the blockchain technology to record and trace the organic production process for organic agricultural products, and consumer valuation of organic products increases. There is no government subsidy for the organic agricultural products. The producer first determines the wholesale prices of organic agricultural products and conventional agricultural products to maximize its profit. Then, the retailer decides the quantities of organic agricultural products and conventional agricultural products simultaneously. The profit functions can be written as follows:
π P B N = ( w o B N c o ) ( a δ a δ q o B N q c B N ) + w c B N ( a δ ( a δ a δ q o B N q c B N ) a δ 1 a δ ϕ q c B N ) λ ( b q o B N + F )
π R B N = ( p o B N w o B N ) ( a δ a δ q o B N q c B N ) + ( p c B N w c B N ) ( a δ ( a δ a δ q o B N q c B N ) a δ 1 a δ ϕ q c B N ) ( 1 λ ) ( b q o B N + F )
Based on the backward induction method, we can acquire the optimal solutions, and the outcomes are presented in Proposition 3. Detailed derivations and proofs are provided in Appendix A.
Proposition 3.
In Case NS, the optimal policies are as follows:
w o B N = 1 2 ( a δ b ( 1 2 λ ) + c o ) , w c B N = 1 2 , p o B N = 1 4 ( 3 a δ + b + c o ) , p c B N = 3 4 ,   q c B N = ϕ ( b + c o ) 4 a δ 1 q o B N = a δ a δ 1 a δ 1 + ϕ b + c o 4 a δ a δ 1
Then, taking the above optimal equilibrium solutions into Equations (9) and (10), we can get the profits of the producer and retailer in case BN as follows:
π R B N = a δ a δ 1 a δ 2 b 2 c o + a δ 1 + ϕ b + c o 2 16 a δ a δ 1 1 λ F
π P B N = a δ a δ 1 a δ 2 c o 2 b + a δ 1 + ϕ b + c o 2 8 a δ a δ 1 F λ
(4)
Case BS: blockchain and organic subsidy
In case BS, there exists blockchain technology in the organic production process, and consumer valuation of organic products increases. Consumers can obtain complete authentic information about organic agricultural products, which increases consumer trust in OPs. The government subsidizes organic agricultural products for the producer. The producer first determines the wholesale prices of organic agricultural products and conventional agricultural products to w o B S and w c B S . Then, the retailer decides the quantities of organic agricultural products and conventional agricultural products simultaneously. Therefore, the profit functions for the producer and retailer are as follows:
π P B S = ( w o B S r c o ) ( a δ a δ q o B S q c B S ) + w c B S ( a δ ( a δ a δ q o B S q c B S ) a δ 1 a δ ϕ q c B S ) λ ( b q o B S + F )
π R B S = ( p o B S w o B S ) ( a δ a δ q o B S q c B S ) + ( p c B S w c B S ) ( a δ ( a δ a δ q o B S q c B S ) a δ 1 a δ ϕ q c B S ) ( 1 λ ) ( b q o B S + F )
Based on the backward induction method, we can acquire the optimal solutions, and the outcomes are presented in Proposition 4. Detailed derivations and proofs are provided in Appendix A.
Proposition 4.
In Case BS, the optimal results are as follows:
w o B S = 1 2 ( a δ b ( 1 2 λ ) + r c o ) , w c B S = 1 2 , p o B S = 1 4 ( 3 a δ + b + r c o ) , p c B S = 3 4 , q c B S = ϕ ( b + r c o ) 4 a δ 1 q o B S = a δ a δ 1 a δ 1 + ϕ b + r c o 4 a δ a δ 1
Then, substituting the above optimal equilibrium solutions into Equations (11) and (12), we can obtain the profits of the producer and retailer in case BS as follows:
π R B S = a δ a δ 1 a δ 2 b 2 r c o + a δ 1 + ϕ b + r c o 2 16 a δ a δ 1 1 λ F
π P B S = a δ a δ 1 a δ 2 b 2 r c o + a δ 1 + ϕ b + r c o 2 8 a δ a δ 1 λ F

4. Results Analysis

Based on the above optimal equilibrium results, we first analyze the influence of relevant parameters on the equilibrium results. Then, we compare the equilibrium results among the four cases.

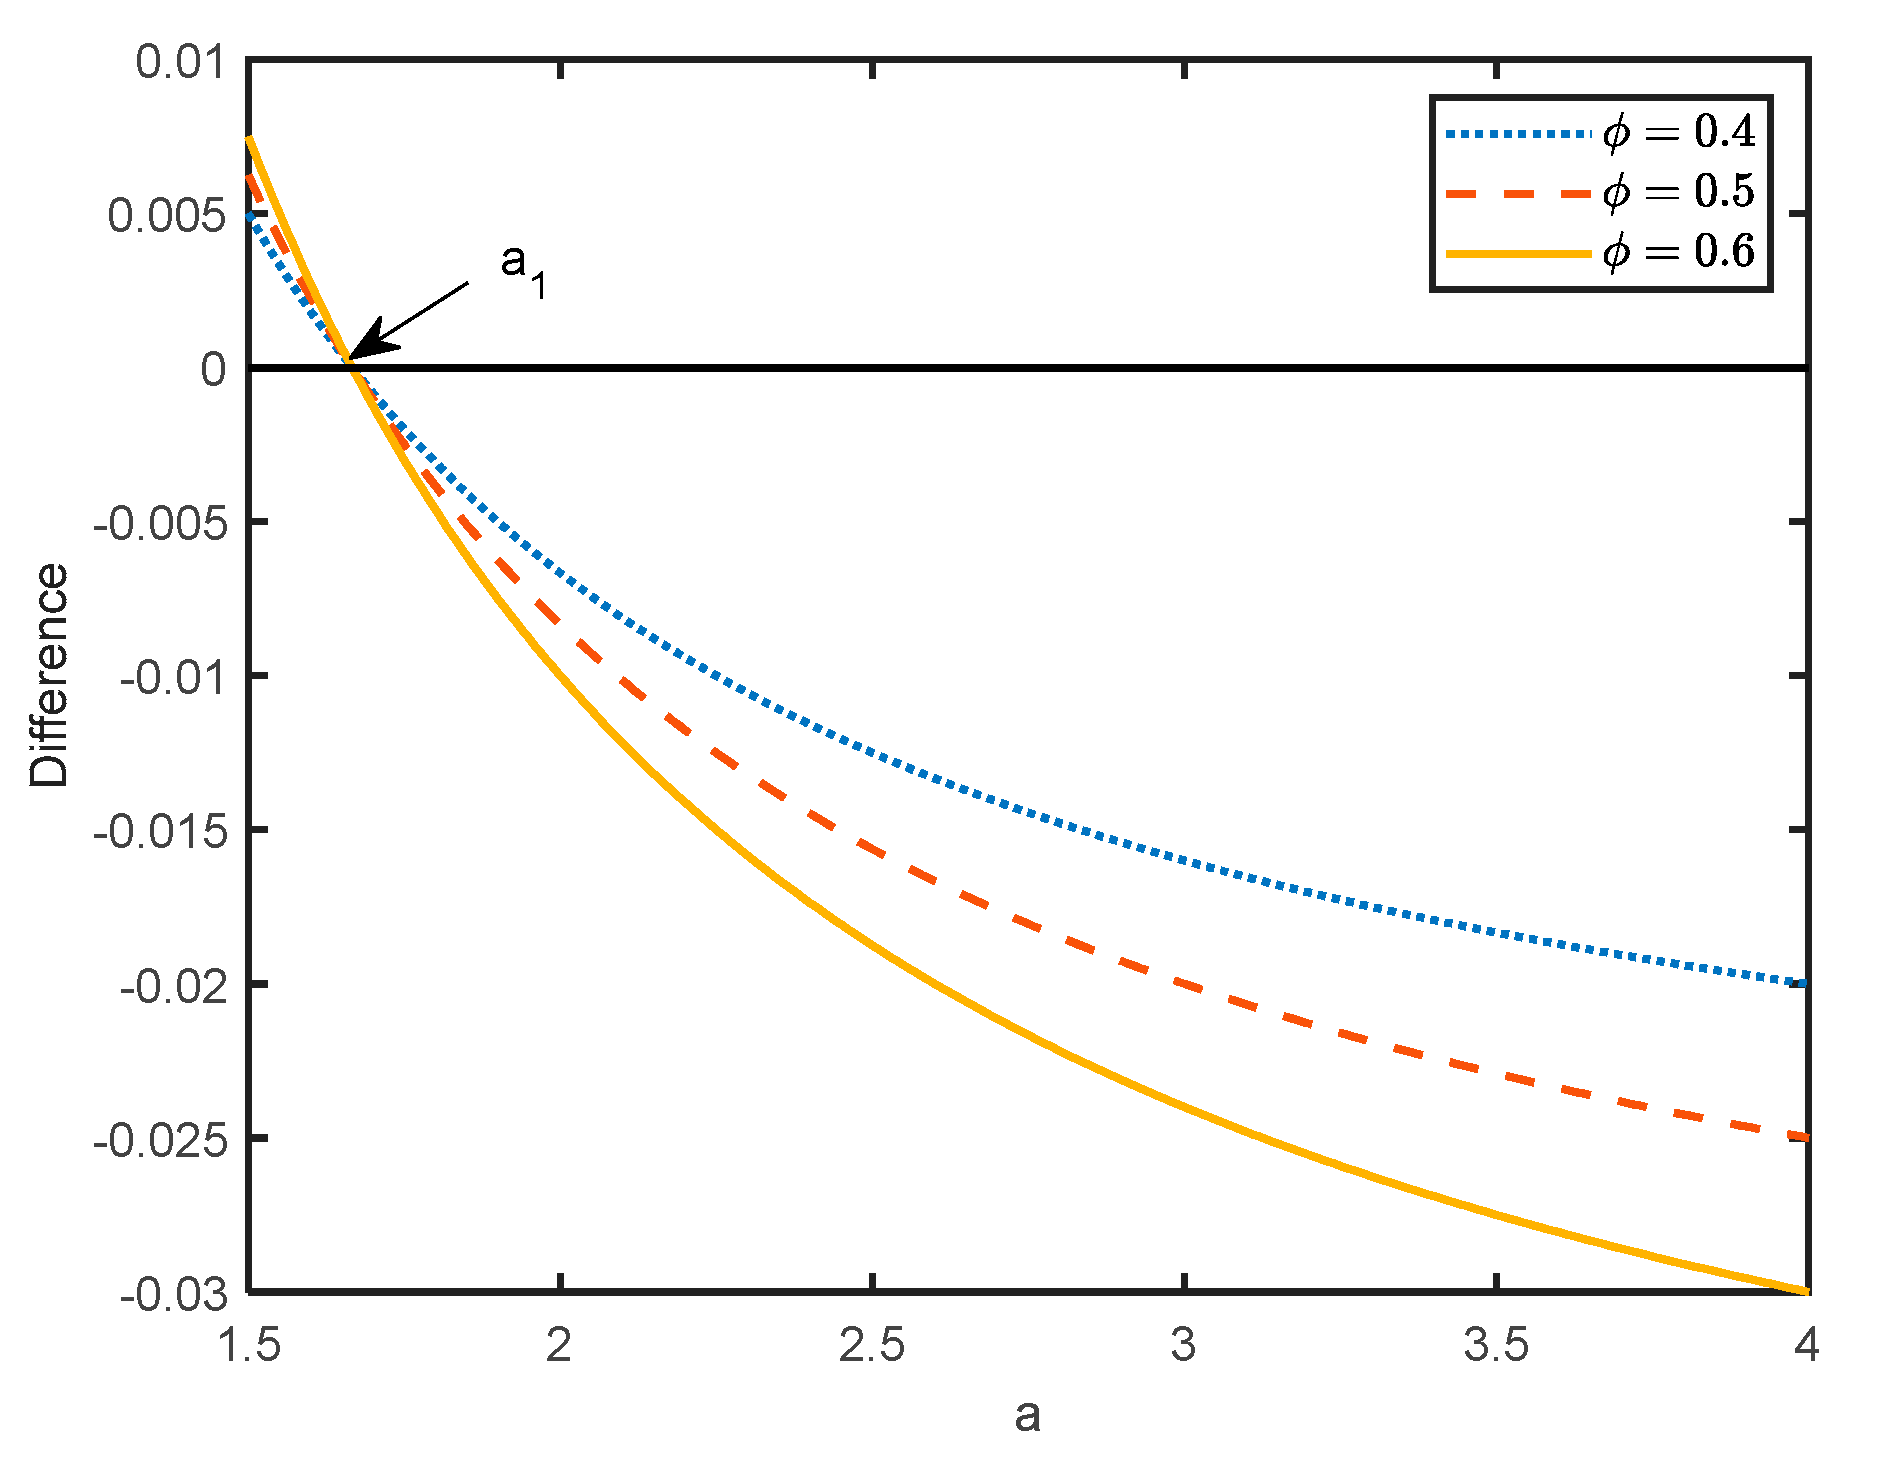
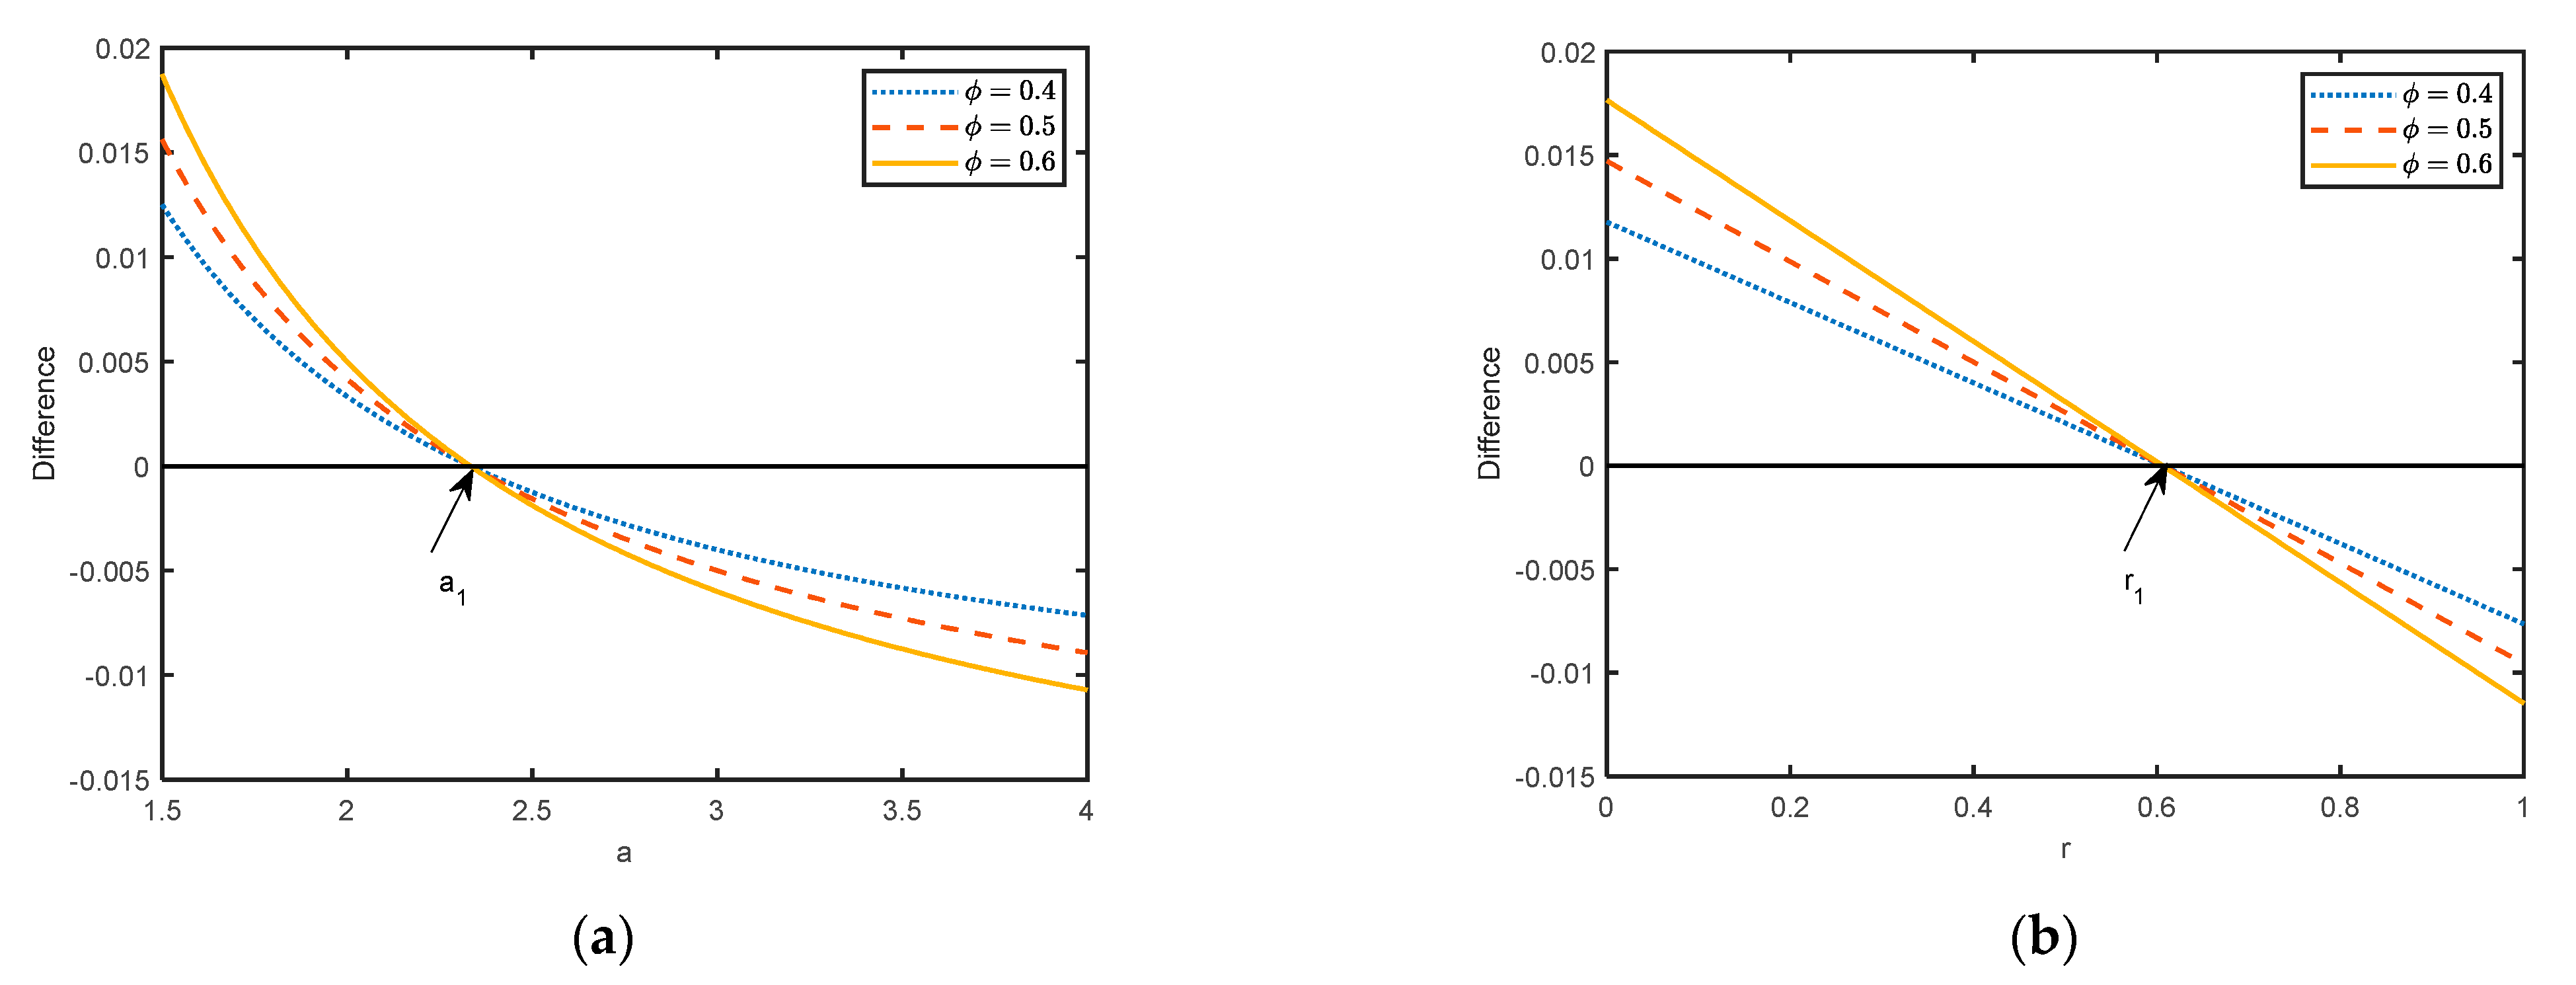
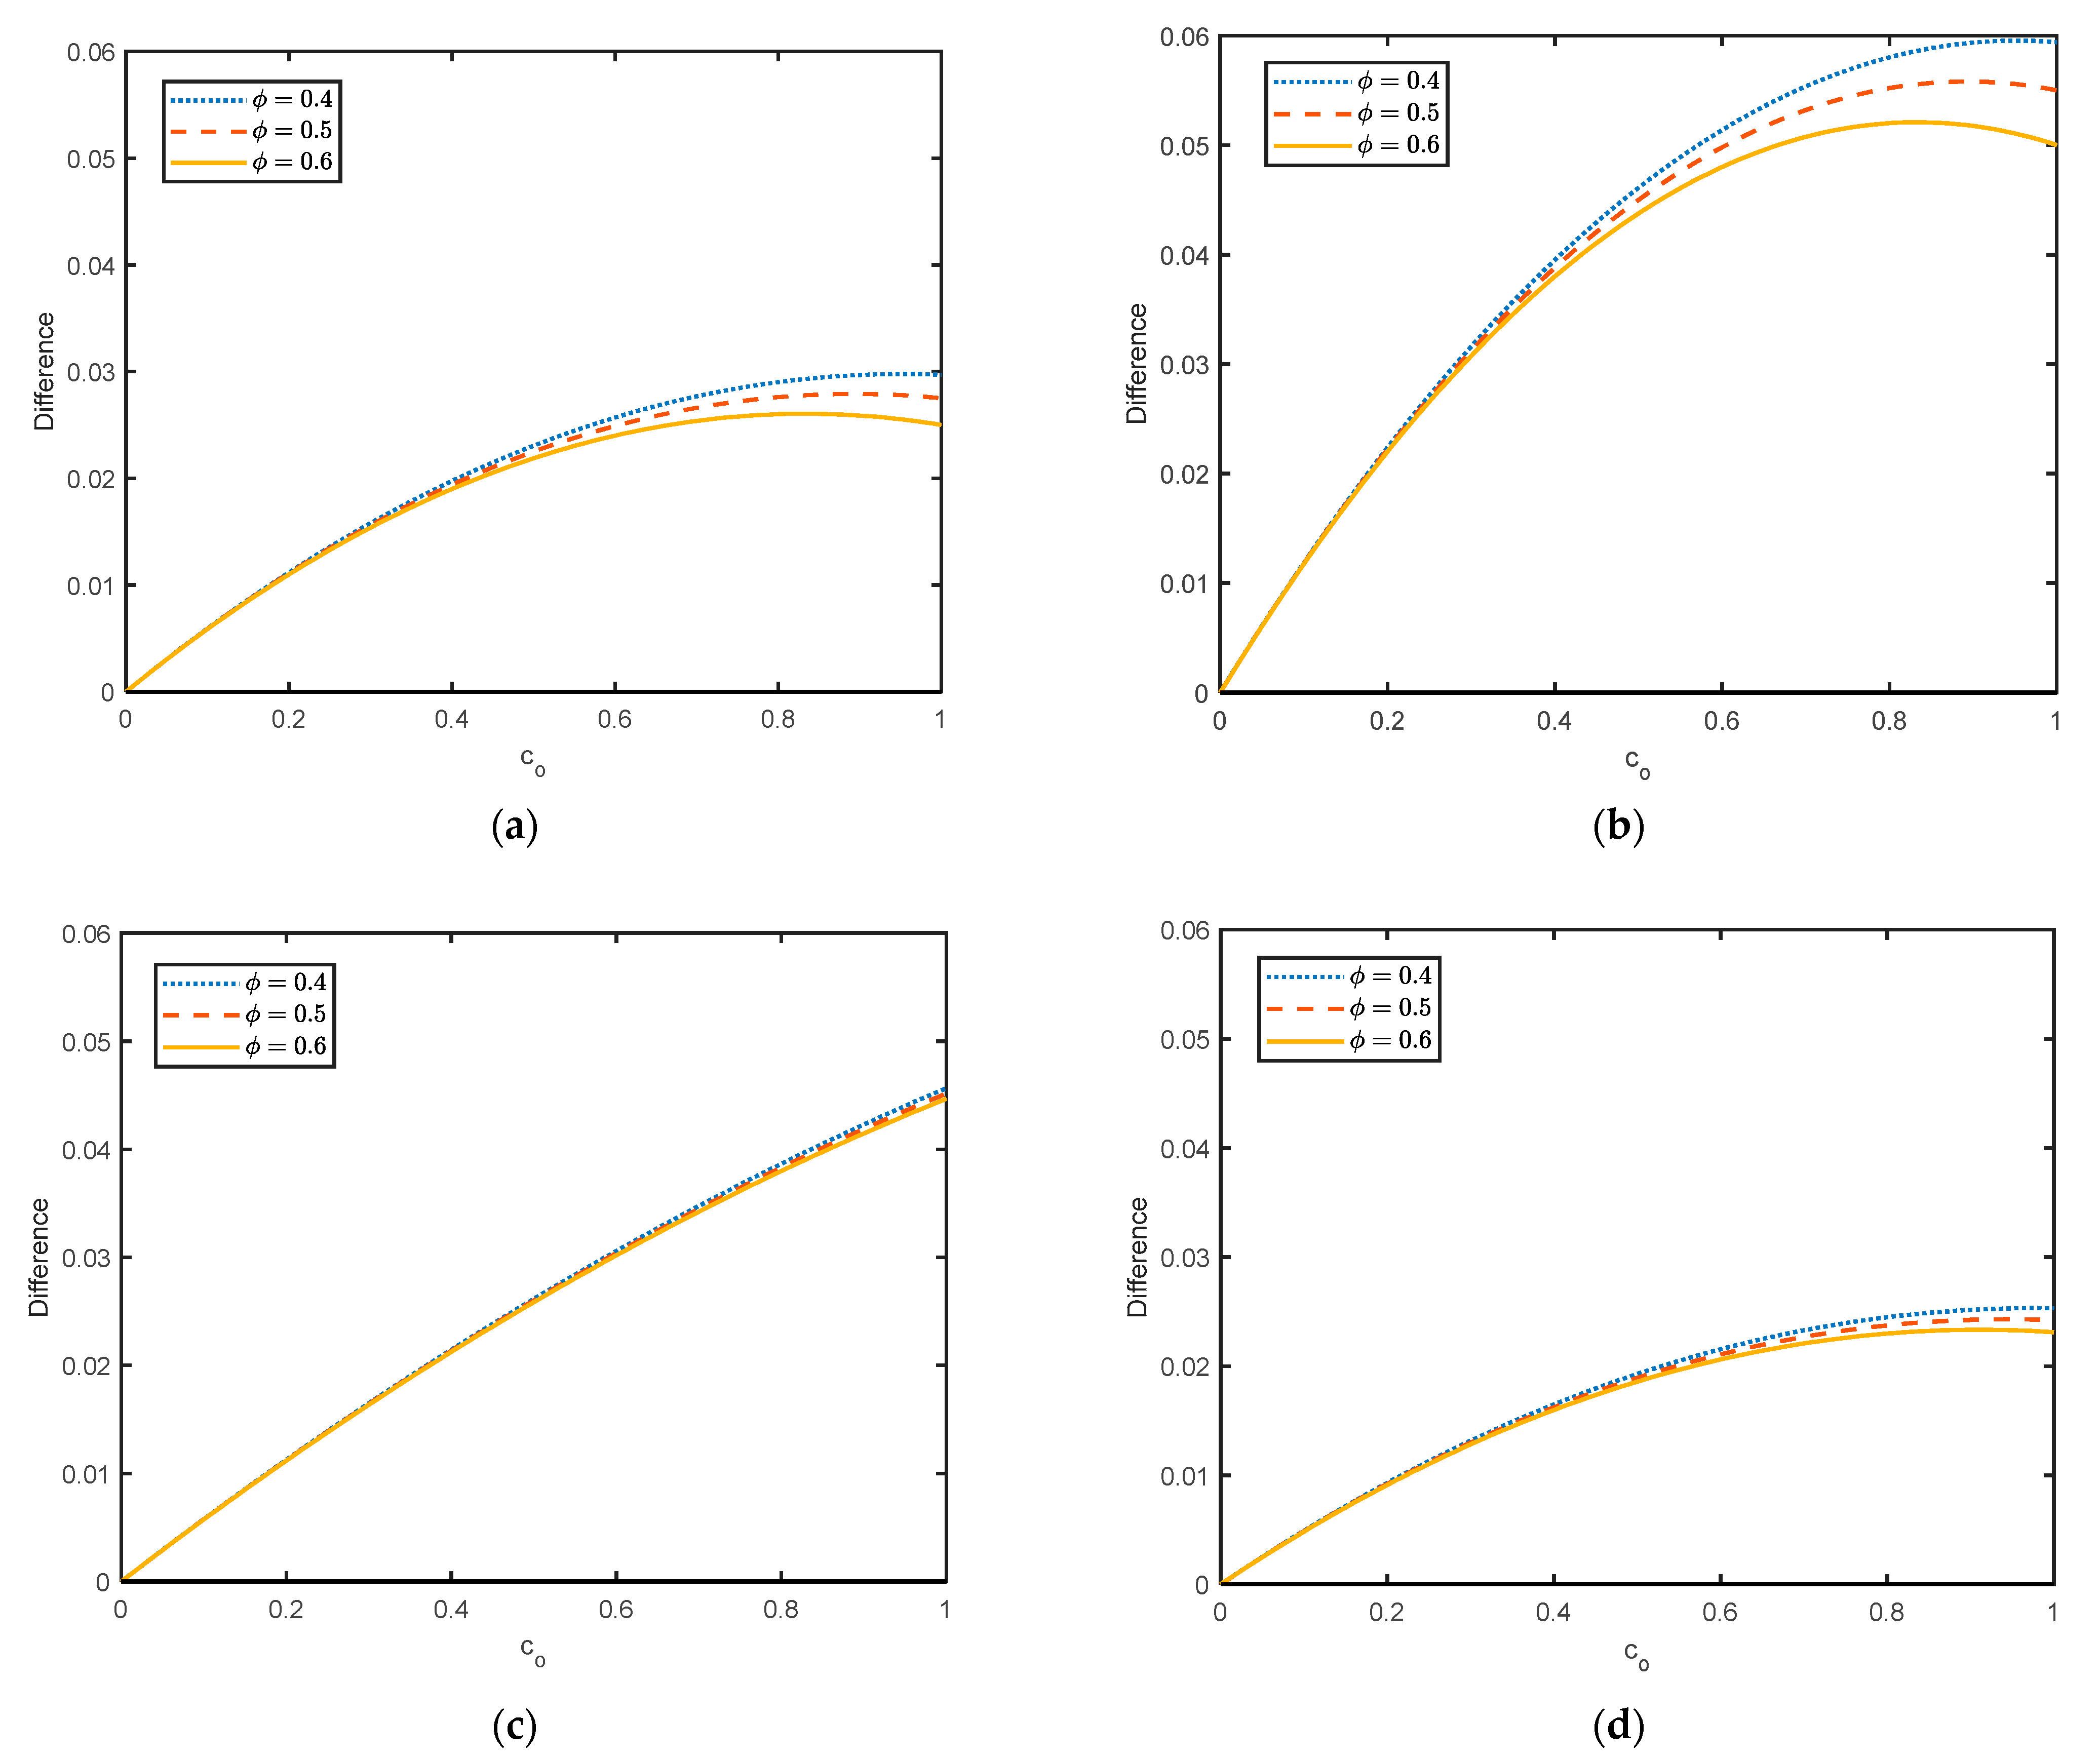
4.1. Sensitivity Analysis

In this subsection, we study the sensitivity analysis of some parameters, such as the coefficient of consumer valuation for OPs, unit production cost of OPs, the fraction of blockchain technology’s total cost shared by the producer, and the market proportion of UCCs.
Proposition 5.
(1) q o N N δ > 0 , q o N S δ > 0 , q o B N δ > 0 and q o B S δ > 0 ; (2) w o N N δ = w o N S δ > 0 and w o B N δ = w o B S δ > 0 ; (3) p o N N δ > 0 , p o N S δ > 0 , p o B N δ > 0 and p o B S δ > 0 ; (4) q c N N δ < 0 , q c N S δ < 0 , q c B N δ < 0 and q c B S δ < 0 ; (5) π R N N δ > 0 , π R N S δ > 0 , π R B N δ > 0 , π P N N δ > 0 , π P N S δ > 0 and π P B N δ > 0 .
Proposition 5 shows the effect of the coefficient of consumer valuation of OPs on the equilibrium outcomes. For organic agricultural products, the higher the coefficient of consumer valuation of OPs, the more popular OPs are with consumers in the market. As a result, the sales quantities increase as the coefficient of consumer valuation of OPs (i.e., q o i j δ > 0 ). At the same time, the producer has an incentive to raise wholesale prices to maximize its profit (i.e., w o i j δ > 0 ). For the retail price of OPs, the increase in wholesale prices also prompted retailers to raise the retail prices of organic agricultural products (i.e., p o i j δ > 0 ). For conventional agricultural products, the increase in the valuation of competitive products OPs has a weakening effect on the market sales of their own products. Therefore, the sales quantities of conventional agricultural products decrease as the coefficient of consumer valuation of OPs increases. For the retailer and producer, when no blockchain exists, the supply chain members’ profits increase as the coefficient of consumer valuation of OPs increases. When blockchain exists and no subsidy, the higher the valuation of OPs, and the higher the supply chain members’ profit.
Proposition 6.
(1) w o N N c o = w o B N c o > 0 , w o N S c o = w o B S c o > 0 ; (2) q o N N c o < 0 , q o N S c o < 0 , q o B N c o < 0 and q o B S c o < 0 ; (3) p o N N c o > 0 , p o N S c o > 0 , p o B N c o > 0 and p o B S c o > 0 ; (4) q c N N c o > 0 , q c N S c o > 0 , q c B N c o > 0 and q c B S c o > 0 ; (5) π R N N c o < 0 , π R N S c o < 0 , π R B N c o < 0 , π R B S c o < 0 , π P N N c o < 0   π P N S c o < 0 , π P B S c o < 0 and π P B N c o < 0 .
Proposition 6 demonstrates that the effect of the unit production cost of OPs on the equilibrium outcomes. For the wholesale prices of organic agricultural products, obviously, as the unit production costs of OPs rise, the wholesale prices will rise accordingly (i.e., w o i j c o > 0 ). For the quantities and retail prices of organic agricultural products, higher unit production costs and wholesale prices are likely to cause the retailer to reduce orders and improve the retail prices. Therefore, the quantities of OPs decrease as the unit production cost of OPs increases (i.e., q o i j c o < 0 ). On the contrary, the retail prices of OPs increase as the unit production cost of OPs increases (i.e., p o i j c o > 0 ). For the conventional agricultural products, the increase in the retail prices of competitive products OPs and the decrease in the sales quantities are conducive to the market sales of their own products CPs. Hence, the sales quantities of conventional agricultural products increase as the unit production cost of OPs increases (i.e., q c i j c o > 0 ).
For the retailer, the profit margins of organic agricultural products decrease as the unit production cost of OPs increases (i.e., ( p o i j w o i j ) c o < 0 ) and the quantities of OPs decrease as the unit production cost of OPs increases. As a result, the main source of profit for the retailer is reduced. Hence, as the unit production cost of OPs increases, the retailer’s profits in the four cases decrease (i.e., π R i j c o < 0 ). For the producer, as the unit production cost of OPs increases, the total production costs of OPs increase, which will naturally decrease the producer’s profits (i.e., π P i j c o < 0 ).
Proposition 7.
(1) q o N N ϕ < 0 , q o N S ϕ < 0 , q o B N ϕ < 0 and q o B S ϕ < 0 ; (2) q c N N ϕ > 0 , q c N S ϕ > 0 , q c B N ϕ > 0 and q c B S ϕ > 0 ; (3) π R N N ϕ > 0 , π R N S ϕ > 0 , π R B N ϕ > 0 and π R B S ϕ > 0 ; (4) π P N N ϕ > 0 , π P N S ϕ > 0 , π P B N ϕ > 0 and π P B S ϕ > 0 .
As shown in Proposition 7, we analyze the effects of the market proportion of UCCs on the optimal outcomes. For the quantities of organic agricultural products, as the market proportion of UCCs rises, the quantities will decrease (i.e., q o i j ϕ < 0 ). The underlying reason is that an increase in the market proportion of undifferentiated-conscious consumers (UCCs) causes a decrease in organic-oriented consumers (OCCs), and the market potential of organic agricultural products decreases. Hence, the quantities decrease with the increase in the market proportion of UCCs. For the conventional agricultural products, an increase in the market proportion of undifferentiated-conscious consumers (UCCs) is favored by an increase in the quantities of conventional agricultural products. Moreover, a decrease in the quantities of organic agricultural products also contributes to an increase in the quantities of conventional agricultural products (i.e., q c i j ϕ > 0 ). For the producer and retailer, the higher the market proportion of undifferentiated-conscious consumers (UCCs), the higher the supply chain profits. The profits of the producer and retailer both include the earnings of OPs and CPs two agricultural products. Undifferentiated-conscious consumers (UCCs) are potential consumers of both two products. Therefore, an increase in the market proportion of UCCs contributes to an increase in their profits.

4.2. Comparative Analysis

In this subsection, we compare the equilibrium outcomes in different cases. For ease of exhibition, we define some symbols in Table 1.
Proposition 8.
In the same blockchain scenario, the wholesale prices of OPs under subsidy are lower than those under no subsidy. In the same subsidy strategy, the wholesale prices of OPs under blockchain are higher than those under no blockchain.
Government subsidies for organic agricultural products (OPs) can reduce the producer’s production costs of organic agricultural products (OPs). Lower production costs give the producer an incentive to lower the wholesale prices. Therefore, the wholesale prices of organic agricultural products (OPs) under subsidy are lower than those under no subsidy (i.e., w o N S < w o N N , w o B S < w o B N ). The introduction of blockchain improves consumer trust in the authentic quality of organic agricultural products (OPs). Meanwhile, the implementation of blockchain increases the production costs for organic agricultural products. As a result, the producer can raise the wholesale prices of organic agricultural products (OPs) to obtain more profits (i.e., w o B S > w o N S , w o B N > w o N N ).
Proposition 9.
Whether the blockchain exists or not, the quantities of OPs under subsidy are higher than those under no subsidy.
According to the above Proposition 8, in the same blockchain scenario, the wholesale prices of organic agricultural products (OPs) under subsidy are lower than those under no subsidy. Lower wholesale prices give the retailer an incentive to increase its orders of organic agricultural products (OPs). Hence, in the same blockchain scenario, the quantities of organic agricultural products (OPs) under subsidy are higher than those under no subsidy (i.e., q o N S > q o N N , q o B S > q o B N ).
Proposition 10.
In the same blockchain scenario, the quantities of CPs under subsidy are lower than those under no subsidy. In the no subsidy strategy, the quantities of CPs with subsidy under blockchain are higher than those under no blockchain only if a 0 < a < a 1 . In the subsidy strategy, the quantities of OPs under blockchain are higher than those under no blockchain only if a 0 < a < a 1 or a > a 1 and 0 < r < r 1 .
Proposition 10 demonstrates that in the same blockchain scenario, the quantities of conventional agricultural products (CPs) under subsidy are lower than those under no subsidy. This is in line with Proposition 9 above. Organic agricultural products (OPs) and conventional agricultural products (CPs) compete with each other in the market. An increase in sales of organic agricultural products (OPs) will lead to a decrease in sales of conventional agricultural products (CPs) (i.e., q c N S < q c N N , q c B S < q c B N ). As shown in Figure 2, under the no subsidy strategy, when the increase coefficient of the valuation for OPs with blockchain is between a 0 and a 1 , the quantity of conventional agricultural products (CPs) with blockchain is higher than that without blockchain (i.e., q c B N > q c N N ). Under the subsidy strategy, when the increase coefficient of the valuation for OPs with blockchain is between a 0 and a 1 (see Figure 3a for illustration), or when the increase coefficient of the valuation for OPs with blockchain is higher than a value a 1 and the subsidy factor of organic agricultural products (OPs) is lower than r 1 (see Figure 3b for illustration), the quantity of conventional agricultural products (CPs) with blockchain is higher than that without blockchain (i.e., q c B S > q c N S ). In addition, when the proportion of undifferentiated-conscious consumers is larger, the difference in quantities of conventional agricultural products (CPs) under different blockchain scenarios is larger.
Proposition 11.
In the same blockchain scenario, the retailer and the producer are both inclined to the subsidy strategy.
As shown in Figure 4, the profit differences of supply chain members under no blockchain are always positive. In addition, the smaller the proportion of undifferentiated-conscious consumers, the larger the profit differences, and the supply chain members are more inclined to subsidy strategies. This is because a smaller ϕ means more organic-oriented consumers (OCCs). Government subsidies to organic agricultural products (OPs) are conducive to reducing the production cost of organic agricultural products (OPs). In this study, the retailer sells both organic and conventional agricultural products. As shown in Proposition 8, in the same blockchain scenario, government subsidies for organic agricultural products (OPs) can reduce the wholesale prices (i.e., w o N S < w o N N , w o B S < w o B N ). Therefore, the retailer is inclined to the government subsidy strategy for organic agricultural products (OPs) (i.e., π R N S > π R N N , π R B S > π R B N ). The producer produces both organic and inorganic agricultural products. Whether the blockchain exists or not, the producer is inclined to the government subsidy strategy for organic agricultural products (OPs) (i.e., π P N S > π P N N , π P B S > π P B N ).
Proposition 12.
When subsidy exists, the retailer tends to introduce blockchain technology only if F < F 1 and the producer prefers blockchain technology only if F < F 2 . When no subsidy exists, the retailer tends to introduce blockchain technology only if F < F 3 and the producer will benefit from blockchain technology only if F < F 4 .
Proposition 12 shows that when a subsidy strategy exists, the retailer’s profit with blockchain is higher than that without blockchain only if the fixed cost of implementing blockchain is lower than F 1 , while the producer‘s profit with blockchain is higher than that without blockchain only if the fixed cost of implementing blockchain is lower than F 2 . The introduction of blockchain by the producer in organic production processes generates both fixed and operational costs and the retailer needs to share a percentage of the blockchain costs due to the cost-sharing contract. Thus, when the fixed cost of implementing blockchain is lower than F 1 , the retailer tends to adopt blockchain technology in the organic production process. When the fixed cost of implementing blockchain is lower than F 2 , the producer tends to introduce blockchain technology in the organic production process. Similarly, when no subsidy strategy exists, the retailer tends to adopt blockchain technology in the production process of organic agricultural products only if the fixed cost of implementing blockchain is lower than F 3 , while the producer is willing to introduce the blockchain technology only if the fixed cost of implementing blockchain is lower than F 4 . We set the parameters as δ = 2 , b = 0.4 , c o = 0.3 , r = 0.5 , ϕ = 0.5 , a = 2 . Figure 4 displays the producer and retailer’s blockchain decision under different subsidy strategies. The solid lines indicate the producer and retailer’s indifferent profit lines between NN (NS) and BN (BS). As shown in Figure 5a, when the fraction of blockchain technology’s total cost shared by the producer λ and the fixed cost of implementing blockchain F are both higher or lower, the retailer is inclined to blockchain. A higher F and λ indicates a higher fixed blockchain cost shared by the producer. A lower F and λ denotes the fixed blockchain cost is not high. On the contrary, when the fraction of blockchain technology’s total cost shared by the producer is higher and the fixed cost of implementing blockchain is lower, the producer should adopt the blockchain (see the bottom left area of the solid line in Figure 5b). The producer is the implementer of blockchain and wants to share as little cost as possible. Figure 6 demonstrates the win-win area for the producer and retailer’s blockchain decision. The bottom area of the shaded areas indicate that both the producer and retailer are more inclined to adopt blockchain, and the upper area of the shaded areas shows that supply chain members are reluctant to introduce blockchain technology.

5. Conclusions

This study explores a game theory model in an agricultural supply chain consisting of an agricultural producer and retailer. The producer produces both organic and inorganic agricultural products and invests in constructing a blockchain technology application platform to record and trace the authentic quality of organic agricultural products (OPs). The retailer procures organic and inorganic agricultural products from the producer and sell them to the consumer market. From the research and analysis, we obtain the following main findings:
First, this study analyzes the sensitivity analysis of some parameters, such as the coefficient of consumer valuation for OPs, the unit production cost of OPs, and the market proportion of UCCs. We find that the wholesale (retail) prices of OPs increase as δ or c o increases. The sales quantities of OPs increase as the coefficient of consumer valuation of OPs increases but decrease as the unit production cost of OPs increases. On the contrary, the sales quantities of CPs decrease as the coefficient of consumer valuation of OPs increases but increase as unit production cost of OPs increases. When no blockchain exists, the retailer and producer’s profits increase as the coefficient of consumer valuation of OPs increases. When blockchain exists and there is no subsidy, the retailer and producer’s profits also increase as the coefficient of consumer valuation of OPs increases. The retailer and producer’s profits decrease as the unit production cost of OPs increases. Both CPs’ sales quantities and supply chain profits will increase with the market proportion of UCCs. By contrast, the sales quantities of OPs will decrease as the market proportion of UCCs increases.
Then, this study compares and analyzes the optimal wholesale prices and optimal order quantities under different cases. In the same blockchain scenario, the wholesale prices under subsidy are lower than those under no subsidy. From the same subsidy strategy, the wholesale prices are higher in the case of blockchain. The introduction of blockchain has increased the operating costs of the producer, which in turn has forced the producer to increase its pricing power. In the same blockchain scenario, the optimal order quantities of OPs under subsidy are higher than those under no subsidy, while the optimal order quantities of CPs under subsidy are lower than those under no subsidy. However, the comparison of order quantities of CPs under different subsidy strategies is related to the increase coefficient of the valuation for OPs with blockchain and the subsidy factor of OPs. When the subsidy strategy exists, the quantity of CPs with blockchain is higher than that without blockchain when the increase coefficient of the valuation for OPs with blockchain is between a 0 and a 1 , or when the increase coefficient of the valuation for OPs with blockchain is higher than a value a 1 and the subsidy factor of organic agricultural products (OPs) is lower than r 1 . When the no subsidy strategy exists, the quantity of CPs with blockchain is higher than that without blockchain when the unit blockchain operating cost is between a 0 and a 1 .
Finally, this research analyzes the retailer and producer’s attitude toward the subsidy strategy and blockchain adoption. When no blockchain exists, the retailer and producer benefit from the subsidy strategy. When the agricultural supply chain adopts blockchain, the retailer and producer tend to the subsidy strategy. When the subsidy strategy exists, the retailer prefers blockchain technology when the fixed cost of implementing blockchain is lower than F 1 . The producer is inclined to introduce blockchain technology when the fixed cost of implementing blockchain is lower than F 3 . When the no subsidy strategy exists, the retailer prefers blockchain technology when the fixed cost of implementing blockchain is lower than F 2 . The producer is inclined to introduce blockchain technology when the fixed cost of implementing blockchain is lower than F 4 . Under the same subsidy strategy, the retailer and producer’s attitudes toward blockchain technology depend on the fixed cost of implementing blockchain. In addition, the smaller the proportion of undifferentiated-conscious consumers ϕ , the more the supply chain members are inclined to subsidy strategies.
This study provides valuable insights into the agricultural supply chain development. From this work, several possible points for further research can be drawn. First, this article assumes that the organic agricultural products (OPs) and conventional agricultural products (CPs) are intact throughout production and sales. In fact, agricultural products are not easy to preserve. Therefore, it might be promising to investigate how the salvage value of agricultural products affects equilibrium outcomes considering the freshness function. Second, this study does not consider the risk attitude of supply chain participants. In reality, participants have a risk appetite, which is an interesting direction for future research.

Author Contributions

Conceptualization, C.L. and Y.S.; methodology, C.L.; software, C.L.; formal analysis, C.L. and T.Y.; investigation, C.L. and T.Y.; writing—original draft preparation, C.L.; writing—review and editing, C.L. and Y.S.; supervision, T.Y. All authors have read and agreed to the published version of the manuscript.

Funding

This research received no external funding.

Data Availability Statement

Data are contained within the article.

Conflicts of Interest

The authors declare no conflicts of interest.

Appendix A

Proof of Proposition 1.
For case NN, according to the formulas of the inverse demand functions and the profit functions, it is easy to obtain the retailer’s profit function, which is π R N N = 1 + δ + ϕ q c N N 2 δ ϕ q c N N 1 + 2 q o N N + w c N N q o N N δ + δ q o N N + w o N N . Based on the backward induction, we can obtain q o N N ( w o N N , w c N N ) and q c N N ( w o N N , w c N N ) . Substituting them into the producer’s profit function, π P N N = w c N N δ ϕ w c N N + ϕ w o N N 2 1 + δ + c o w o δ δ 2 δ ϕ w c N N w o N N + δ w o N N + ϕ w o N N 2 1 + δ δ . Therefore, we can obtain the optimal equilibrium solutions as shown in Proposition 1. □
Proof of Proposition 2.
For case NS, according to the formulas of the inverse demand functions and the profit functions, it is easy to obtain the retailer’s profit function, which is π R N S = 1 + δ + ϕ q c N S 2 δ ϕ q c N S 1 + 2 q o N S + w c N S q o N S δ + δ q o N S + w o N S . Based on the backward induction, we can obtain q o N S ( w o N S , w c N S ) and q c N S ( w o N S , w c N S ) . Substituting them into the producer’s profit function, π P N S = w c N S δ ϕ w c N S + ϕ w o N S 2 1 + δ + r c o w o δ δ 2 δ ϕ w c N S w o N S + δ w o N S + ϕ w o N S 2 1 + δ δ . Therefore, we can obtain the optimal equilibrium solutions as shown in Proposition 2. □
Proof of Proposition 3.
For case BN, according to the formulas of the inverse demand functions and the profit functions, it is easy to obtain the retailer’s profit function, which is π R B N = F 1 + λ 1 + a δ + ϕ q c B N 2 a δ ϕ a δ q o B N 2 q c B N 1 + 2 q o B N + w c B N + q o B N a δ + b 1 + λ w o B N . Based on the backward induction, we can obtain q o B N ( w o B N , w c B N ) and q c B N ( w o B N , w c B N ) . Similar to Proposition 1, we substitute them into the producer’s profit function. Therefore, we can obtain the optimal equilibrium solutions as shown in Proposition 3. □
Proof of Proposition 4.
For case BS, which is similar to Proposition 3, we can obtain the optimal equilibrium solutions as shown in Proposition 4. □
Proof of Proposition 5.
The first-order derivatives are as follows: q o N N δ = δ 1 2 + ϕ 2 δ 1 c o 4 δ 1 2 δ 2 , q o N S δ = δ 1 2 + ϕ 2 δ 1 r c o 4 1 + δ 2 δ 2 , q o B N δ = a δ 1 2 + 2 a δ 1 ϕ b + c o 4 a δ 2 a δ 1 2 and q o B S δ = a δ 1 2 + 2 a δ 1 ϕ b + r c o 4 a δ 2 a δ 1 2 ; (2) w o N N δ = w o N S δ = 1 2 and w o B N δ = w o B S δ = a 2 ; (3) p o N N δ = p o N S δ = 3 4 and p o B N δ = p o B S δ = 3 a 4 ; (4) q c N N δ = ϕ c o 4 δ 1 2 , q c N S δ = r ϕ c o 4 δ 1 2 , q c B N δ = a ϕ b + c o 4 a δ 1 2 and q c B S δ = a ϕ b + r c o 4 a δ 1 2 ; (5) π R N N δ = δ 1 2 δ 2 δ 1 2 + ϕ 2 δ 1 c o 2 16 δ 1 2 δ 2 , π R N S δ = δ 1 2 δ 2 δ 1 2 + ϕ 2 δ 1 r 2 c o 2 16 δ 1 2 δ 2 , π R B N δ = δ 1 2 δ 2 δ 1 2 + ϕ 2 δ 1 r 2 c o 2 16 δ 1 2 δ 2 , π P N N δ = δ 1 2 δ 2 δ 1 2 + ϕ 2 δ 1 c o 2 8 δ 1 2 δ 2 , π P N S δ = δ 1 2 δ 2 δ 1 2 + ϕ 2 δ 1 r 2 c o 2 8 δ 1 2 δ 2 , π P B N δ = a 2 δ 2 a δ 1 2 a δ 1 2 + ϕ 2 a δ 1 b + c o 2 8 a δ 2 a δ 1 2 . Based on the assumptions of this study, 0 < ϕ < 1 , 0 < r < 1 , 0 < λ < 1 , δ > 1 , a > a 0 and 0 < c 0 < δ 1 , we can conclude that the above items (1)–(3), (5) are positive and the items (4) are negative. □
Proof of Proposition 6.
The first-order derivatives are as follows: (1) w o N N c o = w o B N c o = 1 2 , w o N S c o = w o B S c o = r 2 ; (2) q o N N c o = 1 δ ϕ 4 δ 1 δ , q o N S c o = r δ 1 r ϕ 4 δ 1 δ , q o B N c o = 1 a δ ϕ 4 a δ a δ 1 and q o B S c o = r a δ 1 r ϕ 4 a δ a δ 1 ; (3) p o N N c o = p o B N c o = 1 4 and p o N S c o = p o B S c o = r 4 ; (4) q c N N c o = ϕ 4 δ 1 , q c N S c o = r ϕ 4 δ 1 , q c B N c o = ϕ 4 a δ 1 and q c B S c o = r ϕ 4 a δ 1 ; (5) π R N N c o = δ 1 δ c o + ϕ c o 8 δ 1 δ , π R B N c o = a δ a δ 1 + a δ 1 + ϕ b + c o 8 a δ a δ 1 , π R N S c o = r δ 1 δ r c o + r 2 ϕ c o 8 δ 1 δ , and π R B S c o = a r δ a δ 1 + r a δ 1 + ϕ b + r c o 8 a δ a δ 1 . π P N N c o = δ 1 δ c o + ϕ c o 4 δ 1 δ , π P B S c o = a r δ a δ 1 + r a δ 1 + ϕ b + r c o 4 a δ a δ 1 , π P N S c o = r δ 1 δ r c o + r 2 ϕ c o 4 δ 1 δ , and π P B N c o = a δ a δ 1 + a δ 1 + ϕ b + c o 4 a δ a δ 1 . Based on the assumptions of this study, 0 < ϕ < 1 , 0 < r < 1 , 0 < λ < 1 , δ > 1 , a > a 0 and 0 < c 0 < δ 1 , we can obtain that the above items (1), (3), (4) are positive and the items (2), (5) are negative. □
Proof of Proposition 7.
The first-order derivatives are as follows: (1) q o N N ϕ = c o 4 δ 1 δ , q o N S ϕ = r c o 4 δ 1 δ , q o B N ϕ = b c o 4 a δ a δ 1 and q o B S ϕ = b r c o 4 a δ a δ 1 ; (2) q c N N ϕ = c o 4 δ 1 δ , q c N S ϕ = r c o 4 δ 1 δ , q c B N ϕ = b + c o 4 a δ 1 and q c B S ϕ = b + r c o 4 a δ 1 ; (3) π R N N ϕ = c o 2 16 δ 1 δ , π R N S ϕ = r 2 c o 2 16 δ 1 δ , π R B N ϕ = b + c o 2 16 a δ a δ 1 and π R B S ϕ = b + r c o 2 16 a δ a δ 1 ; (4) π P N N ϕ = c o 2 8 δ 1 δ , π P N S ϕ = r 2 c o 2 8 δ 1 δ , π P B N ϕ = b + c o 2 8 a δ a δ 1 and π P B S ϕ = b + r c o 2 8 a δ a δ 1 . Based on the assumptions of this study, 0 < ϕ < 1 , 0 < r < 1 , 0 < λ < 1 , δ > 1 , a > a 0 and 0 < c 0 < δ 1 , we can conclude that the above items (2)–(4) are positive and the items (1) are negative. □
Proof of Proposition 8.
Comparing the wholesale prices in different cases: w o N S w o N N = w o B S w o B N = 1 2 r 1 c o , w o B S w o N S = w o B N w o N N = 1 2 a 1 δ b 1 2 λ . Based on the assumptions of this study, 0 < ϕ < 1 , 0 < r < 1 , 0 < λ < 1 , δ > 1 , a > a 0 and 0 < c 0 < δ 1 , we can conclude that the differences w o N S w o N N and w o B S w o B N are negative and the differences w o B S w o N S and w o B N w o N N are positive. □
Proof of Proposition 9.
Comparing the order quantities of OPs: q o N S q o N N = 1 r δ 1 + ϕ c o 4 δ 1 δ , q o B S q o B N = 1 r a δ 1 + ϕ c o 4 a δ a δ 1 . Based on the assumptions of this study, 0 < ϕ < 1 , 0 < r < 1 , 0 < λ < 1 , δ > 1 , a > a 0 and 0 < c 0 < δ 1 , we can conclude that the differences are both positive. □
Proof of Proposition 10.
Comparing the order quantities of CPs: q c N S q c N N = 1 r ϕ c o 4 δ 1 , q c B S q c B N = 1 r ϕ c o 4 a δ 1 , q c B S q c N S = ϕ b δ 1 a 1 r δ c o 4 δ 1 a δ 1 , q c B N q c N N = ϕ b δ 1 a 1 δ c o 4 δ 1 a δ 1 . Based on the assumptions of this study, 0 < ϕ < 1 , 0 < r < 1 , 0 < λ < 1 , δ > 1 , a > a 0 and 0 < c 0 < δ 1 , we can conclude that the differences q c N S q c N N and q c B S q c B N are negative. If a 0 < a < a 1 , or a > a 1 and 0 < r < 1 , we can know q c B S q c N S > 0 . If a 0 < a < a 1 , we have q c B N q c N N > 0 . □
Proof of Proposition 11.
Comparing the retailer and producer’s profits in different cases, the differences are as follows: π R N S π R N N = 1 r c o 2 δ 1 δ 1 + r δ 1 + ϕ c o 16 δ 1 δ ; π P N S π P N N = 1 r c o 2 δ 1 δ 1 + r δ 1 + ϕ c o 8 δ 1 δ   π R B S π R B N = c o 1 r 2 a δ a δ 1 a δ 1 + ϕ 2 b 1 λ + 1 + r c o 16 a δ a δ 1 ; π P B S π P B N = c o 1 r 2 a δ a δ 1 a δ 1 + ϕ 2 b + 1 + r c o 8 a δ a δ 1 . Based on the assumptions of this study, 0 < ϕ < 1 , 0 < r < 1 , 0 < λ < 1 , δ > 1 , a > a 0 and 0 < c 0 < δ 1 , we can conclude that the differences are all positive. □
Proof of Proposition 12.
Comparing the retailer’s profits in two different cases. Define β 1 = a δ a δ 1 a δ 2 b 2 r c o + a δ 1 + ϕ b + r c o 2 16 a δ a δ 1 1 λ , β 2 = δ 1 δ r c o 2 + ϕ r 2 c o 2 16 δ 1 δ 1 λ , β 3 = a δ a δ 1 a δ 2 r c o 2 b + a δ 1 + ϕ b + r c o 2 8 a δ a δ 1 λ , β 4 = δ 1 δ r c o 2 + ϕ r 2 c o 2 8 δ 1 δ λ , β 5 = a δ a δ 1 a δ 2 b 2 c o + a δ 1 + ϕ b + c o 2 16 a δ a δ 1 1 λ , β 6 = δ 1 δ c o 2 + ϕ c o 2 16 δ 1 δ 1 λ , β 7 = a δ a δ 1 a δ 2 c o 2 b + a δ 1 + ϕ b + c o 2 8 a δ a δ 1 λ , β 8 = δ 1 δ c o 2 + ϕ c o 2 8 δ 1 δ λ . The profit differences are as follows: π R B S π R N S = ( 1 λ ) ( β 1 β 2 F ) , π R B N π R N N = ( 1 λ ) ( β 5 β 6 F ) , π P B S π P N S = λ ( β 3 β 4 F ) ; π P B N π P N N = λ ( β 7 β 8 F ) . Based on the assumptions of this study, 0 < ϕ < 1 , 0 < r < 1 , 0 < λ < 1 , δ > 1 , a > a 0 and 0 < c 0 < δ 1 . Let F 1 = β 1 β 2 and F 2 = β 5 β 6 , we have: (1) F < F 1 , π R B S π R N S > 0 ; otherwise, π R B S π R N S < 0 . (2) F < F 2 , π R B N π R N N > 0 ; otherwise, π R B N π R N N < 0 . Let F 3 = β 3 β 4 and F 4 = β 7 β 8 , we have: (1) if F < F 3 , π P B S π P N S > 0 ; otherwise, π P B S π P N S < 0 . (2) if F < F 4 , π P B N π P N N > 0 ; otherwise, π P B N π P N N < 0 . □

References

  1. Ostapenko, R.; Herasymenko, Y.; Nitsenko, V.; Koliadenko, S.; Balezentis, T.; Streimikiene, D. Analysis of Production and Sales of Organic Products in Ukrainian Agricultural Enterprises. Sustainability 2020, 12, 3416. [Google Scholar] [CrossRef]
  2. Chou, F.-S.; Wang, C.-C.; Lai, M.-C.; Tung, C.-H.; Yang, Y.-J.; Tsai, K.-H. Persuasiveness of organic agricultural products Argument strength, health consciousness, self-reference, health risk, and perceived fear. Br. Food J. 2020, 122, 1289–1304. [Google Scholar] [CrossRef]
  3. Kohler, S.; Pizzol, M. Technology assessment of blockchain-based technologies in the food supply chain. J. Clean. Prod. 2020, 269, 122193. [Google Scholar] [CrossRef]
  4. Fake Rice (2023-3). Available online: https://baijiahao.baidu.com/s?id=1760514592508123331&wfr=spider&for=pc (accessed on 20 September 2023).
  5. Saurabh, S.; Dey, K. Blockchain technology adoption, architecture, and sustainable agri-food supply chains. J. Clean. Prod. 2021, 284, 124731. [Google Scholar] [CrossRef]
  6. Caro, M.P.; Ali, M.S.; Vecchio, M.; Giaffreda, R. Blockchain-based traceability in Agri-Food supply chain management: A practical implementation. In Proceedings of the 2018 IoT Vertical and Topical Summit on Agriculture—Tuscany (IOT Tuscany), Tuscany, Italy, 8–9 May 2018. [Google Scholar] [CrossRef]
  7. Zarpelo, B.B.; Junior, S.B.; Badaró, A.T.; Barbin, D.F. On the Use of Blockchain for Agrifood Traceability; Academic Press: Cambridge, MA, USA, 2021. [Google Scholar] [CrossRef]
  8. Olsen, P.; Borit, M. The components of a food traceability system. Trends Food Sci. Technol. 2018, 77, 143–149. [Google Scholar] [CrossRef]
  9. Turhan, S. Sustainable Consumption and Organic Farming: The Case of Bursa, Turkey. Fresenius Environ. Bull. 2019, 28, 3805–3810. [Google Scholar]
  10. Astill, J.; Dara, R.A.; Campbell, M.; Farber, J.M.; Fraser, E.D.G.; Sharif, S.; Yada, R.Y. Transparency in food supply chains: A review of enabling technology solutions. Trends Food Sci. Technol. 2019, 91, 240–247. [Google Scholar] [CrossRef]
  11. Dickinson, D.; Bailey, D.V. Meat traceability: Are US consumers willing to pay for it? DeeVon Bailey 2002, 27, 348–364. [Google Scholar] [CrossRef]
  12. Yang, L. The Use of ICT Can Improve Food Safety (2016-10). Available online: https://laoyaoba.com/n/616432 (accessed on 20 September 2023).
  13. Chinnasamy, P.; Geetha, R.; Geetha, S.; Balakannan, S.P.; Ramprathap, K.; Praveena, V. Secure Smart Green House Farming using Blockchain Technology. Turk. J. Comput. Math. Educ. 2021, 12, 2858–2865. [Google Scholar] [CrossRef]
  14. Tianmu Fruit Shoots. Available online: https://baijiahao.baidu.com/s?id=1707152353956028114&wfr=spider&for=pc (accessed on 20 September 2023).
  15. Application of Blockchain Technology in the Field of Food Safety. Available online: https://baijiahao.baidu.com/s?id=1759964240063048067&wfr=spider&for=pc (accessed on 20 September 2023).
  16. Alibaba Released the World’s First Authentic Traceability Function. Available online: https://www.sohu.com/a/228278654_100035093 (accessed on 20 September 2023).
  17. Hu, S.; Huang, S.; Qin, X. Exploring blockchain-supported authentication based on online and offline business in organic agricultural supply chain. Comput. Ind. Eng. 2022, 173, 108738. [Google Scholar] [CrossRef]
  18. Dionne, K.Y.; Horowitz, J. The Political Effects of Agricultural Subsidies in Africa: Evidence from Malawi. World Dev. 2016, 87, 215–226. [Google Scholar] [CrossRef] [PubMed]
  19. Papadopoulos, S.; Zafeiriou, E.; Karelakis, C.; Koutroumanidis, T. Organics or not? Prospects for uptaking organic farming. New Medit. 2018, 17, 13–22. [Google Scholar] [CrossRef]
  20. Dou, C.; Cui, L.; Li, C. Can Information Intervention Enhance Consumers’ Purchase Intentions of Organic Agricultural Products? A Choice Experiment Based on Organic Milk. J. Healthc. Eng. 2022, 2022, 1256796. [Google Scholar] [CrossRef] [PubMed]
  21. Liang, A.R.-D.; Lim, W.-M. Why do consumers buy organic food? Results from an S-O-R model. Asia Pac. J. Mark. Logist. 2021, 33, 396–417. [Google Scholar] [CrossRef]
  22. Perlman, Y.; Ozinci, Y.; Westrich, S. Pricing decisions in a dual supply chain of organic and conventional agricultural products. Ann. Oper. Res. 2022, 314, 601–616. [Google Scholar] [CrossRef]
  23. Pu, X.; Xu, Z.; Huang, R. Entry mode selection and its impact on the competition between organic and conventional agricultural products. J. Clean. Prod. 2020, 274, 122716. [Google Scholar] [CrossRef]
  24. Ozinci, Y.; Perlman, Y.; Westrich, S. Competition between organic and conventional products with different utilities and shelf lives. Int. J. Prod. Econ. 2017, 191, 74–84. [Google Scholar] [CrossRef]
  25. Liu, K.; Lan, Y.; Li, W.; Cao, E. Behavior-Based Pricing of Organic and Conventional Agricultural Products Based on Green Subsidies. Sustainability 2019, 11, 1151. [Google Scholar] [CrossRef]
  26. Liu, P.; Zhang, Z.; Dong, F.-Y. Subsidy and pricing strategies of an agri-food supply chain considering the application of Big Data and blockchain. Rairo-Oper. Res. 2022, 56, 1995–2014. [Google Scholar] [CrossRef]
  27. Liu, P.; Cui, X.; Li, Y. Subsidy policies of a fresh supply chain considering the inputs of blockchain traceability service system. Sci. Public Policy 2023, 50, 72–86. [Google Scholar] [CrossRef]
  28. Ye, F.; Liu, S.; Li, Y.; Zhan, Y.; Cai, Z.; Kumar, A. Early Adopter or Follower? The Strategic Equilibrium of Blockchain Technology Adoption Strategy for Competing Agri-Food Supply Chains. IEEE Trans. Eng. Manag. 2022, 1–15. [Google Scholar] [CrossRef]
  29. Xu, J.; Cai, J.; Yao, G.; Dai, P. Strategy Optimization of Quality Improvement and Price Subsidy of Agri-Foods Supply Chain. Foods 2022, 11, 1761. [Google Scholar] [CrossRef] [PubMed]
  30. Cao, B.-B.; Zhu, M.-F.; Tian, Q. Optimal Operation Policies in a Cross-Regional Fresh Product Supply Chain with Regional Government Subsidy Heterogeneity to Blockchain-Driven Traceability. Mathematics 2022, 10, 4592. [Google Scholar] [CrossRef]
  31. Du, H.; Lu, K. Visualization service investment strategies for a self-operated fresh agricultural product e-tailer. J. Retail. Consum. Serv. 2023, 75, 103455. [Google Scholar] [CrossRef]
  32. Wang, M.; Zhao, L. Disposable or reusable? Packaging strategy and pricing decision for fresh food considering environmental policies. Int. Trans. Oper. Res. 2022, 31, 1149–1177. [Google Scholar] [CrossRef]
  33. Tan, C.; Zeng, Y.; Ip, W.H.; Wu, C.H. B2C or O2O? The strategic implications for the fresh produce supply chain based on blockchain technology. Comput. Ind. Eng. 2023, 183, 109499. [Google Scholar] [CrossRef]
  34. Liu, P.; Wang, S. Logistics Outsourcing of Fresh Enterprises Considering Fresh-Keeping Efforts Based on Evolutionary Game Analysis. IEEE Access 2021, 9, 25659–25670. [Google Scholar] [CrossRef]
  35. Guo, F.; Zhang, T.; Huang, X.; Zhong, Y. Government Subsidy Strategies Considering Greenness on Agricultural Product E-Commerce Supply Chain. Mathematics 2023, 11, 1662. [Google Scholar] [CrossRef]
  36. Peng, H.; Pang, T. Optimal strategies for a three-level contract-farming supply chain with subsidy. Int. J. Prod. Econ. 2019, 216, 274–286. [Google Scholar] [CrossRef]
  37. Liu, P.; Zhang, Z.; Li, Y. Investment Decision of Blockchain-Based Traceability Service Input for a Competitive Agri-Food Supply Chain. Foods 2022, 11, 2981. [Google Scholar] [CrossRef]
  38. Zheng, Y.; Xu, Y.Q.; Qiu, Z.G. Blockchain Traceability Adoption in Agricultural Supply Chain Coordination: An Evolutionary Game Analysis. Agriculture 2023, 13, 184. [Google Scholar] [CrossRef]
  39. Liu, S.; Hua, G.; Kang, Y.; Cheng, T.C.E.; Xu, Y. What value does blockchain bring to the imported fresh food supply chain? Transport. Res. E-Logist. Transport. Rev. 2022, 165, 102859. [Google Scholar] [CrossRef]
  40. Li, Y.; Tan, C.; Ip, W.H.; Wu, C.H. Dynamic blockchain adoption for freshness-keeping in the fresh agricultural product supply chain. Expert Syst. Appl. 2023, 217, 119494. [Google Scholar] [CrossRef]
  41. Chu, L. Optimization method of fresh agricultural products cross-border e-commerce supply chain based on blockchain technology. Pak. J. Agric. Sci. 2023, 60, 415–423. [Google Scholar] [CrossRef]
  42. Wu, X.Y.; Fan, Z.P.; Cao, B.B. An analysis of strategies for adopting blockchain technology in the fresh product supply chain. Int. J. Prod. Res. 2021, 61, 3717–3734. [Google Scholar] [CrossRef]
  43. Li, C.; Yang, T.; Bian, Z. Does Environmental Education Always Contribute to Remanufacturing Supply Chain Development? Int. J. Environ. Res. Public Health 2023, 20, 4725. [Google Scholar] [CrossRef]
  44. Gong, B.; Zhang, H.; Gao, Y.; Liu, Z. Blockchain adoption and channel selection strategies in a competitive remanufacturing supply chain. Comput. Ind. Eng. 2023, 175, 108829. [Google Scholar] [CrossRef]
Figure 1. The supply chain structure of the proposed method.
Mathematics 12 00106 g001
Figure 2. The impact of a on q c B N q c N N ( δ = 2 , b = 0.4 , c o = 0.3 ).
Mathematics 12 00106 g002
Figure 3. The impact of a and r on q c B S q c N S : (a) a 0 < a < a 1 ( δ = 2 , b = 0.4 , c o = 0.3 , r = 0.5 ) and (b) a > a 1 and 0 < r < r 1 ( δ = 2 , b = 0.4 , c o = 0.3 , a = 2.2 ).
Mathematics 12 00106 g003
Figure 4. The impact of c o on profit difference ( δ = 2 , r = 0.5 ): (a) π R N S π R N N , (b) π P N S π P N N , (c) π R B S π R B N and (d) π P B S π P B N .
Mathematics 12 00106 g004
Figure 5. The supply chain members’ blockchain decision: (a) The retailer’s blockchain decision, (b) The producer’s blockchain decision.
Mathematics 12 00106 g005
Figure 6. A win-win area for blockchain decision by supply chain members.
Mathematics 12 00106 g006
Table 1. Definitions of the symbols.
SymbolsDefinitions
r 1 b δ 1 a 1 δ c o
a 1 1 + b δ 1 δ c o
F 1 a δ a δ 1 a δ 2 b 2 r c o + a δ 1 + ϕ b + r c o 2 16 a δ a δ 1 1 λ δ 1 δ r c o 2 + ϕ r 2 c o 2 16 δ 1 δ 1 λ
F 2 a δ a δ 1 a δ 2 b 2 c o + a δ 1 + ϕ b + c o 2 16 a δ a δ 1 1 λ δ 1 δ c o 2 + ϕ c o 2 16 δ 1 δ 1 λ
F 3 a δ a δ 1 a δ 2 r c o 2 b + a δ 1 + ϕ b + r c o 2 8 a δ a δ 1 λ δ 1 δ r c o 2 + ϕ r 2 c o 2 8 δ 1 δ λ
F 4 a δ a δ 1 a δ 2 c o 2 b + a δ 1 + ϕ b + c o 2 8 a δ a δ 1 λ δ 1 δ c o 2 + ϕ c o 2 8 δ 1 δ λ
Disclaimer/Publisher’s Note: The statements, opinions and data contained in all publications are solely those of the individual author(s) and contributor(s) and not of MDPI and/or the editor(s). MDPI and/or the editor(s) disclaim responsibility for any injury to people or property resulting from any ideas, methods, instructions or products referred to in the content.

