Article

A Visual Analytics Environment for Navigating Large Conceptual Models by Leveraging Generative Artificial Intelligence

by
Tyler J. Gandee
,
Sean C. Glaze
and
Philippe J. Giabbanelli
*
Department of Computer Science & Software Engineering, Miami University, Oxford, OH 45056, USA
*
Author to whom correspondence should be addressed.
Mathematics 2024, 12(13), 1946; https://doi.org/10.3390/math12131946
Submission received: 22 May 2024 / Revised: 18 June 2024 / Accepted: 20 June 2024 / Published: 23 June 2024
(This article belongs to the Special Issue Modeling Real-World Problems Using Complex Networks)

Abstract

:
While comprehensive knowledge networks can be instrumental in finding solutions to complex problems or supporting the development of detailed simulation models, their large number of nodes and edges can become a hindrance. When the representation of a network becomes opaque, they stop fulfilling their role as a shared representation of a system between participants and modelers; hence, participants are less engaged in the model-building process. Combating the information overload created by large conceptual models is not merely a matter of changing formats: shifting from an unwieldy diagram to enormous amounts of text does not promote engagement. Rather, we posit that participants need an environment that provides details on demand and where interactions with a model rely primarily on a familiar format (i.e., text). In this study, we developed a visual analytics environment where linked visualizations allow participants to interact with large conceptual models, as shown in a case study with hundreds of nodes and almost a thousand relationships. Our environment leverages several advances in generative AI to automatically transform (i) a conceptual model into detailed paragraphs, (ii) detailed text into an executive summary of a model, (iii) prompts about the model into a safe version that avoids sensitive topics, and (iv) a description of the model into a complementary illustration. By releasing our work open source along with a video of our case study, we encourage other modelers to use this approach with their participants. Their feedback and future usability studies are key to respond to the needs of participants by improving our environment given individual preferences, models, and application domains.

1. Introduction

The developments in generative artificial intelligence (AI) build on advances in applied mathematics and statistics, along with the computational resources to train models with billion parameters on massive datasets. Generative AI is now ubiquitous, with applications ranging from analyzing and creating text (i.e., natural language processing and natural language generation) to creating images (e.g., text-to-image generation). The tension between potentially transformative impacts (e.g., as intelligent assistants [1]) and inaccuracy (e.g., hallucination, biases) or improper use (e.g., plagiarism [2]) is one of the most pressing research questions of our times. For example, well-known tools such as ChatGPT and GPT-4 can be helpful mathematical assistants, with a level currently equivalent to an undergraduate student on several tasks [3], but they can lose focus when prompted repeatedly, and they still make frequent mistakes on seemingly simple tasks such as identifying whether some numbers are contained within a given interval [4].
In this study, we developed and used generative AI solutions in the context of modeling and simulation (M&S), which is an interdisciplinary area at the confluence of applied mathematics, computer science, and systems engineering. Generative AI can be used throughout the life cycle of M&S (Figure 1), starting with the creation of a conceptual model (i.e., a ‘sketch’ or ‘diagram’), then moving to a mathematical or formal model (e.g., using a language for specification such as SysML), implementing the specification as a computational model via computer code (e.g., NetLogo), and performing simulations to generate insights that are shared with end- users and/or analyzed to suggest revisions in the conceptual model [5,6,7]. Our focus was on conceptual modeling, which has been the subject of several studies in generative AI either to create models from text [8,9,10] or to explain models as text [11].
A conceptual model is the cornerstone of an M&S study. It provides a roadmap for modelers during the implementation stage and an important reference document during verification or later maintenance. Intuitively, engaging in an M&S study without a conceptual model would be akin to improvising the plumbing of a house without a diagram, trying to remember whether to connect a tap to the sewer or the water line. A conceptual model is also a boundary object, as it represents a shared understanding between modelers and stakeholders by clearly stating the constructs that must be included in the model along with their relationships. Given this role, Robinson stressed that a conceptual model must be in a format that is usable by both modelers and stakeholders [16]. There is thus a multitude of formats depending on the audience.
Regardless of whether stakeholders are domain experts or lay participants, formats that support participatory modeling efforts include causal maps [17]. They consist of a directed, labeled, typed network that specifies cause-and-effect relationships between concepts. The example in Figure 2a shows how smoking bans can lead to a decrease in heart attacks [18]. Positive and negative relationships are represented with “+” and “−”, respectively. Note that positive and negative do not mean that a causal effect is ‘good’ or ‘bad’; they encode quantitative relationships: one concept drives another one up (+) or down (−). For instance, smoking and smoking exposure increase the chances of someone having a heart attack; hence, the relationship is typed +.
While the minimal representation constraints of causal maps make them suitable when modeling with diverse participants, some models can have many cause-and-effect relationships. The Foresight Obesity Map is a case in point, as it had 108 nodes and was derided as “[looking] more like a spilled plate of spaghetti than anything of use to policymakers” [19]—an enduring criticism echoed for over ten years [20]. This map is not an isolated case, as comprehensive models of complex socioenvironmental problems often yield large maps. Other causal maps of obesity have 98 [21] or 114 [22] factors and more than 100 relationships. Although conceptual models ought to be in a format usable by modelers and stakeholders, both would struggle to extract information from such large models. This can be a particularly frustrating experience for participants (e.g., subject matter experts) who spend time to contribute to a project but cannot benefit from the current visualization of the model other than stating the domain looks very complex.
There have been attempts to address the information overload problem [23], for instance, via visualization software for causal maps that start with a high-level view of the system and only show details on demand. However, a usability assessment noted that users needed a long time to complete tasks with such software, as a primary reliance on interacting with node-and-link diagrams is unusual for the target audience [24]. Narratives can be a powerful alternative to understanding conceptual models. For example, experiments showed that regular employees were better able to make sense of the relationships in a model when they were narrated, even if the narratives were noticeably longer (e.g., two sentences) than the shorthand notation (e.g., single word or symbol) [25]. While the advances in generative AI mentioned above have made it possible to transform a causal map into text, transforming the whole map would shift from a ‘visual’ information overload to a ‘textual’ overload, thus displacing the problem instead of fully addressing it. Environments for visual analytics suggest that a potential way forward is to combine text display including overlaid formatting (e.g., informative highlights) with linked visualizations [26]. So far, no environment has allowed users to interact with causal maps by combining text with visual representations.
Figure 2. Causal map examples of smoking and suicide in youth. (a) Mooney’s example of a simple causal map, showing how smoking bans in a population can lead to a decrease in heart attacks [18]. (b) High-definition causal map of suicide in relation to Adverse Childhood Experiences (ACEs) [27]. The ineffective yet classical visualization illustrates the challenge of exploring a large model.
Mathematics 12 01946 g002
In this study, we investigatee two research questions:
(Q1)
How can a user interact with large, complex conceptual models using generative AI?
(Q2)
Does the inclusion of generative AI into visual analytics support precise investigations into a conceptual model?
To address these questions, the main contribution of this study is providing a new environment to explore and explain causal maps by integrating generative AI (natural language generation and text-to-image generation) and visual analytics. Our environment combats the information overload problem by using details on demand to explore parts of the model, along with automatically generated narratives and illustrations. This approach allows users to simplify the information display while retaining all aspects of the original map.
The remainder of this paper is organized as follows: We provide the mathematical foundations of the technologies that support our work in Section 2, covering text embeddings, natural language generation, and text-to-image generation. This overview for applied mathematicians and statisticians complements other recent introductions to generative AI, such as [28]. Section 3 focuses on related works, including how large causal maps are developed, as well as defining common aims in visual analytics environments. In Section 4, we define how our data were preprocessed and present features of our application, including how they were implemented. In Section 5, we provide a case study of suicide in youth to demonstrate how one may answer research questions using our application. The case study invovled a previously released causal model of suicide in youth (Figure 2b), containing 361 nodes and 946 relationships, and thus illustrating the challenges caused by large conceptual models [27]. Lastly, in Section 6, we describe areas of future work where our application and study may be improved upon. The video of the case study and the open-source environment can be accessed on a third-party repository at https://doi.org/10.5281/zenodo.10578610 (last accessed on 21 May 2024).

2. Mathematical Foundations

2.1. Text Embeddings

Measuring the distance between two text segments is an important operation underlying a variety of applications. Searching or model building requires information retrieval operations in which candidate text segments are ranked with respect to another text segment (e.g., a user’s search query, a model’s existing terms) [29]. Clustering consists of creating groups in which distances between elements of the group are smaller than distances with elements assigned to other groups. Instead of comparing words, transformations are applied to obtain a vector space model [29], which assigns specific weights to indexed terms. In the 2000s to the 2010s, a common process started with text preprocessing (e.g., convert to lower case, tokenize, remove uninformative ‘stop’ words, obtain the roof form by stemming or lemmatization), obtained a real-valued vector via t f i d f , and then vectors were compared by cosine similarity [30]. t f i d f computes a weight for each term as follows [31]:
w i , j = t f i , j × l o g ( N d f i ) ,
where i is a term, j is a document within a collection/corpus of size N, t f i , j is the frequency of term i within j, and d f i is the document frequency of term i within the collection. Although the process does have parameters, we omit them for the sake of simplicity here; their use can be illustrated in studies such as [32]. The cosine similarity computes the angle between two t f i d f vectors v 1 and v 2 as:
c o s θ = v 1 × v 2 | | v 1 | | × | | v 2 | |
Since the t f i d f vectors are strictly positive, and the angle θ ranges from 0 to 90; hence, the cosine value ranges from 0 to 1.
Techniques such as t f i d f have been described as ‘traditional’ [33] or ‘non-contextual’, since the same word in different contexts would yield the same vector. In the early 2010s, techniques to produce more contextualized vector spaces such as Word2vec models were developed by using small neural networks. In the late 2010s, BERT (which has 12 layers in its base version) became a common baseline for NLP. To understand the mathematical foundations of BERT, consider that a language model focuses on the autoregressive probability of a sequence of tokens X 1 : T , as expressed by [34]
log p ( X 1 : T ) = t = 1 T log p ( x t | x 1 : T 1 )
BERT focuses on a masked language model to reconstruct a sequence from noise:
p ( x ¯ | x ^ ) = t = 1 T m t p ( x t | x ^ ) ,
where x ¯ is a corrupted sequence, x ^ are masked tokens, and m t is the mask (i.e., m t = 1 if x t is masked and 0 otherwise). As we previously described when using BERT [35],
[...] the text first undergoes an embedding process (24 to 36 million parameters depending on the model), followed by transformers (each of which adds 7 or 12.5 million parameters depending on the model), ending with a pooling layer (0.5 or 1 million more parameters depending on the model).
Most recently, emerging solution providers such as OpenAI have provided embeddings as a service, such as the second-generation text-embedding-ada-002 (ADA-002) used in GPT 3.5. This embedding is specifically recommended for text similarity, where it achieves a higher score than the first-generation embedding text-similarity-davinci-001. This is a proprietary solution; thus, the training data and specific architecture are not disclosed. The results are primarily analyzed with respect to intrinsic characteristics (e.g., vector space of 1536 dimensions) or performance on specific tasks. The findings clearly show that BERT and ADA-002 outperform the traditional tf-idf method [36]. The results are more mixed in comparing BERT and ADA-002, with some applications finding BERT to be slightly superior [36], while others found that ADA-002 is superior both to BERT (and variants thereof) [37] and to open-source alternatives [38].

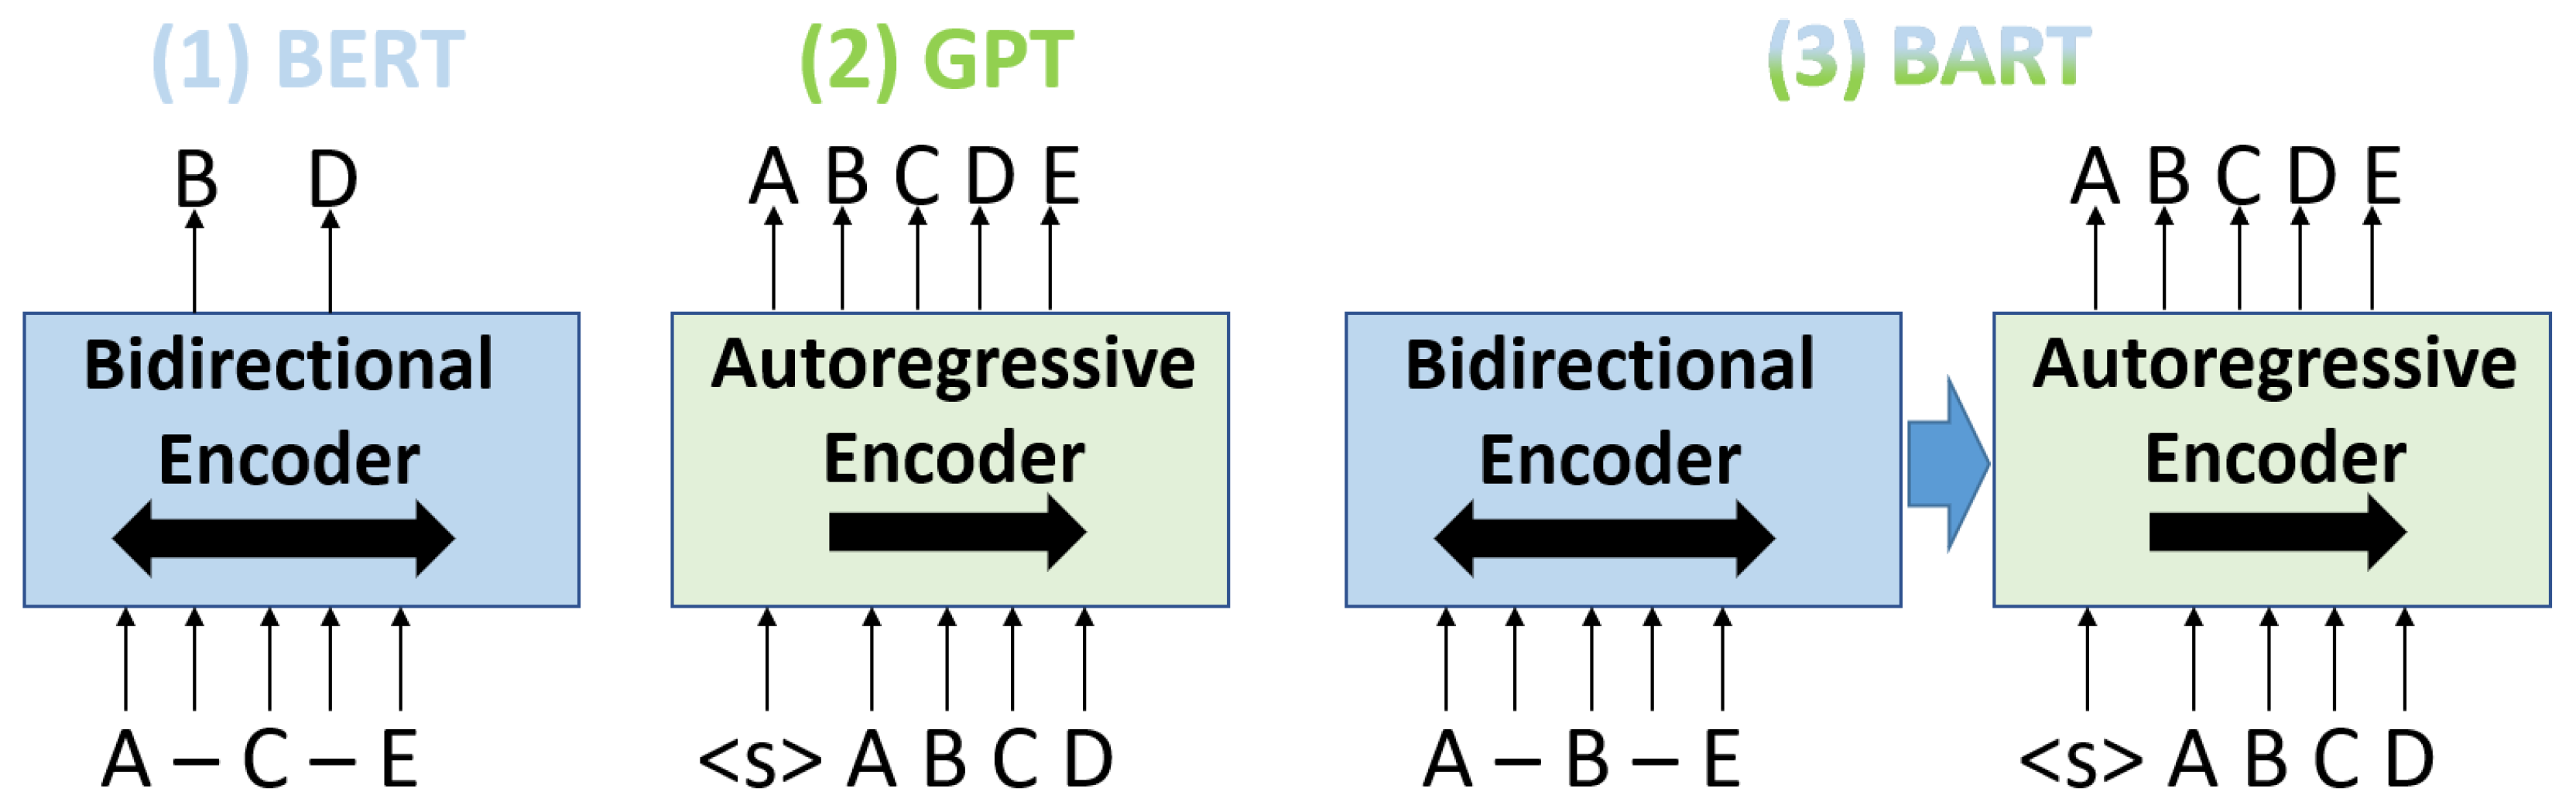
2.2. Natural Language Generation

Historically, the generation of text relied on hand-crafted rules or templates orchestrated around several modules such as discourse planning (to order sentences and paragraphs) or lexicalization (identifying the right words and phrases to convey relations and concepts) [39]. The results were satisfactory, but constructing and maintaining language resources were notoriously time-consuming efforts; thus, the shift to machine learning was of particular interest [40]. Research in intelligent tutoring system spearheaded development efforts in NLG, given the evidence that improvements in NLG could translate to improved learning outcomes for students [41]. Many studies in the 2010s developed artificial neural networks to create more effective intelligent tutoring systems [42]. As an example, recurrent neural networks (RNNs) were used to predict the probability of the next word, given the words that have occurred so far. Formally, consider a text input sequence formed of T words, w = { w 1 , , w T } . The input layer of the network at the next step t is calculated as [43]:
x ( t ) = w ( t ) + h ( t 1 ) ,
where h is the hidden state, expressed as
h ( t ) = σ ( W x ( t ) + U h ( t 1 ) ) ,
where W is the input weight, U is the recurrent connection weight vector, and σ is the sigmoid activation function. A final output layer commonly consists of a softmax function. While learning the weights that define a language is less time consuming than manually defining all the rules, it can introduce three problems: First, the output can diverge from the source document, which is known as a hallucination. Note that it covers two phenomena: intrinsic hallucinations are errors where the output contradicts the source (e.g., A ‘no longer’ causes B, or an event happened on a different date than specified), while extrinsic hallucinations augment the output using background information (leveraging the network’s knowledge model) that is not necessarily erroneous and can be harder to verify [44]. Second, if the network always produces the output with highest probability, then the text may become very repetitive [43]. Third, context is very important when generating text, and there may be important relationships (or ‘dependencies’) between words that are far apart in the text.
Several architectures have been proposed to address these problems. In particular, the (sequence-to-sequence) transformer architecture (which is not a recurrent neural network) underlies highly efficient solutions such as Generative Pretrained Transformer (GPT) and Bidirectional Encoder Representations from Transformers (BERT). Rather than a sigmoid, transformer architectures tend to use activation functions such as ReLU or a smoother alternative known as Gaussian Error Linear Units (GeLUs) and used in GPT or BART (Figure 3), defined by [45]
G E L U ( x ) = x P ( X x ) = x · 1 2 ( 1 + e r f ( x 2 ) ) 0.5 x ( 1 + t a n h ( 2 π × ( x + 0.044715 x 2 ) ) ) ,
where e r f is the Gauss error function.
The core components of a transformer architecture include an embedding layer to obtain a vector representation (see Section 2.1), followed by a stack of transformer layers, which consist of alternating multihead self-attention sublayers and position-wise feed-forward sublayers. Intuitively, the attention mechanism processes a query Q with respect to a dictionary of key K and value V pairs. It is defined by the following three equations [47]:
M u l t i h e a d ( Q , K , V ) = C o n c a t ( h e a d 1 , , h e a d H ) W O
h e a d k = A t t e n t i o n ( Q W k Q , K W k K , V W k V )
A t t e n t i o n ( Q , K , V ) = s o f t m a x ( Q K T d m o d e l ) × V ,
where d m o d e l is the dimensionality of the hidden representations; W k Q , W k K , and W k V are parameter matrices; H is the number of heads; d K and d V are the dimensionalities of keys and values.
Early versions of these architectures had small windows that could only handle a limited sequence of tokens (e.g., 512 tokens); thus, they missed contextual dependencies between words far apart. As context windows are now much larger, we speak of ‘long-range context modeling’ or long-range transformers. For example, GPT-4 Turbo and GPT-4o have a context length of 128k tokens.

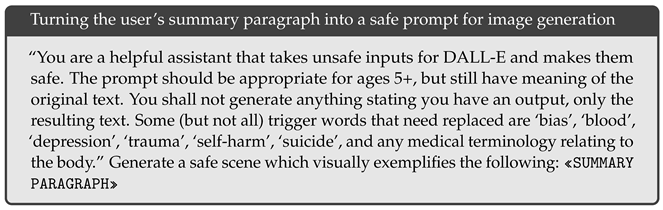
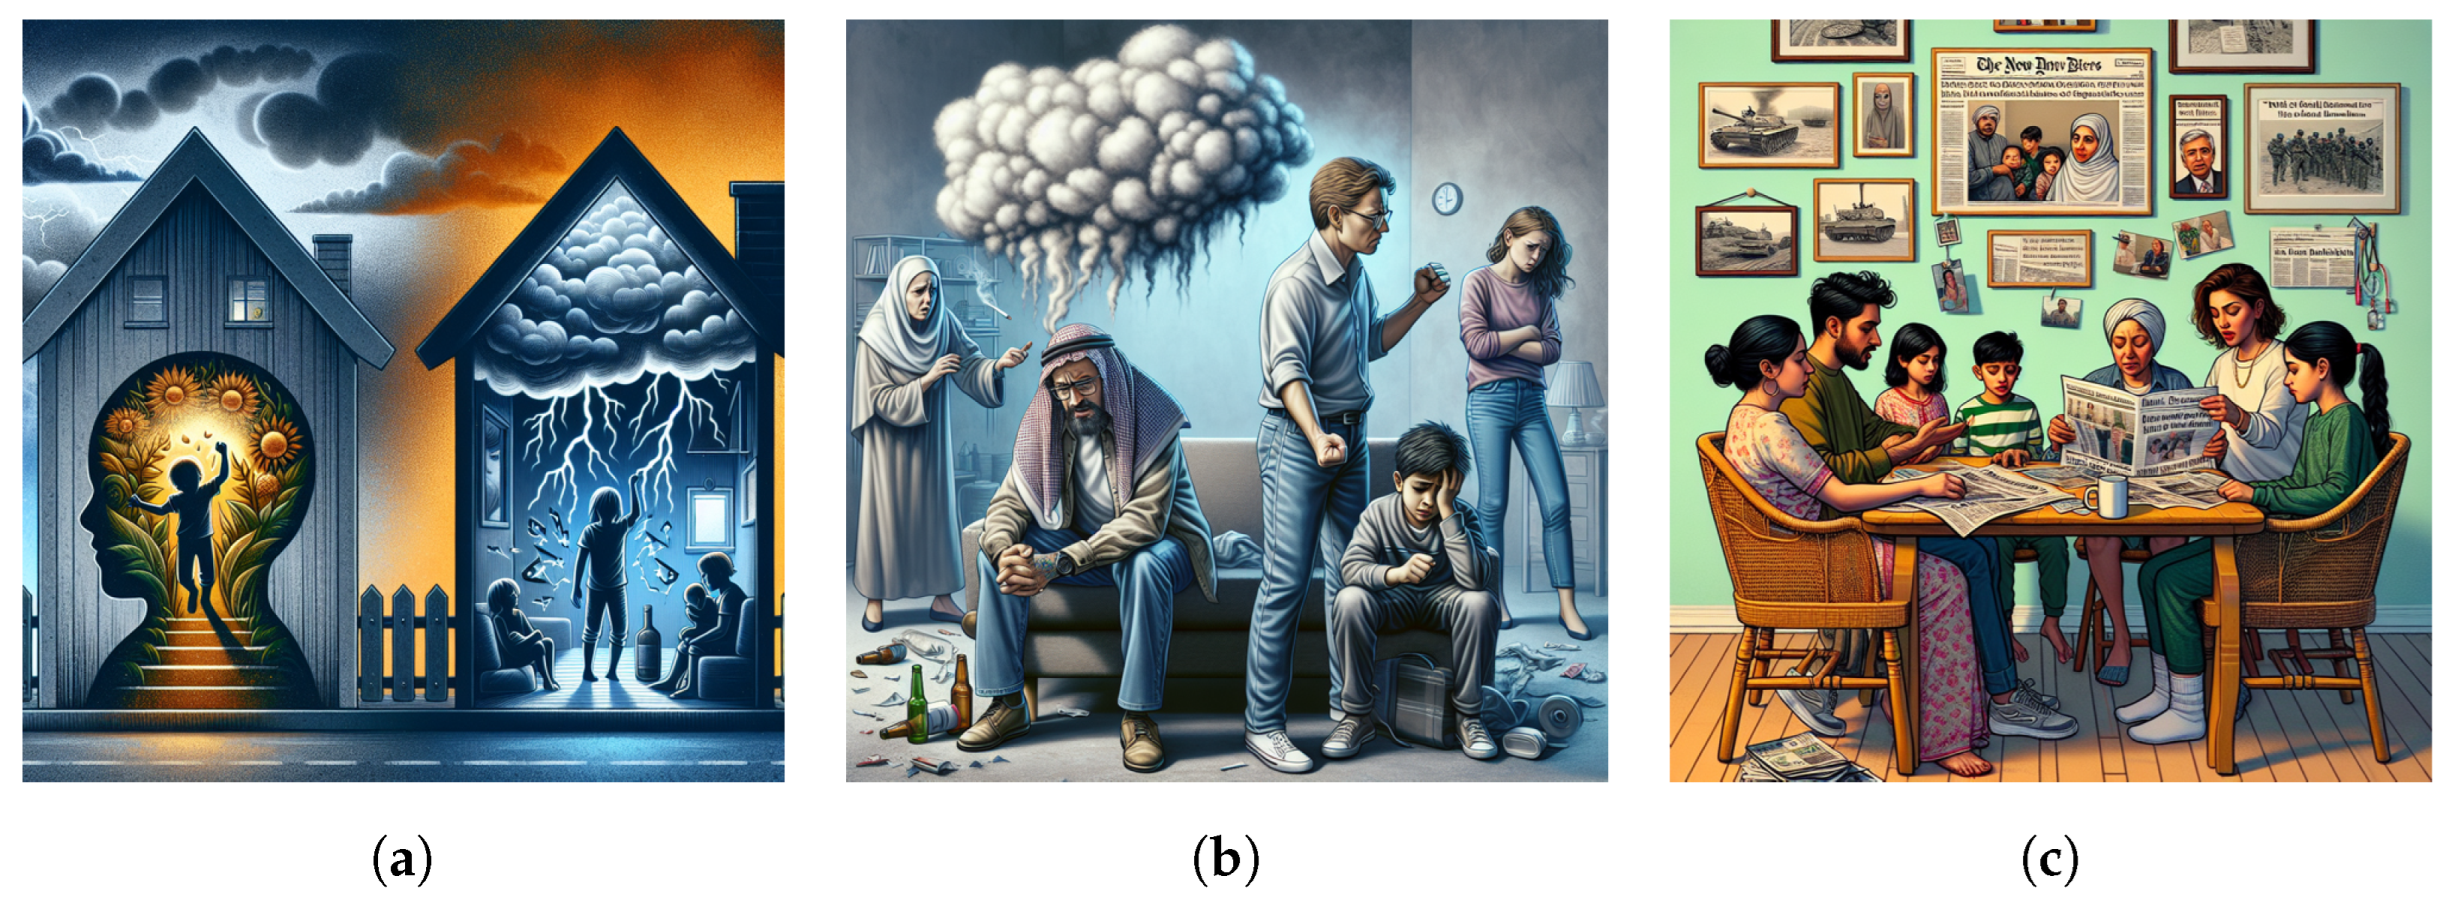
2.3. Text-to-Image Generation

As summarized by Ding et al. [48], text-to-image generation is subject to several challenging expectations that include understanding an input text (e.g., “A researcher typing a paper. The faculty has a red hat.”), disentangling the properties of objects (e.g., shape and color of a hat, gesture of typing), aligning the objects with words and their context-dependent variation (e.g., faculty = researcher = image of a person), and ultimately creating a composite view of these objects (e.g., hat on head, hands on a keyboard). Achieving these expectations has been made possible through rapid advances in neural network architectures over the last decade, such as generative adversarial networks (GANs) in the 2010s [49]. The 2020s have seen the emergence of powerful sampling-based approaches such as autoregressive generative models or diffusion processes, building on architectures such as transformers with several billion parameters (e.g., to learn a probability density function over pixels of an image) and variational autoencoders (VAEs), whose compression techniques allow the scaling of computations over large images [50]. As well-known models in the text-to-image space continue to be updated, their architectures can change. For example, DALL-E uses a transformer and VAE, while DALL-E 2 switches to a diffusion transformer.
Diffusion processes are now accessed by a broad array of users, via midjourney or stable diffusion. These processes gradually distort training images by adding noise, thus erasing details until the image becomes unrecognizable. The model is then trained to reverse this process, by gradually eliminating noise to produce an image. For the sake of efficiency, latent diffusion performs the process in a lower-dimensional space, i.e., the latent space. The user sends a text request (i.e., a prompt) such as “A researcher typing a paper. The faculty has a red hat”. The prompt is tokenized and transformed into text embeddings by a text encoder using contrastive language-image pretraining (CLIP), such as CLIP ViT-L or OpenCLIP ViT-bigG. A random number (‘seed’) is used to generate the random noise, which is the starting point for the image [51]. A convolutional neural network (e.g., U-Net) takes in the image along with the text embeddings and works alongside a scheduling algorithm to iteratively denoise the image. As the last step, the image is processed by an autoencoder (VAE) to generate the final output (Figure 4). Note that variations in this process (e.g., Stable Diffusion XL) use a second noising–denoising process, which is known as the ‘refinement stage’ and specializes in enhancing local details [52]. In order to understand the mathematical underpinnings of the crucial denoising step, we follow the notation from Song et al. [53], who introduced the denoising diffusion implicit model (DDIM) scheduling algorithm. A denoising model takes the following form:
p p a r a m s ( x 0 ) = p p a r a m s ( x 0 : T ) d x 1 : T ,
where
p p a r a m s ( x 0 : T ) : = p p a r a m s ( x T ) t = 1 T p p a r a m s ( t ) ( x t 1 | x t )
where x 1 , , x T are latent variables. The parameters are learned to fit the samples from a data distribution. The forward process ranges from x 0 to x T ; it gradually adds noise to the observation x 0 . In contrast, p p a r a m s ( x 0 : T ) is a reverse process because it samples from x T to x 0 by gradually removing noise (it can be viewed as a form of gradual decoding). Approximating the reverse process is the core step, with different algorithms trying to strike a balance between processing speed and image quality. For a detailed discussion on the equations involved in iteratively refining noise, we refer the reader to [54].
The training set can also be improved not only in quantity (i.e., more pairs of images and captions) but also in quality, as human-annotated data may be incorrect or include key characteristics that viewers consider obvious ‘by default’ (e.g., water in a pool, table and chair in an office) or seemingly unimportant (e.g., location of some objects in a scene). Improving captions can be its own machine learning task, as shown in DALL-E 3, which was trained on 5% ground-truth (human-annotated) captions and 95% long and highly descriptive (synthetic/generated) captions created by an image captioner [55]. Since generative models may underperform when sampled out of their distribution, training a model on long captions could be a problem for users who write shorter prompts; this is addressed by using GPT-4 to expand (or ‘upsample’) a user’s caption and disambiguate terms. As pointed out by the authors, the weaknesses of the image captioner become the weaknesses of the text-to-image generator, for instance, the captioner struggles with spatial awareness (e.g., above, next to), so DALL-E 3 is also less reliable with positional information in a prompt. Note that the inclusion of an LLM as part of text-to-image generation is found in other models, such as RPG, which uses an LLM to extend the user’s prompt into more detailed descriptions (i.e., recaption) and uses an LLM to plan the composition of the image [56].

3. Background

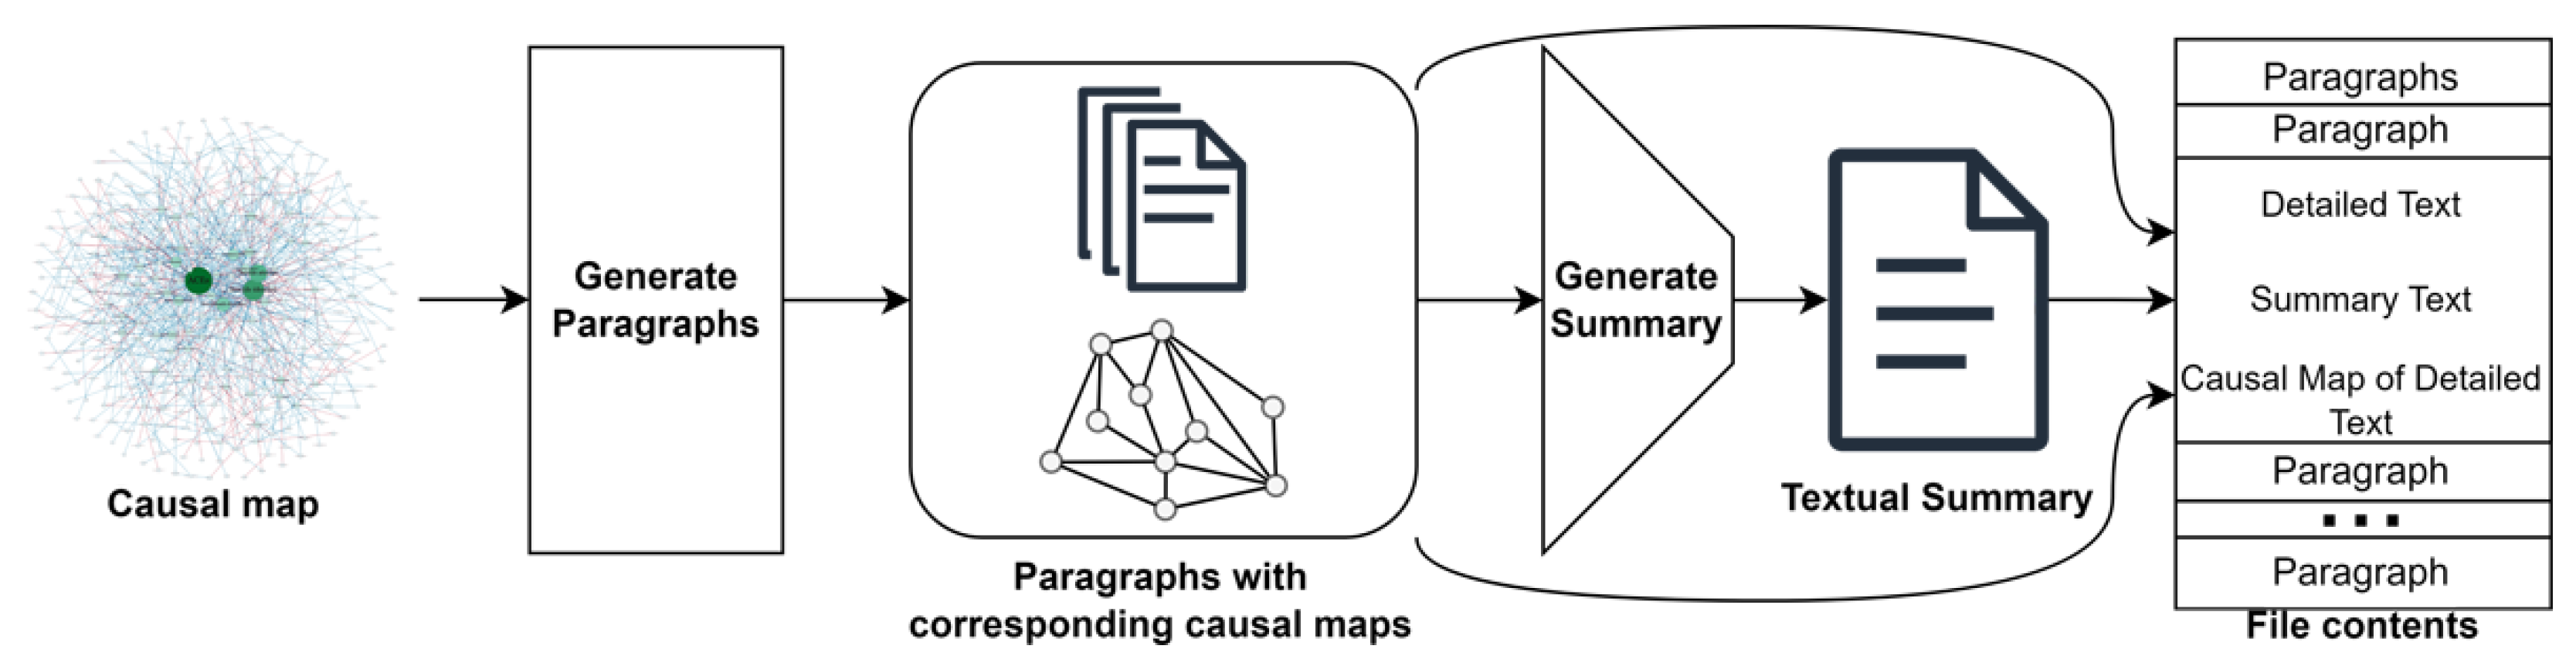
3.1. From Large Causal Maps to Text

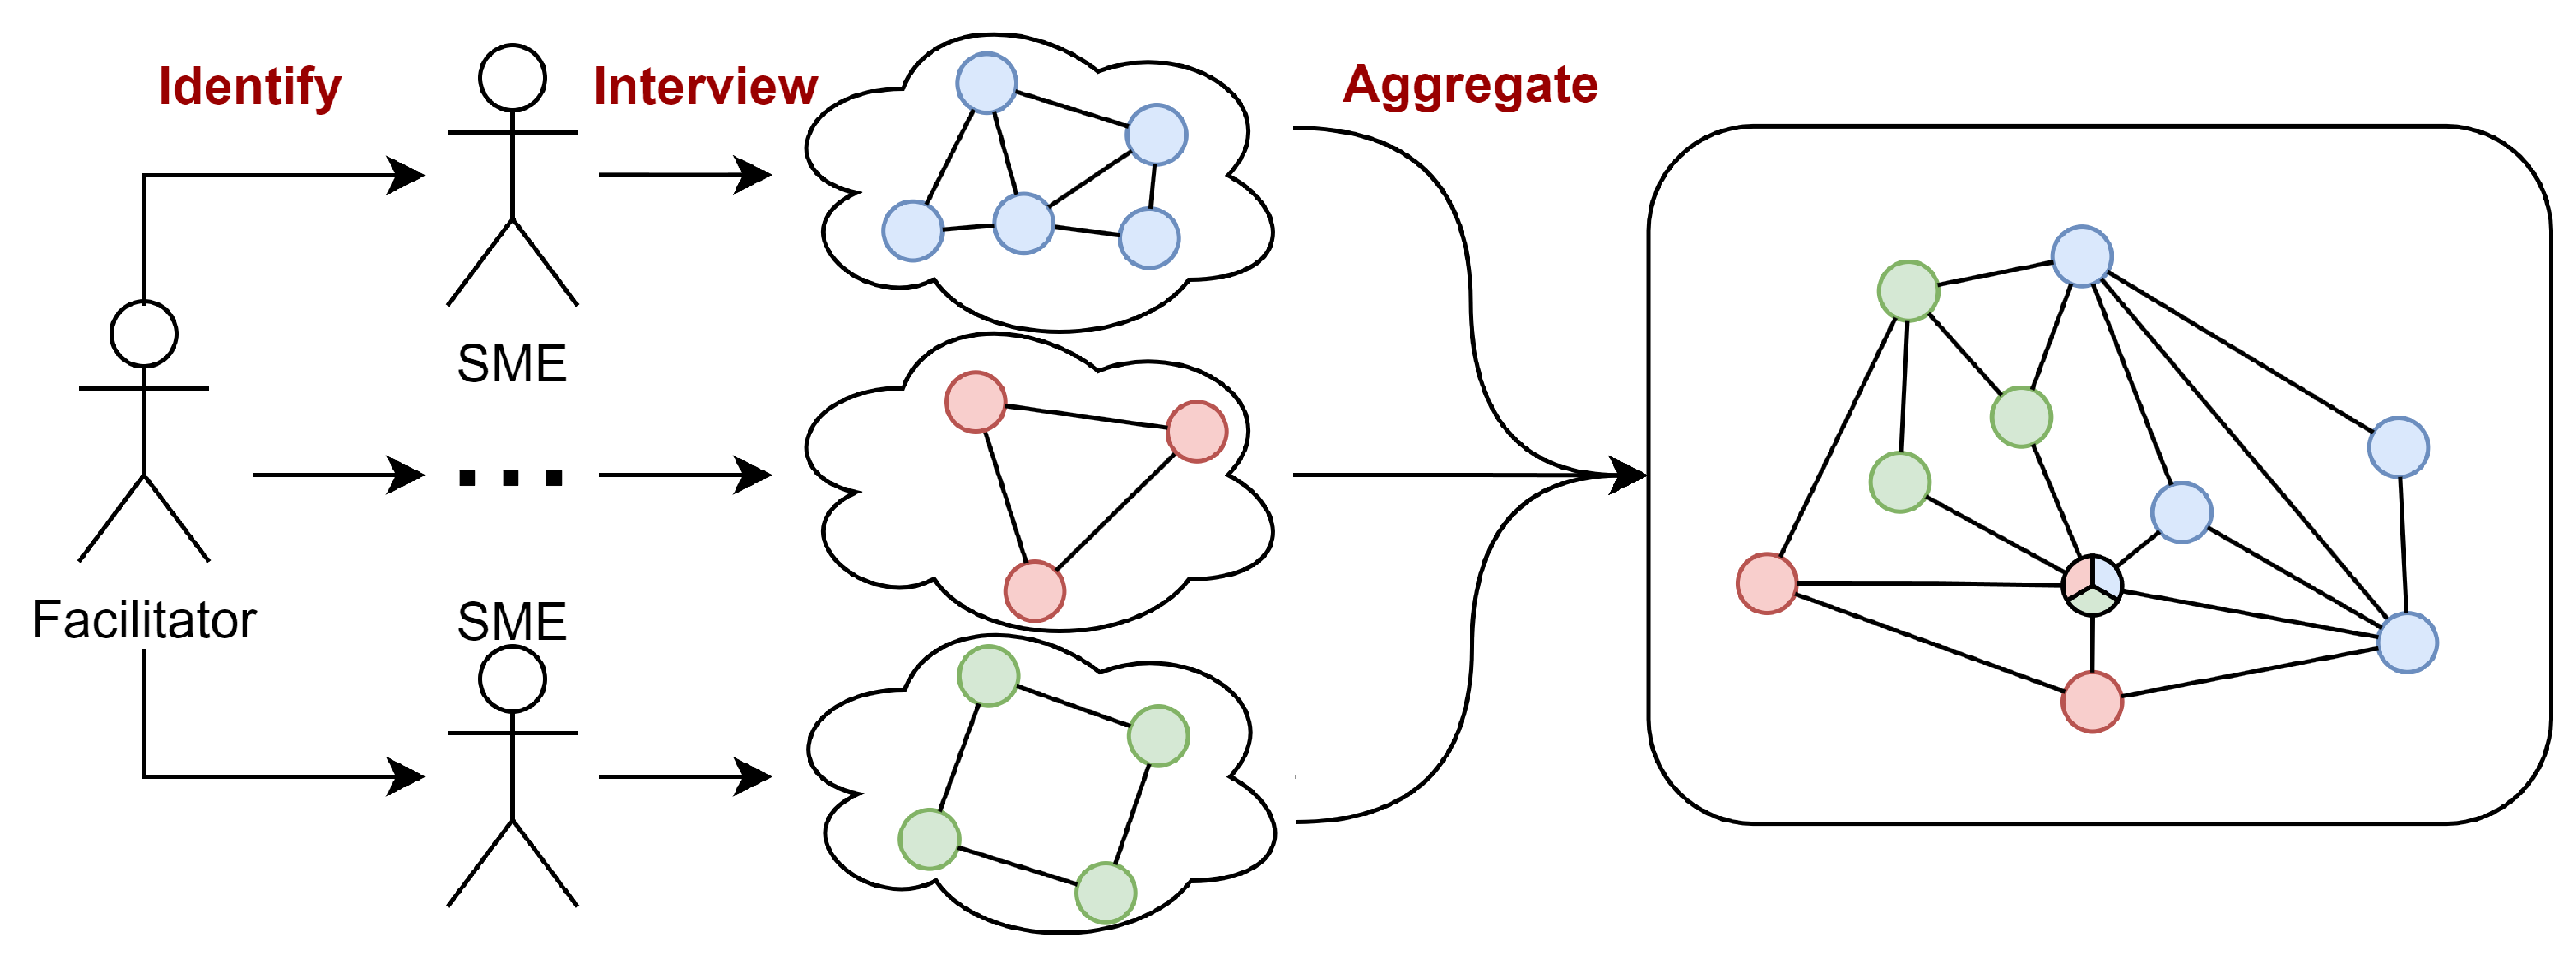
3.1.1. Why Causal Maps Become Large: Elicitation and Aggregation

In participatory modeling, conceptual models are created in collaboration with facilitators and participants such as Subject Matter Experts (SMEs) [27]. Facilitators interview participants of different backgrounds, where each interview creates an independent causal map. For example, in Figure 2a, the facilitator could ask several follow-up questions to continue building the model, such as “why do people smoke?” or “what happens after someone has a heart attack?” While asking many questions is beneficial to fully comprehend the problem space (and grow closer to a complete causal map [57]), this means that an individual map may have several dozen nodes and edges. Furthermore, SMEs come from different backgrounds with various experiences. Thus, even if each interview uses the same questions, the models would have differences. For example, a policymaker may understand steps on how to promote policies regarding the use of tobacco or nicotine, while a cardiologist may know of other effects that smoking or smoking exposure can cause. There may also be differences in terminology, e.g., one Subject Matter Expert (SME) might use the term “smoking”, while another expert uses “tobacco use”. To obtain the final map, different terminologies are mapped onto one form, and an aggregate algorithm is applied (Figure 5). The nodes and edges shared across participants provide a form of validity, while rare constructs may be filtered out [58].

3.1.2. Preprocessing: Preparing Two Levels of Text and Subgraphs

One of the first studies in natural language generation for causal maps decomposed a map into a set of small acyclic components and generated sentences for each component [12]. A causal map thus became a long set of sentences. We made two key changes in our recent work [59]. First, a report must be formed of paragraphs with a topic and flow. We used the LPAM community detection [60] method to balance the size of each community, avoid any loss in nodes or edges, and provide overlapping communities. We traversed the map by organizing communities thanks to their overlap to ensure that one paragraph pivots to the next based on a shared construct. Each GPT-generated paragraph narrates a portion of the causal map (i.e., subgraph), and the union of these paragraphs provides the same information as in the whole map. However, a sizable causal map leads to many paragraphs, which shifts the information overload of seeing a large graph into the information overload of reading masses of text. Our second change was running the detailed text through a summarization model (using BART [46]) to generate our ‘summary text’. The visual analytics environment presented here serves to relate the summary text to the detailed paragraphs and corresponding subgraph. The input to the environment is thus the causal map, along with the detailed text and summary text obtained from prior works. To streamline the user experience, it is possible to only ask for the causal map and automatically create the detailed and summary text; however, creating the text every time a causal map is selected would consume many tokens on OpenAI; we thus recommend dissociating the preprocessing from the visual analytics environment by computing the text just once and saving it.

3.1.3. Leveraging AI to Enable Transformations

The use of generative AI (particularly OpenAI’s GPT) has aided with converting causal maps into a textual representation. Our work builds on a prior open-source solution [6,12]. First, note that text is read left-to-right, but causal maps may have loops. For instance, trauma may increase suicidal thoughts, leading to a suicide attempt, which is itself a traumatic event. A graph-to-text solution starts by decomposing causal maps into acyclic subgraphs. Subgraphs are identified via community detection to ensure that the corresponding paragraph has a logical theme. A community detection algorithm takes a graph as input, consisting in our case of a causal map. It divides the graph into parts, consisting of groups of nodes and edges. These parts are called communities. Intuitively, nodes in one community should be more tightly linked to each other than to nodes outside the community.
The subgraphs are ordered through a graph traversal process, so that paragraphs have a flow from one to the next. Generative AI naturally involves randomness to ensure flexible and robust outputs while also giving users options to find satisfactory parameter values [61]. We thus cannot guarantee that the text is identical to the original map due to the possibility of missing information or when the information that the Large Language Model (LLM) has injected does not exist in the map, which are known as hallucinations [62]. This issue is one of many ongoing errors with Large Language Models (LLMs) [63,64].

3.2. Combating Information Overload with Visual Analytics

Information overload refers to an overwhelming amount of data being presented to a user at a time. It can be caused by displaying irrelevant data, as well as processing or presenting data in an unsuitable manner [23], resulting in a lack of transparency where users may miss substantial information. In Figure 2b, a node’s size and color depend on its centrality, as demonstrated by the two largest nodes being ACEs and suicide ideation. It is already arduous to identify the relationships with either of these nodes, which would be even harder if all nodes were the same size. To mitigate information overload, we turn to visual analytics to organize our data, and we display some information to the user (i.e., on the front-end) while maintaining all the model’s information (i.e., on the back-end).
Visual analytics aim to ensure transparency of information, while also presenting information in an organized manner [65]. Specifically, these environments have three main features: a visual representation of the data, interactivity to provide details on demand, and a search or filter to focus on specific data points. For each environment, the primary feature for displaying a large amount of data is visual representation. These visuals typically take the shape of a graph to represent the dataset in its entirety [66]. There may be other methods to represent the same information, such as a textual representation of the map. The visualization features aim to maximize the amount of information shown while presenting it in a minimalistic manner [66].
Simplifying a large amount of data improves the usability of an application. ItThiscould be achieved by removing the information or by hiding it temporarily. Under the approach of ‘details-on-demand’, a summarized data point is an interactive object that can provide further information (e.g., a sentence is expanded into a paragraph). Therefore, while the visual representation of data is simplified, the overall amount of data is preserved and remains hidden until the user requests further information [66]. This allows a large amount of data to be digested at a rate that is more manageable for users instead of displaying all the information at once. For example, we can observe Dowling et al.’s Cosmos application, which combines visual analytics with text analytics to plot documents on a two-dimensional plane [66]. Each plot represents all of the text in a document. The plots can be interacted with to provide the details of the desired document. Thus, the application successfully holds all original information until the user needs to expand on specific points.
Document corpora can vary in size with respect to the number of documents and the amount of total text within the corpus. Furthermore, various topics may be relevant in a field but not necessary for a user’s case. Therefore, having a filtering feature aids with further reducing the amount of data to a select number of items, such that the user can seek further details on few items rather than every possible item. This can be observed in TRIVIR [65]. An initial query is specified by the user, and further keywords may be used for filtering until the user is satisfied with the number of keywords or with the number of documents being displayed. Having a search feature in an environment significantly improves a user’s speed of traversing a corpus, rather than sequentially reading all documents in such corpus.

4. Methods

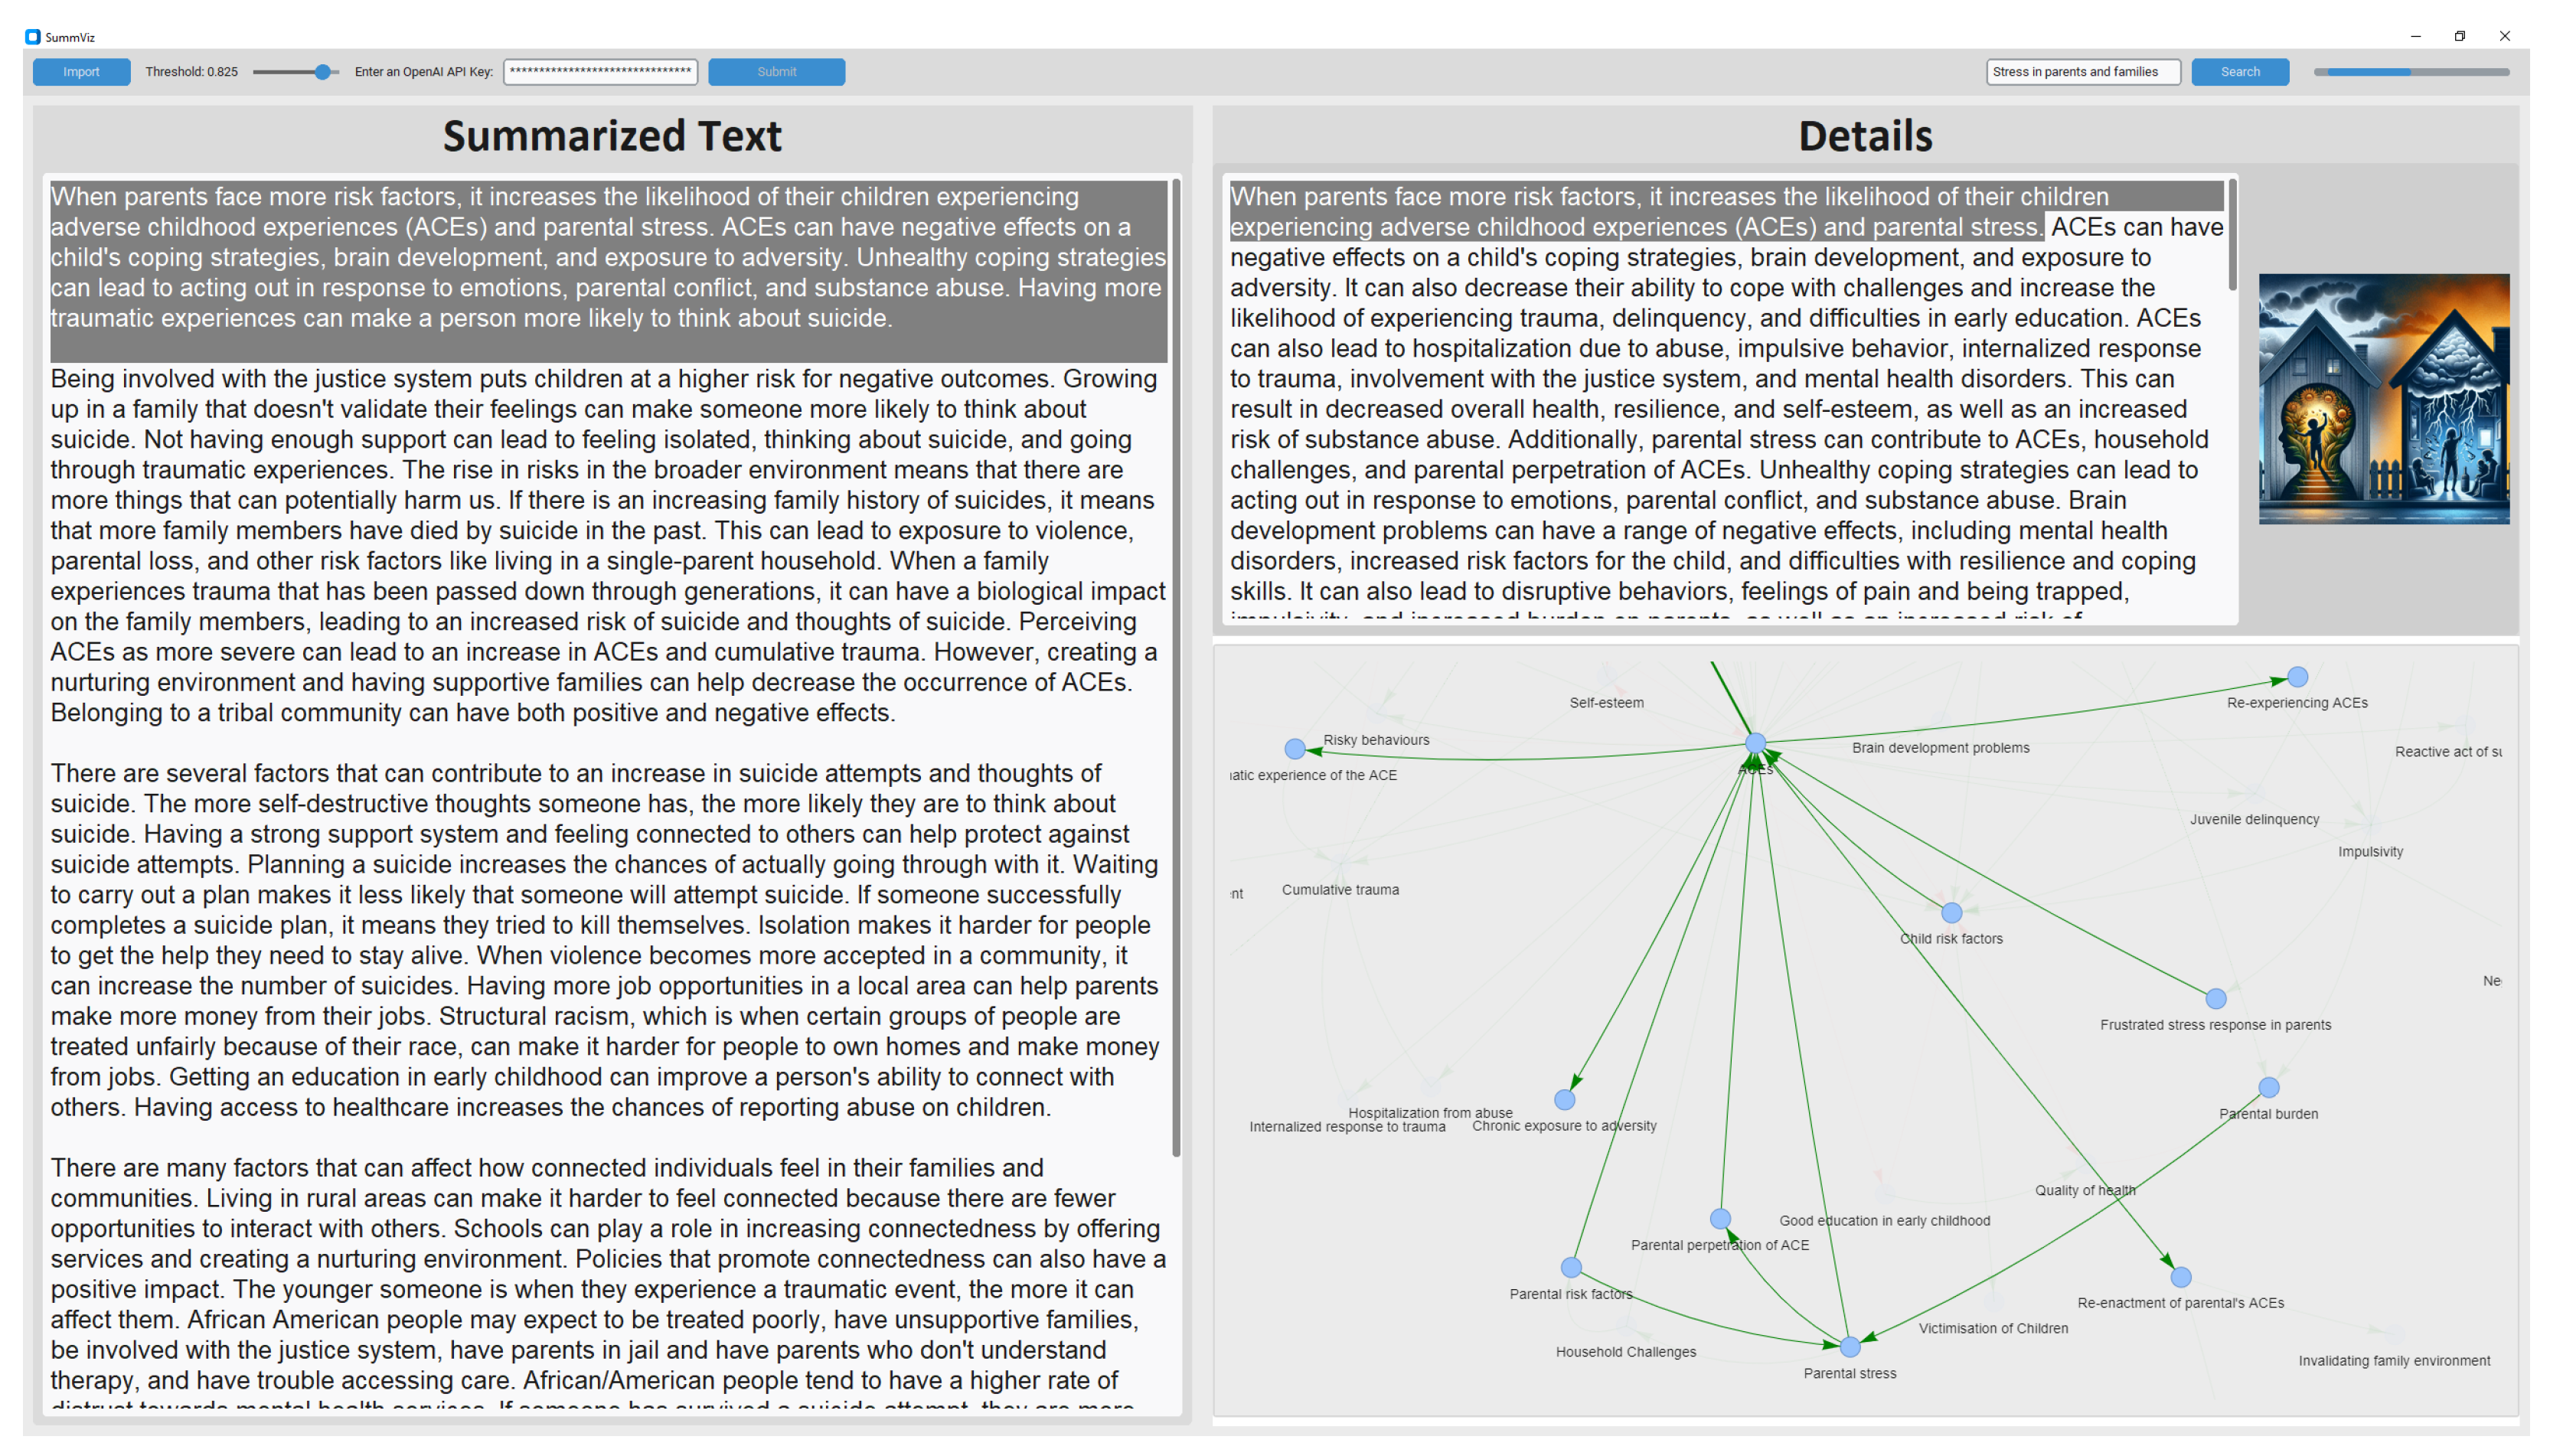
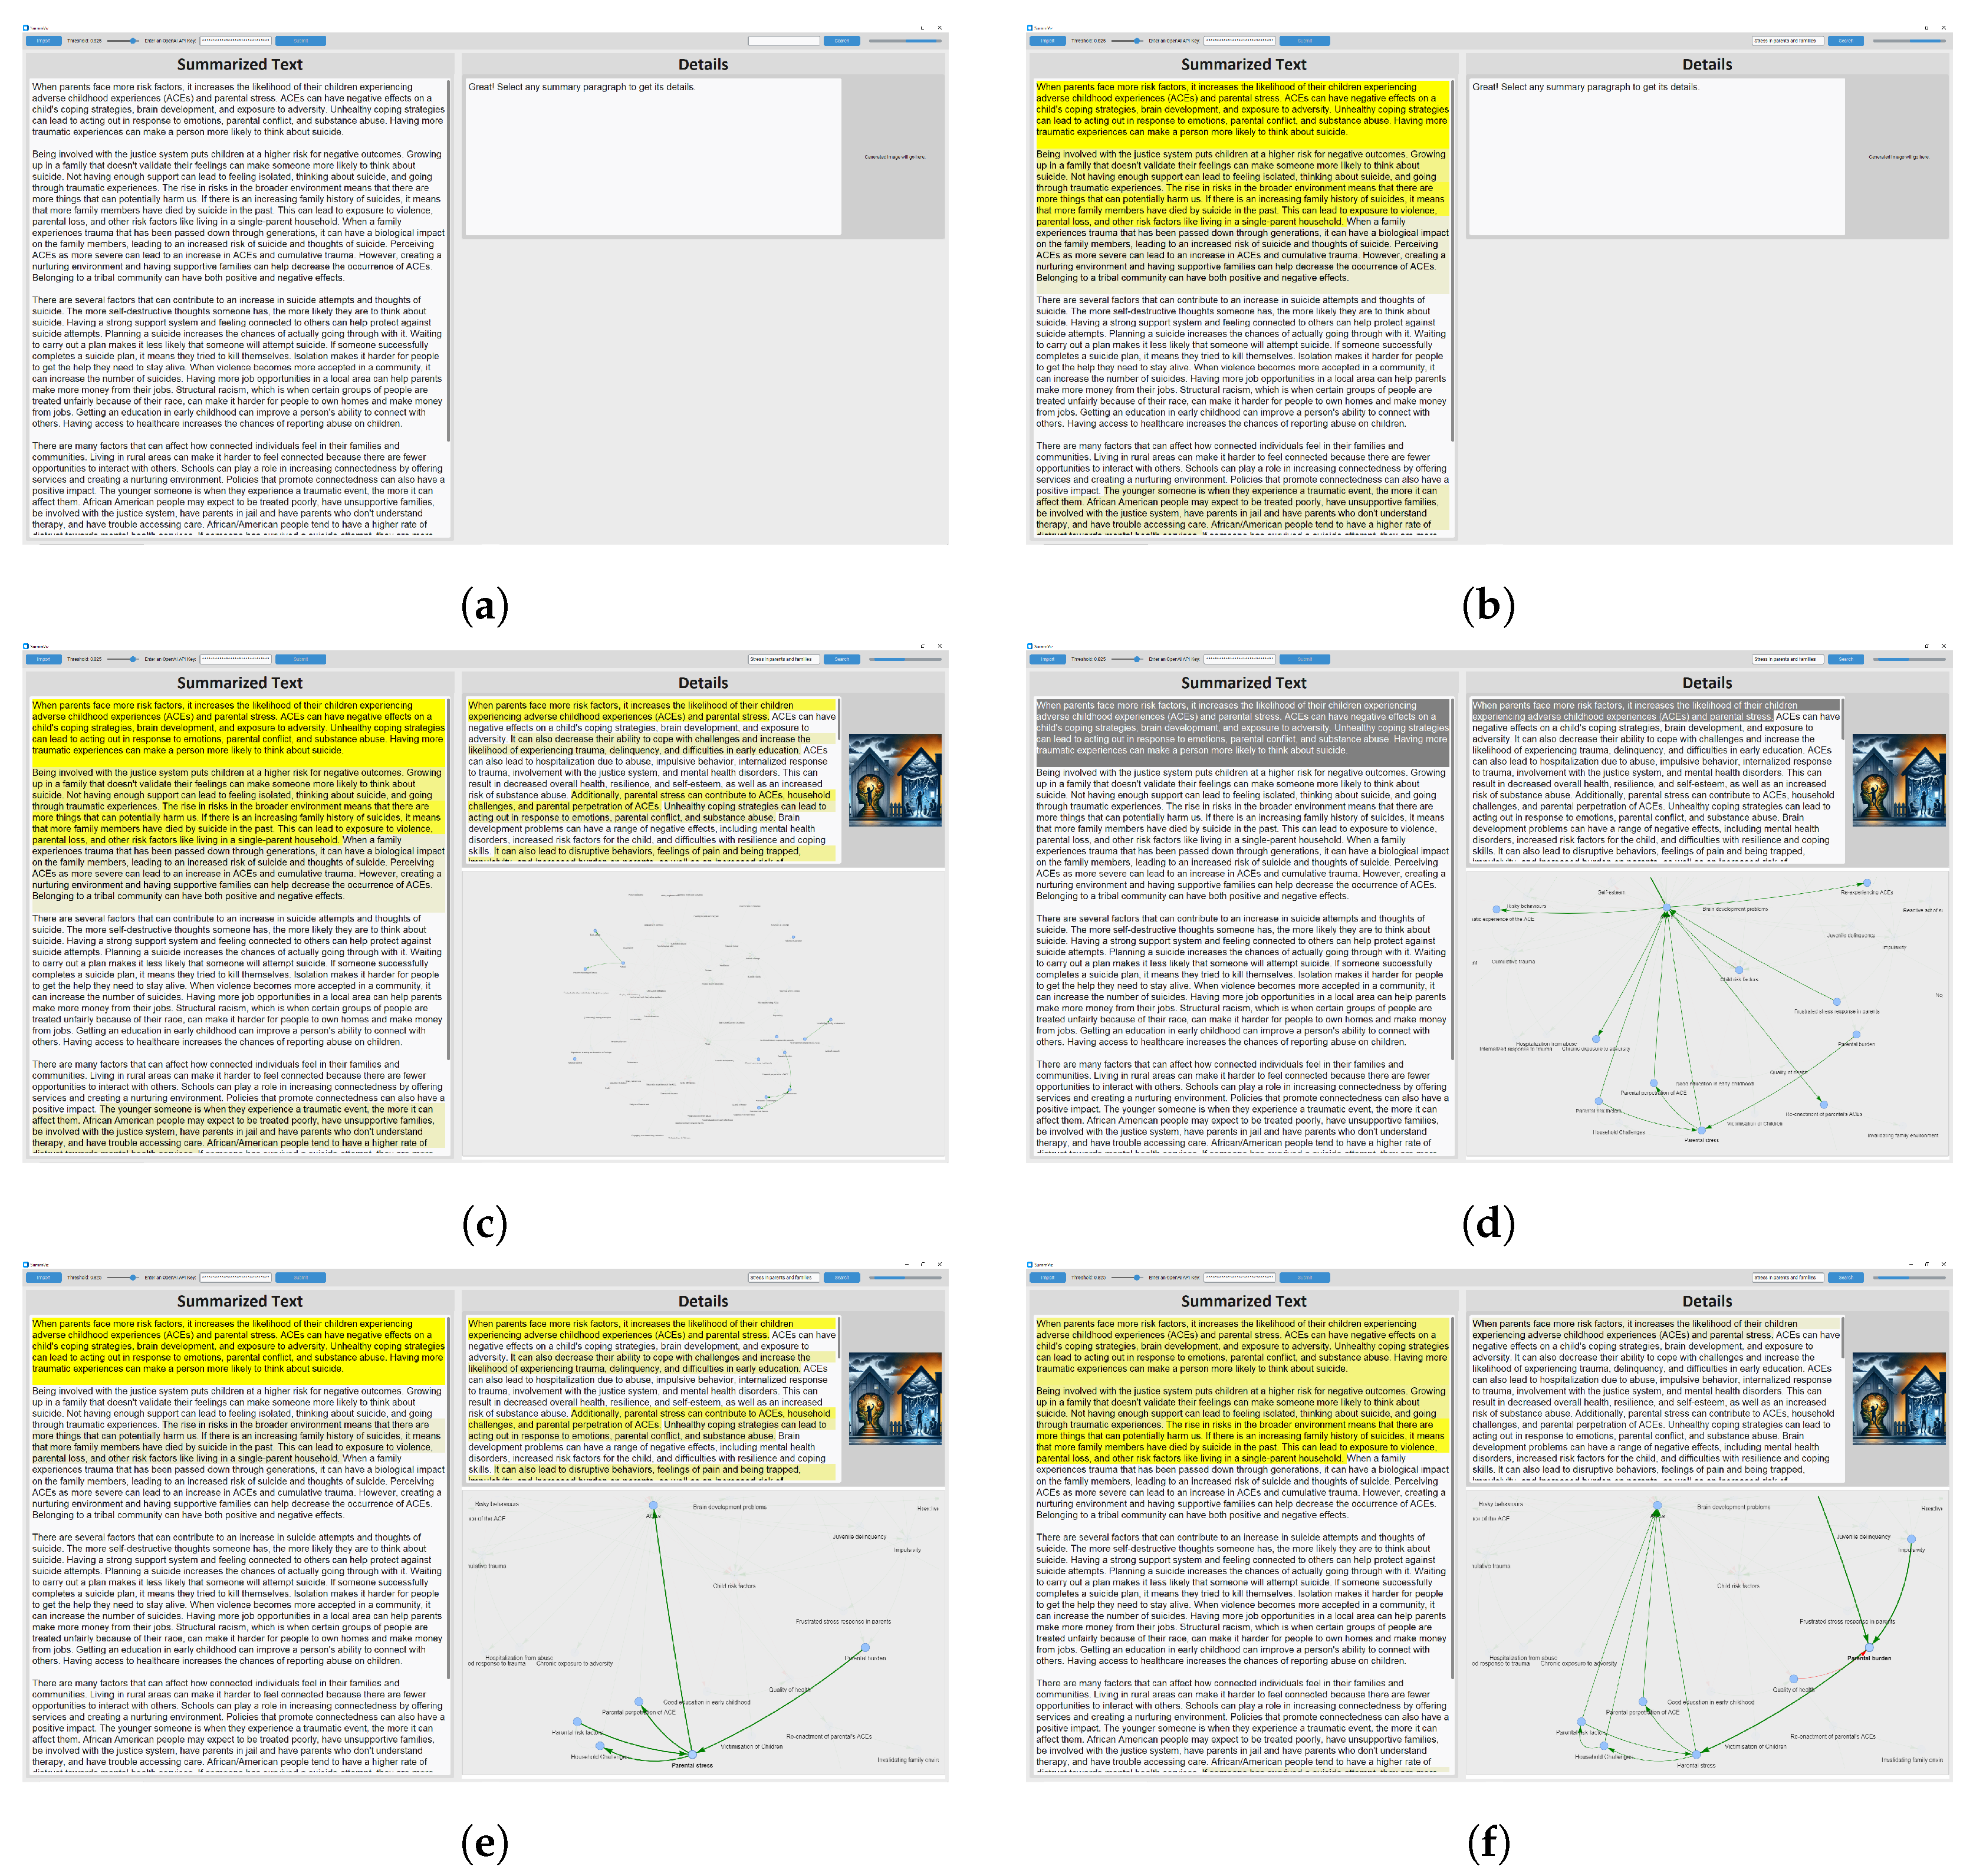
4.1. Overview: A User’s Workflow

The user starts by opening their file, consisting of the causal map and two levels of text generated by GPT (summary and details), as described in Section 3.1.2. The high-level text is displayed in a scrollable panel, giving the user access to an executive summary about the model. Linked visualizations are essential for visual analytics, and our environment supports several such linkages. By selecting a topical paragraph, the user updates the other three views to provide details on demand (Figure 6). The detailed text appears in its own scrollable panel, an illustration from the summary is created on the fly, and the corresponding subgraph is displayed. These visualizations combine OpenAI’s GPT and DALL-E, as discussed in Section 4.2. By selecting a node in the subgraph or searching for nodes or phrases via the search bar, the user triggers a highlighting mechanism to reveal related sentences. Given that GPT produces outputs that are pleasant due in part to variations in language, we cannot expect matches to be identical or simple inflections (e.g., eat/ate, paper/papers). Rather, we use OpenAI embeddings to detect similar terms, as shown in Section 4.3.

4.2. Visualization

To develop our environment, we combined the Tkinter framework and CustomTkinter for the user interface (UI), the Chromium Embedded Framework (CEF) and Pyvis for graph visualization (bottom-right component in Figure 6 and Figure 7), and OpenAI’s API. All were run on Python 3.9. All packages and their versions used are listed in https://doi.org/10.5281/zenodo.10578610 (last accessed on 21 May 2024).
While interactive graph visualizations and linked visualizations are well-known tools, an innovation of our environment is tge automatical illustration of the summary paragraph selected by the user. This illustration seeks to reinforce the concepts of the paragraph. To generate the image with OpenAI’s DALL-E 3, we must ensure that our prompt does not violate any of OpenAI’s content policies. However, these policies can easily be violated when the causal map deals with sensitive or triggering subjects, as shown in our case study on suicide in youth. It would be impossible to hardcode every single potential violation that a user may trigger with their model. Consequently, we pass our summary text through GPT to automatically create a safe version of a prompt. We engineered the prompt by assigning a role to GPT and teaching it about triggering subjects through examples, as shown below. We used a temperature setting (which governs the ‘creativity’ of GPT) of 0.5 , as a nonzero temperature is needed to potentially transform the summary text (if it contains triggers), but a temperature of 1 may deviate too much from the original content and yield an unrelated image. Once the image is generated, the image is cached on the user’s machine for the duration that the application is running. Images are cached to avoid redundant calls to DALL-E 3, hence minimizing the consumption of OpenAI tokens.
Mathematics 12 01946 i001

4.3. Interactive Environment

Along with the visualization of summaries, details, and maps, we also provide various interactive features for the user to keep track of their current information and suggest where the user may visit next. As the user hovers over the text, it becomes highlighted in cyan to monitor the user’s current location. When the user selects a textual item, it is highlighted in dark grey.
The causal map is the unaltered specification of the conceptual model, provided by the user. The detailed text is generated from the causal map, and the summary is generated from the detailed text. As mentioned in Section 3, generative AI involves randomness; hence, information is transformed as it passes through generative AI (Figure 8). The transformations thus prevent us from conducting a verbatim match between nodes and words in sentences. Rather, we need to automatically detect similar constructs. Therefore, we use OpenAI’s text embeddings to vectorize words and sentences, and the cosine similarity is computed [67]. The similarity ranges from 0 (no similarity) to 1.0 (identical), and we set a default threshold of 0.825 .
Our environment allows matching in either direction: from sentences to nodes or from nodes to sentences. When a sentence is selected, similar nodes are highlighted, while all other nodes and edges are greyed out (Figure 7). If highlighted nodes are connected, their edge is also highlighted. Conversely, when a node is selected, we highlight sentences based on their similarity (i.e., higher opacity indicates higher similarity). To facilitate the understanding of the local context of the selected node, we also highlight its direct neighbors and the edges involved. Note that the user can select multiple nodes (by holding CTRL) or search for nodes.

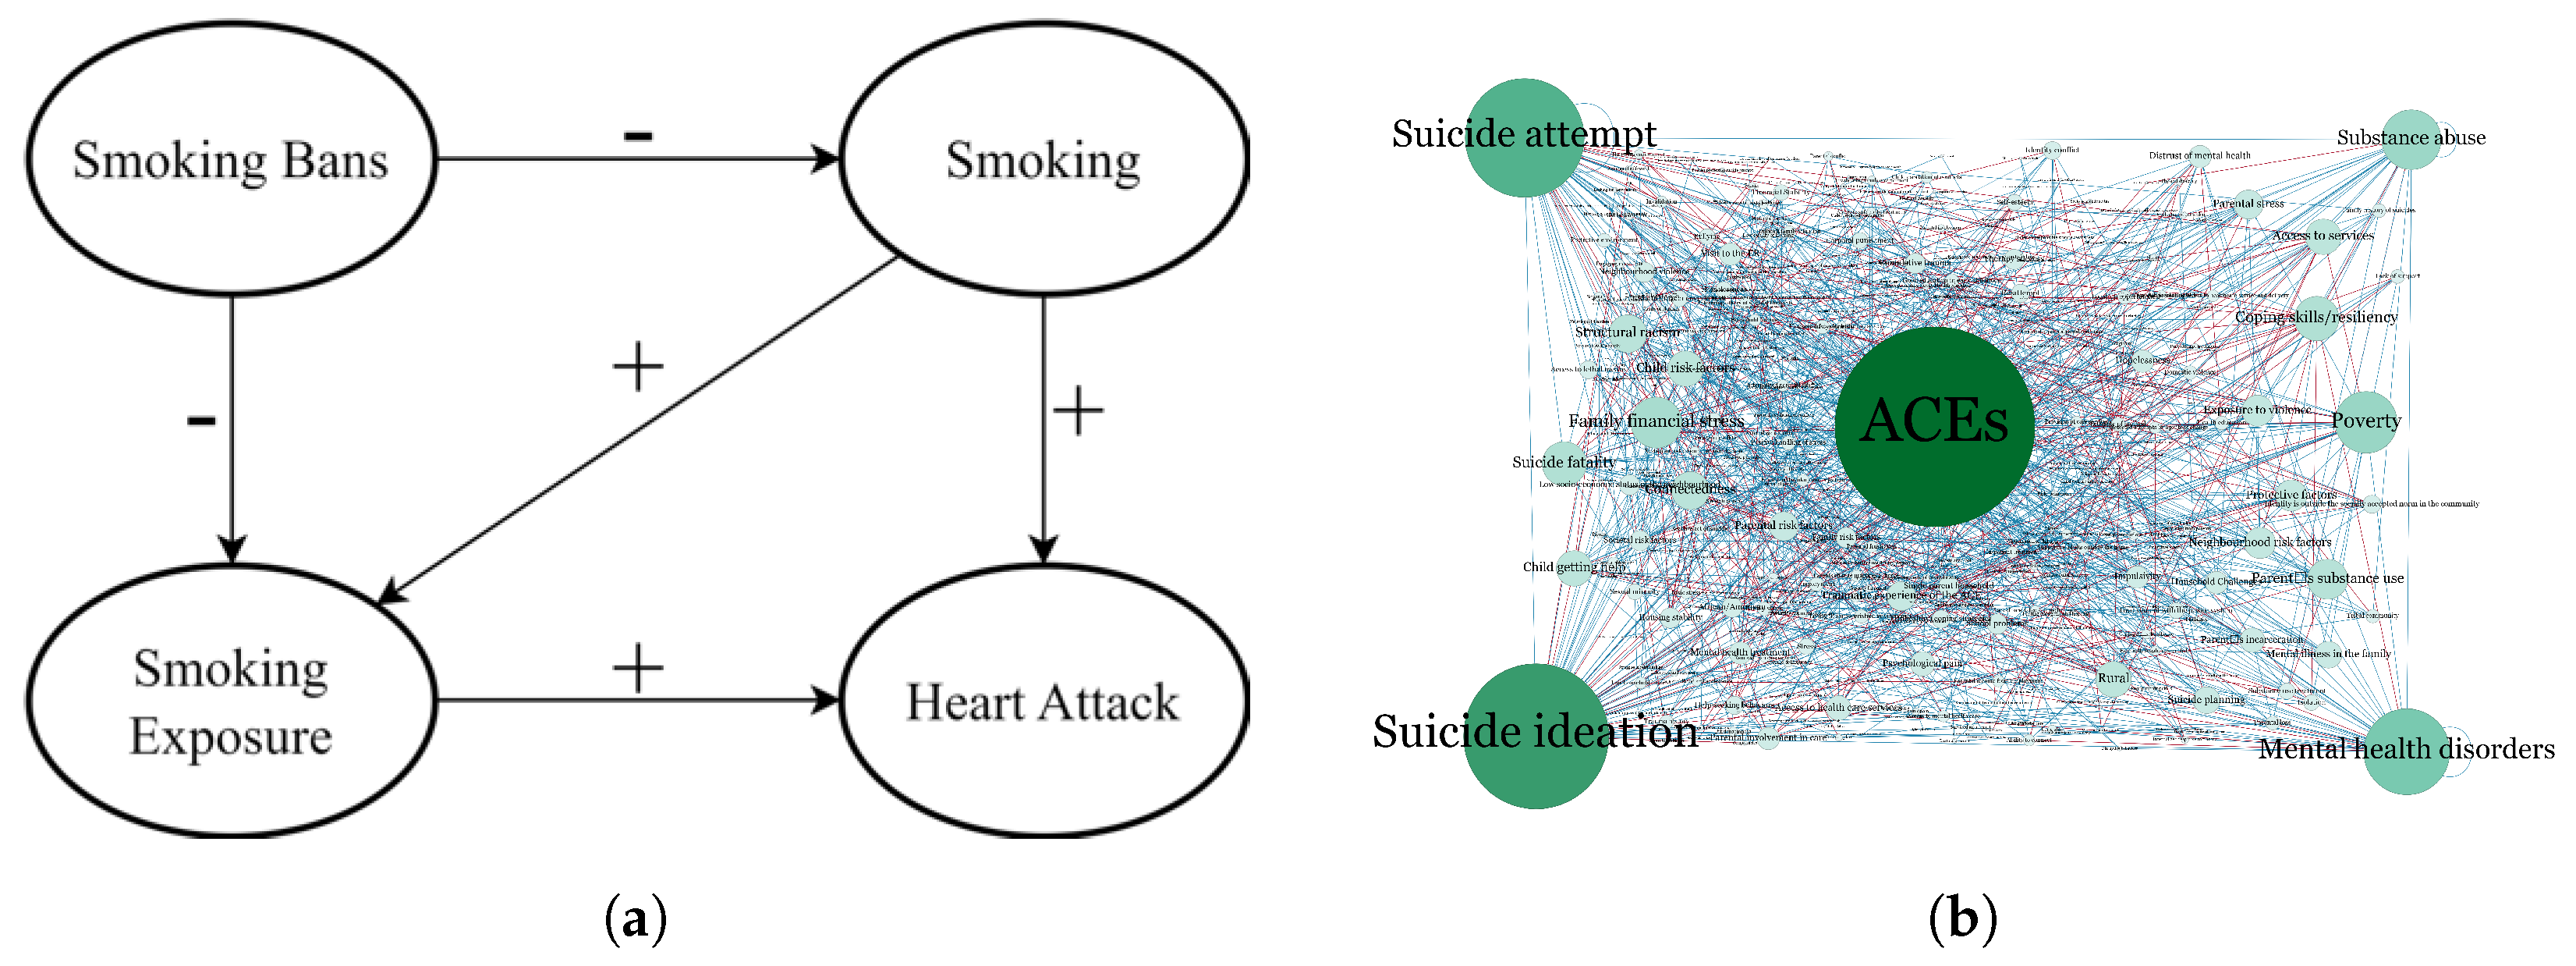
5. Case Study: Suicide and Adverse Childhood Experiences (ACEs) in Youth

In the U.S., suicide is the second-leading cause of death of those aged 10–14 and 25–34, and the third leading cause of death for those aged 15–24 [68]. The U.S. recorded nearly 46,000 deaths by suicide in 2020 [68], which rose to 48,183 deaths in 2021, along with 1.7 million suicide attempts [69]. There is thus a strong interest in suicide prevention in youth, while noting that it is a complex endeavor since suicide ideation, attempt, and death rarely stem from a single risk factor [68]. For example, suicide ideation is impacted by many risk factors (e.g., ACEs, historical trauma, substance abuse, access to lethal means) and protective factors (e.g., access to healthcare, connectedness). Our case study used a causal map openly released by the Centers for Disease Control and Prevention (CDC), focusing on suicide and ACEs in youth [27]. The map was built through a participatory modeling process as described in Section 3.1.1. Specifically, after interviewing SMEs, the aggregate map (Figure 2b) contained 361 nodes and nearly 946 relationships. Our case study assumed that an analyst opens this map (along with the generated summary and detailed text) to understand suicide and ACEs. The case study described in this section is also provided as a video available at https://doi.org/10.5281/zenodo.10578610 (last accessed on 21 May 2024).
In this case study, our user is an analyst who wishes to understand two aspects of the complexity of suicide. This case study exemplifies that our system is intended for professionals who have some familiarity with the domain of the causal map, but need additional support due to its complexity. Analysts have specific tasks to accomplish, as they are motivated by practical questions. In our case study, the first question is: how do stressors in the parents ultimately become risk factors in their children? This is an important aspect, related to the intergenerational impact of suicide on children and families. Second, suicide is not just a simple chain of causes-and-effects: it is embedded in a complex system that includes loops. The analyst thus also seeks to identify some of these loops, with an emphasis on the relation between parents and their children.
The analyst starts by inputing an OpenAI key, since all of our applied AI models run through OpenAI’s API. The analyst then imports the desired file, which initially displays only the summary text (Figure 9a). The analyst can interact with a summary, update the threshold, or search for specific concepts. In our case, the analyst searches for “stress in parents and families” (Figure 9b). The first paragraph has the most opaque background color, thus it is the most relevant and the analyst selects it accordingly. Once the paragraph is selected, the searched phrase carries over to the detailed text and graph, highlighting relevant sentences and nodes (Figure 9c). From this summary, an image is also generated portraying different household environments (Figure 10a).
The analyst noted that the first sentence is about parental stress in families, which is highly related to the question of interest. After the analyst selected this sentence, related nodes and edges are highlighted, while others are hidden (Figure 9d). Among those highlighted are ACEs, child risk factors, parental burden, parental stress, and parental risk factors. Within a few steps, the analyst thus already identified several of the constructs that link parental stress to risk factors in their children. The analyst focused on the construct of ‘parental stress’ by selecting it for inspection (Figure 9e). Some summary texts and detailed sentences were highlighted, showing their significance in specific sections. We could also observe parental risk factors and parental burden having an impact on parental stress, which can lead to household challenges, parental perpetration of ACEs, or directly affect ACEs. Having identified a very important construct, the analyst now formed a cluster (Figure 9f) by selecting all nodes directly related to parental stress, except for ACEs (as it has too many relationships and would bloat the analysis). By selecting parental stress along with four connected constructs, the analyst found loops: parental stress causes household challenges, which may increase risk factors, leading to more parental stress. In addition, all nodes connected to parental stress except for parental burden can also cause more ACEs, while parental burden may be caused by impulsivity, mental health disorders, and a lower quality of health. By continuing, the analyst would visit other summary texts and discover more relationships relating to parental burden or parental stress.

6. Discussion

Multiple position papers have recently discussed the potential of leveraging rapid advances in generative AI to support modeling and simulation [6,70], ranging from tasks such as conceptual modeling to verification and explainability. While several studies are gradually enacting this potential to create models or convert them into code [10,14,71], this paper is the first that shows how to weave generative AI into a visual analytics environment to interact with conceptual models (Q1). Since this use of generative AI for simulation is unprecedented, we cannot demonstrate that our environment integrates AI in a better way than an alternative environment. Our case study focused on using data from automatic text generation and summarization, which is error-prone for leaving out significant information as well as including false information (i.e., hallucinations). The text generation component can be evaluated if users manually wrote an executive summary and detailed text to serve as ground truth. Users could import their own detailed text and summaries in our environment as long as it matches the JSON format. However, it would be very time consuming to manually write sentences to account for every node and edge (recall that our case study map in Section 5 contained 946 edges). By releasing this work open source, we encourage the simulation community to evaluate the tool with their own participants and to make changes in response to their specific needs. Our case study demonstrates how a user who is familiar with causal maps may use the application (Q2), but we did not evaluate their performance or record the user’s satisfaction. Collecting data on how participants engage with models via text is an important step to know whether we have achieved successful transparency of information or to discover more ways to improve the process.
We focused on using generative AI through text and image generation to provide an automatic and robust way of quickly obtaining details on demand. An evaluation of identifying the ideal generative AI models to use was beyond the scope of this paper, but it is important to generate and display the best data possible. In our models, we utilized GPT-3 and GPT-3.5 to convert causal maps into text [12], BART for text summarization [46], DALL-E 3 for image generation [55], and OpenAI embeddings [67]. Other LLMs, e.g., Llama 3 [72] (which now comes with either 8 or 70 billion parameters), Claude, Mistral, and PaLM [73] (used in Google’s Bard), may be tested, as well as other text summarization models e.g., Llama, PaLM, GPT, Longformer [74], and T5 [75]. The modular nature of our architecture and its open-source release make it simple for others to swap one LLM for another; for example, we performed additional assessments on our text-to-image prompts using GPT-4o (released in mid-May 2024) and found that the results were equivalent (Figure 11).
Image generation and diffusion models drastically vary in results (even between DALL-E 2 and DALL-E 3), so other diffusion models and applications may be used such as Craiyon and Midjourney [76]. We considered the possibility of using Stable Diffusion compared to DALL-E, particularly as many of the images (Figure 12 and Figure 13) created by DALL-E can be described as ‘allegories’ (personifications of abstract ideas) whereas Stable Diffusion can provide illustrations or photorealistic renderings. The main versions are Stable Diffusion 1.5 (850 M parameters), Stable Diffusion 2.0 (865 M parameters), and SDXL (2.6 B parameters). We performed complementary experiments using the latest available version (SDXL), as of mid-May 2024, which offers the best performance [52], but the results did not reflect the prompt as comprehensively as DALL-E 3 (Figure 14).
Our visual analytics environment is one step toward inclusive conceptual modeling, as details on demand and the use of text can broaden access to conceptual models. However, Lukyanenko et al. noted that “to cultivate inclusive conceptual modeling, the language in which conceptual modeling activities is couched must be sensitive to the needs of diverse people” [77]. At present, generative AI for simulation can adapt the output based on the content (e.g., as shown by our prompt reformulation to avoid trigger words) but is not yet based on individual needs and preferences. While there has been progress in probing human preferences to guide generative AI [78], a new study showed that GPT responds more negatively to opinion-minority groups [79]—a result of being trained to find patterns with broad support in the training data. Additional studies are thus needed to ensure that the inclusion of user preferences does not backfire by resulting in a worse experience.

7. Conclusions

In this paper, we proposed a new solution to explore large conceptual models while minimizing information overload, such that users may discover details that would otherwise have been overlooked or would have required a much longer investigation. We described how the environment and its features were developed, and the environment was used for suicide in youth as a case study for a complex conceptual model. By using generative AI, our environment made the information contained in conceptual models more accessible to participants, which is a way of giving back to community members and experts that help build these models.

Author Contributions

Conceptualization, T.J.G. and P.J.G.; methodology, T.J.G. and P.J.G.; software, T.J.G. and S.C.G.; investigation, T.J.G.; resources, T.J.G. and P.J.G.; writing—original draft preparation, T.J.G. and S.C.G., and P.J.G.; writing—review and editing, P.J.G.; writing—revisions, P.J.G.; visualization, T.J.G. and S.C.G.; supervision, P.J.G.; project administration, P.J.G. All authors have read and agreed to the published version of the manuscript.

Funding

This research received no external funding.

Data Availability Statement

Our software is provided open source and can be accessed without registration via a permanent DOI identifier on a third-party repository at https://doi.org/10.5281/zenodo.10578610, accessed on 21 May 2024. A video demonstrating the use of the software is provided at the same URL. For convenience, we also provide a version with GPT-4o at https://osf.io/98kmy/, accessed on 21 May 2024.

Conflicts of Interest

The authors declare no conflicts of interest.

Abbreviations

The following abbreviations are used in this manuscript:
BERTBidirectional Encoder Representations from Transformers
GPTGenerative Pretrained Transformer
LLMLarge Language Model
LPAMLabel Propagation Algorithm

References

  1. Gill, S.S.; Xu, M.; Patros, P.; Wu, H.; Kaur, R.; Kaur, K.; Fuller, S.; Singh, M.; Arora, P.; Parlikad, A.K.; et al. Transformative effects of ChatGPT on modern education: Emerging Era of AI Chatbots. Internet Things-Cyber-Phys. Syst. 2024, 4, 19–23. [Google Scholar] [CrossRef]
  2. Perkins, M.; Roe, J.; Postma, D.; McGaughran, J.; Hickerson, D. Detection of GPT-4 generated text in higher education: Combining academic judgement and software to identify generative AI tool misuse. J. Acad. Ethics 2024, 22, 89–113. [Google Scholar] [CrossRef]
  3. Frieder, S.; Pinchetti, L.; Griffiths, R.R.; Salvatori, T.; Lukasiewicz, T.; Petersen, P.; Berner, J. Mathematical capabilities of chatgpt. Adv. Neural Inf. Process. Syst. 2024, 36. [Google Scholar]
  4. Gandolfi, A. GPT-4 in Education: Evaluating Aptness, Reliability, and Loss of Coherence in Solving Calculus Problems and Grading Submissions. Int. J. Artif. Intell. Educ. 2024, 1–31. [Google Scholar] [CrossRef]
  5. Alshareef, A.; Keller, N.; Carbo, P.; Zeigler, B.P. Generative AI with Modeling and Simulation of Activity and Flow-Based Diagrams. In Proceedings of the International Conference on Simulation Tools and Techniques, Seville, Spain, 14–15 December 2023; Springer: Cham, Switzerland, 2023; pp. 95–109. [Google Scholar]
  6. Giabbanelli, P.J. GPT-Based Models Meet Simulation: How to Efficiently use Large-Scale Pre-Trained Language Models Across Simulation Tasks. In Proceedings of the 2023 Winter Simulation Conference (WSC), San Antonio, TX, USA, 10–13 December 2023; pp. 2920–2931. [Google Scholar]
  7. Akhavan, A.; Jalali, M.S. Generative AI and simulation modeling: How should you (not) use large language models like ChatGPT. Syst. Dyn. Rev. 2023. [Google Scholar] [CrossRef]
  8. Hosseinichimeh, N.; Majumdar, A.; Williams, R.; Ghaffarzadegan, N. From Text to Map: A System Dynamics Bot for Constructing Causal Loop Diagrams. arXiv 2024, arXiv:2402.11400. [Google Scholar]
  9. Jalali, M.S.; Akhavan, A. Integrating AI Language Models in Qualitative Research: Replicating Interview Data Analysis with ChatGPT. Syst. Dyn. Rev. 2024. [Google Scholar] [CrossRef]
  10. Giabbanelli, P.; Witkowicz, N. Generative AI for Systems Thinking: Can a GPT Question-Answering System Turn Text into the Causal Maps Produced by Human Readers? In Proceedings of the 57th Hawaii International Conference on System Sciences, Waikiki Beach, HI, USA, 3–6 January 2024; pp. 7540–7549. [Google Scholar]
  11. Phatak, A.; Mago, V.K.; Agrawal, A.; Inbasekaran, A.; Giabbanelli, P.J. Narrating Causal Graphs with Large Language Models. In Proceedings of the Hawaii International Conference on System Sciences (HICSS), Waikiki Beach, HI, USA, 3–6 January 2024. [Google Scholar]
  12. Shrestha, A.; Mielke, K.; Nguyen, T.A.; Giabbanelli, P.J. Automatically Explaining a Model: Using Deep Neural Networks to Generate Text From Causal Maps. In Proceedings of the Winter Simulation Conference, Singapore, 11–14 December 2022; pp. 2629–2640. [Google Scholar]
  13. Apvrille, L.; Sultan, B. System Architects Are not Alone Anymore: Automatic System Modeling with AI. In Proceedings of the 12th Internaitonal Conference on Model-Based Software and Systems Engineering (INSTICC), Rome, Italy, 21–23 February 2024; pp. 27–38. [Google Scholar]
  14. Frydenlund, E.; Martínez, J.; Padilla, J.J.; Palacio, K.; Shuttleworth, D. Modeler in a box: How can large language models aid in the simulation modeling process? Simulation 2024, 00375497241239360. [Google Scholar] [CrossRef]
  15. Feleki, A.; Apostolopoulos, I.D.; Moustakidis, S.; Papageorgiou, E.I.; Papathanasiou, N.; Apostolopoulos, D.; Papandrianos, N. Explainable Deep Fuzzy Cognitive Map Diagnosis of Coronary Artery Disease: Integrating Myocardial Perfusion Imaging, Clinical Data, and Natural Language Insights. Appl. Sci. 2023, 13, 11953. [Google Scholar] [CrossRef]
  16. Robinson, S.; Arbez, G.; Birta, L.G.; Tolk, A.; Wagner, G. Conceptual modeling: Definition, purpose and benefits. In Proceedings of the 2015 Winter Simulation Conference (WSC), Huntington Beach, CA, USA, 6–9 December 2015; pp. 2812–2826. [Google Scholar]
  17. Voinov, A.; Jenni, K.; Gray, S.; Kolagani, N.; Glynn, P.D.; Bommel, P.; Prell, C.; Zellner, M.; Paolisso, M.; Jordan, R.; et al. Tools and methods in participatory modeling: Selecting the right tool for the job. Environ. Model. Softw. 2018, 109, 232–255. [Google Scholar] [CrossRef]
  18. Mooney, S.J. Systems thinking in population health research and policy. In Systems Science and Population Health; Oxford University Press: Oxford, UK, 2017; pp. 49–60. [Google Scholar]
  19. Jack, A. Foresight report on obesity–Author’s reply. Lancet 2007, 370, 1755. [Google Scholar] [CrossRef]
  20. Grant, S.; Soltani Panah, A.; McCosker, A. Weight-Biased Language across 30 Years of Australian News Reporting on Obesity: Associations with Public Health Policy. Obesities 2022, 2, 103–114. [Google Scholar] [CrossRef]
  21. Drasic, L.; Giabbanelli, P.J. Exploring the interactions between physical well-being, and obesity. Can. J. Diabetes 2015, 39, S12–S13. [Google Scholar] [CrossRef]
  22. McGlashan, J.; Hayward, J.; Brown, A.; Owen, B.; Millar, L.; Johnstone, M.; Creighton, D.; Allender, S. Comparing complex perspectives on obesity drivers: Action-driven communities and evidence-oriented experts. Obes. Sci. Pract. 2018, 4, 575–581. [Google Scholar] [CrossRef] [PubMed]
  23. Keim, D.; Andrienko, G.; Fekete, J.D.; Gorg, C.; Kohlhammer, J.; Melançon, G. Visual analytics: Definition, process, and challenges. Lect. Notes Comput. Sci. 2008, 4950, 154–176. [Google Scholar]
  24. Giabbanelli, P.J.; Vesuvala, C.X. Human Factors in Leveraging Systems Science to Shape Public Policy for Obesity: A Usability Study. Information 2023, 14, 196. [Google Scholar] [CrossRef]
  25. Hvalshagen, M.; Lukyanenko, R.; Samuel, B.M. Empowering users with narratives: Examining the efficacy of narratives for understanding data-oriented conceptual models. Inf. Syst. Res. 2023, 34, 890–909. [Google Scholar] [CrossRef]
  26. Chandrasegaran, S.; Badam, S.K.; Kisselburgh, L.; Ramani, K.; Elmqvist, N. Integrating visual analytics support for grounded theory practice in qualitative text analysis. In Computer Graphics Forum; Wiley Online Library: Hoboken, NJ, USA, 2017; Volume 36, pp. 201–212. [Google Scholar]
  27. Giabbanelli, P.J.; Rice, K.L.; Galgoczy, M.C.; Nataraj, N.; Brown, M.M.; Harper, C.R.; Nguyen, M.D.; Foy, R. Pathways to suicide or collections of vicious cycles? Understanding the complexity of suicide through causal mapping. Soc. Netw. Anal. Min. 2022, 12, 60. [Google Scholar] [CrossRef]
  28. Higham, C.F.; Higham, D.J.; Grindrod, P. Diffusion Models for Generative Artificial Intelligence: An Introduction for Applied Mathematicians. arXiv 2023, arXiv:2312.14977. [Google Scholar]
  29. Berry, M.W.; Drmac, Z.; Jessup, E.R. Matrices, vector spaces, and information retrieval. SIAM Rev. 1999, 41, 335–362. [Google Scholar] [CrossRef]
  30. Zhai, C. Statistical language models for information retrieval a critical review. Found. Trends® Inf. Retr. 2008, 2, 137–213. [Google Scholar] [CrossRef]
  31. Zhang, W.; Yoshida, T.; Tang, X. A comparative study of TF* IDF, LSI and multi-words for text classification. Expert Syst. Appl. 2011, 38, 2758–2765. [Google Scholar] [CrossRef]
  32. Pillutla, V.S.; Tawfik, A.A.; Giabbanelli, P.J. Detecting the depth and progression of learning in massive open online courses by mining discussion data. Technol. Knowl. Learn. 2020, 25, 881–898. [Google Scholar] [CrossRef]
  33. Selva Birunda, S.; Kanniga Devi, R. A review on word embedding techniques for text classification. In Innovative Data Communication Technologies and Application: Proceedings of the ICIDCA 2020, Coimbatore, India, 3–4 September 2020; Springer: Singapore, 2021; pp. 267–281. [Google Scholar]
  34. Li, B.; Zhou, H.; He, J.; Wang, M.; Yang, Y.; Li, L. On the sentence embeddings from pre-trained language models. arXiv 2020, arXiv:2011.05864. [Google Scholar]
  35. Galgoczy, M.C.; Phatak, A.; Vinson, D.; Mago, V.K.; Giabbanelli, P.J. (Re) shaping online narratives: When bots promote the message of President Trump during his first impeachment. PeerJ Comput. Sci. 2022, 8, e947. [Google Scholar] [CrossRef] [PubMed]
  36. Patil, A.; Han, K.; Jadon, A. A Comparative Analysis of Text Embedding Models for Bug Report Semantic Similarity. In Proceedings of the 2024 11th International Conference on Signal Processing and Integrated Networks (SPIN), Noida, India, 21–22 March 2024; pp. 262–267. [Google Scholar]
  37. Li, X.; Henriksson, A.; Duneld, M.; Nouri, J.; Wu, Y. Evaluating Embeddings from Pre-Trained Language Models and Knowledge Graphs for Educational Content Recommendation. Future Internet 2023, 16, 12. [Google Scholar] [CrossRef]
  38. Aperdannier, R.; Koeppel, M.; Unger, T.; Schacht, S.; Barkur, S.K. Systematic Evaluation of Different Approaches on Embedding Search. In Advances in Information and Communication, Proceedings of the Future of Information and Communication Conference, Berlin, Germany, 4–5 April 2024; Springer: Cham, Switzerland, 2024; pp. 526–536. [Google Scholar]
  39. Reiter, E.; Dale, R. Building applied natural language generation systems. Nat. Lang. Eng. 1997, 3, 57–87. [Google Scholar] [CrossRef]
  40. Dimitromanolaki, A. Learning to Order Facts for Discourse Planning in Natural Language. In Proceedings of the 10th Conference of The European Chapter, Budapest, Hungary, 12–17 April 2003; p. 23. [Google Scholar]
  41. Di Eugenio, B.; Fossati, D.; Yu, D.; Haller, S.; Glass, M. Aggregation improves learning: Experiments in natural language generation for intelligent tutoring systems. In Proceedings of the 43rd Annual Meeting of the Association for Computational Linguistics (ACL’05), Ann Arbor, MI, USA, 25–30 June 2005; pp. 50–57. [Google Scholar]
  42. AlShaikh, F.; Hewahi, N. Ai and machine learning techniques in the development of Intelligent Tutoring System: A review. In Proceedings of the 2021 International Conference on Innovation and Intelligence for Informatics, Computing and Technologies (3ICT), Zallaq, Bahrain, 29–30 September 2021; pp. 403–410. [Google Scholar]
  43. Dai, K. Multi-Context Dependent Natural Text Generation for More Robust NPC Dialogue. Bachelor’s Thesis, Harvard University, Cambridge, MA, USA, 2020. [Google Scholar]
  44. Ji, Z.; Lee, N.; Frieske, R.; Yu, T.; Su, D.; Xu, Y.; Ishii, E.; Bang, Y.J.; Madotto, A.; Fung, P. Survey of hallucination in natural language generation. ACM Comput. Surv. 2023, 55, 1–38. [Google Scholar] [CrossRef]
  45. Hendrycks, D.; Gimpel, K. Gaussian error linear units (gelus). arXiv 2016, arXiv:1606.08415. [Google Scholar]
  46. Lewis, M.; Liu, Y.; Goyal, N.; Ghazvininejad, M.; Mohamed, A.; Levy, O.; Stoyanov, V.; Zettlemoyer, L. BART: Denoising Sequence-to-Sequence Pre-training for Natural Language Generation, Translation, and Comprehension. In Proceedings of the 58th Annual Meeting of the Association for Computational Linguistics, Online, 5–10 July 2020; pp. 7871–7880. [Google Scholar]
  47. Lu, Y.; Li, Z.; He, D.; Sun, Z.; Dong, B.; Qin, T.; Wang, L.; Liu, T.Y. Understanding and improving transformer from a multi-particle dynamic system point of view. arXiv 2019, arXiv:1906.02762. [Google Scholar]
  48. Ding, M.; Yang, Z.; Hong, W.; Zheng, W.; Zhou, C.; Yin, D.; Lin, J.; Zou, X.; Shao, Z.; Yang, H.; et al. Cogview: Mastering text-to-image generation via transformers. Adv. Neural Inf. Process. Syst. 2021, 34, 19822–19835. [Google Scholar]
  49. Reed, S.; Akata, Z.; Yan, X.; Logeswaran, L.; Schiele, B.; Lee, H. Generative adversarial text to image synthesis. In Proceedings of the 33rd International Conference on Machine Learning, New York, NY, USA, 20–22 June 2016; pp. 1060–1069. [Google Scholar]
  50. Zhao, Z.; Ye, J.C.; Bresler, Y. Generative Models for Inverse Imaging Problems: From mathematical foundations to physics-driven applications. IEEE Signal Process. Mag. 2023, 40, 148–163. [Google Scholar] [CrossRef]
  51. Fatkhulin, T.; Leokhin, Y.; Mentus, M.; Kulikova, A.; Alshawi, R. Analysis of the Basic Image Generation Methods by Neural Networks. In Proceedings of the 2023 Intelligent Technologies and Electronic Devices in Vehicle and Road Transport Complex (TIRVED), Moscow, Russia, 15–17 November 2023; pp. 1–7. [Google Scholar]
  52. Podell, D.; English, Z.; Lacey, K.; Blattmann, A.; Dockhorn, T.; Müller, J.; Penna, J.; Rombach, R. Sdxl: Improving latent diffusion models for high-resolution image synthesis. arXiv 2023, arXiv:2307.01952. [Google Scholar]
  53. Song, J.; Meng, C.; Ermon, S. Denoising diffusion implicit models. arXiv 2020, arXiv:2010.02502. [Google Scholar]
  54. Fang, S. A Survey of Data-Driven 2D Diffusion Models for Generating Images from Text. EAI Endorsed Trans. AI Robot. 2024, 3. [Google Scholar] [CrossRef]
  55. Betker, J.; Goh, G.; Jing, L.; Brooks, T.; Wang, J.; Li, L.; Ouyang, L.; Zhuang, J.; Lee, J.; Guo, Y.; et al. Improving Image Generation with Better Captions. 2023. Available online: https://cdn.openai.com/papers/dall-e-3.pdf (accessed on 21 May 2024).
  56. Yang, L.; Yu, Z.; Meng, C.; Xu, M.; Ermon, S.; Cui, B. Mastering text-to-image diffusion: Recaptioning, planning, and generating with multimodal llms. arXiv 2024, arXiv:2401.11708. [Google Scholar]
  57. Pinho, H.D. Generation of systems maps. In Systems Science and Population Health; Oxford University Press: Oxford, UK, 2017; pp. 61–76. [Google Scholar]
  58. Schuerkamp, R.; Giabbanelli, P.; Grandi, U.; Doutre, S. How to Combine Models? Principles and Mechanisms to Aggregate Fuzzy Cognitive Maps. In Proceedings of the Winter Simulation Conference (WSC 2023), San Antonio, TX, USA, 10–13 December 2023. [Google Scholar]
  59. Gandee, T.J. natural language generation: Improving the Accessibility of Causal Modeling through Applied Deep Learning. Master’s Thesis, Miami University, Oxford, OH, USA, 2024. [Google Scholar]
  60. Ponomarenko, A.; Pitsoulis, L.; Shamshetdinov, M. Overlapping community detection in networks based on link partitioning and partitioning around medoids. PLoS ONE 2021, 16, e0255717. [Google Scholar] [CrossRef]
  61. Weisz, J.D.; Muller, M.; He, J.; Houde, S. Toward general design principles for generative AI applications. arXiv 2023, arXiv:2301.05578. [Google Scholar]
  62. Bubeck, S.; Chandrasekaran, V.; Eldan, R.; Gehrke, J.; Horvitz, E.; Kamar, E.; Lee, P.; Lee, Y.T.; Li, Y.; Lundberg, S.; et al. Sparks of artificial general intelligence: Early experiments with gpt-4. arXiv 2023, arXiv:2303.12712. [Google Scholar]
  63. Ganguli, D.; Hernandez, D.; Lovitt, L.; Askell, A.; Bai, Y.; Chen, A.; Conerly, T.; Dassarma, N.; Drain, D.; Elhage, N.; et al. Predictability and surprise in large generative models. In Proceedings of the ACM Conference on Fairness, Accountability, and Transparency, Seoul, Republic of Korea, 21–24 June 2022; pp. 1747–1764. [Google Scholar]
  64. Guerreiro, N.M.; Alves, D.M.; Waldendorf, J.; Haddow, B.; Birch, A.; Colombo, P.; Martins, A.F. Hallucinations in large multilingual translation models. Trans. Assoc. Comput. Linguist. 2023, 11, 1500–1517. [Google Scholar] [CrossRef]
  65. da Silva, S.A.; Milios, E.E.; de Oliveira, M.C.F. Evaluating visual analytics for text information retrieval. In Proceedings of the XX Brazilian Symposium on Human Factors in Computing Systems, Virtual, 18–22 October 2021; pp. 1–11. [Google Scholar]
  66. Dowling, M.; Wycoff, N.; Mayer, B.; Wenskovitch, J.; House, L.; Polys, N.; North, C.; Hauck, P. Interactive visual analytics for sensemaking with big text. Big Data Res. 2019, 16, 49–58. [Google Scholar] [CrossRef]
  67. Neelakantan, A.; Xu, T.; Puri, R.; Radford, A.; Han, J.M.; Tworek, J.; Yuan, Q.; Tezak, N.; Kim, J.W.; Hallacy, C.; et al. Text and code embeddings by contrastive pre-training. arXiv 2022, arXiv:2201.10005. [Google Scholar]
  68. Centers for Disease Control and Prevention. Suicide Prevention Resource for Action: A Compilation of the Best Available Evidence; Technical Report; National Center for Injury Prevention and Control: Atlanta, GA, USA, 2022. [Google Scholar]
  69. Centers for Disease Control and Prevention. National Vital Statistics System, Mortality 2018–2021 on CDC WONDER Online Database. 2023. Available online: http://wonder.cdc.gov/mcd-icd10-expanded.html (accessed on 10 January 2024).
  70. Scherer, W.; Tolk, A.; Loper, M.; Barry, P.; Rabadi, G.; Yilmaz, L. Chances and challenges of CHATGPT and similar models for education in M&S. Authorea Prepr. 2023. [Google Scholar] [CrossRef]
  71. du Plooy, C.; Oosthuizen, R. AI usefulness in systems modelling and simulation: Gpt-4 application. S. Afr. J. Ind. Eng. 2023, 34, 286–303. [Google Scholar] [CrossRef]
  72. Touvron, H.; Martin, L.; Stone, K.; Albert, P.; Almahairi, A.; Babaei, Y.; Bashlykov, N.; Batra, S.; Bhargava, P.; Bhosale, S.; et al. Llama 2: Open foundation and fine-tuned chat models. arXiv 2023, arXiv:2307.09288. [Google Scholar]
  73. Chowdhery, A.; Narang, S.; Devlin, J.; Bosma, M.; Mishra, G.; Roberts, A.; Barham, P.; Chung, H.W.; Sutton, C.; Gehrmann, S.; et al. Palm: Scaling language modeling with pathways. J. Mach. Learn. Res. 2023, 24, 1–113. [Google Scholar]
  74. Beltagy, I.; Peters, M.E.; Cohan, A. Longformer: The long-document transformer. arXiv 2020, arXiv:2004.05150. [Google Scholar]
  75. Raffel, C.; Shazeer, N.; Roberts, A.; Lee, K.; Narang, S.; Matena, M.; Zhou, Y.; Li, W.; Liu, P.J. Exploring the Limits of Transfer Learning With a Unified Text-To-Text Transformer. J. Mach. Learn. Res. 2020, 21, 1–67. [Google Scholar]
  76. Reviriego, P.; Merino-Gómez, E. Text to image generation: Leaving no language behind. arXiv 2022, arXiv:2208.09333. [Google Scholar]
  77. Lukyanenko, R.; Bork, D.; Storey, V.C.; Parsons, J.; Pastor, O. Inclusive conceptual modeling: Diversity, equity, involvement, and belonging in conceptual modeling. In ER Forum; CEUR Workshop Proceedings, RWTH Aachen University: Aachen, Germany, 2023; pp. 1–4. [Google Scholar]
  78. Hu, Y.; Song, K.; Cho, S.; Wang, X.; Foroosh, H.; Liu, F. DecipherPref: Analyzing Influential Factors in Human Preference Judgments via GPT-4. In Proceedings of the 2023 Conference on Empirical Methods in natural language processing, Singapore, 6–10 December 2023; pp. 8344–8357. [Google Scholar]
  79. Chen, K.; Shao, A.; Burapacheep, J.; Li, Y. Conversational AI and equity through assessing GPT-3’s communication with diverse social groups on contentious topics. Sci. Rep. 2024, 14, 1561. [Google Scholar] [CrossRef]
Figure 1. Generative AI can be used across stages of modeling and simulation. A large language model can explain the structure of a model (graph-to-text) at the conceptual stage [12] or synthesize specifications into a formal model at a later stage [13]. At the implementation stage, code can be produced automatically in a target language [14], which produces experimental results that can be explained via text to end users [15].
Mathematics 12 01946 g001
Figure 3. Differences between the architectures of three commonly used transformers: (1) BERT, (2) GPT, and (3) BART. Adapted from [46].
Mathematics 12 01946 g003
Figure 4. (a) High-level overview of the steps involved in text-to-image generation. (b) A minimal Comfy workflow including parameter values and specific algorithms. The workflow shows that prompts can be further divided into positives (desired features) and negatives (features to avoid). Details can be viewed by zooming into the high-resolution figure. A more detailed architecture can be interactively explored via tools such as https://ai.google.dev/edge/model-explorer, accessed on 19 June 2024.
Mathematics 12 01946 g004
Figure 5. A high-level illustration of the facilitation process to develop causal maps for complex problems.
Mathematics 12 01946 g005
Figure 6. Our application consists of a menu (top bar) and four visualizations (two texts, graph, illustration). Selecting a summary paragraph updates the other three visualizations, providing details on demand. Selecting or searching for a node triggers highlight in the text.
Mathematics 12 01946 g006
Figure 7. Screenshot of the user interface, with the data focusing on suicide in youth.
Mathematics 12 01946 g007
Figure 8. Transformation of a large causal map into two levels of text: detailed and summary. The resulting JSON file can be reused in our visual analytics environment, without having to recompute the text. The file contains a list of paragraphs, consisting of the subgraph, detailed text, and summary text.
Mathematics 12 01946 g008
Figure 9. A step-by-step example showing features of the visual analytics environment. (a) The state of the application after entering an OpenAI key and importing the JSON file. Only the summarized text is visible. (b) The user then searches for summaries related to “stress in parents and families”. (c) After selecting the first summary, the corresponding detailed text and causal map are displayed, while an image based on the summary is then generated. The search also carries over, highlighting the most relevant sentences and nodes. (d) Selecting the first detailed sentence removes the search format and highlights nodes relating to the sentence. (e) The node of parental stress is selected, highlighting similar summaries and detailed sentences. (f) Multiple nodes are selected by holding the CTRL key, ending after selecting ‘Parental Burden’.
Mathematics 12 01946 g009
Figure 10. DALL-E 3 images generated by summary prompts (explained in Section 4.2). (a) When parents face more challenges, this increases the likelihood of their children experiencing difficult childhood experiences (DCEs) and parental stress. DCEs can have negative effects on a child’s ways of handling emotions, brain development, and exposure to tough situations. Unhealthy ways of handling emotions can lead to expressing feelings in a negative way, parental disagreements, and substance misuse. Having more difficult experiences can make a person more likely to feel really sad and think about hurting themselves. (b) When parents face difficult challenges, it increases the chances of their children having tough experiences during childhood and feeling stressed. These tough experiences can have negative effects on a child’s ways of dealing with things, how their brain grows, and how much tough stuff they have to face. Unhealthy ways of dealing with things can lead to acting out when feeling upset, problems between parents, and using harmful substances. Having more difficult experiences can make a person more likely to have sad thoughts. (c) An increase in challenges in the wider world means that there are more things that can potentially affect us negatively. If there is a growing family history of difficult times, it means that more family members have faced tough situations in the past. This can lead to exposure to difficult experiences, parental loss, and other factors that may arise from living in a single-parent household.
Mathematics 12 01946 g010
Figure 11. The modular architecture of our solution allows users to generate prompts for image-to-text generation using other LLMs. In this example, we used GPT-4o. Results remain satisfactory: (a) illustrates how “talking about your tough feelings with others can help ensure that things which could cause harm are removed” (shown as being put in a box), (b) shows the justice system and being ignored by family members, (c) portrays the abstract notions of ‘broader environment’ and ‘difficult times’, (d) evokes loneliness and planning (for a suicide attempt), (e) emphasizes a ‘strong support system’ and connectedness, and (f) shows the challenges facing African American people in, for example, the justice system.
Mathematics 12 01946 g011
Figure 12. (a) was generated from a text on sadness, substance misuse, parental disagreements, and parents facing more challenges. The allegory shows burdened parents climbing a hill with their children as ‘facing challenges’. (b) was generated based on exposure to tough times and feeling sad. (c) suggests that sad thoughts in parents are connected to the experiences of the children. (d) evokes the risks of “feeling very sad and wanting to be alone” and the protective effects of “feeling connected to others”. (e) shows “growing up in a family that doesn’t acknowledge their feelings” as a child facing mannequins. (f) portrays the effect of exposure to tough situations onto brain development.
Mathematics 12 01946 g012
Figure 13. (a) used the same prompt as Figure 12a on parents facing challenges. (b) illustrates that “people of African American [may] have interactions with the justice system, have parents who are incarcerated”. (c) personifies how “challenging childhood experiences and parental stress [impact brain development”. (d) shows how “connected individuals feel in their families and communities”. (e) echoes parental stress and disagreements, substance misuse, and children feeling sad. (f) shows parents facing multiple challenges.
Mathematics 12 01946 g013
Figure 14. We considered several diffusion (SDXL) models for text-to-image generation as alternatives to DALL-E 3: (a) Aetherverse, (b) CyberRealistic, and (c) Fluently. All of them portrayed fewer aspects of the prompt than DALL-E 3.
Mathematics 12 01946 g014
Disclaimer/Publisher’s Note: The statements, opinions and data contained in all publications are solely those of the individual author(s) and contributor(s) and not of MDPI and/or the editor(s). MDPI and/or the editor(s) disclaim responsibility for any injury to people or property resulting from any ideas, methods, instructions or products referred to in the content.

