Article

Modal Discontinuous Galerkin Simulations of Richtmyer–Meshkov Instability at Backward-Triangular Bubbles: Insights and Analysis

by
Salman Saud Alsaeed
1 and
Satyvir Singh
2,*
1
Department of Mathematics, College of Science, Jouf University, Sakaka P.O. Box 2014, Saudi Arabia
2
Applied and Computational Mathematics, RWTH Aachen University, 52062 Aachen, Germany
*
Author to whom correspondence should be addressed.
Mathematics 2024, 12(13), 2005; https://doi.org/10.3390/math12132005
Submission received: 26 May 2024 / Revised: 20 June 2024 / Accepted: 25 June 2024 / Published: 28 June 2024
(This article belongs to the Special Issue Numerical Solution of Differential Equations and Their Applications)

Abstract

:
This paper investigates the dynamics of Richtmyer–Meshkov instability (RMI) in shocked backward-triangular bubbles through numerical simulations. Two distinct gases, He and SF 6 , are used within the backward-triangular bubble, surrounded by N 2 gas. Simulations are conducted at two distinct strengths of incident shock wave, including M s = 1.25 and 1.50. A third-order modal discontinuous Galerkin (DG) scheme is applied to simulate a physical conservation laws of two-component gas flows in compressible inviscid framework. Hierarchical Legendre modal polynomials are employed for spatial discretization in the DG platform. This scheme reduces the conservation laws into a semi-discrete set of ODEs in time, which is then solved using an explicit 3rd-order SSP Runge–Kutta scheme. The results reveal significant effects of bubble density and Mach numbers on the growth of RMI in the shocked backward-triangular bubble, a phenomenon not previously reported. These effects greatly influence flow patterns, leading to intricate wave formations, shock focusing, jet generation, and interface distortion. Additionally, a detailed analysis elucidates the mechanisms driving vorticity formation during the interaction process. The study also thoroughly examines these effects on the flow fields based on various integral quantities and interface characteristics.

1. Introduction

Richtmyer–Meshkov instability (RMI) is a captivating and complex phenomenon in fluid dynamics, arising as two fluids with different densities with a disturbed interface caused by a shock wave [1,2]. This phenomenon generates various complex wave patterns, including the shock reflection–refraction mechanism, the creation of vorticity, considerable deformation of the interface, and the ensuing turbulent structures. The baroclinic process, which is brought on by the discrepancy of density gradient ( ρ ) and pressure gradient ( p ), is responsible for these events at the gas interface. RMI has profound implications across a range of scientific and engineering disciplines [3,4,5,6]. In astrophysics, understanding this instability helps elucidate the mechanisms behind supernova explosions and combining different star materials [7,8]. In inertial confinement fusion, RMI poses a challenge by potentially disrupting the symmetry required for efficient fusion reactions [9,10]. Similarly, in aerospace engineering, the instability affects the stability of interfaces in high-speed flight conditions, necessitating precise control and prediction for safe and efficient vehicle design [11,12]. Thus, researching RMI enhances our understanding of fluid dynamics and fosters innovation in technologies functioning under high-energy and high-speed environments.
In recent years, shocked gas bubbles have become a fundamental topic in RMI research. Numerous studies on shocked gas bubbles with different structures have been performed to assess the evolution of RMI through experimental, theoretical, and numerical methods. In order to characterize a complicated turbulent flow field characterized by shocked long-lasting vortex rings, Markstein [13] along with Rudinger and Somers [14] conducted the initial research experiments of the shocked gas bubble in the 1960s. A more detailed experimental study on shocked cylindrical/spherical gas bubbles was performed by Haas and Sturtevant [15]. Ranjan et al. [16] experimentally examined the physics of a shocked spherical bubble within a divergent shock-refraction configuration. In addition to these studies, several experimental investigations on shocked gas bubbles have been reported over the past few years [17,18,19,20,21].
Building on the experimental outcomes of Haas and Sturtevant, an in-depth computational study of shock bubble interaction was conducted by Quirk and Karni [22] using adaptive-mesh refinement and an innovative shock-capturing procedure. Bagabir and Drikakis [23] conducted the Mach number study on the flow fields generated by a shocked cylindrical helium bubble via numerical simulations. Shankar et al. [24] accomplished a computation examination on the significant effects of viscous terms on the shocked cylindrical interface filled with heavy gas. Further, Zhu et al. [25] organized a simulation analysis on the growth of RMI at a shocked SF 6 bubble featuring a transverse density gradient. Singh et al. [26] numerically investigated the performance of shocked cylindrical interfaces filled with helium gas following thermal non-equilibrium environment in non-monatomic gases. Recently, Singh at al. [27] investigated numerically the flow dynamism of interaction between shock and elliptical interfaces, intensifying the aspect ratio impact on the flow structure. A number of theoretical studies [28,29,30,31] have also contributed significantly to our understanding of the evolution of RMI, in addition to experimental and numerical investigations.
Previous research efforts primarily concentrated on RMI arising from shocked cylindrical, elliptical, and spherical bubbles. Recently, there has been increasing interest in examining the RMI evolution resulting from the interaction of incident shock wave with polygonal bubbles. With their transmitted shock waves, reflections, reciprocal shock collisions, and regular and irregular refractions, these polygonal shapes produce more complex flow fields. Bates et al. [32] examined the growth of RMI both numerically and experimentally at the shocked heavy rectangular interface. Luo and colleagues [33,34] investigated experimentally the flow field evolution in the different shocked-light/heavy polygonal interfaces. Igra and Igra [35,36] examined the complex wave patterns and pressure distribution within various shocked polygonal interfaces with different gases through a numerical research. Singh [37] looked numerically into the consequence of the Atwood numbers on the RMI development at square bubbles filled with various gas compositions. Later, Singh et al. examined a range of physical phenomena ensuing from the interaction of shock wave with polygonal bubbles, including shock Mach number [38], thermal nonequilibrium environment [39], and aspect ratio [40]. So far, there has been no comprehensive study in the literature addressing the evolution RMI and associated vorticity in the shocked backward-triangular interfaces with different gas densities, which is the primary focus of this research. These configurations present unique challenges and opportunities for advancing our understanding of shock-driven instabilities.
Investigating RMI through physical experiments is challenging due to the transient nature of the flows, the difficulty in accurately characterizing the initial conditions of the interface, and the complexity of obtaining uncertainty-quantified measurements. Consequently, numerical simulations are frequently utilized to complement the RMI study [24]. In this context, selecting high-fidelity simulations is essential for obtaining reliable RMI quantitative predictions. By employing advanced numerical techniques and high-resolution computational schemes, these simulations offer valuable understanding into the basic mechanisms driving the RMI and its impact on various physical systems [31]. The RMI literature makes use of a variety of high-resolution computational algorithms in conjunction with spectral, finite-difference, and adaptive grid refinement techniques [41,42,43,44,45]. In recent decades, discontinuous Galerkin (DG) methods have gained significant popularity for solving complex systems of PDEs, particularly in the field of computational fluid dynamics [46]. The DG method is a numerical technique, combining elements of the finite element method (FEM) and finite volume method (FVM). It offers higher-order accuracy through local polynomial approximations and handles complex geometries using unstructured meshes. Its use of discontinuous basis functions allows for local adaptivity and easy management of complex boundary conditions, and its element-wise formulation is ideal for parallel computation. In DG methods, two distinct discretization approaches, known as modal [46,47,48,49,50,51,52] and nodal [53,54,55,56,57,58] formulations, are commonly employed based on the selection of basis polynomials. In the framework of the nodal formulation, the modal formulation uses an explicit approximation space to construct quadrature-based operators [59]. This allows for various choices for surface and volume quadrature, including the exclusion of border nodes and the use of over-integrated rules. Additionally, p adaptation is straightforward since the basis functions remain unchanged when increasing the polynomial approximation order.
To make the comprehension and assessment of the RMI development and the associated vorticity generating mechanisms easier, we review the experimental inspection done by Luo et al. [34] at the shocked forward-triangular bubbles, and develop a structured framework using the modal DG simulations. Furthermore, we examine the impacts of different gas density configurations on the primary processes of the shocked backward-triangle bubble, including issues like jet production, flow patterns, wave properties, integral quantities and interface features. The remaining sections of the paper are arranged in the following manner, which leads directly to the goal of our study: The problem description is introduced in Section 2. The mathematical formulations and descriptions of physical quantities are shown in Section 3. The validation research and numerical approach are examined in Section 4. The grid convergence and simulation results of the shocked backward-triangular bubble are discussed in Section 5. Lastly, the conclusion with outlook of this investigation is given in Section 6.

2. Problem Description

Figure 1 illustrates the problem organization involving a shocked backward-triangular gas bubble. The numerical simulations are conducted within a rectangular domain measuring 200 × 100 mm 2 . The setup features a stationary backward-triangular bubble of edge length L = 30 mm and a moving planar shock wave along the x-direction, characterized by Mach numbers M s = 1.25 and 1.50. The planar shock wave is initially established 20 mm from the left domain boundary, and the backward triangle is established 5 mm from the incident shock. The top, bottom, and right boundaries of this computational domain are defined as outflow, whereas the left boundary is represented by an inflow condition. In this organization, the ambient environment is nitrogen ( N 2 ) gas, while two distinct gases—helium (He) and sulfur hexafluoride ( SF 6 )—are utilized as the testing gases inside the backward-triangular bubbles. The material attributes of tested gases are compiled in Table 1. Furthermore, P 0 = 101,325 Pa and T 0 = 273 K are the initial pressure and temperature values around the backward-triangular bubbles, respectively.

3. Mathematical Formulation

3.1. Physical Conservation Laws for Compressible Two-Component Flow

In the initial stages of RMI, the growth of perturbations is primarily driven by the shocked impulsive acceleration. The inviscid model captures this behavior well because the primary forces at play are inertia and pressure differences. Viscosity, being a dissipative force, has a relatively minor effect during this impulsive phase, leading to the common assumption that its impact is negligible in early-stage RMI analysis. The inclusion of viscosity in RMI research is essential for accurately capturing the long-term evolution. The impact of viscosity becomes significant in damping perturbations, dissipating energy, and influencing the transition to turbulence as the instability progresses.
This study aims to examine the initial-stage evolution of RMI in a backward-triangular bubble. Consequently, we model the two-component gas flow using a 2D system of compressible Euler equations, which are given in their conservative form:
U t + F 1 ( U ) x + F 2 ( U ) y = 0 ,
where U 5 the vector of conservative variables, F 1 ( U ) 5 × 1 and F 2 ( U ) 5 × 1 the vectors of nonlinear fluxes in x- and y-directions, respectively, are defined as
U = ρ ρ u ρ v ρ E ρ ϕ , F 1 ( U ) = ρ u ρ u 2 + p ρ u v ( ρ E + p ) u ρ ϕ u , F 2 ( U ) = ρ v ρ u v ρ v 2 + p ( ρ E + p ) v ρ ϕ v .
In these expressions, density is denoted by ρ ; velocity components in x- and y- directions are given by u and v, respectively; pressure is denoted by p; and energy is signified by E and calculated by the following mathematical formula:
ρ E = p γ m i x 1 + 1 2 ( u 2 + v 2 ) ,
with γ m i x as the mixture of twp specific heat ratios. p = ρ R T is used as equation of state for the mixture, where R and ρ denote the gas constant and density for the considered gas mixture, respectively. With the specific heat ratios ( γ 1 , γ 2 ) , specific heats at constant volume ( C v 1 , C v 2 ) , and specific heats at constant pressure ( C p 1 , C p 2 ) , two component gas flow is considered to be in thermal- equilibrium, and also to be perfect calorically gases. In this context, one can compute a specific heat ratio for the gas mixture using the formula
γ m i x = C p 1 ϕ 1 + C p 2 ϕ 2 C v 1 ϕ 1 + C v 2 ϕ 2 .
Here, the mass fractions of the backward-triangle gas bubble and ambient environment are denoted by ϕ 1 and ϕ 2 = 1 ϕ 1 , respectively. For numerical simulations, we set ϕ 1 = 0.95 and ϕ 2 = 0.05 .

3.2. Initial Conditions

The computational simulations are initialized using evaluating the post-shock state formulated on the Rankine–Hugoniot situations, which are given by
M 2 2 = 1 + ( γ 1 ) 2 M s 2 γ M s 2 ( γ 1 ) 2 , p 2 p 1 = 1 + γ M s 2 1 + γ M 2 2 , ρ 2 ρ 1 = γ 1 + ( γ + 1 ) p 2 p 1 γ + 1 + ( γ 1 ) p 2 p 1 .
In this expression, M s represents the strength of Mach number, and subscripts 1 and 2 correlate to the pre-shock ambient gas evaluations and post-shock evaluations behind the planar shock, respectively at initial stage. In this study, two distinct Mach numbers, M s = 1.25 , 1.50, are considered for the computational simulations.

3.3. Description of Physical Parameters

In this subsection, we discuss various physical parameters, which are utilized to characterize the flow structure and analysis of the shocked backward gas bubble.

3.3.1. Atwood Number

In shocked gas bubble, the flow configurations essentially depend on a dimensionless number, the so-called Atwood number (A). If ρ b and ρ a are the densities of the bubble gas and ambient gas, respectively, an Atwood number is then computed as
A = ρ b ρ a ρ b + ρ a , 1 A 1 .

3.3.2. Vorticity

Vorticity is a measure of the local rotation or spin of a fluid element, often indicating the presence of vortices in fluid flow. It can be described as the velocity vector’s curl.
ω = × u .

3.3.3. Vorticity Transport Equation (VTE)

In RMI research, the vorticity transport equation (VTE) helps in understanding how the vorticity is generated due to shock wave interactions with density interfaces. The VTE for unsteady compressible inviscid flow is stated as
D ω D t = ( ω · ) u ω ( · u ) + 1 ρ 2 ( p × ρ ) .
In this expression, the left part denotes the material derivatives, which are given by ω t + ω c = ω / t + ( u · ) ω . The first term on the right part represents stretching of the vorticity resulting from changes in the flow’s velocity gradient, which is not present in turbulent flows that are two-dimensional. The following expression represents the stretching of vorticity because of flow compressibility. Ultimately, baroclinic vorticity, which is the third term, is important for producing modest vortical forms at the bubble surface.
In addition, three significant spatial integrated fields are presented to modernize our insight on vorticity generation in the shocked gas interfaces: average vorticity, dilatational, and baroclinic vorticty generating terms. Mathematical formulations of these quantities are given as
ω a v ( t ) = D | ω | d x d y D d x d y ,
ω d i l ( t ) = D ω ( · u ) d x d y D d x d y ,
ω b a r ( t ) = D 1 ρ 2 ( p × ρ ) d x d y D d x d y ,
where D represents the entire computational domain.

3.3.4. Enstrophy

The evolution of enstrophy, which quantifies the intensity of vorticity in a fluid flow, is a key factor in understanding the dynamics of turbulence and the dissipation of kinetic energy. It is calculated by the following formula:
Ω ( t ) = 1 2 D ω 2 d x d y .

3.3.5. Kinetic Energy

The kinetic energy in compressible flow provides important insights into the dynamics and behavior of fluids under varying pressure and temperature conditions. The spatial integrated value of kinetic energy is calculated as
K . E . ( t ) = 1 2 D u 2 d x d y .

4. Numerical Method and Validations

The numerical approach and related validation studies are covered in this part. A high-order explicit modal DG algorithm is used to simulate the physical conservation law of two-component gas flow.

4.1. Numerical Method Based on Modal DG Scheme

4.1.1. Spatial Discretization

The 2D-computational domain D 2 is introduced first, and it is divided into uniform rectangular elements I 1 , , I m , each of which is designed to the referred element I r = [ 1 , 1 ] 2 . This is carried out prior to using the modal DG method on Equation (1). Through X m ( ξ , η ) = ( x , y ) T , the bilinear mappings X m : I r I m are described as
X i ( ξ , η ) = 1 4 [ x 1 ( 1 ξ ) ( 1 η ) + x 2 ( 1 ξ ) ( 1 + η ) + x 3 ( 1 + ξ ) ( 1 + η ) + x 4 ( 1 + ξ ) ( 1 η ) ] .
In the case i = 1 , , m , the corners of the element I k are represented by { x 1 , x 2 , x 3 , x 4 } . The uniform elements require the Jacobian of the chosen mapping to be constant, meaning that J = 1 4 Δ x Δ y = Δ x 2 4 for equal side length of the elements. Δ x = Δ x i = Δ y i = Δ x , where i = 1 , , m for each term.
After this step, we illustrate a test function space, which contains the approximation solutions. To be more precise, the functional space contains the following conventional choice for DG schemes:
V h k = { ν [ L 2 ( D ) ] 5 : ν | I i [ P k ( I i ) ] 5 , i = 1 , , m } ,
where the class of all basis polynomials on I m of maximum degree k is indicated by the symbol P k ( I m ) . Now, in each spatial direction on I r , a basis polynomial of degree k approximates the specific conserved variable U 5 in each element.
U h ( x , y , t ) | I m = U h ( ξ , η , t ) i , j = 0 N k U i j φ i ( ξ ) φ j ( η ) .
Here, the time-dependent variables for the prescribed element I m are denoted by U i j U h ( x , y , t ) | I m , and the overall number of polynomial functions required for a k-exact DG approximation is indicated by N k = ( k + 1 ) 2 . The method used in this work involves interpolating scaled orthogonal Legendre basis functions, which are defined as
φ i ( ξ ) = 2 i ( i ! ) 2 ( 2 i ) ! P i ( ξ ) , for i = 0 , , N k ,
where P i ( ξ ) depicts the Legendre basis polynomials. A weak form of Equation (1) is formulated to start the discretization process. This variant is obtained by performing integration by parts after multiplying Equation (1) by a test function φ h and integrating it across the domain I m :
t I m U h φ h d V I m F 1 ( U h ) φ h x d V + I m φ h F 1 ( U h ) · n x d Γ I m F 2 ( U h ) φ h y d V + I m φ h F 2 ( U h ) · n y d Γ = 0 .
In the above-mentioned mathematical equation, n = ( n x , n y ) is the outward unit normal vector. The rectangular element I m ’s boundary is represented by Γ , whereas V denotes the volume. The numerical solution U h is discontinuous across element interfaces, which means that there is no distinct specification for the interface fluxes. The flux functions in Equation (18) are thus replaced by their numerical equivalents, F 1 N F and F 2 N F , respectively, and F 1 · n x and F 2 · n y . As such, the weak formulation that was previously described can be expressed as follows:
t I m U h φ h d V I m F 1 ( U h ) φ h x d V + I m φ h F 1 N F ( U h ) d Γ I m F 2 ( U h ) φ h y d V + I m φ h F 2 N F ( U h ) d Γ = 0 .
The Gauss–Legendre quadrature method is used to calculate all integrals in the weak formulation (19), selecting the right number of integration points to achieve the required precision. The analysis indicates that for polynomials of degree 2 k + 1 and 2 k , respectively. When employing P l techniques, the quadrature rules for both volume and the surface integral must be accurate [46].

4.1.2. Numerical Fluxes

In the present work, the HLLC Riemann solver [60], which is specifically made for two-component flows, is used to determine the numerical inviscid fluxes at the elemental interfaces. This approach can be described as
F H L L C = 1 s i g n ( S ) 2 F R + 1 + s i g n ( S ) 2 F L .
The intermediate fluxes in this case are denoted by F L and F R , and the intermediate wave speed is indicated by S . The following equations can be used to calculate these amounts:
F k = F k + S k ( U k U k ) , k = L , R , S = P R P L + ρ L u L ( S L u L ) ρ R u R ( S R u R ) ρ L ( S L u L ) ρ R ( S R u R ) ,
with
U k = S k u k S k S ( ρ ) k ( ρ u ) k ( ρ v ) k ( ρ E ) k + ( S u k ) ρ k S + P k ( S k u k ) ( ρ ϕ ) k , k = L , R ,
where the left and right wave speeds are indicated by S L and S R , respectively, and could be evaluated as
S L = min ( S L , 0 ) , S R = max ( S R , 0 ) , S L = min ( u ¯ c ¯ , u L c L ) , S R = max ( u ¯ + c ¯ , u R + c R ) , u ¯ = ρ L u L + ρ R u R ρ L + ρ R , c ¯ 2 = ρ L c L 2 + ρ R c R 2 ρ L + ρ R + 1 2 ρ L ρ R ( ρ L + ρ R ) 2 ( u R u L ) 2 .

4.1.3. Temporal Discretization

The sum of elemental contributions, as obtained from the modal DG establishment of the physical conservation laws, ultimately yields a semi-discrete system in time, as follows:
M d U d t = L ( U ) .
Here, M denotes the mass matrix in block diagonal form, and L ( U ) denotes the residual vector. Notably, the diagonal structure of M makes it easy to manually find the inverse for each element. An explicit third-order explicit strong stability preserving Runge–Kutta (SSP-RK) technique is used to achieve time integration [61].
U ( 1 ) = U n + Δ t L ( U n ) , U ( 2 ) = 3 4 U n + 1 4 U ( 1 ) + 1 4 Δ t L ( U 1 ) , U n + 1 = 1 3 U n + 2 3 U ( 2 ) + 2 3 Δ t L ( U ( 2 ) ) .
For each rectangular element, the time step Δ t is determined as
Δ t = C F L ( 2 k + 1 ) h | λ m a x | ,
where C F L is the Courant–Friedrichs–Lewy number. h denotes the minimum value between Δ x and Δ y . λ m a x denotes the highest wave velocity of the inviscid flux. For all upcoming simulations, the C F L number is considered as 0.1.

4.1.4. Higher-Order Moment Limiter

The preset modal DG method incorporates a higher-order moment limiter, as suggested by Krivodonova [62], to remove spurious numerical variations from the solutions. This allows one to limit an approximation to a higher order without going all the way down to the first order. In this limiter, the highest moment of the solution is restricted initially. Lower moments will be limited in turn if the higher moments are changed throughout the limiting process. Here is a summary of the process for putting this limitation into practice. The modal coefficient U i , j k , m on the element ( k , m ) can be constrained as
U ˜ i , j k , m = minmod ( U i , j k , m , α j ( U i , j 1 k , m + 1 U i , j 1 k , m ) , α j ( U i , j 1 k , m U i , j 1 k , m 1 ) , α i ( U i 1 , j k + 1 , m U i 1 , j k , m ) , α i ( U i 1 , j k , m U i 1 , j k 1 , m ) ) , 1 i , j N k .
with the minmod function
minmod ( f , g , h ) = sgn ( f ) min ( | f | , | g | , | h | ) , i f sgn ( f ) = sgn ( g ) = sgn ( h ) 0 , otherwise
and the value of α is calculated as [62]
1 2 4 n 2 1 α n 2 n 1 2 n + 1 , n N k .
The value of α n is chosen as 0.75, i.e., α i = α j = 0.75 for the subsequent numerical simulations shown in Section 5.

4.2. Validations

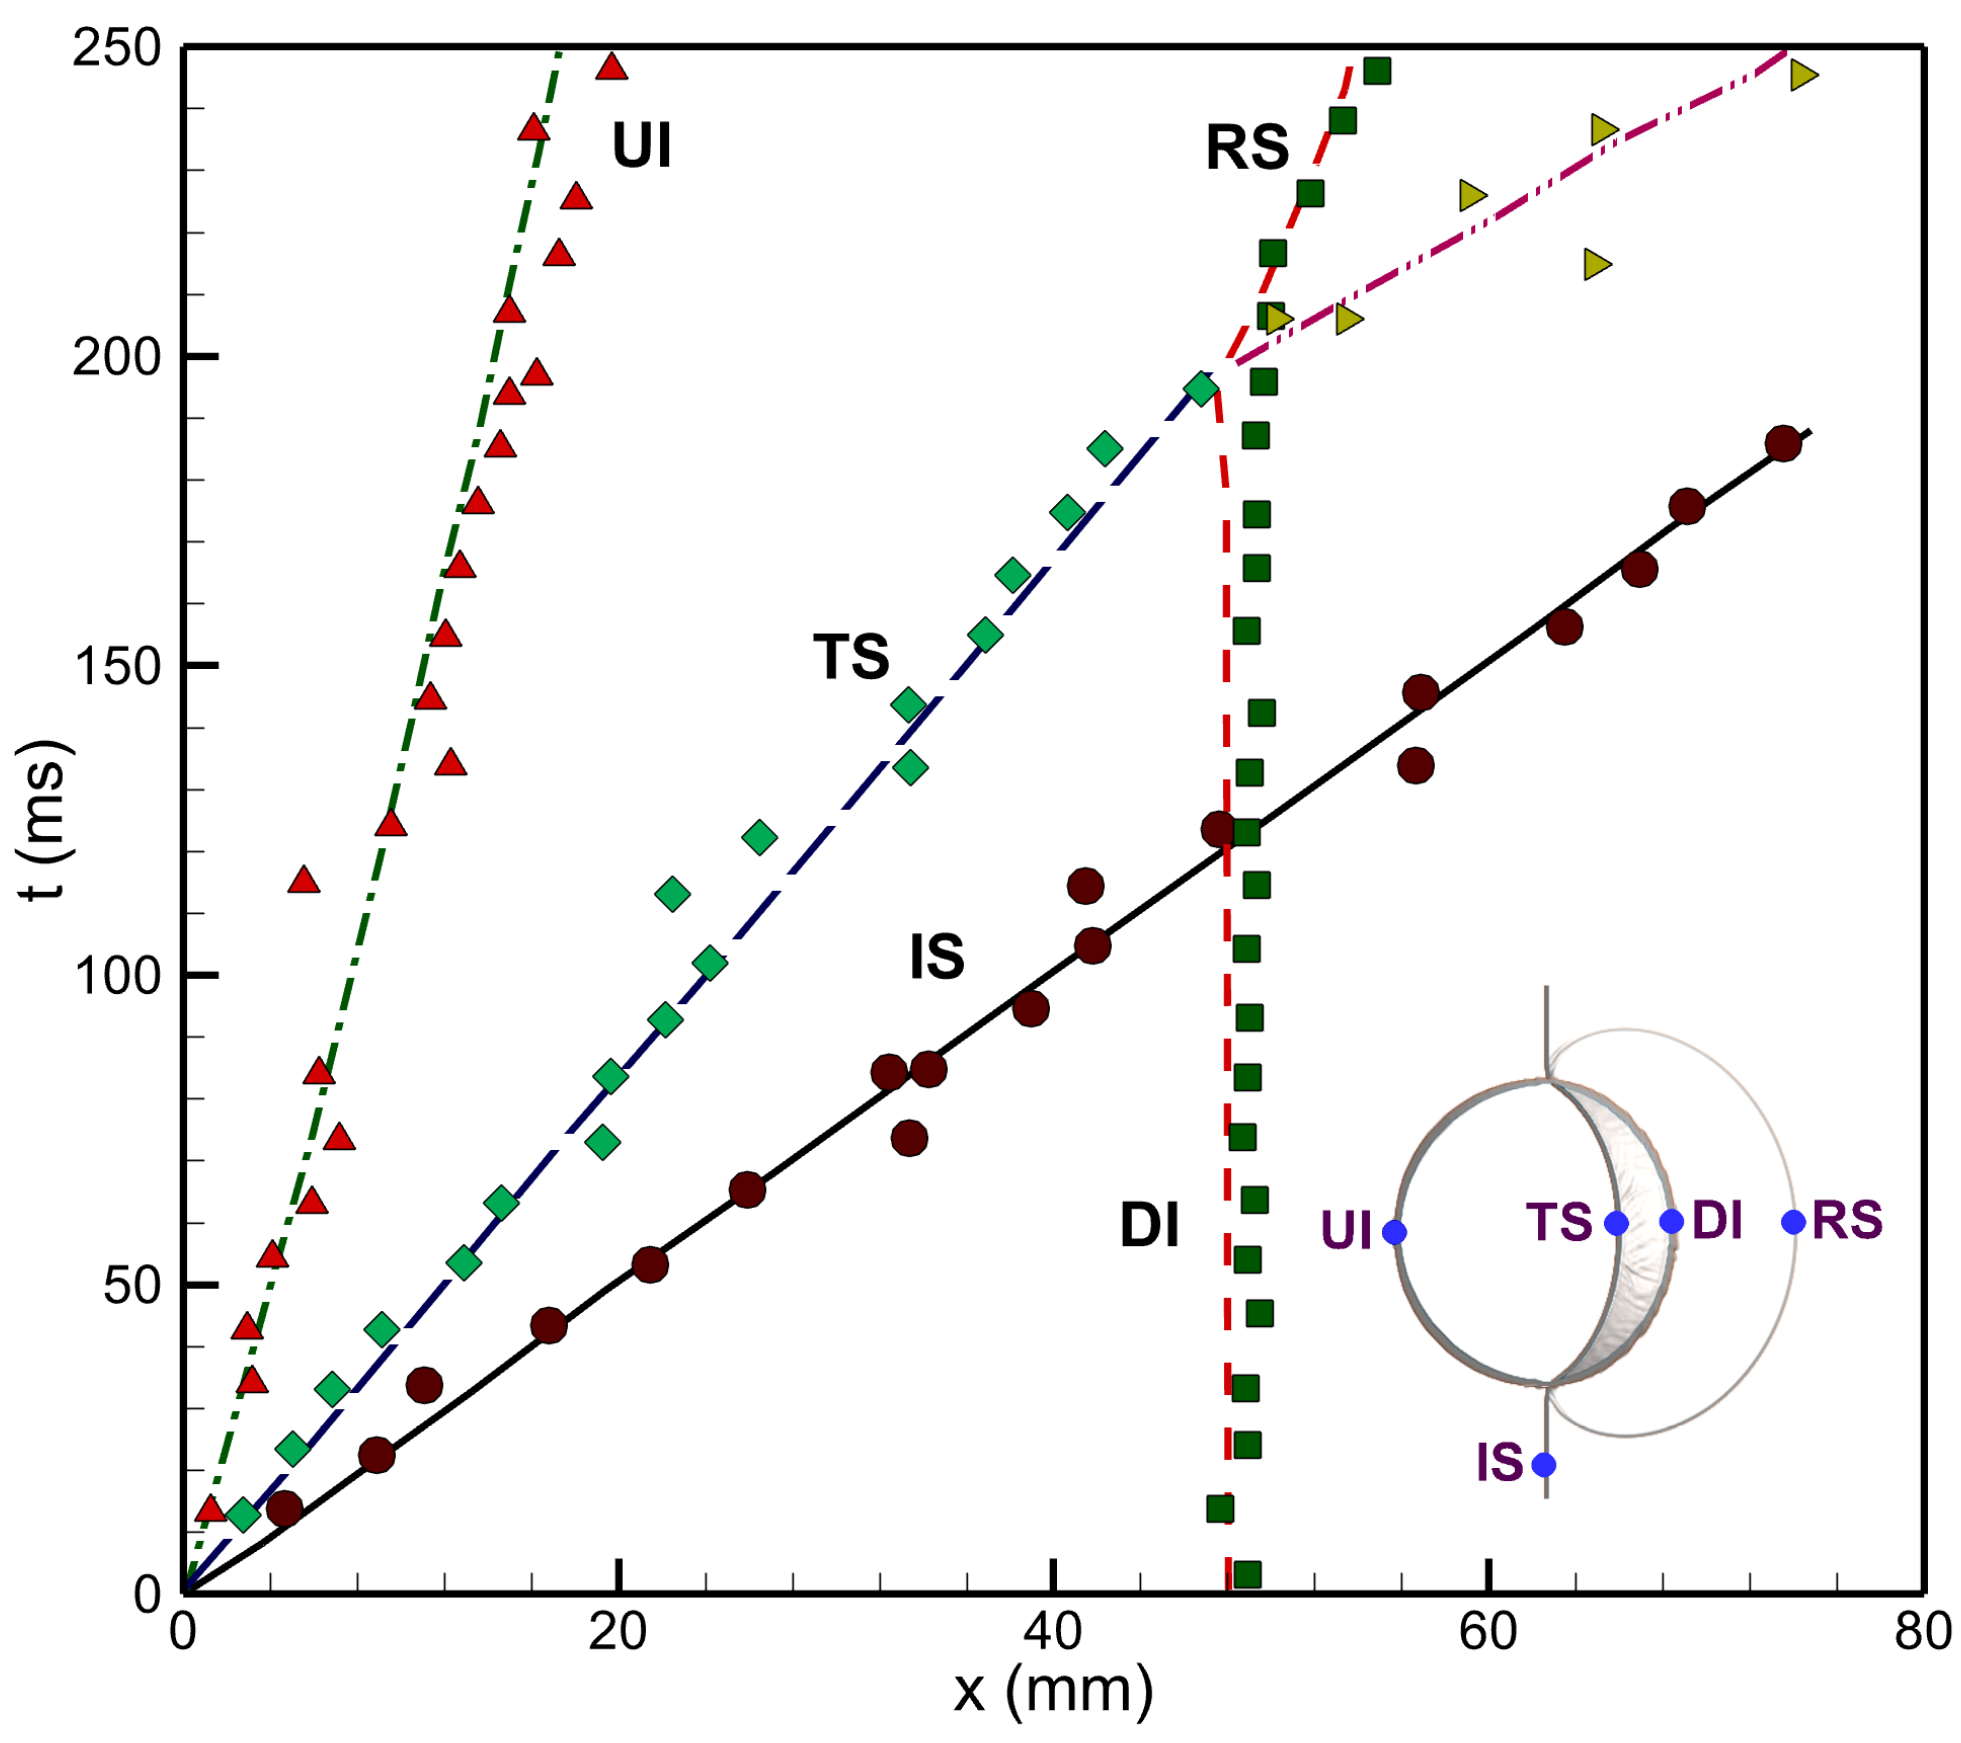
In the first validation case, a shocked cylindrical bubble is selected, comparing experimental results from Hass and Sturtevant [15] and computational results from Quick and Karni [22] with current numerical data. This research examines a shocked cylindrical gas bubble of Refrigerant-22 ( R 22 ) surrounded by an air-filled zone. The weak shock with M s = 1.22 has been used. Figure 2 displays schlieren images at different times, comparing experimental, computational, and current numerical results, which all show similar vortex and outward jet formations. Figure 3 presents the space-time diagram for various shocks and interfaces, accurately replicating their locations and speeds, closely matching the experimental data [15].
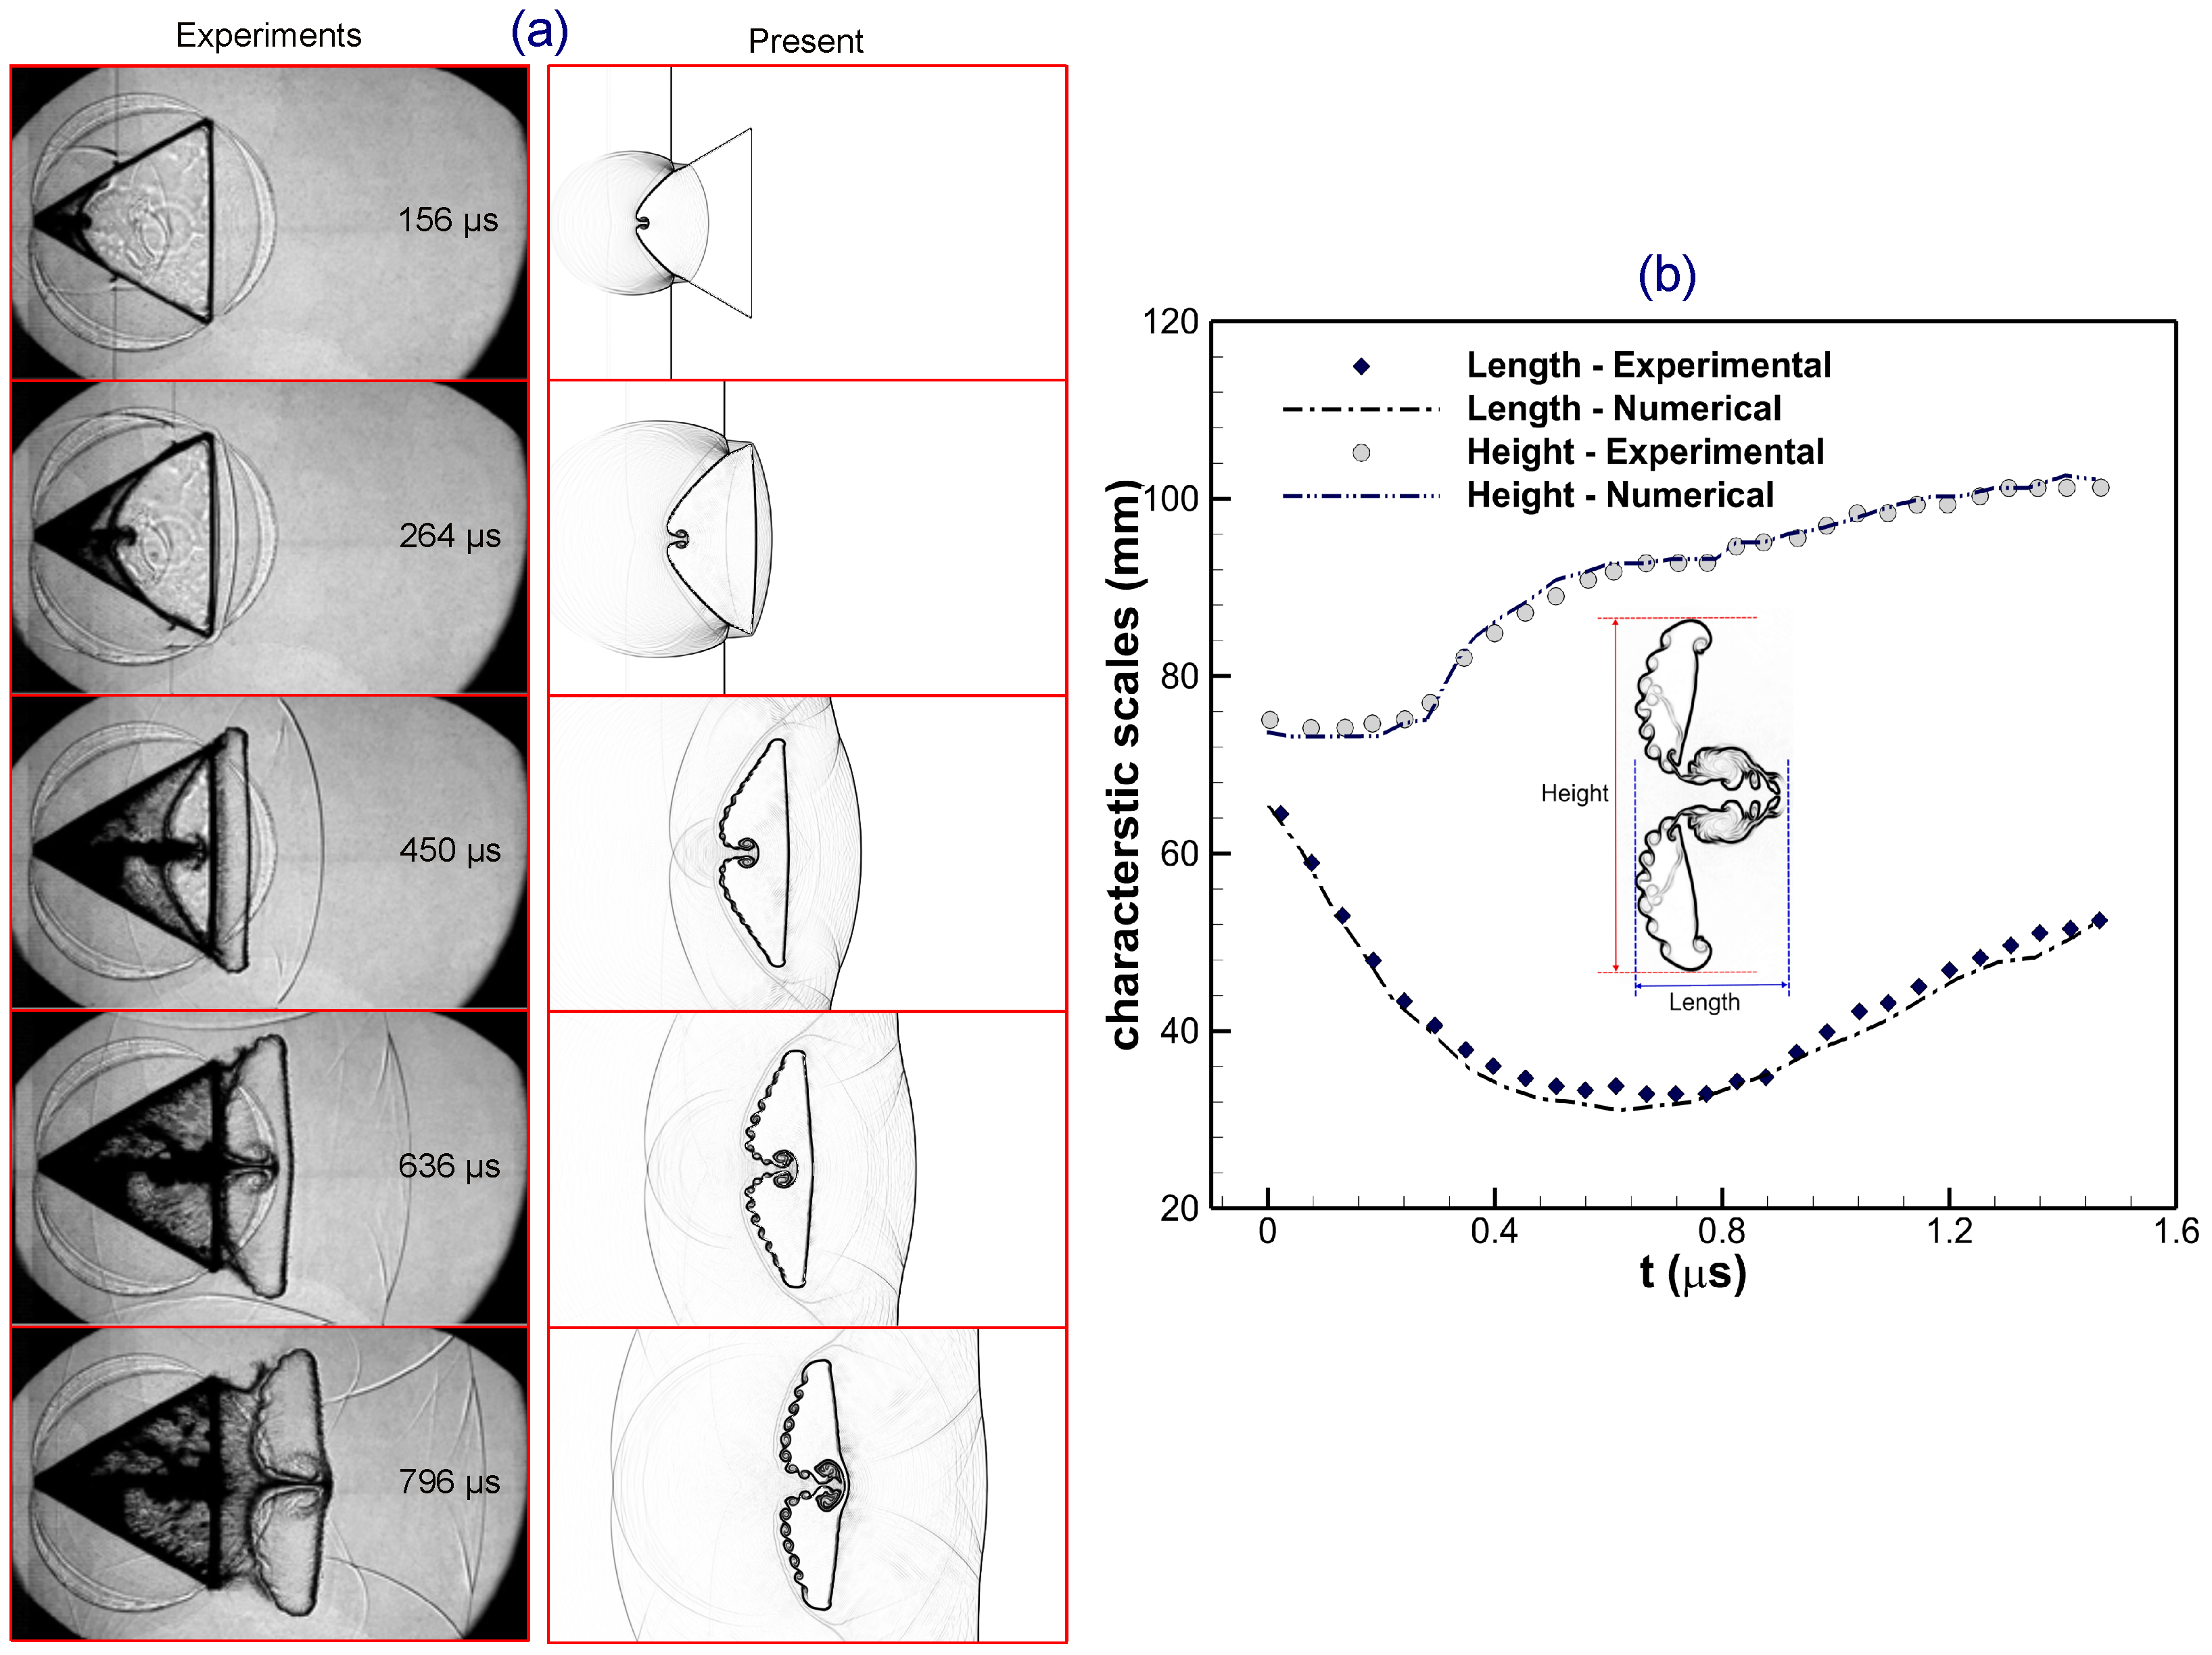
In the next validation case, the numerical outcomes are compared with the experiments of Zhai et al. [33] to evaluate the accuracy of the current model as well DG solver. This is a situation with a forward-triangular gas bubble filled with N 2 , surrounded by SF 6 gas, and subjected to a weak planar shock wave with a Mach number of M s = 1.29 . Figure 4a shows schlieren images comparing experimental data of Zhai et al. [33] and present simulations at different instants. Both sets of images have the same flow field visualizations, showing excellent agreement. Additionally, Figure 4b illustrates the temporal changes in the length and height of the N 2 triangular bubble, indicating a good match between the experiment and present outcomes.

5. Results and Discussion

This section investigates the flow mechanism of RMI development in shocked forward-triangular bubble filled with He and SF 6 gases, surrounded by N 2 gas. The numerical simulations are performed with two Mach numbers M s = 1.25 and 1.50. The effects of varying gas densities on flow morphology, wave patterns, vorticity generation, the evolution of enstrophy and kinetic energy, and interface features are highlighted.
Normalized time is used in the following simulations to display flow morphology snapshots. The characteristic time t 0 = L / W i normalizes the actual computational time, where τ = t / t 0 = t W i / L , where W i is the incident shock wave’s velocity and L is the square’s edge length. Numerical shadowgraphs, which depend on the density gradient magnitude s = | ρ | , are used to visualize the numerical results.

5.1. Mesh Convergence

In order to precisely represent the intricate flow field structure of RMI evolution, a mesh convergence analysis is carried out. This entails applying a third-order accurate modal DG solver to a test case on a shocked backward-triangular He bubble using three grid configurations: “Mesh-I”, “Mesh-II”, and “Mesh-III”, with grid points of 400 × 200 , 800 × 400 , and 1200 × 600 , respectively. The numerical schlieren pictures of the shocked He bubble at time t = 5 are displayed in Figure 5. At this point, the bubble is compressed by the shock wave, resulting in a divergent shape with primary vortex rings at the upstream corner. The Kelvin–Helmholtz instability (KHI), which is shown as small-scale vortices on the bubble interface and becomes more pronounced and observable at finer grid sizes, is the primary distinction between the three meshes. As a result, the ’Mesh-III’ configuration is used for all numerical calculations.

5.2. Flow Structures and Wave Patterns

Figure 6 shows the time evolution of flow structure in the shocked backward-triangular He bubble at different Mach numbers M s = 1.25 , 1.50, where density contours are shown in the upper half of each sub-figure, while numerical shadowgraphs are shown in the lower half. Remarkably, comparable physical processes are noted for both Mach numbers. In the instance of M s = 1.25 as illustrated in Figure 6a, a leading transmitted shock (TS1) passes about one-third of the length of the bubble downstream as the incidence shock (IS) wave strikes the triangular bubble, while a rarefaction shock (RS) wave moves upward together with a curved reflected rarefaction (CRR) wave in the ambient ( τ = 1 ). The TS1 wave inside the triangular helium bubble travels much quicker than the IS wave outside the bubble because helium has low density. The IS and the TS1 wave are connected by the free precursor shock wave (FPS), which is formed as the bubble interface refracts the TS1 wave once again. As a result, an erratic pattern is produced, which includes a Mach stem (MS) and triple points (TP) outside the bubble ( τ = 2 ). Due to the vorticity deposition, tiny primary vortex (PV) pairs are seen at the left corners of the triangle bubble. A second transmitted shock (TS2) forms as time goes on and moves downward in the flow field as the TS1 strikes with apex corner of triangular bubble ( τ = 3 ). Furthermore, two oblique shock waves, the so-called reflected free precursor shock (RFPS) waves, are now connected and continue their propagation downstream. A diffracted shock (DS) wave is also observed in the flow fields over time ( τ = 5 ). The impact of the IS wave on the evolution of interface morphology gradually decreases, and on the triangular interface, the KHI leads to the emergence of certain modest vortex forms ( τ = 7 ). With proceeding time, the triangular bubble continues to deform and takes a trapezoidal shape with its larger part facing the on-coming post-shock flow. Furthermore, one secondary vortex (SV1) ring is observed at the triangular interface to abundance of baroclinic vorticity production ( τ = 10 ). In addition, the triangle’s left interface begins to sink inward due to the formation of a re-entrant helium jet. As the jet eventually reaches the downstream bubble interface, the main vortex (PV) rings form and grow over a bridge almost symmetrically. Subsequently, the flow field is entirely controlled by the jet and rings of vortex formed ( τ =15–20). Remarkably, the high Mach number M s = 1.5 causes a stronger interaction between the shock and bubble, as shown in Figure 6b. Furthermore, as the Mach number increases, the bubble deforms significantly. As a result, the generated wave patterns become more complex, and the triangle size decreases noticeably. Furthermore, there is a notable increase in the strength of the rolled-up vortices, leading to the generation of several secondary vortex rings at the triangle interface. These vortices are conspicuous at the interface between the bubble and surrounding gas due to the baroclinic vorticity deposition.
Figure 7 illustrates the time evolution of the flow structure in the shocked SF 6 backward-triangular bubble at M s = 1.25 and 1.50. In both scenarios, the flow structure generated by the shocked backward-triangular bubbles is similar. Because of the higher density of the bubble, the IS wave moves more slowly inside than outside, with the IS wave outside the bubble moving far faster than the TS1 wave inside. In the M s = 1.25 case, depicted in Figure 7a, the IS wave passes through the triangular bubble, sweeping its front and sides ( τ = 2 ). This results in the formation of a lateral transmitted shock (LTS) wave, which moves downstream more slowly than the IS wave, and a reflected shock (RS) wave moving upstream. Additionally, baroclinic vorticity forms a small upstream vortex pair (UVR) at the left corners of the triangular interface. Over time, the IS wave propagates over the upper and lower interfaces of the bubble, leading to irregular refraction. Two slip lines (USL, LSL), triple points (TP) inside the bubble, an internal Mach stem (IMS1), and extra shock waves (S1 and S2) are produced by the interaction between the TS1 and LTS waves. The IS wave’s main portion eventually passes in front of the bubble, and a curved diffracted shock (DS) wave joins the top and bottom ends of the wave’s two straight portions. Concurrently, in the leeward corner of the triangle, reversed transmitted shock (RTS) and inward secondary shock (ISS) waves emerge and go upstream ( τ = 6 ). The collision of the DS waves causes a shock focusing (SF) phenomenon inside the triangle near the leeward stagnation point. Over time, the UVR grows, and two additional transmitted shock waves (TS2, TS3) form after focusing, extending outward downstream. Peak pressure is eventually created by the intricate interaction of shocks inside the bubble along the downstream centerline ( τ = 10–15), which leads to the formation of a SF 6 jet and downstream vortex rings (DVR). Rolled-up vortices become more noticeable near the bubble–gas interface as their size increases. The resultant jet develops along alike vortex pairs ( τ = 20 ). In Figure 7b, the higher shock Mach number causes stronger interaction between the shock and bubble, leading to significant deformation of the backward-triangular bubble. Additionally, due to baroclinic vorticity deposition, the rolled-up vortices become stronger and larger, particularly noticeable at the interface where the bubble meets the surrounding gas.

5.3. Vorticity Generation and Transport Mechanisms

Figure 8 presents an abstract representation of vorticity generation in the initial stage of shocked backward-triangular bubbles in light ( At < 0 ) and heavy ( At > 0 ) gases. In these shocked-bubble flows, the bubble is influenced primarily by the density gradient, while the IS wave is driven by the pressure gradient. When the IS wave traverses the triangular bubble, baroclinic vorticity forms and spreads along the bubble’s interface because of the pressure and density gradients’ mismatch, expressed as ρ × p 0 . This misalignment significantly affects the development of the RMI. Small-scale vortices emerge at the leftmost vertical interface of the triangular bubble, where the pressure and density gradients completely coincide, yet the bubble retains its shape after the IS wave passes. The direction in which these vortices rotate is determined by the orientation of the density gradient at this interface. Furthermore, a Mach reflection happens when the IS wave interacts with the horizontal interfaces; the Mach stem connects the IS wave to the triangular interface. By adding to the pressure gradient involved in the creation of vorticity, this Mach stem also helps to gradually create baroclinic vorticity along the bubble interface.
Figure 9 illustrates the vorticity generation mechanism in shocked He/ SF 6 backward-triangular bubbles at two shock Mach numbers M s = 1.25 , 1.50. Significant variations in vorticity generation are noted for both cases following the interaction. As seen in Figure 9a, in the case of shocked He backward-triangular bubbles, the positive and negative vorticities are formed on the upper and lower sides of the triangle interface, respectively. This is the outcome of the IS wave traveling from left to right along the triangle interface. As a result, the pressure gradient spans across the upstream IS wave, while the density gradient radiates outward from the bubble boundary. Furthermore, a vortical structure with positive vorticity in the center and negative vorticity in the surrounding tails is present in the upper section of the triangle interface, while the lower section displays the opposite pattern. Interestingly, in the case of shocked SF 6 backward-triangular bubbles, as shown in Figure 9b, a considerable extent of negative and positive vorticity is generated on the bottom and top parts of the triangular interface. There is significant vorticity at both upper and lower vortex pairs (UVR and DVR) located at the left corners of the triangle. Additionally, after shock focusing, the deformed shock wave produces small amounts of both positive and negative vorticity on the upper and lower interfaces. The predominant positive vorticity accumulates in the upper-half plane, while the dominant negative vorticity gathers in the lower-half plane of the jet head. When the deformed shock wave strikes the triangle’s downstream pole, its amplitude attenuates more, which is probably why this dominant vorticity occurs. The jet movement caused by the positive and negative vorticities in the upper and lower jet heads, respectively, suggests a link between vorticity deposition and jet formation.
Figure 10 illustrates the spatial integrated fields of dilatational ( ω d i l ) and baroclinic ( ω b a r o ) production terms in the VTE of shocked He/ SF 6 backward-triangular bubbles at two Mach numbers M s = 1.25 , 1.50. The plots demonstrate how during the interaction, both terms acquire considerable values and quickly increase after traversing the shock wave. Due to compressibility effects resulting from local regions of compression and expansion, the plot of the ω d i l term demonstrates the presence of locally stretched structures surrounding the vortex core. Remarkably, in contrast to He bubble, the ω d i l term in the SF 6 bubble has an elevated value. On the other hand, the misalignment of pressure and density gradients is captured in the plot of the ω b a r o term, which in turn displays the reflected shock structures and vorticity created by the presence of contact discontinuity. Interestingly, the ω b a r o term enhances in SF 6 bubble in contrast to He bubble, which implies that the ambient gas is increasingly entrained into the distorted triangle interface. In both shocked backward-triangular bubbles, the spatial integrated fields are considerably strengthened at M s = 1.50 . As such, there is a straightforward non-monotonic link between the evolution of the spatially integrated fields for vorticity-generating terms and the surrounding gas.

5.4. Enstrophy Generation Mechanism

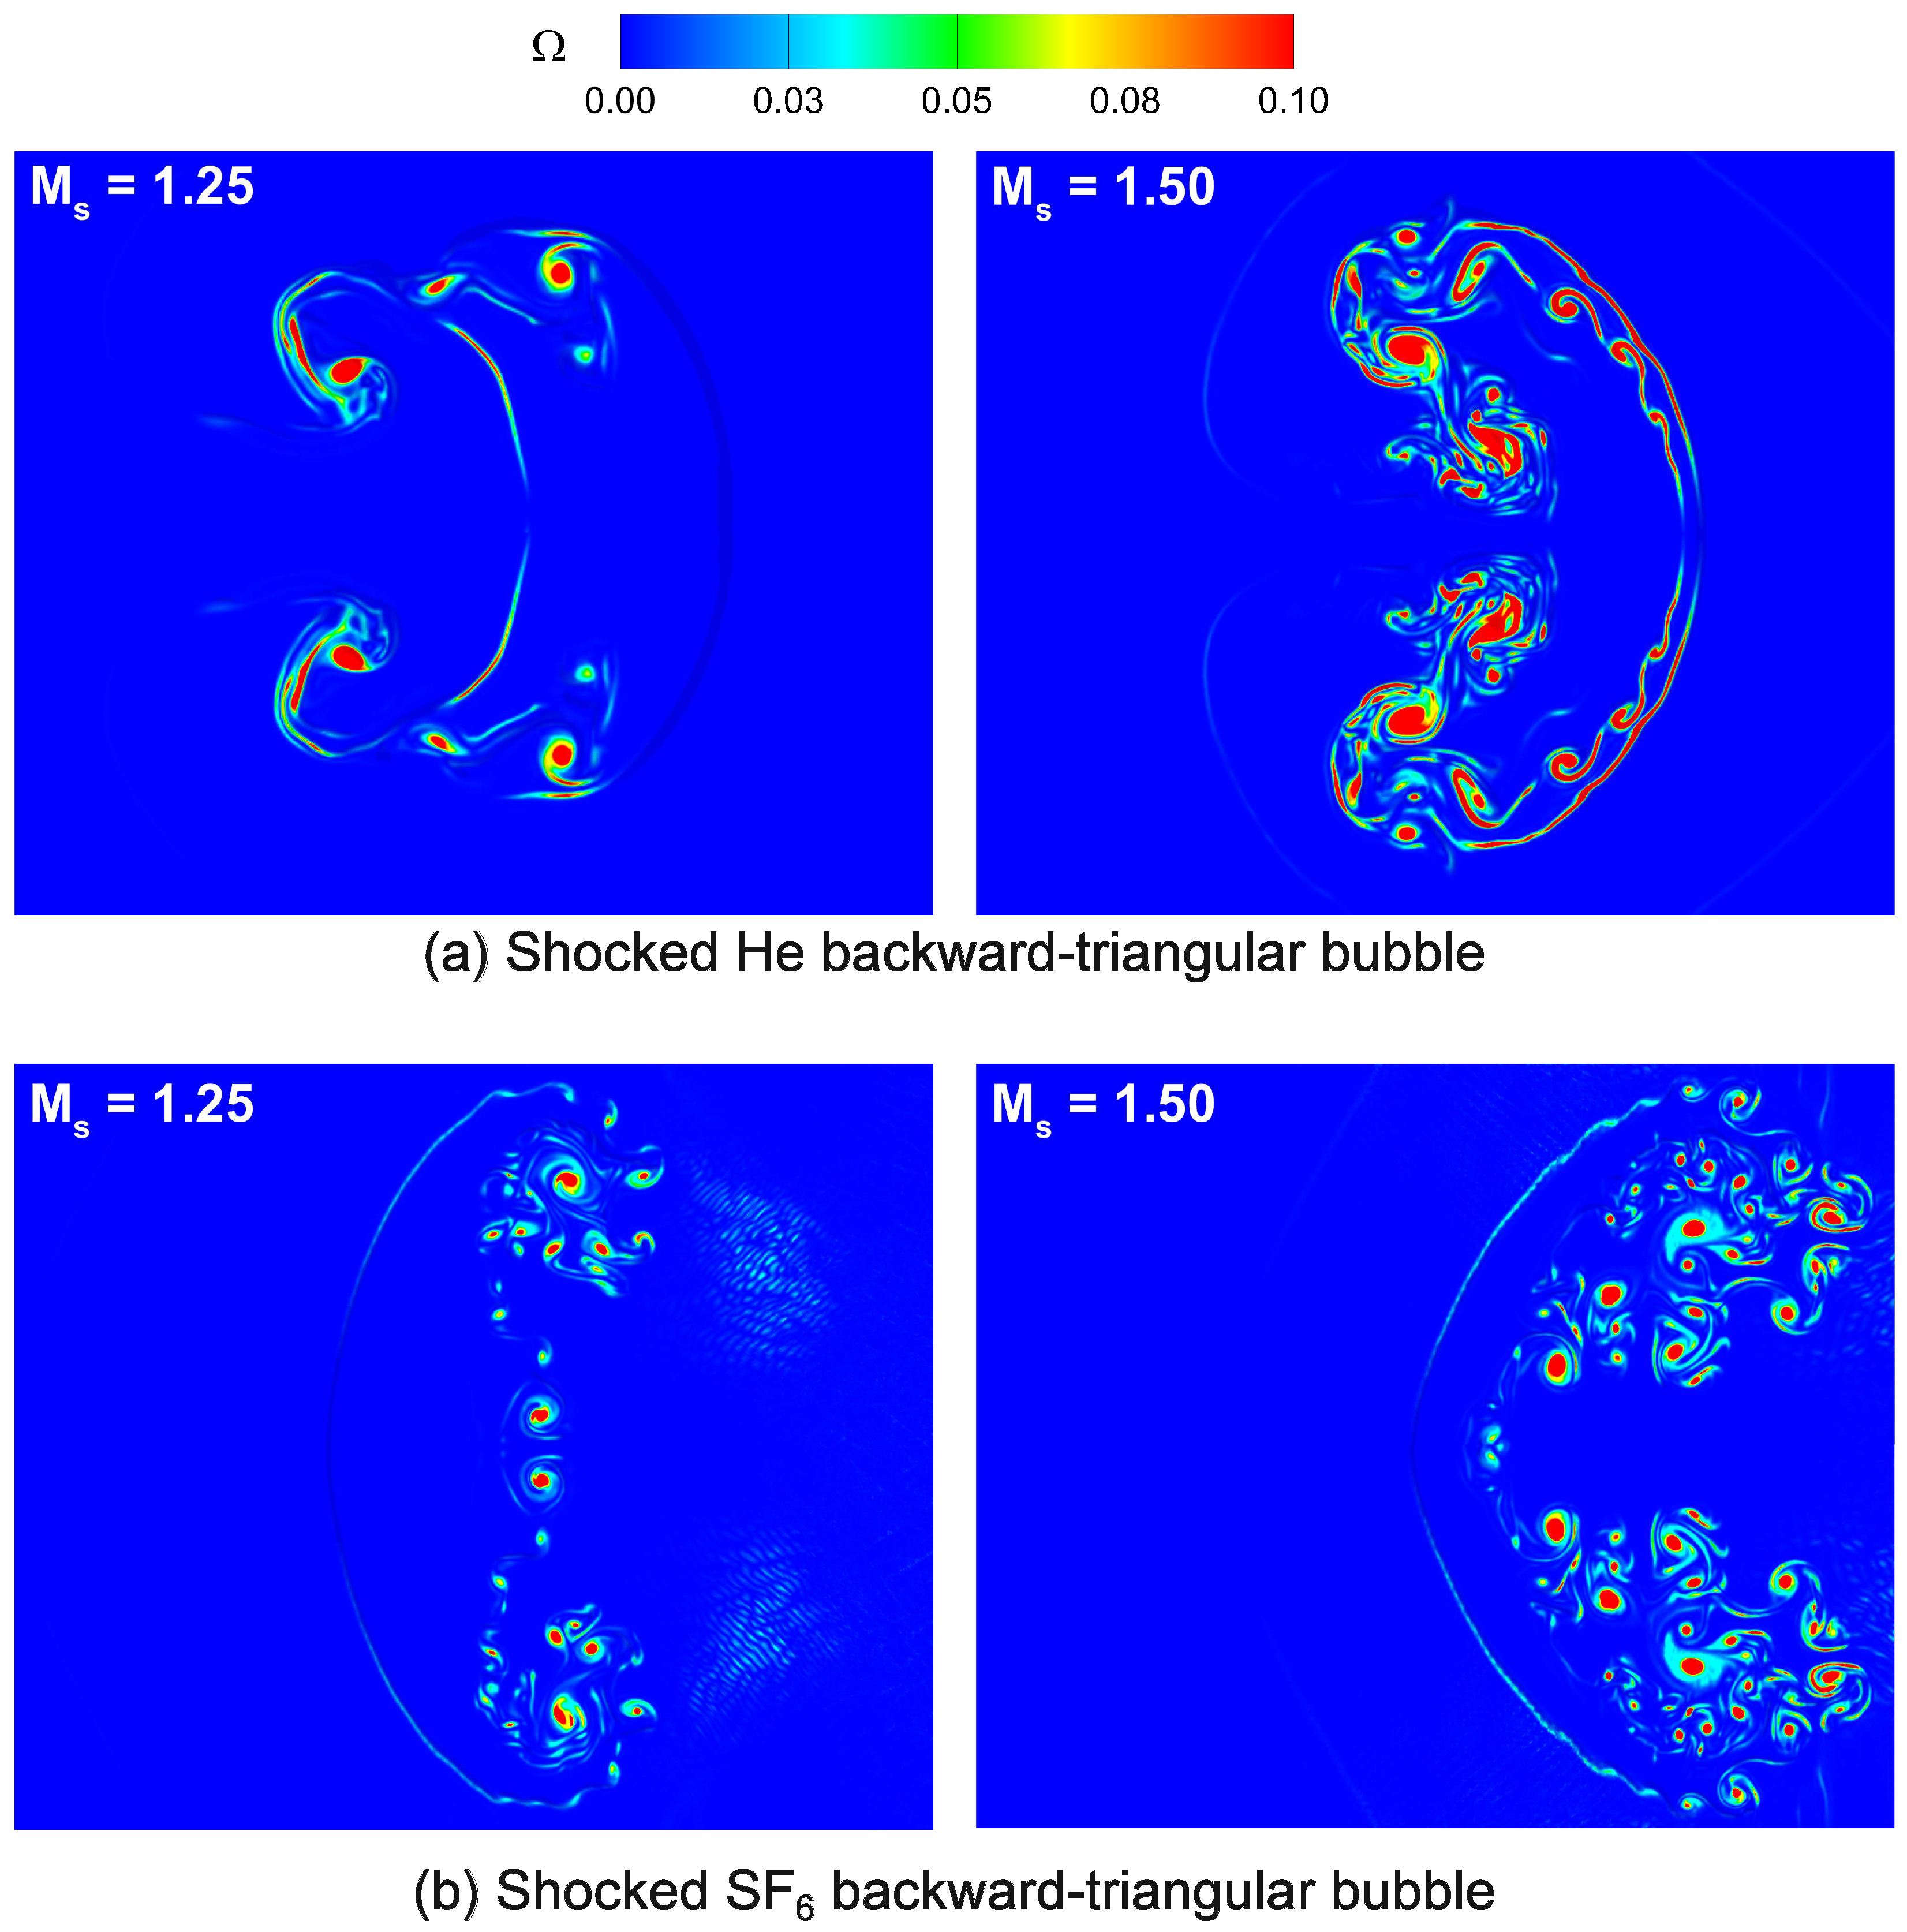
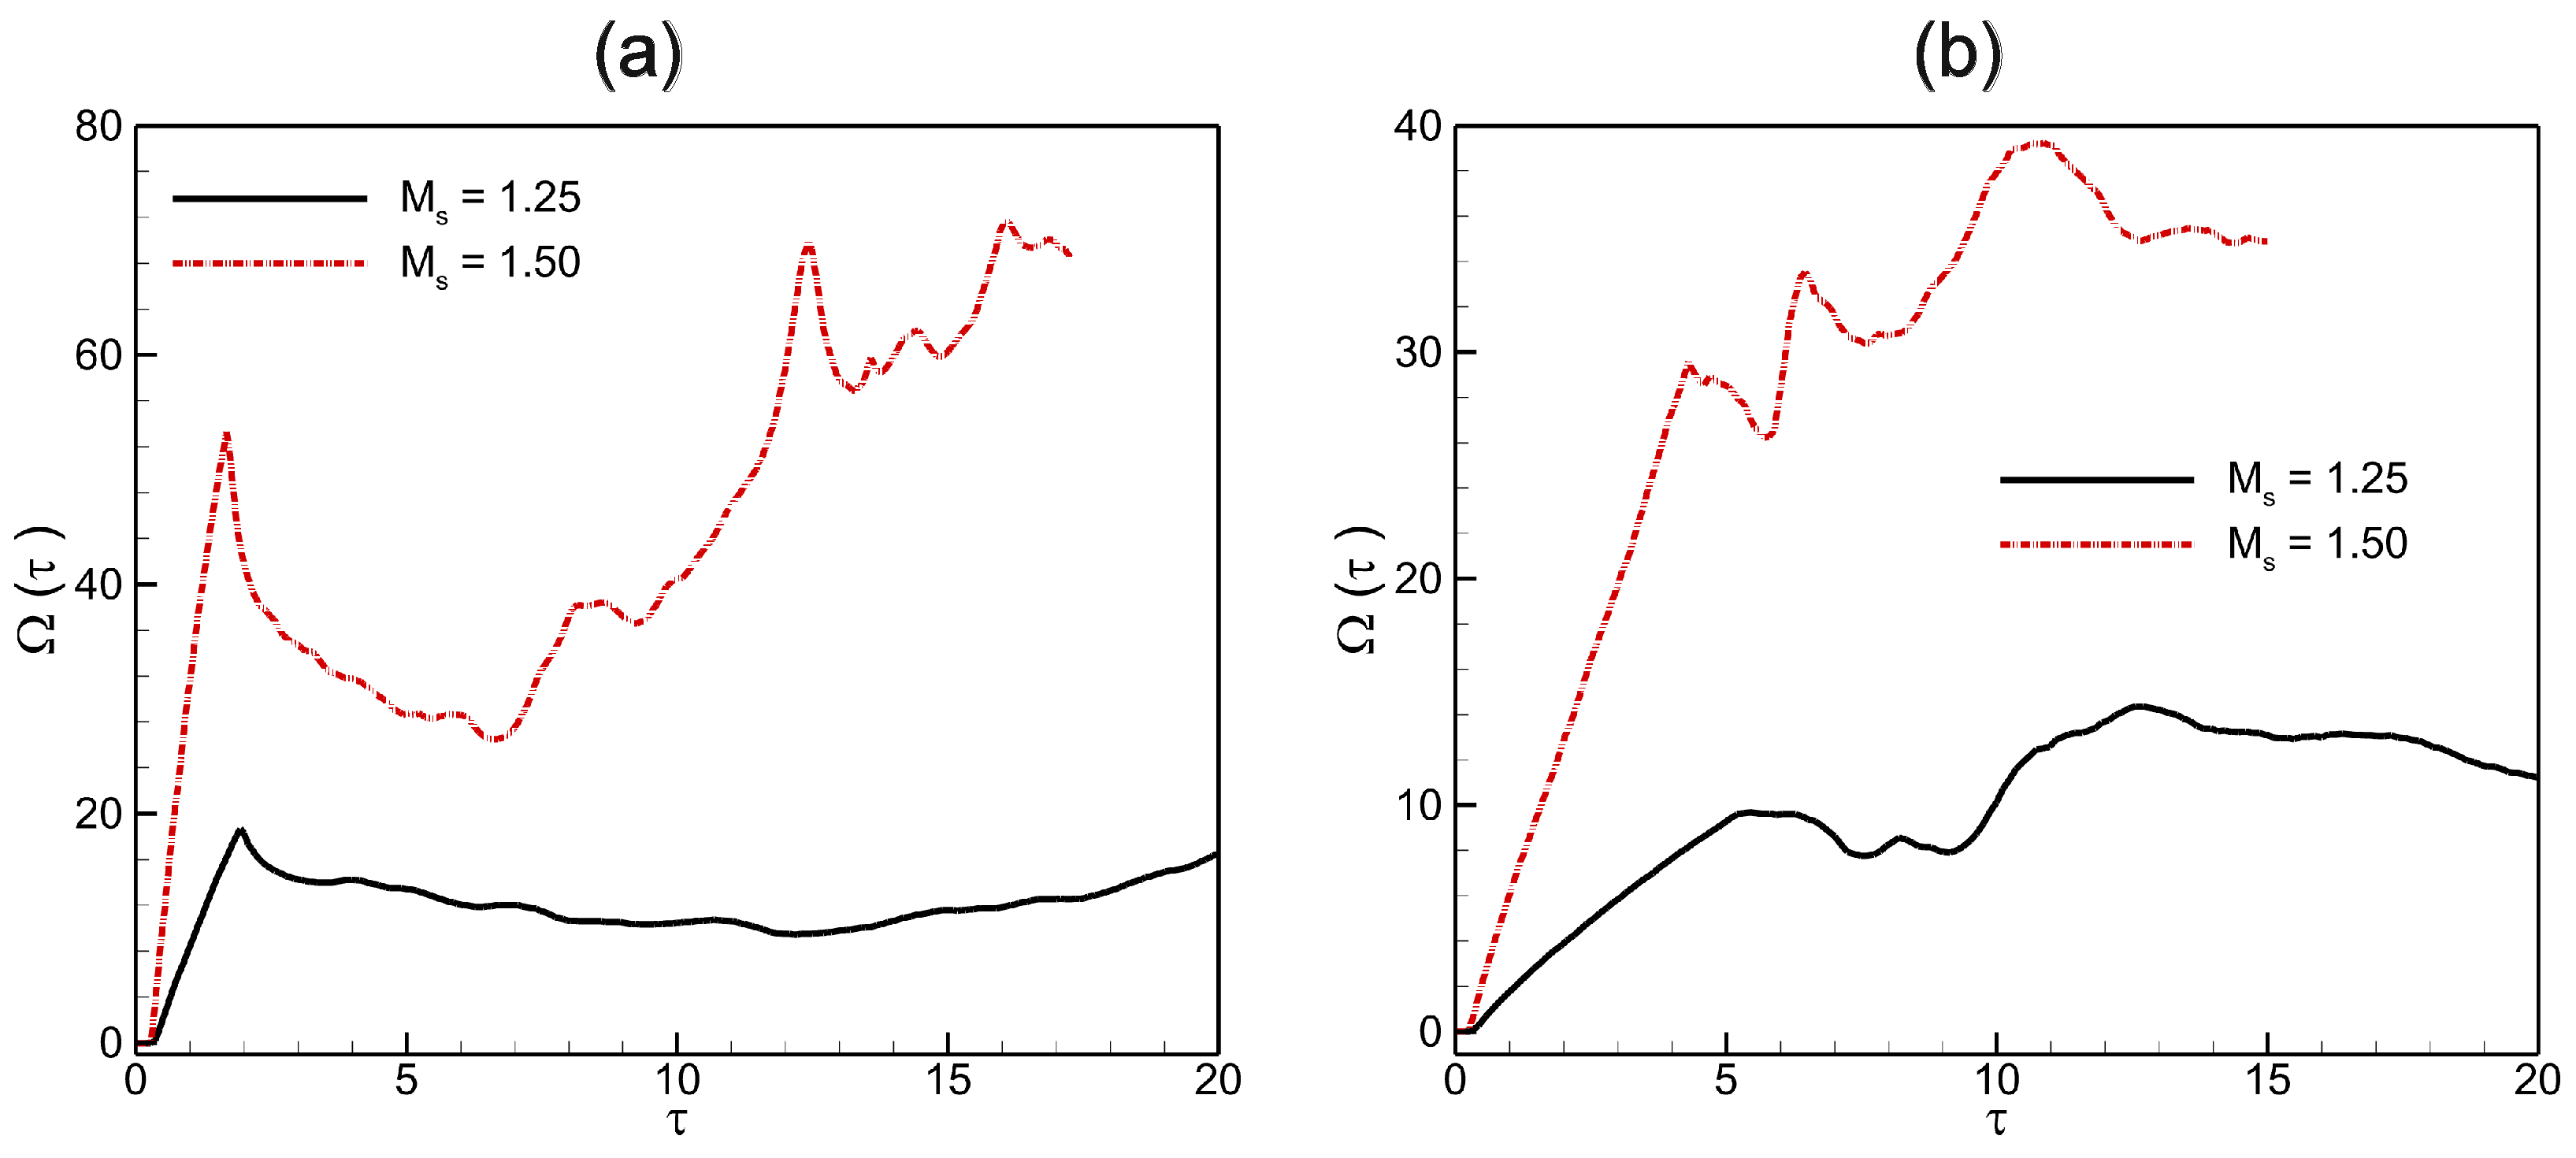
Understanding enstrophy generation in shocked interface flows is crucial for grasping turbulence and vorticity dynamics. Figure 11 shows the enstrophy contours in shocked He/ SF 6 backward-triangular bubbles at τ = 15 for two Mach numbers, M s = 1.25 and 1.50. Post-interaction, there are notable differences in enstrophy development for the backward-triangular bubbles at different Mach numbers. The rolled-up vortices (UVR and DVR) of the deformed bubble interface show a considerable degree of enstrophy. At higher Mach numbers, these quantities in the flow fields are considerably enhanced compared to lower Mach numbers. High enstrophy indicates regions with strong rotational motions, often linked to strong mixing mechanisms. To further explore the Mach number effect in shocked He/ SF 6 backward-triangular bubbles, Figure 12 illustrates the spatially integrated enstrophy fields over time. The enstrophy remains zero until the shock wave reaches the bubble’s upstream pole. Baroclinic vorticity production leads to an increase as the IS wave permits. Enstrophy increases upon impact of the IS and RS waves with the bubble contact. The increased vorticities thereby encourage gas mixing both inside and outside the bubble, speeding up the transfer and consumption of energy., which gradually weakens the enstrophy intensity in the bubble region. This phenomenon is observed at both Mach numbers, with the only difference being that stronger shock waves generate more enstrophy overall.

5.5. Interface Characteristics

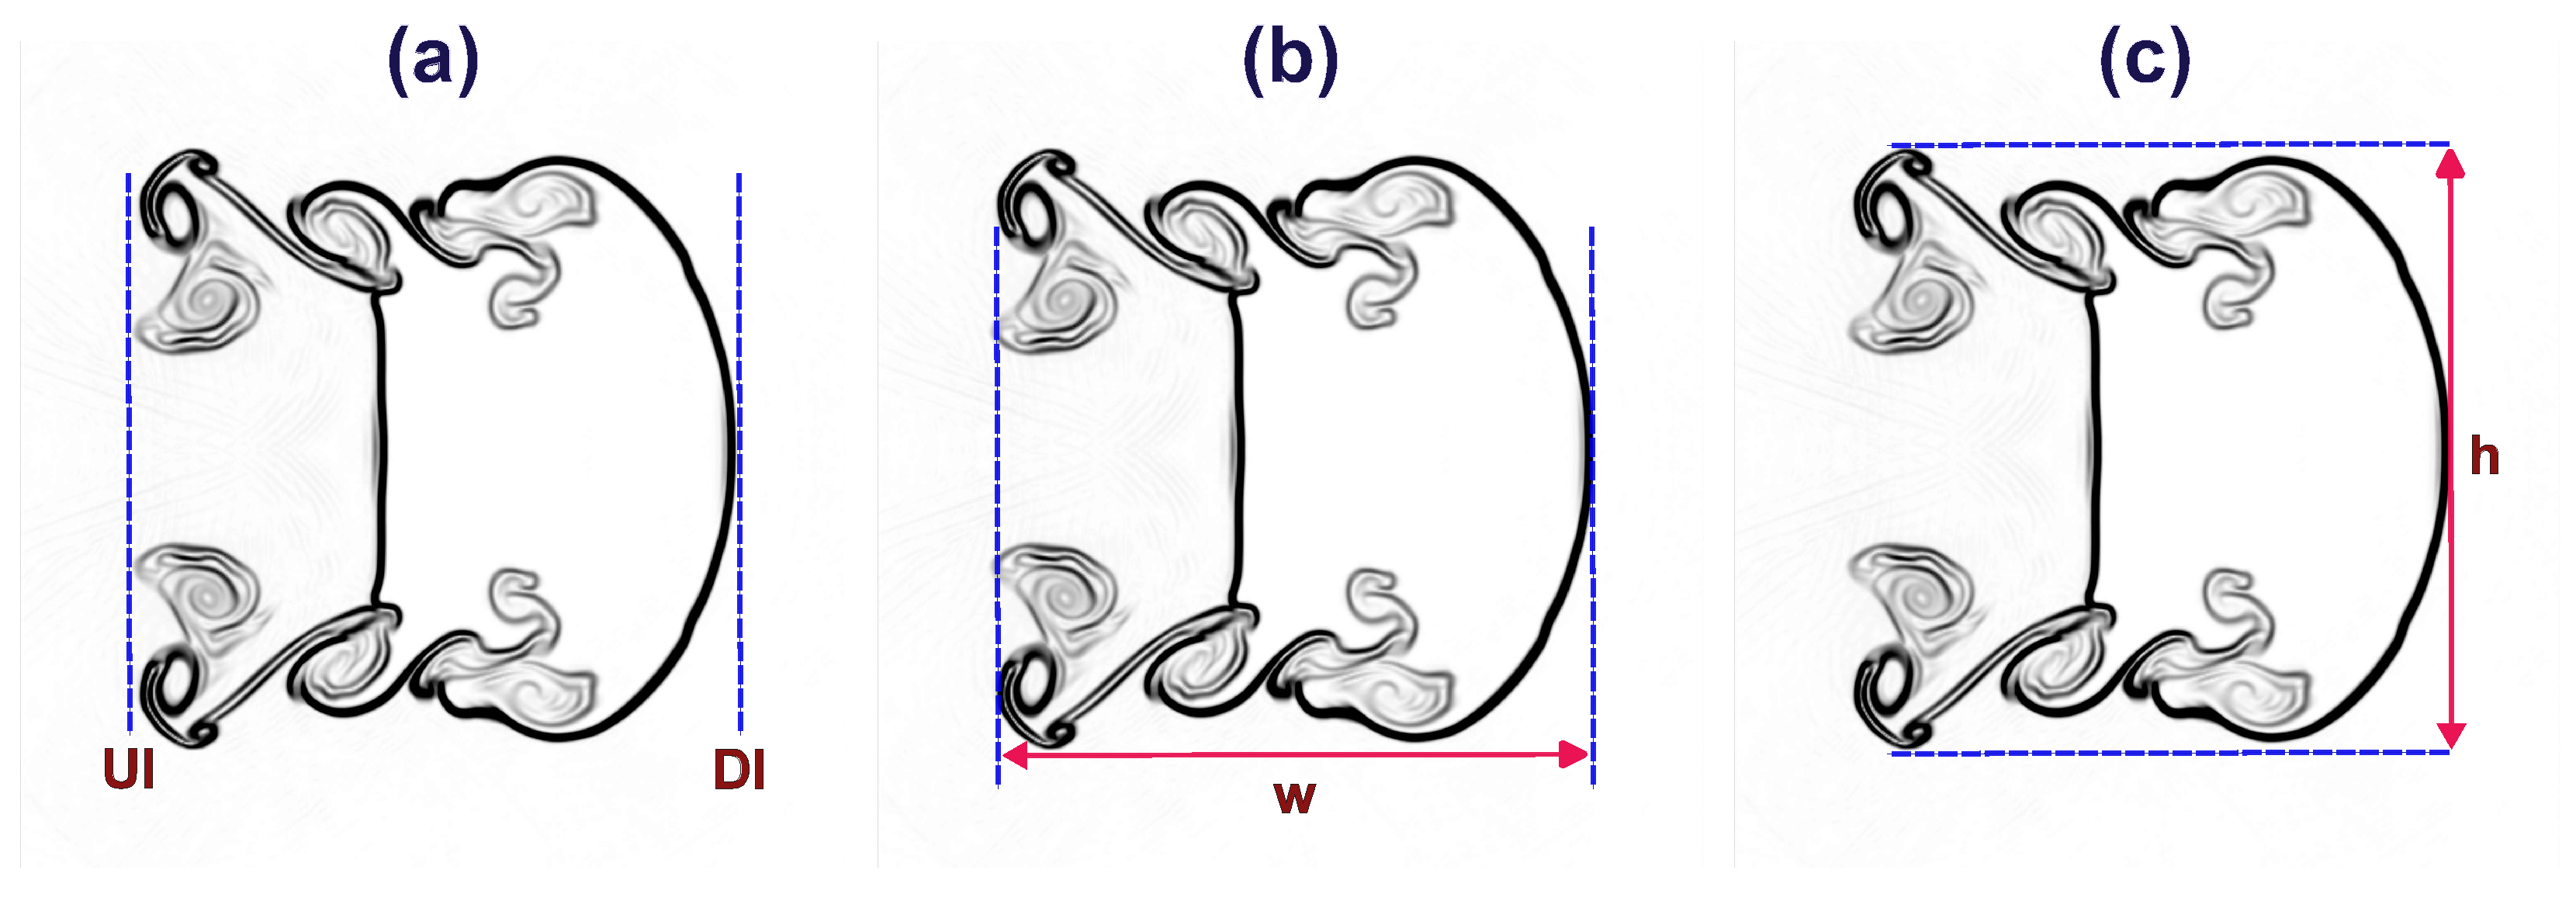
In this section, we perform a quantitative analysis of the interface characteristics of the shocked He/ SF 6 backward-triangular bubbles. In addition to the displacement of the upstream interface (UI) and downstream interface (DI), these interface characteristics also comprise the interface height ( h ) in the y-direction and the interface width ( w ) in the x-direction, as illustrated in Figure 13. Furthermore, the interface deformation history of the shocked He/ SF 6 backward-triangular bubbles at critical time instants is depicted in Figure 14. The bubble interface condenses in the wave’s direction as soon as it collides with the IS wave. The top and bottom margins approach the horizontal axis of symmetry more closely than the center portion does. The effect of the IS wave causes the upstream side to press inward earlier than the downstream interface, which moves quickly. Due to vorticity deposition, two tiny vortices finally form at the interface’s left corners. The impact of the IS wave on the interface varies with time as the corner vortex pair progressively expands. Then, as the upper and lower interfaces fold inward toward the flow axis in a similar manner, the bubble surface deforms into divergent and convergent shapes.
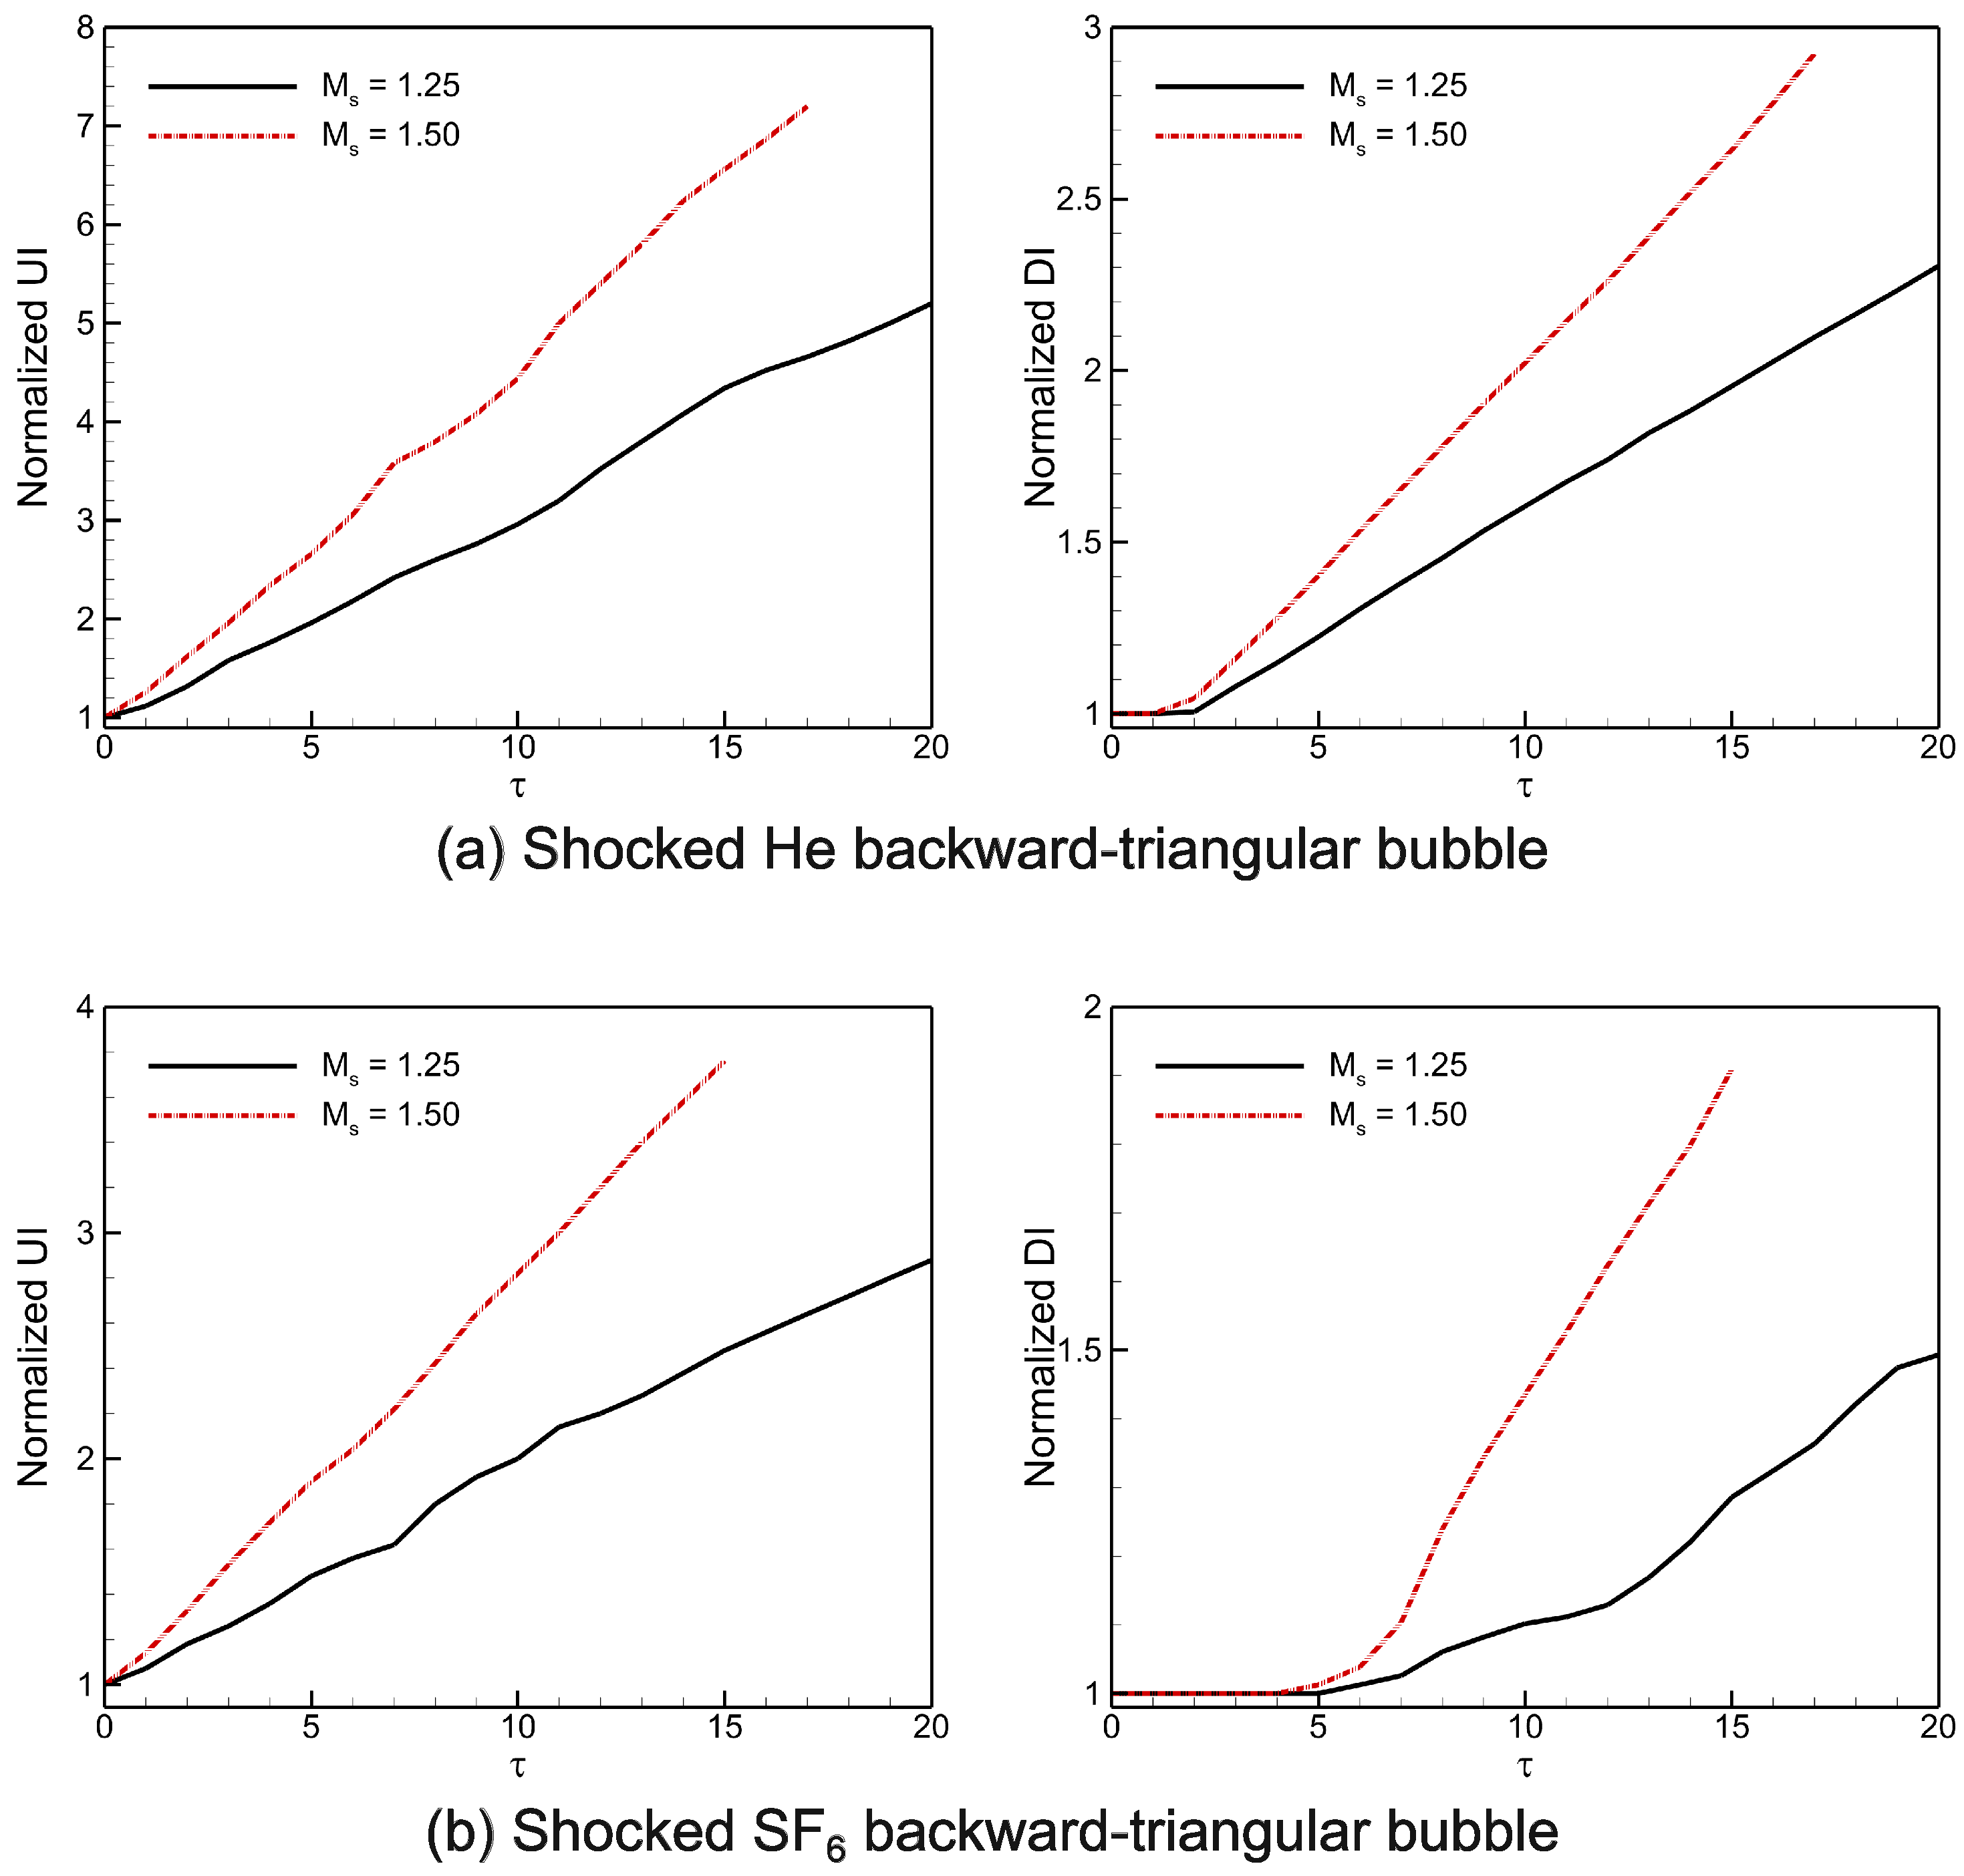
Figure 15 displays the temporal variations of the normalized UI and DI distances of the computed shocked He/ SF 6 backward-triangular bubbles subsequent to the IS wave’s impact. Normalized UI = UI / d UI and normalized DI = DI / d DI are the respective computations of these quantities, where the original distances of the UI and DI positions from the initial IS wave position are denoted by d UI and d DI , respectively. The outcomes demonstrate that for both shocked backward-triangular He/ SF 6 bubbles, the normalized UI acts similarly in the early phases. It then accelerates, which is most likely the result of rarefaction waves that are produced when the shock wave interacts with the downstream contact. Strong compression effects cause the normalized UI value of the He triangular bubble to exceed that of the SF 6 triangular bubble. Conversely, during the initial phase, the normalized DI value of triangular bubbles remains motionless until it encounters the secondary transmitted shock wave (TS2). Once the TS2 wave has cleared, normalized DI attains a certain velocity that triggers the acceleration of the vortex rings (UVR, DVR). The value of normalized DI enhances in the He bubble in comparison to the SF 6 bubble. Interestingly, in both cases, the fastest displacement of the normalized UI and DI occurs at the higher Mach number M s = 1.50 , whereas the slowest displacement is observed at the lower Mach number M s = 1.25 .
Figure 16 depicts the temporal variations of the normalized interface width and height for the computed shocked He/ SF 6 backward-triangular gas bubbles at different shock Mach numbers. These normalized amounts are described as normalized width = ( w w 0 ) / w 0 and normalized height = ( h h 0 ) / h 0 , with the subscript ‘0’ representing the initial interface value. When the evolving interface hits the bubble in the first interaction phase, the breadth of the evolving interface is greatly reduced by the IS wave compression. After that, the acceleration of vorticity-driven velocity causes the bubble diameter to rapidly rise as vortex ring pairs develop at the upstream interface. After the compression phase, the interface width remains nearly constant for a brief period. In the He triangular bubble, the interface width exhibits alternating growth patterns due to the formation and breakup of various vortex rings. Conversely, the SF 6 bubble shows a consistently increasing interface width because of continuously growing vortex rings. Interestingly, the interface height increases due to the vortex pair’s constant rotation until the interface is affected by reflected shock waves, which slows down the rate of height growth. The maximum interface height is observed in the He bubble, while the minimum height is seen in the SF 6 bubble.

6. Concluding Remarks

This study numerically investigated the flow physics of RMI development in shocked backward-triangular bubbles stuffed with He and SF 6 gases, and surrounded by N 2 gas at M s = 1.125 and 1.50. The RMI simulations were conducted using 2D physical conservation laws of compressible Euler equations for two-component gas flows. To solve these physical conservation laws, we developed an explicit high-order modal DG solver. The numerical solver was validated against existing experimental and computational data, showing good agreement.
The simulations revealed that understanding the RMI evolution of a shocked backward-triangular bubble critically depends on two key factors: bubble density and shock Mach number. Variations in bubble density and Mach number significantly affect flow morphology, leading to intricate wave patterns, jet formation, bubble deformation, and vorticity generation. Notably, changes in bubble density result in distinct deformations of the bubble interface. Moreover, SF 6 bubbles produce larger chains of rolled-up vortices compared to He bubbles. A thorough analysis of the impact of density and Mach number was conducted to shed light on the mechanisms driving vorticity formation during the interaction process. Vorticity is identified as a vital element in explaining the main characteristics of the backward-triangular bubble, increasing with higher bubble density and Mach number, and leading to a notable rise in enstrophy. Finally, these impacts on temporal variations in interface features are thoroughly explored.
The main goal of this study was to examine how the type of bubble (light or heavy) and the shock Mach number affect the RMI evolution in shocked backward-triangular bubbles. The interaction between a planar shock wave and polygonal bubbles undergoing reshock is crucial for understanding the evolution of RMI. Consequently, future studies are anticipated to expand on this research to explore the development of RMI in polygonal bubbles subjected to re-shock conditions.

Author Contributions

Conceptualization, S.S.; Software, S.S.; Validation, S.S.; Formal analysis, S.S.A. and S.S.; Investigation, S.S.A. and S.S.; Writing—original draft, S.S.A. and S.S.; Visualization, S.S.A. and S.S.; Funding acquisition, S.S.A. All authors have read and agreed to the published version of the manuscript.

Funding

This research is funded by the Deanship of Scientific Research at Jouf University through the Fast-track Research Funding Program.

Data Availability Statement

The data will be made available by the authors on request.

Conflicts of Interest

The authors declare no conflicts of interest.

References

  1. Richtmyer, R.D. Taylor instability in shock acceleration of compressible fluids. Commun. Pure. Appl. Math. 1960, 13, 297–319. [Google Scholar] [CrossRef]
  2. Meshkov, E.E. Instability of the interface of two gases accelerated by a shock wave. Fluid Dyn. 1969, 4, 101. [Google Scholar] [CrossRef]
  3. Brouillette, M. The Richtmyer-Meshkov instability. Annu. Rev. Fluid Mech. 2002, 34, 445. [Google Scholar] [CrossRef]
  4. Zhou, Y. Rayleigh–Taylor and Richtmyer–Meshkov instability induced flow, turbulence, and mixing-I. Phys. Rep. 2017, 720, 1–136. [Google Scholar]
  5. Zhou, Y. Rayleigh–Taylor and Richtmyer–Meshkov instability induced flow, turbulence, and mixing-II. Phys. Rep. 2017, 723, 1–160. [Google Scholar]
  6. Zhou, Y.; Williams, R.J.; Ramaprabhu, P.; Groom, M.; Thornber, B.; Hillier, A.; Mostert, W.; Rollin, B.; Balachandar, S.; Powell, P.D.; et al. Rayleigh–Taylor and Richtmyer-Meshkov instabilities: A journey through scales. Phys. D 2021, 423, 132838. [Google Scholar] [CrossRef]
  7. Arnett, W.D.; Bahcall, J.N.; Kirshner, R.P.; Woosley, S.E. Supernova 1987A. Ann. Rev. Astron. Astrophys. 1989, 2, 629–700. [Google Scholar] [CrossRef]
  8. Kuranz, C.C.; Park, H.S.; Huntington, C.M.; Miles, A.R.; Remington, B.A.; Plewa, T.; Trantham, M.R.; Robey, H.F.; Shvarts, D.; Shimony, A.; et al. How high energy fluxes may affect Rayleigh–Taylor instability growth in young supernova remnants. Nat. Commun. 2018, 9, 1564. [Google Scholar] [CrossRef] [PubMed]
  9. Lindl, J.D.; McCrory, R.L.; Campbell, E.M. Progress toward ignition and burn propagation in inertial confinement fusion. Phys. Today 1992, 45, 32–40. [Google Scholar] [CrossRef]
  10. Lindl, J.; Landen, O.; Edwards, J.; Moses, E.; Team, N. Review of the national ignition campaign 2009–2012. Phys. Plasmas 2014, 21, 020501. [Google Scholar] [CrossRef]
  11. Yang, J.; Kubota, T.; Zukoski, E.E. Applications of shock-induced mixing to supersonic combustion. AIAA J. 1993, 31, 854–862. [Google Scholar] [CrossRef]
  12. Yang, Q.; Chang, J.; Bao, W. Richtmyer-Meshkov instability induced mixing enhancement in the scramjet combustor with a central strut. Adv. Mech. Eng. 2014, 6, 614189. [Google Scholar] [CrossRef]
  13. Markstein, G.H. A shock-tube study of flame front-pressure wave interaction. Symp. (Int.) Combust. 1957, 6, 387. [Google Scholar] [CrossRef]
  14. Rudinger, G.; Somers, L.M. Behaviour of small regions of different gases carried in accelerated gas flows. J. Fluid Mech. 1960, 7, 161–176. [Google Scholar] [CrossRef]
  15. Haas, J.F.; Sturtevant, B. Interaction of weak shock waves with cylindrical and spherical gas inhomogeneities. J. Fluid Mech. 1987, 181, 41–76. [Google Scholar] [CrossRef]
  16. Ranjan, D.; Niederhaus, J.H.J.; Oakley, J.G.; Anderson, M.H.; Bonazza, R.; Greenough, J.A. Shock-bubble interactions: Features of divergent shock-refraction geometry observed in experiments and simulations. Phys. Fluids 2008, 20, 036101. [Google Scholar] [CrossRef]
  17. Jacobs, J.W. Shock-induced mixing of a light-gas cylinder. J. Fluid Mech. 1992, 234, 629. [Google Scholar] [CrossRef]
  18. Layes, G.; Jourdan, G.; Houas, L. Distortion of a spherical gaseous interface accelerated by a plane shock wave. Phys. Rev. Lett. 2003, 91, 174502. [Google Scholar] [CrossRef] [PubMed]
  19. Guillaume, L.; Georges, J.; Lazhar, H. Experimental investigation of the shock wave interaction with a spherical gas inhomogeneity. Phys. Fluids 2005, 17, 028103. [Google Scholar]
  20. Hosseini, S.H.R.; Takayama, K. Experimental study of Richtmyer-Meshkov instability induced by cylindrical shock waves. Phys. Fluids 2005, 17, 084101. [Google Scholar] [CrossRef]
  21. Ding, J.; Si, T.; Chen, M.; Zhai, Z.; Lu, X.; Luo, X. On the interaction of a planar shock with a three-dimensional light gas cylinder. J. Fluid Mech. 2017, 828, 289–317. [Google Scholar] [CrossRef]
  22. Quirk, J.J.; Karni, S. On the dynamics of a shock-bubble interaction. J. Fluid Mech. 1996, 318, 129–163. [Google Scholar] [CrossRef]
  23. Bagabir, A.; Drikakis, D. Mach number effects on shock-bubble interaction. Shock Waves 2001, 11, 209. [Google Scholar] [CrossRef]
  24. Shankar, S.K.; Kawai, S.; Lele, S.K. Two-dimensional viscous flow simulation of a shock accelerated heavy gas cylinder. Phys. Fluids 2011, 23, 024102. [Google Scholar] [CrossRef]
  25. Zhu, Y.; Gao, L.; Yang, Z. Sulfur hexafluoride bubble evolution in shock accelerated flow with a transverse density gradient. Phys. Fluids 2020, 32, 026101. [Google Scholar] [CrossRef]
  26. Singh, S.; Battiato, M.; Myong, R.S. Impact of the bulk viscosity on flow morphology of shock-bubble interaction in diatomic and polyatomic gases. Phys. Fluids 2021, 33, 066103. [Google Scholar] [CrossRef]
  27. Singh, S.; Msmali, A.H.; Nelson, M.I. Unfolding of shocked hydrodynamic instability at SF6 elliptical interface: Physical insights from numerical simulations. Comput. Fluids 2024, 277, 106304. [Google Scholar] [CrossRef]
  28. Picone, J.M.; Boris, J.P. Vorticity generation by shock propagation through bubbles in a gas. J. Fluid Mech. 1988, 189, 23–51. [Google Scholar] [CrossRef]
  29. Yang, J.; Kubota, T.; Zukoski, E.E. A model for characterization of a vortex pair formed by shock passage over a light-gas inhomogeneity. J. Fluid Mech. 1994, 258, 217–244. [Google Scholar] [CrossRef]
  30. Samtaney, R.; Zabusky, N.J. Circulation deposition on shock-accelerated planar and curved density-stratified interfaces: Models and scaling laws. J. Fluid Mech. 1994, 269, 45–78. [Google Scholar] [CrossRef]
  31. Niederhaus, J.H.J.; Greenough, J.A.; Oakley, J.G.; Ranjan, D.; Anderson, M.H.; Bonazza, R.A. A computational parameter study for the three-dimensional shock-bubble interaction. J. Fluid Mech. 2008, 594, 85. [Google Scholar] [CrossRef]
  32. Bates, K.R.; Nikiforakis, N.; Holder, D. Richtmyer-Meshkov instability induced by the interaction of a shock wave with a rectangular block of SF6. Phys. Fluids 2007, 19, 036101. [Google Scholar] [CrossRef]
  33. Zhai, Z.; Wang, M.; Si, T.; Luo, X. On the interaction of a planar shock with a light polygonal interface. J. Fluid Mech. 2014, 757, 800. [Google Scholar] [CrossRef]
  34. Luo, X.; Wang, M.; Si, T.; Zhai, Z. On the interaction of a planar shock with an SF6 polygon. J. Fluid Mech. 2015, 773, 366. [Google Scholar] [CrossRef]
  35. Igra, D.; Igra, O. Numerical investigation of the interaction between a planar shock wave with square and triangular bubbles containing different gases. Phys. Fluids 2018, 30, 056104. [Google Scholar] [CrossRef]
  36. Igra, D.; Igra, O. Shock wave interaction with a polygonal bubble containing two different gases, a numerical investigation. J. Fluid Mech. 2020, 88, A26. [Google Scholar] [CrossRef]
  37. Singh, S. Role of Atwood number on flow morphology of a planar shock-accelerated square bubble: A numerical study. Phys. Fluids 2020, 32, 126112. [Google Scholar] [CrossRef]
  38. Singh, S.; Battiato, M. Numerical investigation of shock Mach number effects on Richtmyer–Meshkov instability in a heavy square bubble. Phys. D Nonlinear Phenom. 2023, 453, 133844. [Google Scholar] [CrossRef]
  39. Singh, S.; Battiato, M. Numerical simulations of Richtmyer-Meshkov instability of SF6 square bubble in diatomic and polyatomic gases. Comput. Fluids 2022, 242, 105502. [Google Scholar] [CrossRef]
  40. Singh, S.; Torrilhon, M. On the shock-driven hydrodynamic instability in square and rectangular light gas bubbles: A comparative study from numerical simulations. Phys. Fluids 2023, 35, 012117. [Google Scholar] [CrossRef]
  41. Latini, M.; Schilling, O.; Don, W.S. Effects of WENO flux reconstruction order and spatial resolution on reshocked two-dimensional Richtmyer–Meshkov instability. J. Comput. Phys. 2007, 221, 805–836. [Google Scholar] [CrossRef]
  42. Movahed, P.; Johnsen, E. A solution-adaptive method for efficient compressible multifluid simulations, with application to the Richtmyer–Meshkov instability. J. Comput. Phys. 2013, 239, 166–186. [Google Scholar] [CrossRef]
  43. Pandare, A.K.; Waltz, J.; Li, W.; Luo, H.; Bakosi, J. On the design of stable, consistent, and conservative high-order methods for multi-material hydrodynamics. J. Comput. Phys. 2023, 490, 112313. [Google Scholar] [CrossRef]
  44. Maltsev, V.; Skote, M.; Tsoutsanis, P. High-order methods for diffuse-interface models in compressible multi-medium flows: A review. Phys. Fluids 2022, 34, 021301. [Google Scholar] [CrossRef]
  45. He, Z.; Liu, H.; Li, L. Generic five-equation model for compressible multi-material flows and its corresponding high-fidelity numerical algorithms. J. Comput. Phys. 2023, 487, 112154. [Google Scholar] [CrossRef]
  46. Singh, S.; Karchani, A.; Chourushi, T.; Myong, R.S. A three-dimensional modal discontinuous Galerkin method for the second-order Boltzmann-Curtiss-based constitutive model of rarefied and microscale gas flows. J. Comput. Phys. 2022, 457, 111052. [Google Scholar] [CrossRef]
  47. Cockburn, B.; Shu, C.-W. The Runge–Kutta discontinuous Galerkin method for conservation laws V: Multidimensional systems. J. Comput. Phys. 1998, 141, 199–224. [Google Scholar] [CrossRef]
  48. Liu, H.; Xu, K. A Runge–Kutta discontinuous Galerkin method for viscous flow equations. J. Comput. Phys. 2007, 224, 1223–1242. [Google Scholar] [CrossRef]
  49. Kontzialis, K.; Ekaterinaris, J.A. High order discontinuous Galerkin discretizations with a new limiting approach and positivity preservation for strong moving shocks. Comput. Fluids 2013, 71, 98–112. [Google Scholar] [CrossRef]
  50. Park, J.S.; You, H.; Kim, C. Higher-order multi-dimensional limiting process for DG and FR/CPR methods on tetrahedral meshes. Comput. Fluids 2017, 154, 322–334. [Google Scholar] [CrossRef]
  51. You, H.; Kim, C. High-order multi-dimensional limiting strategy with subcell resolution I. Two-dimensional mixed meshes. J. Comput. Phys. 2018, 375, 1005–1032. [Google Scholar] [CrossRef]
  52. Chan, J.; Lin, Y.; Warburton, T. Entropy stable modal discontinuous Galerkin schemes and wall boundary conditions for the compressible Navier-Stokes equations. J. Comput. Phys. 2022, 448, 110723. [Google Scholar] [CrossRef]
  53. Hesthaven, J.S.; Warburton, T. Nodal Discontinuous Galerkin Methods: Algorithms, Analysis, and Applications; Springer Science & Business Media: Berlin/Heidelberg, Germany, 2007. [Google Scholar]
  54. Hindenlang, F.; Gassner, G.J.; Altmann, C.; Beck, A.; Staudenmaier, M.; Munz, C. Explicit discontinuous Galerkin methods for unsteady problems. Comput. Fluids 2012, 61, 86–93. [Google Scholar] [CrossRef]
  55. Huerta, A.; Casoni, E.; Peraire, J. A simple shock-capturing technique for high-order discontinuous Galerkin methods. Int. J. Numer. Methods Fluids 2016, 69, 1614–1632. [Google Scholar] [CrossRef]
  56. Krank, B.; Fehn, N.; Wall, W.A.; Kronbichler, M. A high-order semi-explicit discontinuous Galerkin solver for 3D incompressible flow with application to DNS and LES of turbulent channel flow. J. Comput. Phys. 2017, 348, 634–659. [Google Scholar] [CrossRef]
  57. Ferrer, E.; Willden, R.H.J. A high order discontinuous Galerkin finite element solver for the incompressible Navier–Stokes equations. Comput. Fluids. 2011, 46, 224–230. [Google Scholar] [CrossRef]
  58. Kronbichler, M.; Wall, W.A. A performance comparison of continuous and discontinuous Galerkin methods with fast multigrid solvers. SIAM J. Sci. Comput. 2018, 40, A3423–A3448. [Google Scholar] [CrossRef]
  59. Karniadakis, G.E.; Sherwin, S. Spectral/hp Element Methods for Computational Fluid Dynamics; Oxford University Press: Oxford, UK, 2005. [Google Scholar]
  60. Johnsen, E.; Colonius, T. Implementation of WENO schemes in compressible multicomponent flow problems. J. Comput. Phys. 2006, 219, 715–732. [Google Scholar] [CrossRef]
  61. Ketcheson, D.I. Highly efficient strong stability-preserving Runge–Kutta methods with low-storage implementations. SIAM J. Sci. Comput. 2008, 30, 2113–2136. [Google Scholar] [CrossRef]
  62. Krivodonova, L. Limiters for high-order discontinuous Galerkin methods. J. Comput. Phys. 2007, 226, 879–896. [Google Scholar] [CrossRef]
Figure 1. Schematic representation of the problem organization.
Mathematics 12 02005 g001
Figure 2. Comparison of shadowgraph of the experimental (reproduced with permission from [15], Cambridge University Press, 1987), computational (reproduced with permission from [22], Cambridge University Press, 1996)”, and present numerical results for a shocked heavy cylindrical bubble.
Mathematics 12 02005 g002
Figure 3. Characteristic interface point (IS, UI, DI, TS, RS) comparison between the experimental (reproduced with permission from [15], Cambridge University Press, 1987), and present numerical results for a shocked cylindrical heavy bubble. The experimental and current numerical results are represented by the symbols and the lines, respectively.
Mathematics 12 02005 g003
Figure 4. Comparison of (a) numerical shadowgraphs, and (b) evolving interfacial characteristic scales (i.e., length and height), between the experiments (reproduced with permission from [33], Cambridge University Press, 2014) and the present results for a shocked forward-triangular light bubble at M s = 1.29 .
Mathematics 12 02005 g004
Figure 5. Numerical shadowgraphs of shocked backward-triangular He bubble at τ = 5 with three grid resolutions. Mesh I–III represent 400 × 200 , 800 × 400 , and 1200 × 600 grid points, respectively.
Mathematics 12 02005 g005
Figure 6. Time evolution of density contours (upper half) and numerical shadowgraph (lower half) for the shocked He backward-triangular bubble: (a) M s = 1.25 , and (b) M s = 1.50 .
Mathematics 12 02005 g006
Figure 7. Time evolution of density contours (upper half) and numerical shadowgraph (lower half) for the shocked SF 6 backward-triangular bubble: (a) M s = 1.25 , and (b) M s = 1.50 .
Mathematics 12 02005 g007
Figure 8. Abstract representation of vorticity generation in shocked backward-triangular bubble filled with (a) light and (b) heavy gases.
Mathematics 12 02005 g008
Figure 9. Vorticity generation mechanism in shocked (a) He; (b) SF 6 backward-triangular bubbles at Mach numbers M s = 1.25 and 1.50.
Mathematics 12 02005 g009
Figure 10. Spatial integrated fields of dilatational ( ω d i l ) and baroclinic ( ω b a r o ) production terms in the VTE of shocked (a) He; (b) SF 6 backward-triangular bubbles at two Mach numbers M s = 1.25 , 1.50.
Mathematics 12 02005 g010
Figure 11. Enstrophy contours in shocked (a) He; (b) SF 6 backward-triangular bubbles at τ = 15 with Mach numbers M s = 1.25 and 1.50.
Mathematics 12 02005 g011
Figure 12. Spatial integrated fields of enstrophy in shocked (a) He; (b) SF 6 backward-triangular bubbles at Mach numbers M s = 1.25 and 1.50.
Mathematics 12 02005 g012
Figure 13. Diagrammatic representation of the deformation parameters in the shocked backward-triangular bubble: (a) upstream and downstream interface (UI, DI) points, (b) interface width ( w ) , and (c) interface height ( h ) .
Mathematics 12 02005 g013
Figure 14. Interface deformation history in the shocked backward-triangular bubbles at critical moments: (a) He and (b) SF 6 gas bubbles.
Mathematics 12 02005 g014
Figure 15. Temporal variations of interface characteristics (normalized UI, normalized DI) in the shocked backward-triangular gas bubbles: (a) He, and (b) SF 6 gas bubbles.
Mathematics 12 02005 g015
Figure 16. Temporal variations of interface characteristics (normalized width, normalized height) in the shocked backward-triangular gas bubbles: (a) He, and (b) SF 6 gas bubbles.
Mathematics 12 02005 g016
Table 1. Material attributes of tested gas for the numerical simulations.
GasesDensityHeat RatioSound VelocityAtwood Number
( ρ ,   kg · m 3 ) ( γ ) ( c ,   m · s 1 ) ( A )
N 2 1.251.40352ambient
He0.161.661007−0.773
SF 6 6.031.091350.667
Disclaimer/Publisher’s Note: The statements, opinions and data contained in all publications are solely those of the individual author(s) and contributor(s) and not of MDPI and/or the editor(s). MDPI and/or the editor(s) disclaim responsibility for any injury to people or property resulting from any ideas, methods, instructions or products referred to in the content.